vtsrc.orgvtsrc.org/.../12/vt-dvr-customer-report-draft.docx · web view75 washington avenue,...
TRANSCRIPT

75 Washington Avenue, Suite 206Portland, Maine 04101Phone: 207.767.6440 Fax: 207.767.8158Email: [email protected]
Research Report
Vermont Division of Vocational Rehabilitation
Quality Assurance Survey
Survey Report
Prepared by:
Brian Robertson, Ph.D.Patrick Madden
April 2011

TABLE OF CONTENTS
Page
I. Survey Methodology..................................................................................................................1
II. Key Findings and Discussion..................................................................................................8
III. Summary Report..................................................................................................................36
Services Received by Clients ..........................................................................................37Measures of Overall Satisfaction....................................................................................42Evaluation of Specific Aspects of the Agency and the Services Provided..................70Problems and Areas for Improvement........................................................................136Current Employment Status.........................................................................................149Agency Specific Questions.............................................................................................159Respondent Characteristics..........................................................................................184
i

I. Survey Methodology
Introduction
Market Decisions conducted this project on behalf of the Vermont Division of Vocational Rehabilitation and the Vermont Division for the Blind and Visually Impaired. The Vocational Rehabilitation Agencies Quality Assurance Survey is designed to allow clients the opportunity to provide feedback about the agencies through which they are currently receiving services or had received services in the past.
The Survey Questionnaire
The survey instrument used during the course of this research was developed for use during the New England Vocational Rehabilitation Agencies Quality Assurance Survey that was conducted in 2003. The same survey instrument was used during the administration of the 2006 Quality Assurance Survey. The current survey instrument used the same set of core survey questions. Each of the agencies participating in this 2011 research study was also allowed to include a set of agency specific questions.
The main research methodology for data collection was the use of a telephone survey. However, given that it was not possible to reach a percentage of the target population by telephone, a mail version of the survey was also developed to supplement the telephone survey.
Sampling
The target population for this research consisted of clients from agency with case status codes between 12 and 28. The sample included active cases, cases closed successfully, and cases closed unsuccessfully. The sample included all cases that were active at any time during the year prior to the initiation of data collection. That is, cases active at any time from January 2010 through January 2011.
The goal of this research was to provide an accurate assessment of the views of clients that could be used to assess satisfaction with services at the agency level and to assess satisfaction at the service region level. The research was also designed to allow comparisons between participating agencies.
Based on these two conditions, the primary sampling units consisted of service region sampling units for each of the participating VR agencies. The sampling frame for the Vermont Division of Vocational Rehabilitation included seven sampling stratum defined by their seven service regions.
The sampling frame for this research was developed from a client list provided by the agency in electronic format. Once received, the sample was divided into seven separate strata files to facilitate sampling for the Vermont Division of Vocational Rehabilitation.
1

Based upon the past administrations of the survey, it was anticipated that approximately one-quarter to one-third of the telephone numbers included in the sampling frame would either be non-working numbers or would be telephone numbers at which the client could not be reached. In the first case, this included disconnected telephone numbers, non-working numbers, and those out of service. In the second, they represent wrong telephone numbers, business telephone numbers (at which the respondent did not work), and cases where the respondent could not be reached at this telephone number.
In cases where a number was incorrect or non-working and in cases where a telephone number was not provided, these sample records were identified and designated for inclusion in the mail survey.
In Vermont, approximately 16% of records were identified as non-working, incorrect or were cases where a telephone number was not provided in the sample record. These cases were sent a mail copy of the survey questionnaire.
A total of 2,100 sample records were included in the Vermont Division of Vocational Rehabilitation sample.
Data Collection
All telephone interviews were conducted in a central interviewing facility using our Computer Assisted Telephone Interviewing (CATI) software. All interviewers were supervised and monitored continuously. The telephone data collection phase was begun on February 14 and data collection was completed by March 14, 2011 (including all telephone interviews and returned mail surveys). A total of 730 clients of the Vermont Division of Vocational Rehabilitation were interviewed by telephone or returned completed mail surveys.
Survey Response Rates
Among clients of the Vermont Division of Vocational Rehabilitation, the survey response rate was 54%. The AAPOR (American Association for Public Opinion Research) Respondent Cooperation Rate was 84%, while the AAPOR Respondent Refusal Rate was 7%.
Vermont Division of Vocational Rehabilitation
Overall Response Rate 54%AAPOR Respondent Cooperation Rate 84%AAPOR Respondent Refusal Rate 7%
AAPOR Standard Formulas -AAPOR rates
AAPOR (the American Association for Public Opinion Research) has standardized formulas used by researchers for the calculation of response, cooperation, and refusal rates. The formulas allow other researchers to compare this research to other research projects, since the formulas used in the calculation of the rates are the same. The formulas clearly identify what is used in deriving the response rates based on rules that identify cases as eligible and ineligible. The
2

AAPOR rates provide a sense of how well the interviewing process works once a respondent is contacted.
Cooperation rates – This represents the proportion of all cases interviewed out of all eligible units ever contacted. That is, what percent of identified respondents ended up completing the interview. This includes cases where a respondent refused to do the survey, began but did not complete the survey, and cases where a respondent wished to complete the survey at another time but did not end up completing the survey, respondents who did not speak English, and respondents who were infirm.
Refusal rates – The refusal rates represent the proportion of all cases in which the respondent refuses to be interviewed, or breaks off an interview, out of all respondents that were contacted and spoken with.
Data Weighting
The data has been weighted to adjust for non-response and also to match client profiles based upon sex, age, service region, disability type, case status (open/closed), and race/ethnicity.
Sampling Error
The percentages reported for the Vermont DVR sample are within plus or minus 3.4% that would be found if all clients of the Vermont Division of Vocational Rehabilitation were interviewed. For example, if our survey showed that 50% of the respondents were satisfied with the services received, then the comparable figure for the population would be somewhere between 46.6% and 53.4% with a confidence level of 95%. A breakdown of the sampling error by service region is presented below, along with the number of surveys completed in each region.
Number of Surveys
Sampling Error(+ or -)
Vermont Division of Vocational Rehabilitation 730 3.4%Burlington/Middlebury 99 9.5%St. Albans/Newport 106 9.0%St. Johnsbury/White River Junction 117 8.5%Barre/Morrisville 102 9.2%Rutland/Bennington 99 9.5%Springfield/Brattleboro 102 9.3%Rural and Agricultural VR 105 7.4%
3

Presentation of Survey Results
This summary report allows you to compare results from your agency to results from the earlier 2003, 2006, and 2008 studies. This will allow you to determine if there are differences in the level of satisfaction among your clients over the period from 2003 to 2011. The report provides a comparison by year for the agency as a whole as well as by service region.
The summary report presents the data in several graphical forms along with a narrative description:
A bar chart with the results presented for VT DVR as a whole. In this chart, percentages for all response categories are provided. For example, very satisfied, satisfied, neither satisfied nor dissatisfied, dissatisfied, and very dissatisfied. The graph includes results from the 2011 study.
A table that presents the results for the seven service regions. This table provides data from the current 2011 study.
A line chart presenting survey results for VT DVR as a whole. This type of chart provides trend results from 2003 to 2011.
A table providing trending results for by year of administration for VT DVR as a whole (2003 to 2011) as well and trending for each of the seven regions for 2008 and 2011. The table will note cases where there are significant differences:
a) Comparing 2011 results from VT DVR and prior survey administrationsb) Comparing differences between the 2011 results for VT DVR as a whole
to each region, andc) Comparing differences between the 2008 and 2011 scores for each region.
Note that in the charts, the percentages referenced will always be the percent of valid responses. The tables do not include the percentage of respondents who indicated that the item was not applicable, that were unsure of their answer or that refused to answer the survey question.
Comparing the Percentage of Respondents Indicating Satisfaction Across Groups
The tables and charts provided in this report are designed to allow you to compare your results. There are three types of comparisons:
Comparisons of results year to year; trending results from 2003 – 2011. This will help you identify any changes in the results across the years the survey had been administered.
Comparison of your current 2011 results by region. This will help you identify whether there are differences between the 2011 results from each region and your overall agency score.
Comparison of your current 2011 results by region to their 2008 results. This will help you identify changes within each region since 2008.
A table is provided that compares the results of your agency as a whole as well as the results for each region. The results are presented for all survey administrations.
4

Comparing Regional Results and Results Year to Year
To allow comparisons, a table is included that provides a summary of the results for each survey administration. This table is designed to simplify comparing year to year results and to also compare the results from each of your service regions to the overall agency score for 2011. Four columns provide the results for 2003 to 2011 for VT DVR (under year of administration) as whole and the 2008 and 2011 results by service region (under the heading region). The results are the percent positive responses to the question, which for most is the percentage of respondents indicating they are very satisfied or satisfied. The table includes two additional columns labeled Sig Diff (2011) and Sig Diff (Trend). It is in these columns you will find the results of analysis comparing regional results and year to year results. These comparisons are based on comparing the 95% confidence intervals associated with each measure.
The table summarizes all comparisons, noting any significant differences in the last two columns. The first of these columns, “Sig Diff (2011)”, summarizes significant differences between each of your service regions and your agency’s overall score for the question. This compares the results of the 2011 study. The column will either be blank or contain a plus sign “+” or a minus sign “-” for each of your service regions:
A plus (+) indicates that the 2011 result for the specific region is statistically higher (at 95% confidence) than the overall VT DVR score in 2011.
A minus (-) indicates that the 2011 result for the specific region is statistically lower (at 95% confidence) than the overall VT DVR score in 2011.
Blank cells indicate no statistically significant difference.
The second of these columns, “Sig Diff (Trend)”, summarizes significant differences year to year. This provides a comparison of your agency for the years 2003 to 2011. The column will either be blank, contain a plus sign “+” a minus sign “-” or a “U” or “D” followed by a year:
The “U” indicates that the survey results are trending upward, that is, your 2011 score is higher than similar results over a course of several years. The phrase “U2003” indicates that the results to the specific measure have been trending upward since 2003.
The “D” indicates that the survey results are trending downward, that is, your 2011 score is higher than similar results over a course of several years. The phrase “D2003” indicates that the results to the specific measure have been trending downward since 2003.
A plus (+) indicates that the 2011 result is statistically higher (at 95% confidence) than similar results from 2008.
A minus (-) indicates that the 2011 result is statistically lower (at 95% confidence) than similar results in 2008.
Blank cells indicate no statistically significant difference.
5

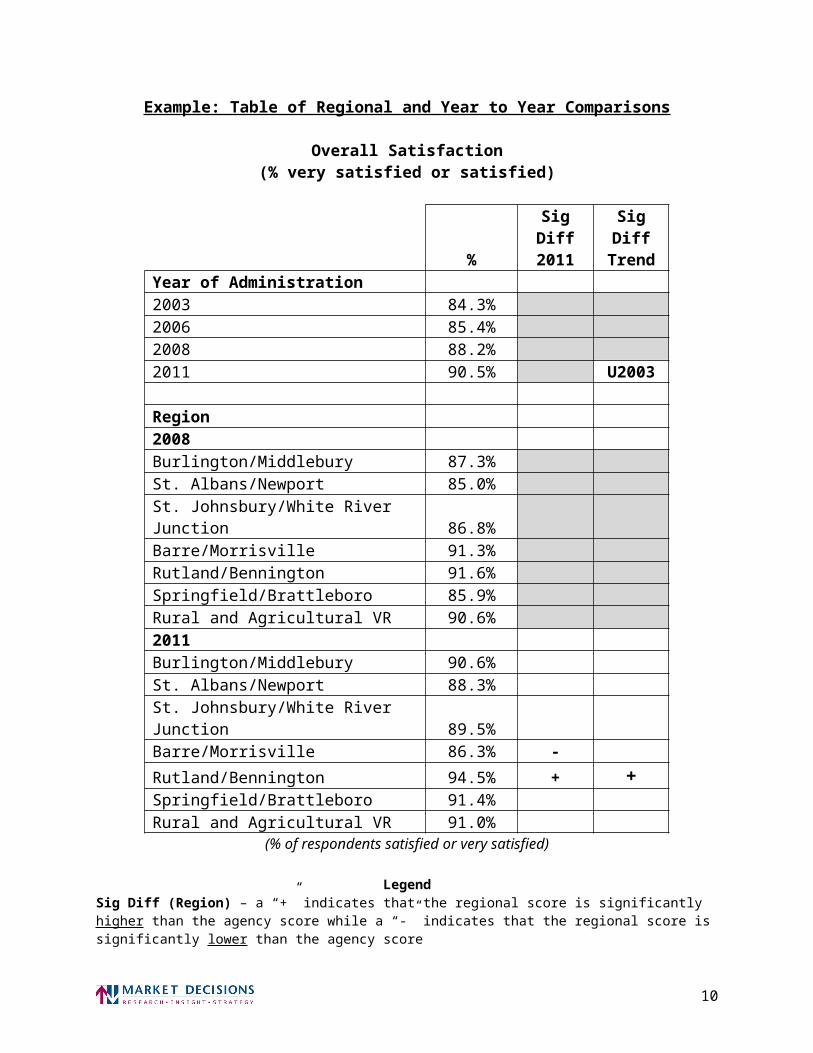
Example: Table of Regional and Year to Year Comparisons
Overall Satisfaction(% very satisfied or satisfied)
%Sig Diff
2011Sig Diff Trend
Year of Administration 2003 84.3% 2006 85.4% 2008 88.2% 2011 90.5% U2003 Region 2008 Burlington/Middlebury 87.3% St. Albans/Newport 85.0% St. Johnsbury/White River Junction 86.8% Barre/Morrisville 91.3% Rutland/Bennington 91.6% Springfield/Brattleboro 85.9% Rural and Agricultural VR 90.6% 2011 Burlington/Middlebury 90.6% St. Albans/Newport 88.3% St. Johnsbury/White River Junction 89.5% Barre/Morrisville 86.3% - Rutland/Bennington 94.5% + +Springfield/Brattleboro 91.4% Rural and Agricultural VR 91.0%
(% of respondents satisfied or very satisfied)
LegendSig Diff (Region) – a “+” indicates that the regional score is significantly higher than the agency score while a “-” indicates that the regional score is significantly lower than the agency score
Sig Diff (Trend) – a “+” indicates that the 2011 score is significantly higher than the 2008 score while a “-” indicates that the 2008 score is significantly lower than the 2008 score. The “U” followed by a year indicates that the year to year results are trending upward from that year while the letter “D” followed by a year indicates that the year to year results are trending downward from that year.
Note: The table is for illustrative purposes only and the differences may or may not actually be significant.
6

In the column labeled “Sig Diff (2011)” you can see a minus sign “-” across from the Barre/Morrisville region results (under their 2011 results) and a plus sign “+” across from the Rutland/Bennington region. This indicates that:
The score for the Barre/Morrisville region is significantly lower than the overall score for VT DVR in 2011.
The score the Rutland/Bennington region is significantly higher than the overall score for VT DVR in 2011.
In the column labeled “Sig Diff (TREND)” you can see the “U2003” across from score for 2011 listed under year of administration as well as a “+” across from the Rutland/Bennington region (2011 results). This indicates that:
The score for VT DVR is trending upward SINCE 2003. The 2011 score the Rutland/Bennington region is significantly higher than other region’s
scores in 2008.
7

II. Key Findings and Discussion
Services Received by Clients
The most common services received are help in finding a job, financial assistance, vocational or employment counseling, and counseling.
The largest percentage indicated that financial assistance and help in finding a job were the most helpful services they received.
Measures of Overall Satisfaction
In 2011, 91% were very satisfied or satisfied with the Vermont Division of Vocational Rehabilitation’s program.
In 2011, 87% of clients indicated that they were satisfied with the services they received.
In 2011, 84% of clients indicated that the services provided met their expectations.
In 2011, 82% of clients indicated that the services provided through the Vermont Division of Vocational Rehabilitation compared favorably to the services offered through their ideal program.
Among all clients, the consumer satisfaction index was 77.0 in 2011.
In 2011, 95% percent of clients would tell their friends with similar disabilities to go to the Vermont Division of Vocational Rehabilitation for help.
Evaluation of Specific Aspects of the Agency and the Services Provided
8
In 2011, 91% of clients were very satisfied or satisfied with their control and involvement in the vocational rehabilitation experience.
In 2011, 90% of clients were very satisfied or satisfied with their choice of a vocational goal.
In 2011, 88% of clients were very satisfied or satisfied with the choice of services available.
In 2011, 90% of clients were very satisfied or satisfied with the choice of service providers.
In 2011, 90% of clients were very satisfied or satisfied with the information they were given about the choices they had.
In 2011, 88% of clients were very satisfied or satisfied with the time it took counselors to answer their questions or address their concerns.
In 2011, 93%, of clients found completing the application for vocational rehabilitation services very or somewhat easy.
In 2011, 92% of clients indicated that the staff were very or somewhat helpful in helping them to achieve their vocational rehabilitation goals.
In 2011, 89% of clients indicated that it was very or somewhat easy to contact their vocational rehabilitation counselor.
In 2006, nearly all clients (99%) found the agency office very or somewhat accessible to someone with their type of disability.
In 2011, 72% of clients indicated that the services they received helped them become more financially independent.
In 2011, 97% of clients indicated that the Vermont Division of Vocational Rehabilitation staff treated them with dignity and respect.
In 2011, 72% of clients indicated that the agency helped them reach their job goals.
9

Problems and Areas for Improvement
In 2011, 15% of clients indicated they had experienced problems with the agency or the services provided by the Vermont Division of Vocational Rehabilitation.
Among those experiencing problems, 29% indicated that the agency worked to resolve the problem.
In 2011, approximately four in ten clients offered suggestions for service improvement.
Current Employment Status
Forty-nine percent of clients were working full or part time.
Among those clients who were working, 82% were very satisfied or satisfied with their job in 2011.
The types of careers sought by clients were varied.
Agency Specific Question
In 2011, 71% of clients indicated that they were informed that they could address problems with the Client Assistance Project.
In 2011, 77% of clients were able to receive needed services even when their counselor was not available.
In 2011, 75% of clients were satisfied with job placement services.
In 2011, 98% of clients felt welcome when coming to vocational rehabilitation for services.
10
In 2011, 34% of clients were able to access benefits counseling through vocational rehabilitation, while 18% of clients were not able to access benefits counseling.
Among those accessing benefits counseling services, 97% found these services valuable.
In 2011, 94% of clients indicated it was easy to access vocational rehabilitation services.
In 2011, 89% of clients indicated vocational rehabilitation services coordinated job placement services with the VABIR representative well.
In 2011, 83% of clients feel they are receiving the support needed to be successful in the long term.
In 2011, 33% of clients indicated that someone other than vocational rehabilitation helped them find a job.
Nearly all clients (95%) would refer a friend or relative to vocational rehabilitation.
11

DiscussionAs we have found in our prior studies, the 2011 study reaffirms that the clients of the Vermont Division of Vocational Rehabilitation are satisfied with the services they are provided and the large majority has not experienced any problems or difficulties. The Division continues to be an important resource to its clients. The Division is viewed by the large majority of clients as providing the necessary assistance to help them achieve their goals
Based upon the views and attitudes of the large majority of clients, the survey results did not identify any major systemic problems with the Vermont Division of Vocational Rehabilitation or the services it provides. This was observed in our prior studies from 2003 to 2008. The Division is providing the services needed by the vast majority of its clients in a manner that is effective, appropriate and that clients appreciate.
As was stressed in prior studies, the results suggest there is no need for dramatic changes in what the agency is currently doing to meet the needs of its clients. The Vermont Division of Vocational Rehabilitation should continue to provide the high level of service that is reflected in the responses of the vast majority of respondents. As with any quality assurance process, the survey results identify areas where the Division is showing improvement, but it also identifies some minor areas of concern which may represent areas of focus for quality improvement.
The 2011 results show that on many measures there has been an increase in the level of satisfaction among its clients, while there has been a decline in a few measures. Across the entire Division, scores have increased on 7 of the 22 measures, and 4 of those measures have seen an upward trend since 2003. Scores have decreased on 4 of 22 measures, though the declines are slight. There was a slight increase in the percentage of clients reporting they experienced problems and a decline in the percentage that reported that VT DVR worked to resolve their problems.
Regionally, all seven VT DVR regions reported high levels of satisfaction in 2011. Three regions show an increase in a majority of the measures (12 or more of the 22):
Rutland/ Bennington Springfield/ Brattleboro Rural and Agricultural VR
Regions with the largest number of measures showing a decline in satisfaction are:
Barre/ Morrisville (19 of 22 measures show a decline) St. Johnsbury/ White River Junction (12 of 22 measures show a decline) St. Albans/ Newport (10 of 22 measures show a decline)
No region in particular lagged dramatically behind the others or the state as a whole in overall satisfaction, an indication that the Division provides a consistent level of service across the state.
12

Some regions did have specific satisfaction measures that lagged the Division as a whole:
Burlington/Middlebury Region
Satisfaction with the choice of services that were available Helping client reach job goals
St. Johnsbury/White River Junction Region
Satisfaction with how long it took your counselor to answer your questions or address your concerns
Helping client reach job goals
Rutland/Bennington Region
Ease of completing an application for vocational rehabilitation services Ease of contacting vocational rehabilitation counselor
While it is important to point out and understand differences between regions and to monitor them over time, none of these regional differences are statistically significant and the overall level of client satisfaction in these regions is comparable to that observed among clients in other regions.
Conclusions and Areas of Focus
As noted, there is, in general, a high level of satisfaction among the clients of the Division. In addition, the overall level of satisfaction as has been increasing since 2003.
The results suggest that many of the same issues brought up by clients during the prior studies in 2003 and 2006 are still present from the client perspective. This does not imply that client satisfaction has declined or that these issues have become more problematic, rather they represent the areas of concern that were also most frequently mentioned in 2006. The results do identify areas where the Division can focus efforts to improve an already high level of satisfaction.
First, some of the key positive highlights:
The level of overall satisfaction among all clients did show a statistically significant increase.
This increase in overall satisfaction has trended upward since 2003.
Satisfaction with the Vermont Division of Vocational Rehabilitation is high in all regions, meaning that the Division provides consistent service across the entire state.
13

In 4 regions, more than 90% of clients were satisfied overall; Burlington/Middlebury, Rutland/Bennington, Springfield/Brattleboro, and Rural and Agricultural VR. In the other regions overall satisfaction was slightly less than 90%.
Communication between clients and the Division has improved as reflected in increases in satisfaction with how long it took your counselor to answer questions, concerns and satisfaction with the kind and amount of information about the choices you had.
Clients are also seeing the benefits of the services provided as evidenced by an increase in the percentage of clients indicating the services helped me become more financially independent.
While clients raised a number of concerns or issues, for the most part they were minor issues that had to do with communications issues, the need for additional help finding employment, and getting more support in general.
The results do suggest that there are some areas on which the Division can focus to improve client satisfaction:
The percentage of clients reporting problems which had been steadily declining since 2003 but saw a slight increase from 2008 to 2001. Further, among those indicating they experienced problems, the percentage reporting the Division did work to resolve the problem has also decreased since 2008.
The results suggest that some clients experience difficulties in getting employment and there has also been a decline in the general level of satisfaction among employed clients with their job. However, this may simply be a reflection of the current state of the economy rather than factors unique to the Division.
While the large majority of clients were satisfied with the Division, there are some specific concerns mentioned by clients. None of these were mentioned by a majority of clients, though they represent the specific targets that the Division can focus on to improve client satisfaction.
In general terms, they concern issues of communication (the ability to reach counselors and other Division staff), employment issues (the ability to find a job), concerns with the effectiveness of the Division in providing services and meeting expectations, issues with staff (switching counselors, getting help, understanding), and issues of support (the need for more guidance or the perception that services are of little value). In general, these are the same types of issues and concerns raised by clients in prior years. Specifically, some clients mentioned:
Difficulties in obtaining employment or that they could not find a job, the need for more job search help and more job options.
They needed more support or guidance from the Division and their counselor.
14
That they felt, in some instances, services provided were of little help or that they actually did not receive services.
Needing assistance in filling out applications and paperwork.
Difficulties in getting in touch with their counselor or other staff (did not return calls, were not available, delays in communicating with clients, always reached voicemail).
Financial independence and the client achieving their job goals represent the factors about which clients are the least satisfied.
These two measures had the lowest percentages of clients that responded in a positive manner (agreeing that the services they received had helped them become more financially independent or achieve their job goals). While a majority did evaluate the agency positively on this aspect, only 72% felt the services received from The Vermont Division of Vocational Rehabilitation helped them become more financially independent. When asked why they felt that the services did not help them become more financially independent, the main reasons cited by clients were:
They did not find employment No services were provided or were of little help They did not get needed testing or assessments
One of the goals of the agency is to help clients become more financially independent, and in a majority of cases clients do feel the agency is helping. In addition, the percentage responding positively has been increasing since 2006.
Job Goals
Along with the assessment of the impact of services on financial independence, this measure tended to have one of the lowest percentages of clients that responded in a positive manner (agreeing the agency helped them reach their job goals). While a majority did evaluate the agency positively on this aspect, only 72% felt the services received from The Vermont Division of Vocational Rehabilitation helped them reach their job goals; a slight decline from 2008. When asked why they felt that the service did not help them achieve their job goals, the majority simply indicate they have not been able to find employment.
15

Differences in the Results from 2003 to 2011 Surveys
The 2011 survey relied on the same questions included in the 2003 - 2008 studies to allow a comparison in the results (trending analysis). The goal was to determine whether there has been an improvement in the services provided by the Vermont Division of Vocational Rehabilitation from the perspective of Division clients. The tables below provide a quick summary of the changes observed in clients’ level of satisfaction with the Vermont Division of Vocational Rehabilitation from 2003 to 2011. The tables on pages 17, 19 and 21 are broken into four main sections:
Overall Measures of Satisfaction Specific Satisfaction Measures Problems Experienced by Clients Job Satisfaction
The tables provide a summary of 22 questions (including the Consumer Satisfaction Index, which is calculated from three survey questions of improvement or decline in satisfaction). The tables indicate whether there was a difference in the percentage of respondents with a positive view of the Division on each specific question. In most cases this represents the percentage of clients reporting they were satisfied or very satisfied with the specific measure. The tables use a series of characters to denote trends observed in the results.
The letter u indicates an upward trend in positive response, specifically from 2003 (u2003).
The letter d indicates a downward trend in positive response, again specifically from 2003 (d2003).
A plus sign “+” indicates there was an increase in the percentage of respondents offering a positive response from 2008 to 2011. There was not a trend extending back to 2003.
A minus sign “-” indicates there was a decrease in the percentage of respondents offering a positive response from 2008 to 2011. There was not a trend extending back to 2003.
These tables are designed to quickly summarize trends and it is important to understand that the summarized differences do not necessarily rise to the level of statistical significance. In fact, most of the observed changes were only a few percentage points. Thus, they should be not be viewed as meaning there has been a significant improvement or decline in the level of client satisfaction, but viewed as more of a qualitative sense of the trend in client satisfaction. That is, they should be read to determine if the perception of the Division and the services it provides among clients is moving in a positive or negative direction. They can be thought of as representing areas where the Division is viewed by clients as improving the services it offers or areas where clients view that the Division may need to improve its level of service.
In all tables, results are provided for the Division as a whole as well as for each service region.
16

Beginning on page 26, there is a summary of the issues or concerns raised by clients that will help clarify any specific areas for improvement.
In evaluating the four overall satisfaction measures found in the survey, there was an increase in the percent positive response two of the four items with both (Consumer Satisfaction Index and Overall Satisfaction) trending upward since 2003. The Springfield/ Brattleboro Region saw an increase in all four measures while the Rutland/ Bennington and Rural and Agricultural VR regions saw an increase in three of the four overall measures of satisfaction. The Barre/ Morrisville Region saw a decline in the four overall measures of satisfaction.
Summary of Changes in Satisfaction Measures from 2003 to 2008(Overall Satisfaction)
VT DVRBurlington/ Middlebury
St. Albans/ Newport
St. Johnsbury/ White River
Junction
Overall Satisfaction Measures
Consumer Satisfaction Index - -Overall Satisfaction U 2003 + + +Satisfaction with services provided by the agency U 2003 + +Would you recommend that friends go to agency for help - -
Barre/ Morrisville
Rutland/ Bennington
Springfield/ Brattleboro
Rural and Agricultural
VR
Overall Satisfaction Measures
Consumer Satisfaction Index - + +Overall Satisfaction - + +Satisfaction with services provided by the agency - + + +Would you recommend that friends go to agency for help - + + +
Legend:“U 2003” indicates an upward trend in positive response since 2003.“D 2003” indicates a downward trend in positive response since 2003.“+” indicates there was an increase in the percentage of respondents offering a positive response
from 2008 to 2011.“-” indicates there was a decrease in the percentage of respondents offering a positive response
from 2008 to 20011.
17

In evaluating the fifteen specific satisfaction measures found in the survey, there were five measures that increased since 2008 (a higher percentage satisfied) including 2 measures trending upward since 2003. Only one measure has declined (lower percentage satisfied) for the Division as a whole since 2008 and nine have not changes since 2008. By region, the Springfield/ Brattleboro had the greatest number of these fifteen specific satisfaction measures showing an increase (12 of 15) while the Barre/ Morrisville Region had the greatest number showing a decline (12 or 15).
In evaluating whether clients experienced problems with the Division or the services it provides (page 22), the percentage of clients indicating they have not experienced problems decreased slightly from 2008 (meaning there was an increase in the percentage of clients reporting problems). Among those who experienced a problem, the percentage of clients who indicated that the Division worked to resolve the problems decreased from the percentage observed in 2008.
Finally, in evaluating job satisfaction, there was a slight decrease in the percentage of employed clients expressing satisfaction with their job, though there were increase in the St. Albans/ Newport and Rural and Agricultural VR regions.
The summary table on page 24 provides a more global view of client satisfaction. It provides a summary of the total number of questions where the level of satisfaction increased and the total number of questions where the level of satisfaction decreased. This table provides a global perspective on the satisfaction and can be viewed as providing an overall assessment of client satisfaction with the Division.
In reading the table, if a large number of items show an increase in satisfaction, either from 2008 or trending upward from 2003, this can be interpreted as an improvement in the level of satisfaction among clients of the Division and the services it provides overall. Conversely, if a large number of items show a decrease in satisfaction from 2008, or trend less positive since 2003, this can be interpreted as a decline in the level of satisfaction among clients of the Division and the services it provides
Looking at results for the Division as a whole, 7 questions increased in the percentage satisfied from 2008, compared to only four questions which decreased in satisfaction from 2008. The general interpretation is that the overall level of satisfaction among clients for the Division has improved (on an already high level of satisfaction) since 2008. Regionally, Rutland/ Bennington, Springfield/ Brattleboro, Rural and Agricultural VR show an increase in a majority of the 22 measures while St. Johnsbury/ White River Junction and Barre/ Morrisville show a decrease in a majority of the measures since 2008.
18
Summary of Changes in Satisfaction Measures from 2003-2008(Specific areas of Satisfaction)
VT DVRBurlington/ Middlebury
St. Albans/ Newport
St. Johnsbury/ White River
Junction
Specific Satisfaction MeasuresSatisfaction with control and involvement in vocational rehabilitation experience + + -Satisfaction with your choice of a vocational goal - - +Satisfaction with the choice of services that were available - -Satisfaction with the choice of service providers + - -Satisfaction with the kind and amount of information about the choices you had U 2003 +Satisfaction with how long it took your counselor to answer questions, concerns + + + -How easy was it for you to complete an application + + + +How helpful were the staff in helping you achieve goals + -How easy was it for you to contact your vocational rehabilitation counselor + + -How accessible was the office for someone with your type of disability + + +The services I received helped me become more financially independent U 2003 - +The staff treated me with dignity and respect + - -The agency helped me reach my job goals - - + -How well program met expectations - -How well program matches your ideal program - -
(Legend Presented Above)
19

Summary of Changes in Satisfaction Measures from 2003-2008 Continued(Specific areas of Satisfaction)
Barre/ Morrisville
Rutland/ Bennington
Springfield/ Brattleboro
Rural and Agricultural
VR
Specific Satisfaction MeasuresSatisfaction with control and involvement in vocational rehabilitation experience - + + -Satisfaction with your choice of a vocational goal + -Satisfaction with the choice of services that were available - + +Satisfaction with the choice of service providers - + +Satisfaction with the kind and amount of information about the choices you had - + + +Satisfaction with how long it took your counselor to answer questions, concerns - - + +How easy was it for you to complete an application - + + -How helpful were the staff in helping you achieve goals - - + +How easy was it for you to contact your vocational rehabilitation counselor +How accessible was the office for someone with your type of disability - + + -The services I received helped me become more financially independent - +The staff treated me with dignity and respect - - + +The agency helped me reach my job goals - + + +How well program met expectations - + +How well program matches your ideal program + + + -
20

Summary of the Number Specific Satisfaction Measures Showing an Increase or Decrease in Satisfaction among Clients
(of 15 total)
VT DVRBurlington/ Middlebury
St. Albans/ Newport
St. Johnsbury/ White River
JunctionNumber of measures with an increase in positive response since 2008, but have not trended upward since 2003
3 7 7 4Number of measures with trending upward since 2003 2Number of measures with a decrease in positive response since 2008, but have not trended downward since 2003
1 4 7 8Number of measures with trending downward since 2003 0
Barre/ Morrisville
Rutland/ Bennington
Springfield/ Brattleboro
Rural and Agricultural
VRNumber of measures with an increase in positive response since 2008, but have not trended upward since 2003
1 9 12 9Number of measures with trending upward since 2003Number of measures with a decrease in positive response since 2008, but have not trended downward since 2003
12 3 0 5Number of measures with trending downward since 2003
21

Summary of Changes in Satisfaction Measures from 2003-2008(Problems Experienced by Clients and Job Satisfaction)
VT DVRBurlington/ Middlebury
St. Albans/ Newport
St. Johnsbury/ White River
Junction
Problems Experienced by Clients
Experience fewer problems - + -Did agency work to resolve problems - - - -
Job Satisfaction
Satisfaction with job - - + -
Barre/ Morrisville
Rutland/ Bennington
Springfield/ Brattleboro
Rural and Agricultural
VR
Problems Experienced by Clients
Experience fewer problems - + -Did agency work to resolve problems - - + +
Job Satisfaction
Satisfaction with job - - - + (Legend Presented Above)
22

Summary of the Number of Questions Showing an Increase in Satisfaction among Clients and Questions Showing a Decrease in Satisfaction among Clients
(of 22 total)
VT DVRBurlington/ Middlebury
St. Albans/ Newport
St. Johnsbury/ White River
JunctionNumber of Questions with an Increase in the Percentage of Clients who were Satisfied
7 8 11 6Number of Questions with a Decrease in the Percentage of Clients who were Satisfied
4 7 10 12Number of Questions with No Change in the Percentage of Clients who were Satisfied
11 7 1 4
Barre/ Morrisville
Rutland/ Bennington
Springfield/ Brattleboro
Rural and Agricultural
VRNumber of Questions with an Increase in the Percentage of Clients who were Satisfied
1 12 17 14Number of Questions with a Decrease in the Percentage of Clients who were Satisfied
19 5 2 5Number of Questions with No Change in the Percentage of Clients who were Satisfied
2 5 3 3
23

Increase in the Degree of Satisfaction Among Satisfied Clients
Another positive finding from the 2011 study is that among satisfied clients, the level of satisfaction has increased since 2008. This is summarized in the below. In comparing the percentage of clients that gave the Division the highest rating on the scale (for example very satisfied or strongly agree), there was an increase in thirteen measures since 2008 while only two measures show a decrease in the top score. The two items showing a decrease were focused on employment (helping the client reach their job goals and satisfaction with their current employment).
Comparison of Top Score on Survey Satisfaction Measures (2008 and 2011)
Question Rating 2011 2008Q01 Overall, how satisfied are you with the VT DVR program? % Very Satisfied 55% 48% +Q04 How satisfied were you with your control and involvement in your vocational rehabilitation experience? % Very Satisfied 59% 49% +Q05 How satisfied were you with your choice of a vocational goal? % Very Satisfied 52% 44% +Q06 How satisfied were you with the choice of services that were available? % Very Satisfied 52% 43% +Q07 How satisfied were you with the choice of service providers? % Very Satisfied 60% 52% +Q08 How satisfied were you with the kind and amount of information you were given about the choices you had? % Very Satisfied 54% 43% +Q09 How satisfied were you with how long it took your counselor to answer your questions or address your concerns? % Very Satisfied 58% 53% +Q10 How easy was it for you to complete an application for vocational rehabilitation services? % Very Easy 76% 68% +Q11 How helpful were the staff of VT DVR in helping you achieve your vocational rehabilitation goals? % Very Helpful 82% 80% +Q12 How easy was it for you to contact your vocational rehabilitation counselor? % Very Easy 77% 73% +Q13 How accessible was the VT DVR office for someone with your type of disability? % Very Accessible 95% 91% +Q14 The vocational rehabilitation services I received helped me become more financially independent. % Strongly Agree 46% 42% +
Q15 The VT DVR staff treated me with dignity and respect. % Strongly Agree 88% 85% +
Q16 VT DVR helped me reach my job goals. % Strongly Agree 48% 49% -Q26 Thinking about your current job, how satisfied are you with what you are doing? % Very Satisfied 49% 55% -
24

Specific Areas for Improvement Efforts
General Areas of Focus
The survey instrument used in this research not only allowed respondents to rate the services they received through the Vermont Division of Vocational Rehabilitation, but also provided the opportunity to offer feedback when the client was not satisfied. The survey also allowed clients to identify any problems they experienced and offer suggestions for service improvement. As noted, the results do not suggest that significant problems exist in the agency or with the services it provides. Rather, the results suggest areas of minor concern that can be addressed to improve upon an already high level of satisfaction.
This section provides a summary of the verbatim responses provided by clients throughout the survey. The first table classifies comments by main topic area. The table on page 29 categorizes verbatim responses into main topic areas. The numbers in the table represent the TOTAL number of times a comment was made that fell within the general area. Please note that:
386 of the 730 clients surveyed in this study offered verbatim comments about issues, problems or concerns (including those who offered positive comments).
Each topic area contains a number of specific categorized comments (there were in fact over 300 specific categories for comments) – that is, a general topic area may include a number of responses from these 300 specific categories.
Each client had the opportunity to provide a comment to each survey question if they were not satisfied (there are 22 items that evaluate client satisfaction).
The counts represent the total number of times a comment was mentioned (but duplicate mentions of a specific comment by the same client were not counted). Again note that a respondent could have mentioned several (different) comments that applied to a general area so the numbers do not represent the NUMBER of respondents making a comment that pertains to a general topic area. Rather, this is simply a count of how many times a comment was made among all respondents.
These general topic areas represent the key areas where respondents have identified concerns or problems. The table counts provide a way to evaluate the relative weight of each general topic area in relation to one another. That is, how significant a general area was in the minds of all respondents when expressing comments, concerns, or problems. The table can help to identify the areas where efforts at quality improvement would serve to improve the level of satisfaction among all your clients.
A key is provided beginning on page 30 that lists the specific types of comments that are included in these general topic areas (the bold word or phrase corresponds to the appropriate term in the key).
25

Overall, the main areas of concern among clients were (in descending order of the number of comments mentioned for the general area) were:
1. Issues with communication with the Division and Division staff2. Employment issues3. Need for more support (more guidance from staff, more services to achieve goals)4. Paperwork (forms difficult, needing help with paperwork)5. Effectiveness of the Division in providing services and meeting expectations6. Issues with staff (switching counselors, help, understanding)
By Region, the main areas of concern among clients were (again, in order of mention):
Burlington/Middlebury:
1. Issues with Communication with the Division and Division Staff2. Employment Issues3. Need for more Support (more guidance from staff, more services to achieve goals)4. Issues with Staff (switching counselors, help, understanding)5. Paperwork (forms difficult, needing help with paperwork)6. Effectiveness of the Division in Providing Services and Meeting Expectations
St. Albans/Newport:
1. Issues with Communication with the Division and Division Staff2. Employment Issues3. Need for more Support (more guidance from staff, more services to achieve goals)4. Issues with Staff (switching counselors, help, understanding)5. Effectiveness of the Division in Providing Services and Meeting Expectations
St. Johnsbury/White River Junction:
1. Issues with Communication with the Division and Division Staff2. Employment Issues3. Need for more Support (more guidance from staff, more services to achieve goals)4. Paperwork (forms difficult, needing help with paperwork)5. Effectiveness of the Division in Providing Services and Meeting Expectations6. Issues with Staff (switching counselors, help, understanding)
26

Barre/Morrisville:
Issues with Communication with the Division and Division Staff Need for more Support (more guidance from staff, more services to achieve goals) Employment Issues Effectiveness of the Division in Providing Services and Meeting Expectations General Dissatisfaction Paperwork (forms difficult, needing help with paperwork) Issues with Staff (switching counselors, help, understanding)
Rutland/Bennington:
1. Issues with Communication with the Division and Division Staff2. Need for more Support (more guidance from staff, more services to achieve goals)3. Employment Issues4. Issues with Staff (switching counselors, help, understanding)5. Effectiveness of the Division in Providing Services and Meeting Expectations6. Paperwork (forms difficult, needing help with paperwork)
Springfield/Brattleboro:
1. Issues with Communication with the Division and Division Staff2. Paperwork (forms difficult, needing help with paperwork)3. Issues with Staff (switching counselors, help, understanding)4. Need for more Support (more guidance from staff, more services to achieve goals)5. Employment Issues
Rural and Agricultural VR:
1. Employment Issues2. Issues with Communication with the Division and Division Staff3. Need for more Support (more guidance from staff, more services to achieve goals)4. Effectiveness of the Division in Providing Services and Meeting Expectations5. Paperwork (forms difficult, needing help with paperwork)
The general areas for which clients made comments or expressed concern or problems fall mainly into six categories:
Communications issues concern the ability of the client to contact their counselor or other staff. This included comments that reflect the difficulty of the client to reach their counselor by telephone, the lack of follow-up by their counselor and time lags between contact and getting services or appointments.
Employment concerns reflect that clients did not find employment through the Division, that the client felt the need for more assistance in finding a job, and that the client would like more options when choosing a job.
27

Support reflects more general statements about the lack of needed services from the client perspective or the belief that the Division did not provide needed assistance. Comments include that the services provided were of little help because of the lack of continued support and that the client simply needed more support or guidance.
Issues with forms or other paperwork reflect that clients felt that the forms they were required to complete were either too complicated or that they needed assistance from Division staff to complete them properly.
Effectiveness reflects mainly that the services provided by the Division did not necessarily meet the expectations of clients. These are largely more general views about the Division and how it provides assistance to clients. Client comments include that the program did not meet their expectations, services were of little or no help, that the client had to fight to get services, or that there was a general need to speed up the process of providing services to clients.
Comments about staff issues reflect concern over their ability to work with the staff. This includes that staff dismissed or did not listen to their concerns or needs and that the staff needed to be more understanding. Also included in this area are the feelings that staff were too busy and overworked. Finally, many clients also indicated there were difficulties because of the turnover in the counselor staff, that they had more than one counselor while receiving services.
Specific Issues for Focus of Quality Improvement Initiative
The discussion above outlines the general areas where clients have noted concerns or problems and provides some insight to guide efforts to improve service to clients. These can be thought of as the global areas of focus, the general areas where clients have noted difficulties.
The table below provides specific areas that represent targets where quality improvement efforts can increase the level of satisfaction among your clients. In this table, the percentages reflect the percentage of all clients that made a comment about a specific issue, concern or problem. That is, the percentages reflect the percent of the total client population with a specific concern, issue, or problem.
The table provides the percentages for the Division as a whole as well as for each of the seven service regions. These percentages are tabulated across all of the satisfaction measures included in the survey. That is, if a client mentioned the issue, concern, or problem at any time during the survey.
28

General Topic Areas of Respondent Comments, Problems, and ConcernsNumber of Comments, Issues, Problems or Concerns Mentioned by General Topic Area
VT DVRBurlington-Middlebury
St. Albans-Newport
St. Johnsbury-
White River
JunctionBarre-
MorrisvilleRutland-
Bennington
Springfield-
Brattleboro
Rural and Agricultural
VRIssues with Communication with the Division and Division Staff 162 24 25 31 21 24 23 14
Employment Issues 122 21 23 19 16 15 10 18
Need for more Support (more guidance from staff, more services to achieve goals)
117 19 18 18 21 17 11 13
Paperwork (forms difficult, needing help with paperwork) 84 11 6 16 11 10 19 11
Effectiveness of the Division in Providing Services and Meeting Expectations
82 10 12 13 16 10 9 12
Issues with Staff (switching counselors, help, understanding) 82 14 14 12 11 12 12 7
Client Disabilities 51 9 6 10 6 10 4 6
General Dissatisfaction 43 6 4 7 12 5 3 6
General Satisfaction 42 4 7 6 8 5 6 6
Need for More Information, More Detailed Information 38 4 7 6 7 6 4 4
Need to Expand Services or Funding for the Division 35 7 5 5 8 2 5 3
Need more Testing or Assessment 21 2 5 5 1 2 2 4
Client Financial Issues (not meeting financial needs) 20 3 3 3 4 2 2 3
Transportation Issues (lack of, distance to offices) 14 4 3 1 4 2
Accessibility issues (access to offices) 13 1 1 4 1 2 2 2
Client Involvement in and Control of Vocational Rehabilitation Process 11 3 1 3 1 1 1 1
Client Issues (client responsibility for problems) 10 2 1 4 1 2
Location and Hours (need for more locations, more convenient hours, office locations change)
10 3 1 2 2 1 1
Other Comments 32 5 6 7 5 4 4 1
29

KEYArea Definitions:
Communication - Difficulties in communicating with the staff, their counselor did not return calls or was not available, their counselor did not follow-up, time lags in getting services and appointments
Employment - The client did not find employment and needed more assistance in finding a job, job search help or more job options
Support - The client felt that no services were provided or that the services provided were of little help, the client needed more support and guidance
Paperwork - Difficulty in filling out forms, forms are too long, forms are too complicated, need to simplify forms, need help filling out forms
Effectiveness - Program did not meet expectations, no clear purpose or solutions offered, speed up the process of getting services, had to fight to get services
Staff Issues - Their counselor would not listen dismissed concerns, did not understand needs or abilities, counselor was too busy, the client was pushed aside, staff needed to be more understanding, counselor left, switched to another counselor
Client Disabilities - Trouble reading, poor eyesight, difficulties understanding or comprehending, difficulties due to disability
General Dissatisfaction - negative feedback, dissatisfied with program in general
General Satisfaction - positive feedback, satisfied with program, staff helpful, no complaints
Information - The client was unaware of available services, the client needed more information about available services, and the client needed more information about employment choices
Expanded Services - Division needs more funding for services, need to offer more services, networking with other agencies and businesses
Testing - need for more testing, less testing, need more assessment
Client Financial Issues - Did not receive financial assistance, not financially independent, client had to pay for services, client did not receive assistance in paying for services
Transportation - Distance to offices or services, need transportation, parking, vehicle assistance
Accessibility - Mobility inside offices, difficulty getting into small offices, lighting, elevators and stairs, difficulty with entries and exits, directions to offices
Client Involvement - More client involvement in process, client had no control over process, client was told what to do, felt pushed into a job
Client Issues - Lack of success was fault of client, counselor and Division tried to help
Location and Hours - Need for more locations, more convenient hours, office locations change
30

Overall, the most commonly mentioned specific issues among clients were:
1. WORK- Did not receive employment, Could not find me a job2. SUPPORT - Need more guidance, support3. SUPPORT - No services provided, not much help4. HELP - Someone else helped, counselor did paperwork5. COMM - Counselor did not return calls, No follow up6. COMM - Phone tag - leave a message and counselor called back7. COMM - Leave multiple messages before getting a call back8. COMM - Hard to reach staff
By Region, the main areas of concern among clients were (again, in order of mention):
Burlington/Middlebury:
1. WORK- Did not receive employment, Could not find me a job2. SUPPORT - Need more guidance, support3. COMM - Counselor did not return calls, No follow up4. COMM - Hard to reach staff5. HELP - Someone else helped, counselor did paperwork6. COMM - Leave multiple messages before getting a call back7. COMM - Calls, mail not returned for days, weeks, wait8. COMM - Phone tag - leave a message and counselor called back9. NEGATIVE - Dissatisfied with services and counselor10. EXPAND - more info needed, need to broaden programs
St. Albans/Newport:
1. WORK- Did not receive employment, Could not find me a job2. SUPPORT - Need more guidance, support3. COMM - Hard to reach staff4. SUPPORT - No services provided, not much help5. EFFECTIVE - Not meet expectations, help with goals6. COMM - Counselor did not return calls, No follow up7. COMM - Hard to reach counselor8. COMM - Calls, mail not returned for days, weeks, wait9. COMM - Phone tag - leave a message and counselor called back10. TEST - Didn't receive needed, desired testing
31

St. Johnsbury/White River Junction:
1. WORK- Did not receive employment, Could not find me a job2. COMM - Leave multiple messages before getting a call back3. SUPPORT - No services provided, not much help4. COMM - Counselor did not return calls, No follow up5. SUPPORT - Need more guidance, support6. HELP - Someone else helped, counselor did paperwork7. COMM - Phone tag - leave a message and counselor called back8. COMM - Hard to reach counselor
Barre/Morrisville:
SUPPORT - Need more guidance, support WORK- Did not receive employment, Could not find me a job SUPPORT - No services provided, not much help NEGATIVE - Program did nothing or little to help COMM - Counselor did not return calls, No follow up NEGATIVE - Dissatisfied with services and counselor EFFECTIVE - No help, very little help COMM - Leave multiple messages before getting a call back HELP - Someone else helped, counselor did paperwork COMM - Phone tag - leave a message and counselor called back WORK - Help client get a job, more job services, job options COMM - Hard to reach staff INFO - Not enough, unaware of available services EFFECTIVE - agency was not very productive, effective
Rutland/Bennington:
1. SUPPORT - Need more guidance, support2. COMM - Counselor did not return calls, No follow up3. SUPPORT - No services provided, not much help4. WORK- Did not receive employment, Could not find me a job5. COMM - Leave multiple messages before getting a call back6. COMM - Phone tag - leave a message and counselor called back7. HELP - Trouble filling out forms, needed help8. CONDITION - Trouble because of disability
32

Springfield/Brattleboro:
1. HELP - Someone else helped, counselor did paperwork2. COMM - Phone tag - leave a message and counselor called back3. COMM - Hard to reach staff4. COMM - Leave multiple messages before getting a call back5. SUPPORT - Need more guidance, support6. SUPPORT - No services provided, not much help7. WORK- Did not receive employment, Could not find me a job
Rural and Agricultural VR:
1. HELP - Someone else helped, counselor did paperwork2. SUPPORT - No services provided, not much help3. SUPPORT - Need more guidance, support4. WORK- Did not receive employment, Could not find me a job5. COMM - Counselor did not return calls, No follow up6. COMM - Phone tag - leave a message and counselor called back7. WORK - Help client get a job, more job services, job options
33

Specific Areas for Quality Improvement(% of all clients mentioning issue, concern, or problem – most frequently mentioned)
Reasons VT DVRBurlington-Middlebury
St. Albans-Newport
St. Johnsbury-White River
JunctionBarre-
MorrisvilleRutland-
BenningtonSpringfield-Brattleboro
Rural and Agricultural
VR
WORK- Did not receive employment, Could not find me a job 11% 17% 17% 11% 13% 8% 5% 9%
SUPPORT - Need more guidance, support 11% 15% 10% 8% 17% 13% 6% 9%
SUPPORT - No services provided, not much help 8% 3% 8% 9% 12% 9% 5% 10%
HELP - Someone else helped, counselor did paperwork 7% 7% 4% 8% 6% 2% 15% 10%
COMM - Counselor did not return calls, No follow up 7% 8% 7% 9% 7% 10% 4% 6%
COMM - Phone tag - leave a message and counselor called back 6% 5% 5% 7% 6% 6% 9% 5%
COMM - Leave multiple messages before getting a call back 6% 7% 3% 10% 6% 6% 7% 1%
COMM - Hard to reach staff 5% 7% 8% 4% 5% 4% 8% 2%
NEGATIVE - Program did nothing or little to help 4% 2% 2% 4% 10% 4% 1% 4%
NEGATIVE - Dissatisfied with services and counselor 4% 5% 4% 3% 7% 4% 2% 3%
EFFECTIVE - No help, very little help 4% 4% 3% 2% 7% 3% 4% 4%
INFO - Not enough, unaware of available services 3% 2% 4% 3% 5% 4% 2% 2%
COMM - Calls, mail not returned for days, weeks, wait 3% 5% 5% 3% 3% 2% 3%
EFFECTIVE - Not meet expectations, help with goals 3% 1% 8% 4% 2% 2% 2% 2%
WORK - Help client get a job, more job services, job options 3% 1% 4% 3% 6% 2% 5%
WORK -No job yet-still working on achieving goals 3% 4% 2% 3% 2% 3% 3% 4%
TEST - Didn't receive needed, desired testing 3% 2% 5% 4% 1% 2% 2% 4%
EXPAND - more info needed, need to broaden programs 3% 5% 3% 3% 4% 2% 2%
COMM - Hard to reach counselor 3% 3% 6% 5% 2% 1% 2%
34

Specific Areas for Quality Improvement(% of all clients mentioning issue, concern, or problem – most frequently mentioned)
(continued)
Reasons VT DVRBurlington-Middlebury
St. Albans-Newport
St. Johnsbury-White River
JunctionBarre-
MorrisvilleRutland-
BenningtonSpringfield-Brattleboro
Rural and Agricultural
VRCONDITION - Trouble because of disability 3% 3% 4% 2% 1% 5% 1% 3%
CONDITION - Trouble understanding, terms, language, confused
2% 4% 4% 3% 3% 2%
STAFF - Counselor would not listen, dismissed concerns 2% 3% 4% 2% 3% 2% 1% 2%
SUPPORT - Did not achieve goal, working on, need guidance 2% 4% 4% 2% 1% 1% 3% 2%
STAFF - Changing counselors, switching too much 2% 4% 2% 4% 4% 3%
HELP - Trouble filling out forms, needed help 2% 2% 3% 2% 5% 1% 2%
STAFF - More counselors, staff, counselors are overworked 2% 4% 2% 2% 4% 1% 1% 1%
WORK - No job, didn't receive much job search help 2% 4% 2% 2% 1% 2% 1% 3%
COMM -They are too busy, They have large caseloads 2% 4% 3% 3% 1% 2%
CONDIITON - Trouble reading, writing, education 2% 4% 2% 1% 3% 3% 1%
EFFECTIVE - agency was not very productive, effective 2% 2% 3% 2% 5% 1%
EFFECTIVE - Broken promises, no follow thru 2% 2% 2% 4% 3% 1%
EFFECTIVE - training did not match with interest, ability 2% 3% 4% 2% 2% 1% 1%
WORK - Dissatisfied with job, not what they wanted 2% 2% 1% 2% 1% 3% 4%
COMM - Better communication needed 2% 2% 3% 4% 2%
HARD - Hard, Somewhat difficult, complicated 2% 1% 2% 4% 2% 2%
SUPPORT - More services needed to help with career goals 1% 4% 2% 2%
EFFECTIVE - Speed up process of obtaining services 1% 1% 2% 4% 1%
COMM -Person never available (meetings, out of office) 1% 4% 1% 1% 1%
35

III. Summary Report
36

Services Received by Clients
The most common services received are help in finding a job, financial assistance, vocational or employment counseling, and counseling.
The largest percentage indicated that financial assistance and help in finding a job were the most helpful services they received.
37

The most common services received are help in finding a job, financial assistance, vocational or employment counseling, and counseling.
What services did you receive/are you receiving from the Vermont Division of Vocational Rehabilitation?
VT DVR Burlington-Middlebury
St. Albans-Newport
St. Johnsbury
-White River
Junction
Barre-Morrisville
Rutland-Bennington
Springfield-
Brattleboro
Rural and Agricultural
VR
Help in finding a job 52% 58% 63% 48% 47% 51% 52% 25%
Financial Assistance 48% 38% 44% 47% 59% 54% 45% 44%Vocational or employment counseling 41% 48% 42% 43% 41% 38% 42% 19%
Counseling 21% 26% 23% 17% 16% 17% 27% 17%
General information 19% 19% 22% 13% 18% 23% 18% 15%Received information on services offered 13% 21% 14% 10% 9% 11% 16% 10%
College education or training 13% 6% 12% 12% 13% 22% 12% 3%
Transportation 12% 14% 13% 9% 15% 9% 13% 6%
Testing or evaluations 9% 5% 10% 6% 5% 12% 13% 5%
Business or vocational training 8% 2% 11% 7% 11% 7% 10% 5%
Adaptive equipment 7% 5% 4% 7% 10% 4% 9% 23%
Other education and training 7% 7% 11% 7% 2% 6% 7% 6%
Situational Assessment or Job Trial 7% 5% 12% 5% 8% 5% 7% 3%
Medical treatment or services 6% 1% 5% 5% 5% 13% 6% 9%
Vehicle Modifications 5% 3% 8% 4% 9% 3% 3% 14%
Personal or living skills 2% 3% 3% 2% 2% 2% 2% 5%
Home based employment 2% 1% 4% 5% 4% 2%
Rehabilitation teaching or training 1% 2% 4% 1% 1% 1% 2%
38

What services did you receive/are you receiving from the Vermont Division of Vocational Rehabilitation? (continued)
VT DVR Burlington-Middlebury
St. Albans-Newport
St. Johnsbury
-White River
Junction
Barre-Morrisville
Rutland-Bennington
Springfield-
Brattleboro
Rural and Agricultural
VR
Low vision aids 1% 2% 2% 2% 1% 1%
Social adjustment counseling 1% 3% 3% 1% 1%
Household/monthly bills 1% 1% 1% 1% 2% 2%
Mobility instruction training 1% 1% 3% 2%
Homemaking skills 1% 1% 1% 1% 1%
Group support 0% 1% 1%Help with personal care/housekeeping/grocery shopping 0% 1% 1% 1%
Home modifications 0% 1% 0% 4%
Repairs to house/ equipment 0% 1%
Provided computer/software 0% 1%
Driving lessons/license 0% 1% 1%
Satisfied with Services/Counselor 0% 1%
Other 0% 1% 1% 1%
None 1% 1% 1% 3% 1% 1% 1% 2%
Don't Know 1% 1% 1% 1% 1% 2% 1% 1%
Refused 0% 2%
Total 100% 100% 100% 100% 100% 100% 100% 100%
Note: columns listed as “0%” indicated instances where less than 0.5% gave this response. Blanks represent cases where no client gave this response.
Comments:
Fifty-two percent of clients indicated that they had received services to help them find a job, 48% received financial assistance, 41% of clients received vocational guidance or employment counseling, and 21% of clients indicated that they received counseling.
39

The largest percentage indicated that financial assistance and help in finding a job were the most helpful services they received.
What were the most helpful services provided to you by the Vermont Division of Vocational Rehabilitation program?
VT DVR Burlington-Middlebury
St. Albans-Newport
St. Johnsbury
-White River
Junction
Barre-Morrisville
Rutland-Bennington
Springfield-
Brattleboro
Rural and Agricultural
VR
Financial Assistance 34% 28% 29% 34% 42% 43% 25% 35%
Help in finding a job 32% 35% 35% 27% 33% 30% 34% 16%Vocational or employment counseling 26% 36% 22% 25% 22% 26% 28% 9%
Counseling 16% 21% 10% 9% 12% 14% 23% 15%
College education or training 7% 3% 4% 6% 5% 17% 4% 2%
Transportation 5% 9% 4% 7% 5% 5% 5% 2%
Adaptive equipment 5% 1% 1% 6% 8% 4% 6% 16%
Business or vocational training 4% 1% 5% 3% 5% 7% 5% 5%
General information 4% 4% 5% 2% 3% 6% 2% 5%
Vehicle Modifications 4% 3% 7% 4% 5% 1% 2% 11%Received information on services offered 3% 4% 3% 2% 2% 4% 3% 2%
Medical treatment or services 3% 1% 3% 1% 1% 6% 2% 5%
Other education and training 2% 1% 4% 5% 1% 1% 1% 2%
Testing or evaluations 2% 1% 1% 3% 4% 1%
Situational Assessment or Job Trial 2% 2% 3% 2% 1% 2% 0% 2%
Home based employment 1% 2% 2% 1% 1% 1% 1%
Personal or living skills 1% 3% 2% 2% 3%Help with personal care/housekeeping/grocery shopping 1% 1% 1% 4%
40

What were the most helpful services provided to you by the Vermont Division of Vocational Rehabilitation program? (continued)
VT DVR Burlington-Middlebury
St. Albans-Newport
St. Johnsbury
-White River
Junction
Barre-Morrisville
Rutland-Bennington
Springfield-
Brattleboro
Rural and Agricultural
VR
Household/monthly bills 1% 1% 3% 1%
Driving lessons/license 1% 1% 1% 3%
Rehabilitation teaching or training 1% 1% 2% 1% 1%
Low vision aids 1% 1% 2% 2% 1%
Social adjustment counseling 1% 1% 2% 0%
Group support 0% 1% 1% 1%
Provided computer/software 0% 2% 1%
Satisfied with Services/Counselor 0% 1% 1% 1%
Homemaking skills 0% 1% 1%
Home modifications 0% 0% 4%
Mobility instruction training 0% 1% 1%
Repairs to house/ equipment 0% 1%
Other 1% 1% 1% 1% 2% 2%
None 5% 4% 5% 9% 4% 3% 4% 5%
Don't Know 3% 2% 3% 3% 4% 4% 1% 2%
Refused 0% 1% 0%
Total 100% 100% 100% 100% 100% 100% 100% 100%
Note: columns listed as “0%” indicated instances where less than 0.5% gave this response. Blanks represent cases where no client gave this response.
Comments:
When asked which of the services they received were the most helpful, 34% of clients indicated that financial assistance was the most helpful service provided by the agency and 32% mentioned help in finding a job. Twenty-six percent of clients mentioned vocational guidance and employment counseling and 16% counseling in general.
41

Measures of Overall Satisfaction
In 2011, 91% were very satisfied or satisfied with the Vermont Division of Vocational Rehabilitation’s program.
In 2011, 87% of clients indicated that they were satisfied with the services they received.
In 2011, 84% of clients indicated that the services provided met their expectations.
In 2011, 82% of clients indicated that the services provided through the Vermont Division of Vocational Rehabilitation compared favorably to the services offered through their ideal program.
Among all clients, the consumer satisfaction index was 77.0 in 2011.
In 2011, 95% percent of clients would tell their friends with similar disabilities to go to the Vermont Division of Vocational Rehabilitation for help.
42

In 2011, 91% were very satisfied or satisfied with the Vermont Division of Vocational Rehabilitation’s program.
VT DVR Burlington-Middlebury
St. Albans-Newport
St. Johnsbury-
White River
Junction
Barre-Morrisville
Rutland-Bennington
Springfield-Brattleboro
Rural and Agricultural
VR
Very dissatisfied 3% 2% 5% 4% 4% 1% 2% 1%Dissatisfied 3% 5% 3% 4% 4% 3% 2% 5%Neither satisfied nor dissatisfied 3% 3% 4% 3% 6% 1% 4% 3%
Satisfied 36% 32% 40% 28% 38% 42% 34% 33%Very satisfied 55% 58% 48% 61% 48% 52% 58% 58%Total 100% 100% 100% 100% 100% 100% 100% 100%
Results by region for 2011
Very dissa
tisfied
Dissatisf
ied
Neither s
atisfied
nor dissa
tisfied Satis
fied
Very sat
isfied
0%20%40%60%80%
100%
3% 3% 3%
36%55%
Q01 Overall, how satisfied are you with the VT DVR program?
43

2003 2006 2008 20110.0%
20.0%
40.0%
60.0%
80.0%
100.0%84.3% 85.4% 88.2% 90.5%
Q01 Overall, how satisfied are you with the VT DVR program?(% very satisfied or satisfied)
Year of Survey Administration
44

Overall, how satisfied are you with the Vermont Division of Vocational Rehabilitation’s program?
%Sig Diff
2011Sig Diff Trend
Year of Administration 2003 84.3% 2006 85.4% 2008 88.2% 2011 90.5% U2003 Region 2008 Burlington/Middlebury 87.3% St. Albans/Newport 85.0% St. Johnsbury/White River Junction 86.8% Barre/Morrisville 91.3% Rutland/Bennington 91.6% Springfield/Brattleboro 85.9% Rural and Agricultural VR 90.6% 2011 Burlington/Middlebury 90.6% St. Albans/Newport 88.3% St. Johnsbury/White River Junction 89.5% Barre/Morrisville 86.3% Rutland/Bennington 94.5% Springfield/Brattleboro 91.4% Rural and Agricultural VR 91.0%
(% of respondents satisfied or very satisfied)
45

Comments:
Ninety-one percent of clients were very satisfied or satisfied with the Vermont Division of Vocational Rehabilitation’s program. This percentage has trended upward significantly from 2003.
In 2011, 55% of clients indicated that they were very satisfied with the agency’s program, while 36% were satisfied. Three percent of clients indicated that they were neither satisfied nor dissatisfied with the agency’s program, while only 6% indicated some level of dissatisfaction (3% dissatisfied and 3% very dissatisfied).
Among the 9% of clients that were not satisfied in 2011:
32% indicated they could not find a job. 24% indicated no services were provided or the services were of little help. 14% indicated they needed more guidance or support. 13% indicated their counselor did not return calls or follow up.
46

Overall, how satisfied are you with the Vermont Division of Vocational Rehabilitation’s program?
Primary Reasons not Satisfied
VT DVR Burlington-Middlebury
St. Albans-Newport
St. Johnsbury
-White River
Junction
Barre-Morrisville
Rutland-Bennington
Springfield-
Brattleboro
Rural and Agricultural
VR
WORK- Did not receive employment, Could not find me a job 32% 38% 36% 33% 44% 13% 19% 34%
SUPPORT - No services provided, not much help 24% 5% 10% 42% 41% 39% 7% 44%
SUPPORT - Need more guidance, support 14% 8% 21% 13% 22% 9% 48%
COMM - Counselor did not return calls, No follow up 13% 26% 13% 10% 11% 16% 15%
EFFECTIVE - agency was not very productive, effective 6% 3% 17% 13% 11%
COMM - Hard to reach staff 6% 10% 10% 13% EDUCATION- Did not receive needed education, training 4% 13% 9%
SERVICES - Services, jobs not accessible, available in area 3% 14% 5%
STAFF - staff attitude, disrespect, unprofessional 3% 7% 11%
COMM - Better communication needed 3% 11% 5%
FINANCE- Did not receive needed financial help 3% 10% 6%
STAFF - Counselor, staff did not treat me with respect, rude 3% 17%
STAFF - Poor client-counselor relationship 3% 17%
EXPAND - more info needed, need to broaden programs 3% 10% 7%
NEGATIVE - I've given up on services, program; a waste of time 2% 12% 12%
EFFECTIVE - Speed up process of obtaining services 2% 16%
POSITIVE - Positive (general) 2% 16%
FINANCE - Will not pay for needed training, classes 2% 10%
47

Overall, how satisfied are you with the Vermont Division of Vocational Rehabilitation’s program?
Primary Reasons not Satisfied(continued)
VT DVR Burlington-Middlebury
St. Albans-Newport
St. Johnsbury
-White River
Junction
Barre-Morrisville
Rutland-Bennington
Springfield-
Brattleboro
Rural and Agricultural
VR
STAFF - Changing counselors, switching too much 2% 7% 11%
INFO - Not enough, unaware of available services 1% 10%
NEGATIVE - Dissatisfied (general) 1% 10%
CONDITION - Asthma, smells breathing, allergies 1% 10%
SUPPORT - Did not achieve goal, working on, need guidance 0% 12%
STAFF - Maintain consistency with staff throughout agency 0% 12%
Note: columns listed as “0%” indicated instances where less than 0.5% gave this response. Blanks represent cases where no client gave this response.
48

In 2011, 87% of clients indicated that they were satisfied with the services they received.
VT DVR Burlington-Middlebury
St. Albans-Newport
St. Johnsbury-
White River
Junction
Barre-Morrisville
Rutland-Bennington
Springfield-Brattleboro
Rural and Agricultural
VR
Not at all satisfied 3% 2% 3% 7% 3% 3% 4% 2%2 1% 1% 1% 4% 3% 3 1% 1% 2% 1% 2% 2% 4%4 1% 1% 2% % 1% 2% 1%5 6% 11% 3% 7% 3% 4% 6% 3%6 4% 6% 4% 5% 3% 3% 1% 7 10% 10% 6% 12% 11% 10% 12% 9%8 23% 18% 27% 13% 22% 25% 31% 21%9 16% 13% 12% 19% 20% 12% 23% 14%Very satisfied 35% 39% 40% 35% 31% 39% 22% 46%Total 100% 100% 100% 100% 100% 100% 100% 100%
Results by region for 2011
Not at all satis-
fied
2.00 3.00 4.00 5.00 6.00 7.00 8.00 9.00 Very satisfied
0%
20%
40%
60%
80%
100%
3% 1% 1% 1% 6% 4%10%
23%16%
35%
Q17 Please rate your satisfaction on a scale from one to ten where 1 is very dissatisfied and 10 means you are very satisfied, how satisfied
would you say you are with the services provided by VT DVR?
49

2003 2006 2008 20110.0%
20.0%
40.0%
60.0%
80.0%
100.0%84.1% 86.4% 85.8% 87.4%
Q17 Please rate your satisfaction on a scale from one to ten where 1 is very dissatisfied and 10 means you are very satisfied, how satisfied
would you say you are with the services provided by VT DVR?(% rating 6 through 10 on 10 point scale)
Year of Survey Administration
50

How satisfied would you say you are with the services provided by the Vermont Division of Vocational Rehabilitation?
%Sig Diff
2011Sig Diff Trend
Year of Administration 2003 84.1% 2006 86.4% 2008 85.8% 2011 87.4% Region 2008 Burlington/Middlebury 84.4% St. Albans/Newport 87.5% St. Johnsbury/White River Junction 83.2% Barre/Morrisville 93.5% Rutland/Bennington 87.3% Springfield/Brattleboro 80.8% Rural and Agricultural VR 88.8% 2011 Burlington/Middlebury 85.1% St. Albans/Newport 88.6% St. Johnsbury/White River Junction 84.9% Barre/Morrisville 87.0% Rutland/Bennington 89.0% Springfield/Brattleboro 88.7% Rural and Agricultural VR 90.6%
(% of respondents rating 6 to 10 on ten point satisfaction scale)
51

Comments:
Clients were asked to evaluate their satisfaction with the services provided by the Vermont Division of Vocational Rehabilitation. This evaluation was on a ten point scale where 1 is very dissatisfied and 10 is very satisfied. Eighty-seven percent of clients were very satisfied or satisfied with the Vermont Division of Vocational Rehabilitation’s program (indicating six to ten on the ten point scale). This is comparable to the percentage observed in 2008.
Among all clients, the average score on this ten point scale was 8.1.
Satisfaction with the services provided by the Vermont Division of Vocational Rehabilitation
(average scores)
AverageVT DVR 8.1Burlington-Middlebury 7.9St. Albans-Newport 8.1St. Johnsbury-White River Junction 8.2Barre-Morrisville 8.2Rutland-Bennington 8.0Springfield-Brattleboro 7.9Rural and Agricultural VR 8.5
Among the 12% of clients not satisfied in 2011 (giving a rating of one to five):
31% indicated they needed more support or guidance. 30% indicated they did not find a job. 20% indicated no services were provided or the services were of little help.
52

How satisfied would you say you are with the services provided by the Vermont Division of Vocational Rehabilitation?
Primary Reasons Not Satisfied
VT DVRBurlington-Middlebur
y
St. Albans-Newport
St. Johnsbury
-White River
Junction
Barre-Morrisville
Rutland-Bennington
Springfield-
Brattleboro
Rural and Agricultural
VR
SUPPORT - Need more guidance, support 31% 52% 23% 18% 45% 25% 13% 46%
WORK- Did not receive employment, Could not find me a job 30% 46% 24% 28% 34% 34% 9% 12%
SUPPORT - No services provided, not much help 20% 3% 22% 24% 26% 51% 9%
EFFECTIVE - Not meet expectations, help with goals 16% 3% 34% 29% 12% 17% 10% 22%
NEGATIVE - Program did nothing or little to help 16% 6% 16% 53% 21% 41%
COMM - Counselor did not return calls, No follow up 10% 9% 22% 20% 8% 14%
COMM - Hard to reach staff 7% 9% 11% 5% 19% 14%
EFFECTIVE - Broken promises, no follow thru 7% 10% 4% 6% 9% 12%
STAFF - Counselors make more effort, client does work 6% 9% 21% 7%
EFFECTIVE - Tailor to individual needs- know each client 3% 6% 12%
CLIENT - Unsuccessful but counselor, agency did try to help 3% 13%
STAFF - If counselors not there, help needs to be available 2% 14%
STAFF - Did not listen to my needs 2% 13%
STAFF - Poor client-counselor relationship 2% 13%
SUPORT - Benefits counseling 2% 13% WORK - Help client get a job, more job services, job options 2% 5% 5% 12%
SERVICES - Services for hearing impaired 2% 12%
53

How satisfied would you say you are with the services provided by the Vermont Division of Vocational Rehabilitation?
Primary Reasons Not Satisfied(continued)
VT DVRBurlington-Middlebur
y
St. Albans-Newport
St. Johnsbury
-White River
Junction
Barre-Morrisville
Rutland-Bennington
Springfield-
Brattleboro
Rural and Agricultural
VR
STAFF - More caring, understanding and encouraging staff 2% 12%
EFFECTIVE - Fight to get services, help is limited 0% 12%
EFFECTIVE - Services lessened throughout time 0% 12%
EXPAND - Funding problems, No money for services 0% 12%
Note: columns listed as “0%” indicated instances where less than 0.5% gave this response. Blanks represent cases where no client gave this response.
54

In 2011, 84% of clients indicated that the services provided met their expectations.
VT DVR Burlington-Middlebury
St. Albans-Newport
St. Johnsbury-
White River
Junction
Barre-Morrisville
Rutland-Bennington
Springfield-Brattleboro
Rural and Agricultural
VR
Met none of expectations 4% 2% 5% 8% 5% 4% 3% 2%
2 1% 1% 1% 4% 1% 3 1% 2% 1% 1% 2% % % 3%4 3% 4% 2% 1% 2% 4% 1% 3%5 7% 14% 6% 9% 2% 4% 6% 8%6 4% 3% 5% 3% 6% 3% 5% 3%7 9% 7% 12% 10% 10% 9% 10% 6%8 23% 24% 17% 14% 20% 27% 32% 20%9 13% 10% 10% 16% 17% 12% 17% 11%Met expectations completely 34% 34% 40% 37% 32% 36% 24% 45%
Total 100% 100% 100% 100% 100% 100% 100% 100%Results by region for 2011
Met non
e of e
xpectatio
ns2.0
03.0
04.0
05.0
06.00
7.008.00
9.00
Met ex
pecta
tions c
ompletely
0%
20%
40%
60%
80%
100%
4% 1% 1% 3% 7% 4% 9%23%
13%
34%
Q18 Considering all of the expectations you may have had about the services provided by VT DVR to what extent have these services met
your expectations?
55

2003 2006 2008 20110.0%
20.0%
40.0%
60.0%
80.0%
100.0%78.1% 83.5% 84.3% 84.0%
Q18 Considering all of the expectations you may have had about the services provided by VT DVR to what extent have these services met
your expectations?(Rated on a 10 point scale from 1 = met none of my expectations to 10
= completely met expectations; %
Year of Survey Administration
56

Considering all of the expectations you may have had about the services provided by the Vermont Division of Vocational Rehabilitation, to what extent
have these services met your expectations?
%Sig Diff
2011Sig Diff Trend
Year of Administration 2003 78.1% 2006 83.5% 2008 84.3% 2011 84.0% Region 2008 Burlington/Middlebury 81.2% St. Albans/Newport 84.0% St. Johnsbury/White River Junction 83.2% Barre/Morrisville 88.5% Rutland/Bennington 85.2% Springfield/Brattleboro 84.6% Rural and Agricultural VR 81.8% 2011 Burlington/Middlebury 77.9% St. Albans/Newport 84.2% St. Johnsbury/White River Junction 79.8% Barre/Morrisville 85.1% Rutland/Bennington 87.3% Springfield/Brattleboro 88.2% Rural and Agricultural VR 84.1%
(% of respondents rating 6 to 10 on ten point satisfaction scale)
57
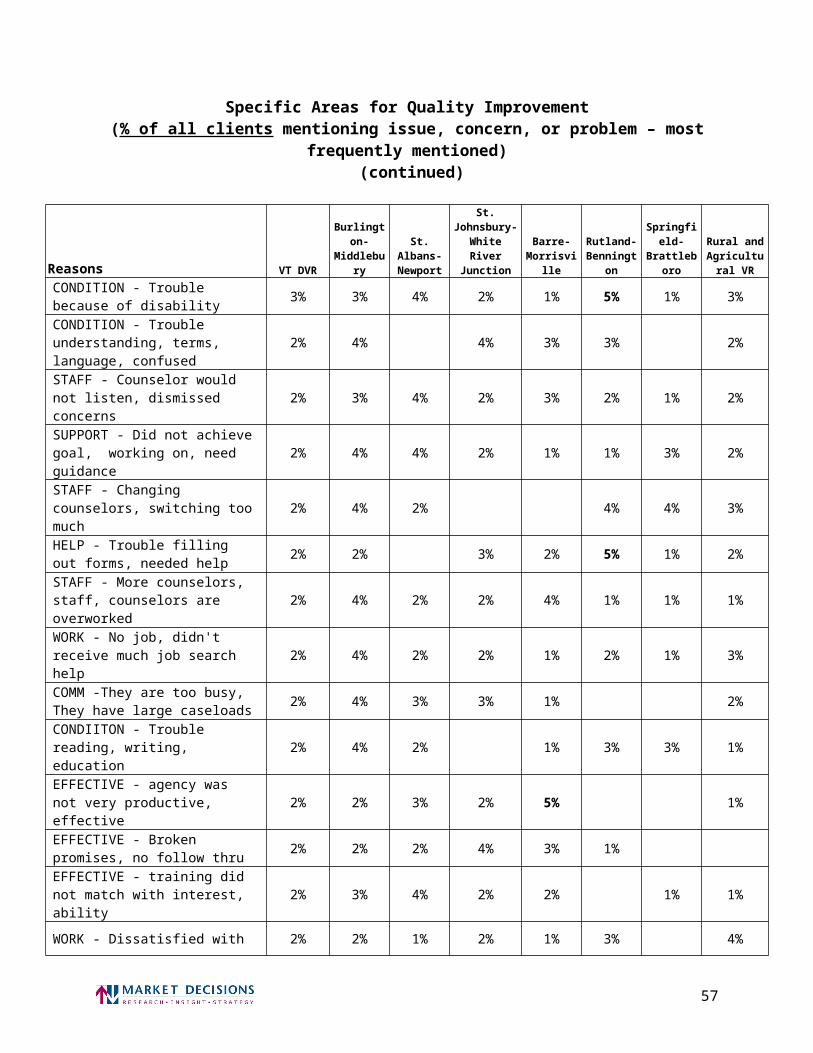
Comments:
Clients were asked to evaluate how well the services provided met their expectations. This evaluation was on a ten point scale where 1 indicates that the services did not at all meet their expectations and 10 indicates that the services met their expectations completely. Eighty-four percent of clients indicated that the services provided by the Vermont Division of Vocational Rehabilitation met their expectations to some degree (indicating six to ten on the ten point scale). This is comparable to the percentage in 2008.
Among all clients, the median score on this ten point scale was 7.9.
To what extent have these services met your expectations?(average scores)
AverageVT DVR 7.9Burlington-Middlebury 7.8St. Albans-Newport 7.8St. Johnsbury-White River Junction 7.9Barre-Morrisville 8.1Rutland-Bennington 7.9Springfield-Brattleboro 7.8Rural and Agricultural VR 8.2
Significant Differences by Group:
Clients aged 45 to 54 are significantly less likely to indicate program met expectations than other VT DVR clients (74% rating as 6 through 10).
58

In 2011, 82% of clients indicated that the services provided through the Vermont Division of Vocational Rehabilitation compared favorably to the services offered through their ideal program.
VT DVR Burlington-Middlebury
St. Albans-Newport
St. Johnsbury-
White River
Junction
Barre-Morrisville
Rutland-Bennington
Springfield-Brattleboro
Rural and Agricultural
VR
Not at all ideal 5% 2% 6% 9% 9% 5% 2% 1%2 2% 4% 1% 1% 1% 1% 2% 3 1% 1% 2% 1% 5%4 2% 5% 3% 1% 2% 3% 2%5 8% 9% 7% 9% 7% 11% 6% 3%6 5% 9% 7% 4% 3% 2% 3% 3%7 8% 2% 9% 8% 12% 6% 9% 9%8 23% 25% 20% 12% 18% 24% 34% 16%9 14% 13% 11% 17% 15% 17% 12% 14%Completely ideal 33% 31% 36% 39% 32% 31% 30% 48%Total 100% 100% 100% 100% 100% 100% 100% 100%
Results by region for 2011
Not at all ideal 2.00 3.00 4.00 5.00 6.00 7.00 8.00 9.00 Completely ideal0%
20%
40%
60%
80%
100%
5% 2% 1% 2%8% 5% 8%
23%14%
33%
Q19 Now I want you to think of the ideal program for people in your circumstances. How well do you think the services you received from
VT DVR compared to the services that would be offered by your IDEAL program?
59

2003 2006 2008 20110.0%
20.0%
40.0%
60.0%
80.0%
100.0%78.1% 79.4% 82.6% 82.1%
Q19 Now I want you to think of the ideal program for people in your circumstances. How well do you think the services you received from
VT DVR compared to the services that would be offered by your IDEAL program?
(Rated on a 10 point scale from 1 = not id
Year of Survey Administration
60

How well do you think the services you received from the Vermont Division of Vocational Rehabilitation compared to the services that would be offered by your IDEAL program?
%Sig Diff
2011Sig Diff Trend
Year of Administration 2003 78.1% 2006 79.4% 2008 82.6% 2011 82.1% Region 2008 Burlington/Middlebury 79.7% St. Albans/Newport 84.7% St. Johnsbury/White River Junction 84.6% Barre/Morrisville 83.0% Rutland/Bennington 80.8% Springfield/Brattleboro 84.9% Rural and Agricultural VR 76.8% 2011 Burlington/Middlebury 79.5% St. Albans/Newport 82.1% St. Johnsbury/White River Junction 80.1% Barre/Morrisville 80.9% Rutland/Bennington 80.4% Springfield/Brattleboro 87.7% Rural and Agricultural VR 89.1%
(% of respondents rating 6 to 10 on ten point satisfaction scale)
61

Comments:
Clients were asked to evaluate how well the services provided compared to the services that would be offered through their ideal program. This evaluation was on a ten point scale where 1 indicates that the services were not at all ideal (did not compare favorably to their ideal program) and 10 indicates that the services were completely ideal (compared very favorably to their ideal program). In 2011, 82% of clients indicated that the services provided by the Vermont Division of Vocational Rehabilitation compared favorably to their ideal program (indicating six to ten on the ten point scale). This is comparable to the percentage in 2008.
Among all clients, the median score on this ten point scale was 7.9.
How well do you think the services you received compared to the services that would be offered by your IDEAL program?
(average scores)
AverageVT DVR 7.8Burlington-Middlebury 7.6St. Albans-Newport 7.7St. Johnsbury-White River Junction 7.8Barre-Morrisville 7.8Rutland-Bennington 8.1Springfield-Brattleboro 7.8Rural and Agricultural VR 8.4
62

Among all clients, the consumer satisfaction index was 77.0 in 2011.
2003 2006 2008 20110.0
20.0
40.0
60.0
80.0
100.0
74.5 76.4 77.9 77.0
Consumer Satisfaction Index
Year of Survey Administration
63

Consumer Satisfaction Index
MeanSig Diff
2011Sig Diff Trend
Year of Administration 2003 74.5 2006 76.4 2008 77.9 2011 77.0 Region 2008 Burlington/Middlebury 77.1 St. Albans/Newport 78.7 St. Johnsbury/White River Junction 78.6 Barre/Morrisville 79.3 Rutland/Bennington 78.2 Springfield/Brattleboro 76.6 Rural and Agricultural VR 78.5 2011 Burlington/Middlebury 76.5 St. Albans/Newport 76.9 St. Johnsbury/White River Junction 75.4 Barre/Morrisville 74.8 Rutland/Bennington 78.1 Springfield/Brattleboro 77.7 Rural and Agricultural VR 84.7 +
(averages)
64

Comments:
The consumer satisfaction index provides an outcome measure of clients’ satisfaction with the agency and the services the agency provides. The index is calculated using three survey questions:
1. Q17. Please rate your satisfaction on a scale from one to ten where 1 is very dissatisfied and 10 means you are very satisfied, how satisfied would you say you are with the services provided by the Vermont Division of Vocational Rehabilitation?
2. Q18. Considering all of the expectations you may have had about the services provided by the Vermont Division of Vocational Rehabilitation, to what extent have these services met your expectations?
3. Q19. Now I want you to think of the ideal program for people in your circumstances. How well do you think the services you received from the Vermont Division of Vocational Rehabilitation compared to the services that would be offered by your IDEAL program?
The index is calculated using the following formula:
CSI= (((Q17-1)/9)*100*.334) + (((Q18-1)/9)*100*.333) + (((Q19-1)/9)*100*.334).
This calculation results in an index score with values that can range from 0 to 100.
Among all clients, the consumer satisfaction index was 77.0. This is comparable to the index score of 77.9 from 2008.
Significant Difference by Group:
Rural and Agricultural VR (CSI is significantly higher than for VT DVR as a whole)
65

In 2011, 95% percent of clients would tell their friends with similar disabilities to go to the Vermont Division of Vocational Rehabilitation for help.
VT DVR Burlington-Middlebury
St. Albans-Newport
St. Johnsbury-
White River
Junction
Barre-Morrisville
Rutland-Bennington
Springfield-Brattleboro
Rural and Agricultural
VR
Yes 95% 95% 92% 93% 94% 95% 98% 97%No 5% 5% 8% 7% 6% 5% 2% 3%Total 100% 100% 100% 100% 100% 100% 100% 100%
Results by region for 2011
Yes No0%
20%
40%
60%
80%
100%95%
5%
Q20 All things considered, would you tell your friends with disabilities to go to VT DVR program for help?
66

2003 2006 2008 20110.0%
20.0%
40.0%
60.0%
80.0%
100.0% 93.6% 93.2% 95.2% 94.8%
Q20 All things considered, would you tell your friends with disabilities to go to VT DVR program for help?
(% yes)
Year of Survey Administration
67

All things considered, would you tell your friends with disabilities to go to the Vermont Division of Vocational Rehabilitation program for help?
%Sig Diff
2011Sig Diff Trend
Year of Administration 2003 93.6% 2006 93.2% 2008 95.2% 2011 94.8% Region 2008 Burlington/Middlebury 97.3% St. Albans/Newport 96.9% St. Johnsbury/White River Junction 93.1% Barre/Morrisville 98.3% Rutland/Bennington 94.3% Springfield/Brattleboro 92.8% Rural and Agricultural VR 94.2% 2011 Burlington/Middlebury 94.7% St. Albans/Newport 91.7% St. Johnsbury/White River Junction 92.8% Barre/Morrisville 93.7% Rutland/Bennington 95.4% Springfield/Brattleboro 98.5% Rural and Agricultural VR 96.7%
(% of respondents indicating yes)
68

Comments:
In 2011, 95% of clients indicated that they would tell their friends with similar disabilities to go to the Vermont Division of Vocational Rehabilitation for help. This is comparable to the percentage in 2008.
69

Evaluation of Specific Aspects of the Agency and the Services Provided
In 2011, 91% of clients were very satisfied or satisfied with their control and involvement in the vocational rehabilitation experience.
In 2011, 90% of clients were very satisfied or satisfied with their choice of a vocational goal.
In 2011, 88% of clients were very satisfied or satisfied with the choice of services available.
In 2011, 90% of clients were very satisfied or satisfied with the choice of service providers.
In 2011, 90% of clients were very satisfied or satisfied with the information they were given about the choices they had.
In 2011, 88% of clients were very satisfied or satisfied with the time it took counselors to answer their questions or address their concerns.
In 2011, 93%, of clients found completing the application for vocational rehabilitation services very or somewhat easy.
In 2011, 92% of clients indicated that the staff were very or somewhat helpful in helping them to achieve their vocational rehabilitation goals.
In 2011, 89% of clients indicated that it was very or somewhat easy to contact their vocational rehabilitation counselor.
In 2006, nearly all clients (99%) found the agency office very or somewhat accessible to someone with their type of disability.
In 2011, 72% of clients indicated that the services they received helped them become more financially independent.
In 2011, 97% of clients indicated that the Vermont Division of Vocational Rehabilitation staff treated them with dignity and respect.
70

In 2011, 72% of clients indicated that the agency helped them reach their job goals.
71

In 2011, 91% of clients were very satisfied or satisfied with their control and involvement in the vocational rehabilitation experience.
VT DVR Burlington-Middlebury
St. Albans-Newport
St. Johnsbury-
White River
Junction
Barre-Morrisville
Rutland-Bennington
Springfield-Brattleboro
Rural and Agricultural
VR
Very dissatisfied 2% 2% 3% 2% 1% 3% 1%Dissatisfied 4% 4% 2% 8% 3% 7% 1% 3%Neither satisfied nor dissatisfied 3% 3% 7% 3% 1% 5% 5%
Satisfied 32% 34% 34% 23% 37% 33% 29% 37%Very satisfied 59% 59% 55% 66% 55% 58% 63% 54%Total 100% 100% 100% 100% 100% 100% 100% 100%
Results by region for 2011
Very dissa
tisfied
Dissatisf
ied
Neither s
atisfied
nor dissa
tisfied Satis
fied
Very sat
isfied
0%20%40%60%80%
100%
2% 4% 3%
32%59%
Q04 How satisfied were you with your control and involvement in your vocational rehabilitation experience?
72

2003 2006 2008 20110.0%
20.0%
40.0%
60.0%
80.0%
100.0% 86.6% 89.8% 88.7% 91.0%
Q04 How satisfied were you with your control and in-volvement in your vocational rehabilitation experience?
(% very satisfied or satisfied)
Year of Survey Administration
73

How satisfied were you with your control and involvement in your vocational rehabilitation experience?
%Sig Diff
2011Sig Diff Trend
Year of Administration 2003 86.6% 2006 89.8% 2008 88.7% 2011 91.0% Region 2008 Burlington/Middlebury 87.3% St. Albans/Newport 90.6% St. Johnsbury/White River Junction 89.3% Barre/Morrisville 90.6% Rutland/Bennington 85.4% Springfield/Brattleboro 89.4% Rural and Agricultural VR 93.7% 2011 Burlington/Middlebury 92.6% St. Albans/Newport 88.5% St. Johnsbury/White River Junction 89.2% Barre/Morrisville 92.1% Rutland/Bennington 90.8% Springfield/Brattleboro 91.7% Rural and Agricultural VR 91.4%
(% of respondents indicating satisfied or very satisfied)
74

Comments:
In 2011, 91% of clients were very satisfied or satisfied with their control and involvement in their vocational rehabilitation experience. This is an increase from 2008, though not statistically significant.
In 2011, 59% of clients indicated that they were very satisfied with their control and involvement, while 32% were satisfied. Three percent of clients indicated that they were neither satisfied nor dissatisfied with their control and involvement, while only 6% indicated some level of dissatisfaction (4% dissatisfied and 2% very dissatisfied).
Significant Differences by Group:
Clients aged 25 to 34 are significantly more likely to be satisfied than other VT DVR clients (96% very satisfied or satisfied).
Among the 9% of clients that were not satisfied with their control and involvement in the vocational rehabilitation experience:
25% indicated no services were provided or the services were of little help. 25% indicated they needed more support or guidance. 15% indicated did not find employment.
75

How satisfied were you with your control and involvement in your vocational rehabilitation experience?
Primary Reasons not Satisfied
VT DVR Burlington-Middlebury
St. Albans-Newport
St. Johnsbury
-White River
Junction
Barre-Morrisville
Rutland-Bennington
Springfield-
Brattleboro
Rural and Agricultural
VR
SUPPORT - No services provided, not much help 25% 21% 33% 48% 21% 21% 7% 28%
SUPPORT - Need more guidance, support 25% 36% 27% 50% 17% 17% 63%
WORK- Did not receive employment, Could not find me a job 15% 54% 6% 13% 19% 7% 14%
COMM - Counselor did not return calls, No follow up 13% 4% 11% 51% 23%
STAFF - Counselor would not listen, dismissed concerns 9% 15% 14% 8% 12% 11%
COMM - Hard to reach staff 7% 19% 4% 17%
EXPAND - more info needed, need to broaden programs 5% 18% 9% 8%
WAIT - Haven't received services yet 5% 30% Case was dropped, stopped receiving services 5% 28%
EFFECTIVE - Fight to get services, help is limited 5% 5% 4% 22% 12%
CONTROL - No control over experience, told me what to do 4% 10% 8% 12%
STAFF - Listen to client, understand needs, wants, ability 3% 21%
STAFF - Need someone with me. 2% 12%
WORK - No job, didn't receive much job search help 2% 12%
INFO - Not enough, unaware of available services 2% 15%
STAFF - staff attitude, disrespect, unprofessional 1% 10%
EFFECTIVE - Program did not meet expectations 0% 14%
STAFF - Counselor was ok, helpful, positive 0% 14%
Note: columns listed as “0%” indicated instances where less than 0.5% gave this response. Blanks represent cases where no client gave this response.
76

In 2011, 90% of clients were very satisfied or satisfied with their choice of a vocational goal.
VT DVR Burlington-Middlebury
St. Albans-Newport
St. Johnsbury-
White River
Junction
Barre-Morrisville
Rutland-Bennington
Springfield-Brattleboro
Rural and Agricultural
VR
Very dissatisfied 3% 3% 3% 2% 7% 2% 2% 1%Dissatisfied 4% 3% 5% 8% 5% 3% 3% 4%Neither satisfied nor dissatisfied 3% 7% 4% 2% 2% 4% 1% 7%
Satisfied 38% 33% 32% 33% 36% 45% 43% 40%Very satisfied 52% 54% 57% 56% 50% 47% 52% 47%Total 100% 100% 100% 100% 100% 100% 100% 100%
Results by region for 2011
Very dissa
tisfied
Dissatisf
ied
Neither s
atisfied
nor dissa
tisfied Satis
fied
Very sat
isfied
0%20%40%60%80%
100%
3% 4% 3%
38%52%
Q05 How satisfied were you with your choice of a vocational goal?
77

2003 2006 2008 20110.0%
20.0%
40.0%
60.0%
80.0%
100.0%86.7% 90.1% 89.0% 89.6%
Q05 How satisfied were you with your choice of a vocational goal?(% very satisfied or satisfied)
Year of Survey Administration
78

How satisfied were you with your choice of a vocational goal?
%Sig Diff
2011Sig Diff Trend
Year of Administration 2003 86.7% 2006 90.1% 2008 89.0% 2011 89.6% Region 2008 Burlington/Middlebury 93.4% St. Albans/Newport 90.1% St. Johnsbury/White River Junction 83.0% Barre/Morrisville 87.3% Rutland/Bennington 89.3% Springfield/Brattleboro 88.4% Rural and Agricultural VR 90.0% 2011 Burlington/Middlebury 87.0% St. Albans/Newport 88.8% St. Johnsbury/White River Junction 88.1% Barre/Morrisville 86.0% Rutland/Bennington 91.7% Springfield/Brattleboro 94.5% Rural and Agricultural VR 87.8%
(% of respondents indicating satisfied or very satisfied)
79

Comments:
In 2011, 90% of clients were very satisfied or satisfied with their choice of a vocational goal. This is comparable to the percentage in 2008.
In 2011, 52% of clients indicated that they were very satisfied with the choice of a vocational goal, while 38% were satisfied. Three percent of clients indicated that they were neither satisfied nor dissatisfied with the choice of a vocational goal, while only 7% indicated some level of dissatisfaction (4% dissatisfied and 3% very dissatisfied).
Among the 10% of clients that were not satisfied with their choice of a vocational goal:
26% indicated they could not find a job. 20% needed more guidance or support. 17% indicated no services were provided or were of little help.
80

How satisfied were you with your choice of a vocational goal?Primary Reasons not Satisfied
VT DVRBurlington-Middlebur
y
St. Albans-Newport
St. Johnsbury
-White River
Junction
Barre-Morrisville
Rutland-Bennington
Springfield-
Brattleboro
Rural and Agricultural
VR
WORK- Did not receive employment, Could not find me a job 26% 40% 36% 17% 35% 10% 12% 9%
SUPPORT - Need more guidance, support 20% 17% 15% 13% 22% 46% 21%
SUPPORT - No services provided, not much help 17% 4% 35% 43% 12% 11% 10%
EFFECTIVE - training did not match with interest, ability 8% 6% 4% 18% 28% 10%
SUPPORT - More services needed to help with career goals 7% 23% 5% 13%
COMM - No follow up, should follow up more often 5% 9% 21%
NEGATIVE - Dissatisfied with services and counselor 4% 16% 11%
EFFECTIVE - No goal set 4% 19%
WORK - Lost job 3% 21%
EFFECTIVE - Didn't establish any job goals 3% 4% 14%
EFFECTIVE - agency did not follow through original plan 3% 20%
WORK -No job yet-still working on achieving goals 3% 6% 13% 11%
NOT ELIGIBLE - Denied assistance 3% 28%
EFFECTIVE - Never received help 3% 18% CONTROL - More control over VR experience, services 3% 11%
EDUCATION- Did not receive needed education, training 2% 6% 10%
EFFECTIVE - Speed up process of obtaining services 2% 14%
WORK - No job, didn't receive much job search help 2% 14%
EFFECTIVE - A lot of ideas, but no action 2% 12%
WORK - Disability, health makes it difficult to find work 0% 11%
Note: columns listed as “0%” indicated instances where less than 0.5% gave this response. Blanks represent cases where no client gave this response.
81

In 2011, 88% of clients were very satisfied or satisfied with the choice of services available.
VT DVR Burlington-Middlebury
St. Albans-Newport
St. Johnsbury-
White River
Junction
Barre-Morrisville
Rutland-Bennington
Springfield-Brattleboro
Rural and Agricultural
VR
Very dissatisfied 3% 2% 4% 3% 5% 2% 2% 1%Dissatisfied 5% 9% 2% 5% 5% 3% 3% 7%Neither satisfied nor dissatisfied 5% 6% 6% 5% 5% 5% 3% 7%
Satisfied 35% 30% 41% 34% 35% 34% 39% 34%Very satisfied 52% 53% 46% 54% 50% 56% 52% 51%
Total 100% 100% 100% 100% 100% 100% 100% 100%
Results by region for 2011
Very dissa
tisfied
Dissatisf
ied
Neither s
atisfied
nor dissa
tisfied Satis
fied
Very sat
isfied
0%20%40%60%80%
100%
3% 5% 5%
35%52%
Q06 How satisfied were you with the choice of services that were available?
82

2003 2006 2008 20110.0%
20.0%
40.0%
60.0%
80.0%
100.0%83.8% 84.9% 88.1% 87.5%
Q06 How satisfied were you with the choice of services that were available?
(% very satisfied or satisfied)
Year of Survey Administration
83

How satisfied were you with the choice of services that were available?
%Sig Diff
2011Sig Diff Trend
Year of Administration 2003 83.8% 2006 84.9% 2008 88.1% 2011 87.5% Region 2008 Burlington/Middlebury 84.9% St. Albans/Newport 91.5% St. Johnsbury/White River Junction 87.1% Barre/Morrisville 86.0% Rutland/Bennington 89.2% Springfield/Brattleboro 89.2% Rural and Agricultural VR 90.0% 2011 Burlington/Middlebury 82.9% St. Albans/Newport 87.9% St. Johnsbury/White River Junction 88.0% Barre/Morrisville 85.1% Rutland/Bennington 90.1% Springfield/Brattleboro 91.3% Rural and Agricultural VR 84.9%
(% of respondents indicating satisfied or very satisfied)
84

Comments:
In 2011, 88% percent of clients were very satisfied or satisfied with the choice of services available. This is comparable to the percentage in 2008.
In 2006, 52% of clients indicated that they were very satisfied with the choice of services, while 35% were satisfied. Five percent of clients indicated that they were neither satisfied nor dissatisfied with the choice of services available, while only 8% indicated some level of dissatisfaction (5% dissatisfied and 3% very dissatisfied).
Among the 13% of clients that were not satisfied with the choice of services available:
17% indicated that no services were provided or were of little help. 17% indicated they needed more guidance and support. 13% were not aware of available services.
85

How satisfied were you with the choice of services that were available?Primary Reasons not Satisfied
VT DVRBurlington-Middlebur
y
St. Albans-Newport
St. Johnsbury
-White River
Junction
Barre-Morrisville
Rutland-Bennington
Springfield-
Brattleboro
Rural and Agricultural
VR
SUPPORT - No services provided, not much help 17% 5% 14% 40% 21% 27% 7% 14%
SUPPORT - Need more guidance, support 17% 17% 15% 24% 12% 35% 19%
INFO - Not enough, unaware of available services 13% 6% 5% 13% 27% 19% 7% 18%
WORK- Did not receive employment, Could not find me a job 12% 11% 31% 8% 5% 17% 7%
EXPAND - More services options, more programs 9% 20% 3% 5% 21%
NEGATIVE - Dissatisfied with services and counselor 8% 10% 4% 18% 11% 6%
EFFECTIVE - training did not match with interest, ability 8% 17% 24% 7%
EFFECTIVE - agency was not very productive, effective 8% 5% 10% 15% 18%
EXPAND - more info needed, need to broaden programs 5% 11% 5% 11%
EXPAND - Denied, stopped services due to lack of funding 4% 6% 8% 10% 7%
EFFECTIVE - No help, very little help 3% 10% 16%
EXPAND - More funds needed to expand and improve programs 3% 8% 10%
CONTROL - Felt pushed to do job, not what was wanted 2% 16%
WORK - Dissatisfied with job, not what they wanted 2% 16%
EFFECTIVE - used own resources to get job, training 2% 17%
STAFF - More caring, understanding and encouraging staff 2% 17%
WORK - Had to find job, services on own 2% 17%
COMM - Counselor did not return calls, No follow up 2% 4% 14%
EFFECTIVE - Did not receive much help with goal 1% 10%
COMM - No follow through, get run around, nothing done 1% 11%
Note: columns listed as “0%” indicated instances where less than 0.5% gave this response. Blanks represent cases where no client gave this response.
86

In 2011, 90% of clients were very satisfied or satisfied with the choice of service providers.
VT DVR Burlington-Middlebury
St. Albans-Newport
St. Johnsbury-
White River
Junction
Barre-Morrisville
Rutland-Bennington
Springfield-Brattleboro
Rural and Agricultural
VR
Very dissatisfied 2% 3% 3% 4% 2% 1% 3%Dissatisfied 5% 4% 7% 7% 6% 5% 5% 1%Neither satisfied nor dissatisfied 2% 2% 1% 3% 1% 4% 1% 3%
Satisfied 30% 30% 34% 25% 31% 32% 30% 32%Very satisfied 60% 63% 55% 62% 57% 58% 63% 62%Total 100% 100% 100% 100% 100% 100% 100% 100%
Results by region for 2011
Very dissa
tisfied
Dissatisf
ied
Neither s
atisfied
nor dissa
tisfied Satis
fied
Very sat
isfied
0%20%40%60%80%
100%
2% 5% 2%
30%
60%
Q07 How satisfied were you with the choice of service providers?
87

2003 2006 2008 20110.0%
20.0%
40.0%
60.0%
80.0%
100.0%86.2% 88.4% 90.3% 90.3%
Q07 How satisfied were you with the choice of service providers?(% very satisfied or satisfied)
Year of Survey Administration
88

How satisfied were you with the choice of service providers?
%Sig Diff
2011Sig Diff Trend
Year of Administration 2003 86.2% 2006 88.4% 2008 90.3% 2011 90.3% Region 2008 Burlington/Middlebury 90.3% St. Albans/Newport 90.4% St. Johnsbury/White River Junction 89.3% Barre/Morrisville 96.3% Rutland/Bennington 85.1% Springfield/Brattleboro 92.1% Rural and Agricultural VR 91.1% 2011 Burlington/Middlebury 93.0% St. Albans/Newport 89.2% St. Johnsbury/White River Junction 87.1% Barre/Morrisville 88.5% Rutland/Bennington 89.3% Springfield/Brattleboro 92.8% Rural and Agricultural VR 93.1%
(% of respondents indicating satisfied or very satisfied)
89

Comments:
In 2011, 90% of clients were very satisfied or satisfied with the choice of providers. This is comparable to the percentage in 2008.
In 2011, 60% of clients indicated that they were very satisfied with the choice of services, while 30% were satisfied. Two percent of clients indicated that they were neither satisfied nor dissatisfied with the choice of services available, while only 7% indicated some level of dissatisfaction (5% dissatisfied and 2% very dissatisfied).
Among the 9% of clients that were not satisfied with the choice of service providers:
25% needed more support or guidance. 23% indicated that no services were provided or were of little help. 17% indicated their counselor did not return calls or follow up. 15% were dissatisfied with the services and their counselor.
90

How satisfied were you with the choice of service providers?Primary Reasons not Satisfied
VT DVRBurlington-Middlebur
y
St. Albans-Newport
St. Johnsbury
-White River
Junction
Barre-Morrisville
Rutland-Bennington
Springfield-
Brattleboro
Rural and Agricultural
VR
SUPPORT - Need more guidance, support 25% 27% 18% 19% 39% 28% 21% 14%
SUPPORT - No services provided, not much help 23% 23% 30% 33% 23% 23% 13%
COMM - Counselor did not return calls, No follow up 17% 10% 7% 18% 12% 32% 13% 21%
NEGATIVE - Dissatisfied with services and counselor 15% 9% 4% 41% 15% 21% 13%
STAFF - Counselor would not listen, dismissed concerns 12% 45% 9% 16% 7% 30%
WORK- Did not receive employment, Could not find me a job 10% 23% 21% 7% 7% 5%
STAFF - Changing counselors, switching too much 9% 17% 19% 17%
STAFF - staff attitude, disrespect, unprofessional 5% 10% 6% 7% 8%
EXPAND - More services options, more programs 4% 16% 4% 8%
INFO - clear, detailed information about services offered 4% 11% 9%
STAFF - Counselors make more effort, client does work 3% 10% 7%
REFERRED - Referred to another agency 3% 21%
WORK - completed testing, training but still no job 3% 6% 10%
COMM -Person never available (meetings, out of office) 3% 20%
STAFF - Poor client-counselor relationship 2% 12%
EFFECTIVE - Program did not meet expectations 2% 11%
WORK - Had to find job, services on own 2% 10%
WORK - Unable or too difficult to work due to disability 2% 10%
STAFF - Counselor too busy, pushed aside 0% 17%
STAFF - More supervision of staff, management of services 0% 11%
Note: columns listed as “0%” indicated instances where less than 0.5% gave this response. Blanks represent cases where no client gave this response.
91

In 2011, 90% of clients were very satisfied or satisfied with the information they were given about the choices they had.
VT DVR Burlington-Middlebury
St. Albans-Newport
St. Johnsbury-
White River
Junction
Barre-Morrisville
Rutland-Bennington
Springfield-Brattleboro
Rural and Agricultural
VR
Very dissatisfied 2% % 3% 2% 4% 3% 2% 2%Dissatisfied 5% 6% 2% 9% 5% 5% 3% 3%Neither satisfied nor dissatisfied 3% 5% 2% 4% 2% 4% 3% 4%
Satisfied 36% 36% 38% 34% 38% 32% 37% 37%Very satisfied 54% 53% 54% 52% 51% 57% 55% 54%
Total 100% 100% 100% 100% 100% 100% 100% 100%
Results by region for 2011
Very dissa
tisfied
Dissatisf
ied
Neither s
atisfied
nor dissa
tisfied Satis
fied
Very sat
isfied
0%20%40%60%80%
100%
2% 5% 3%
36%54%
Q08 How satisfied were you with the kind and amount of information you were given about the choices you had?
92

2003 2006 2008 20110.0%
20.0%
40.0%
60.0%
80.0%
100.0%83.8% 85.2% 88.3% 89.5%
Q08 How satisfied were you with the kind and amount of information you were given about the choices you had?
(% very satisfied or satisfied)
Year of Survey Administration
93

How satisfied were you with the kind and amount of information you were given about the choices you had?
%Sig Diff
2011Sig Diff Trend
Year of Administration 2003 83.8% 2006 85.2% 2008 88.3% 2011 89.5% U2003 Region 2008 Burlington/Middlebury 88.6% St. Albans/Newport 86.7% St. Johnsbury/White River Junction 85.6% Barre/Morrisville 93.7% Rutland/Bennington 87.9% Springfield/Brattleboro 87.9% Rural and Agricultural VR 87.6% 2011 Burlington/Middlebury 88.6% St. Albans/Newport 92.7% St. Johnsbury/White River Junction 85.7% Barre/Morrisville 89.0% Rutland/Bennington 88.4% Springfield/Brattleboro 92.0% Rural and Agricultural VR 90.9%
(% of respondents indicating satisfied or very satisfied)
94

Comments:
In 2011, 90% of clients were very satisfied or satisfied with the information they were provided about their choices. This percentage has been trending higher since 2003.
In 2011, 54% of clients indicated that they were very satisfied with the information provided, while 36% were satisfied. Three percent of clients indicated that they were neither satisfied nor dissatisfied with the information provided, while only 8% indicated some level of dissatisfaction (5% dissatisfied and 3% very dissatisfied).
Significant Differences by Group:
Clients under age 25 are significantly more likely to be satisfied than other VT DVR clients (96% very satisfied or satisfied).
Among the 11% of clients that were not satisfied with the information they were provided about their choices:
21% needed more support or guidance. 16% indicated they were unaware of available services. 16% indicated that no services were provided or services were of little help.
95

How satisfied were you with the kind and amount of information you were given about the choices you had?
Primary Reasons not Satisfied
VT DVRBurlington-Middlebur
y
St. Albans-Newport
St. Johnsbury
-White River
Junction
Barre-Morrisville
Rutland-Bennington
Springfield-
Brattleboro
Rural and Agricultural
VR
SUPPORT - Need more guidance, support 21% 13% 19% 13% 30% 39% 6% 31%
INFO - Not enough, unaware of available services 16% 9% 18% 41% 20% 7% 15%
SUPPORT - No services provided, not much help 16% 4% 38% 20% 17% 13% 14% 19%
NEGATIVE - Dissatisfied with services and counselor 12% 8% 23% 13% 8% 10% 18% 12%
EXPAND - more info needed, need to broaden programs 11% 14% 14% 19% 18% 12%
EFFECTIVE - training did not match with interest, ability 8% 26% 9% 8% 12%
WORK- Did not receive employment, Could not find me a job 7% 4% 9% 14% 22%
STAFF - Listen to client, understand needs, wants, ability 7% 6% 8% 7% 24%
INFO - Not enough, unaware of employment choices 7% 20% 15% 10%
EFFECTIVE - counselor was holding out, not giving full options 6% 4% 7% 7% 17%
INFO - Not enough information provided 5% 7% 7% 17%
INFO - clear, detailed information about services offered 3% 9% 14%
COMM - Counselor did not return calls, No follow up 3% 6% 12%
CONTROL - More control over VR experience, services 3% 18%
STAFF - Honest counselors, clear about what can be done 2% 17%
EFFECTIVE - used own resources to get job, training 2% 10%
COMM - Better communication needed 2% 14%
EXPAND - Funding problems, No money for services 0% 11%
Note: columns listed as “0%” indicated instances where less than 0.5% gave this response. Blanks represent cases where no client gave this response.
96

In 2011, 88% of clients were very satisfied or satisfied with the time it took counselors to answer their questions or address their concerns.
VT DVR Burlington-Middlebury
St. Albans-Newport
St. Johnsbury-
White River
Junction
Barre-Morrisville
Rutland-Bennington
Springfield-Brattleboro
Rural and Agricultural
VR
Very dissatisfied 3% 2% 3% 3% 6% 4% 2% 1%Dissatisfied 5% 5% 4% 10% 7% 5% 3% 2%Neither satisfied nor dissatisfied 4% 5% 3% 6% 4% 3% 3% 3%
Satisfied 30% 36% 31% 26% 26% 22% 39% 29%Very satisfied 58% 54% 58% 55% 58% 66% 52% 65%
Total 100% 100% 100% 100% 100% 100% 100% 100%
Results by region for 2011
Very dissa
tisfied
Dissatisf
ied
Neither s
atisfied
nor dissa
tisfied Satis
fied
Very sat
isfied
0%20%40%60%80%
100%
3% 5% 4%30%
58%
Q09 How satisfied were you with how long it took your counselor to answer your questions or address your concerns?
97

2003 2006 2008 20110.0%
20.0%
40.0%
60.0%
80.0%
100.0%85.3% 88.3% 86.6% 87.7%
Q09 How satisfied were you with how long it took your counselor to answer your questions or address your concerns?
(% very satisfied or satisfied)
Year of Survey Administration
98

How satisfied were you with how long it took your counselor to answer yourquestions or address your concerns?
%Sig Diff
2011Sig Diff Trend
Year of Administration 2003 85.3% 2006 88.3% 2008 86.6% 2011 87.7% Region 2008 Burlington/Middlebury 87.7% St. Albans/Newport 83.6% St. Johnsbury/White River Junction 90.8% Barre/Morrisville 92.8% Rutland/Bennington 83.8% Springfield/Brattleboro 84.8% Rural and Agricultural VR 85.1% 2011 Burlington/Middlebury 89.1% St. Albans/Newport 89.5% St. Johnsbury/White River Junction 80.7% Barre/Morrisville 83.8% Rutland/Bennington 88.0% Springfield/Brattleboro 91.8% Rural and Agricultural VR 93.9%
(% of respondents indicating satisfied or very satisfied)
99

Comments:
In 2011, 88% percent of clients were very satisfied or satisfied with how long it took their counselor to answer their questions or address their concerns. This is an increase from 2008, though not statistically significant.
In 2011, 58% of clients indicated that they were very satisfied with how long it took their counselor to answer questions or address concerns, while 30% were satisfied. Four percent of clients indicated that they were neither satisfied nor dissatisfied with how long it took their counselor to answer questions or address concerns, while only 8% indicated some level of dissatisfaction (5% dissatisfied and 3% very dissatisfied).
Among the 12% of clients that were not satisfied with how long it took their counselor to answer their questions or address their concerns:
30% indicated their counselor did not return calls or follow-up. 24% indicated it was hard to reach staff.
100

How satisfied were you with how long it took your counselor to answer yourquestions or address your concerns?
Primary Reasons not Satisfied
VT DVRBurlington-Middlebur
y
St. Albans-Newport
St. Johnsbury
-White River
Junction
Barre-Morrisville
Rutland-Bennington
Springfield-
Brattleboro
Rural and Agricultural
VR
COMM - Counselor did not return calls, No follow up 30% 51% 15% 23% 14% 51% 19% 34%
COMM - Hard to reach staff 24% 20% 24% 18% 13% 27% 53% 14%
SUPPORT - Need more guidance, support 12% 6% 18% 9% 25% 18% 16%
NEGATIVE - Dissatisfied with services and counselor 12% 15% 6% 5% 5% 28% 6% 53%
SUPPORT - No services provided, not much help 10% 7% 21% 17% 7% 29%
EFFECTIVE - Broken promises, no follow thru 7% 10% 6% 15% 11%
COMM - Time lags to get services, appointments 7% 8% 25% 7%
COMM - Return call wait, too long returning calls 6% 12% 10% 12%
STAFF - Counselor would not listen, dismissed concerns 6% 17% 6% 12% 19%
STAFF - Changing counselors, switching too much 5% 23% 7% 17%
WORK- Did not receive employment, Could not find me a job 5% 19% 5% 10%
STAFF - Counselor too busy, pushed aside 5% 4% 5% 5% 12% 19%
INFO - Not enough, unaware of available services 4% 20% 9%
EFFECTIVE - Speed up process of obtaining services 4% 3% 6% 12%
STAFF - Office/counselor disorganized 2% 12%
STAFF - New counselor, location who meets clients needs 2% 10%
Note: columns listed as “0%” indicated instances where less than 0.5% gave this response. Blanks represent cases where no client gave this response.
101

In 2011, 93%, of clients found completing the application for vocational rehabilitation services very or somewhat easy.
VT DVR Burlington-Middlebury
St. Albans-Newport
St. Johnsbury-
White River
Junction
Barre-Morrisville
Rutland-Bennington
Springfield-Brattleboro
Rural and Agricultural
VR
Very difficult 2% 1% 2% 2% 3% 3% Somewhat difficult 5% 4% 4% 6% 2% 9% 3% 3%Somewhat easy 17% 20% 11% 23% 21% 9% 18% 18%Very easy 76% 76% 82% 72% 74% 78% 76% 78%Total 100% 100% 100% 100% 100% 100% 100% 100%
Results by region for 2011
Very difficult Somewhat difficult Somewhat easy Very easy0%
20%
40%
60%
80%
100%
2% 5%
17%
76%
Q10 How easy was it for you to complete an application for vocational rehabilitation services?
102
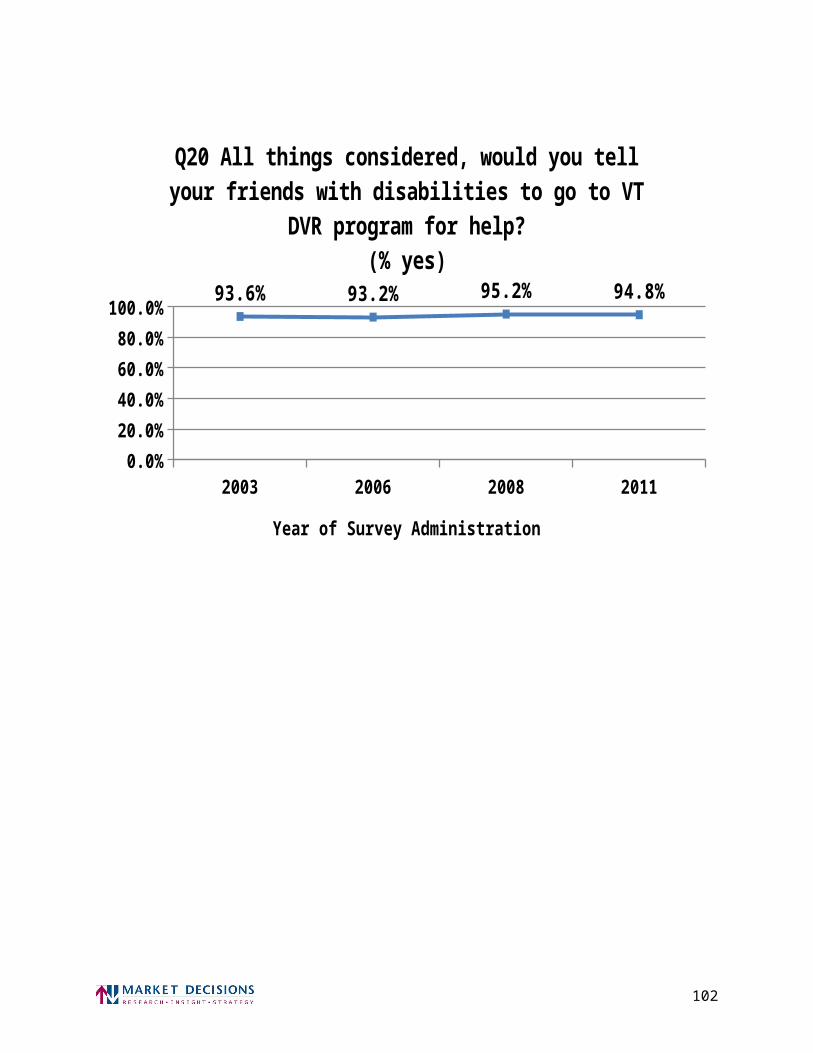
2003 2006 2008 20110.0%
20.0%
40.0%
60.0%
80.0%
100.0% 90.3% 89.8% 89.9% 93.2%
Q10 How easy was it for you to complete an application for vocational rehabilitation services?
(% very or somewhat easy)
Year of Survey Administration
103

How easy was it for you to complete an application for vocational rehabilitation services?
%Sig Diff
2011Sig Diff Trend
Year of Administration 2003 90.3% 2006 89.8% 2008 89.9% 2011 93.2% Region 2008 Burlington/Middlebury 87.2% St. Albans/Newport 87.9% St. Johnsbury/White River Junction 88.8% Barre/Morrisville 96.4% Rutland/Bennington 94.1% Springfield/Brattleboro 84.8% Rural and Agricultural VR 94.0% 2011 Burlington/Middlebury 95.8% St. Albans/Newport 93.6% St. Johnsbury/White River Junction 94.2% Barre/Morrisville 95.3% Rutland/Bennington 87.3% Springfield/Brattleboro 93.9% Rural and Agricultural VR 96.7%
(% of respondents indicating very or somewhat easy)
104

Comments:
In 2011, 93% of clients found the process of completing the application for vocational rehabilitation services very or somewhat easy. This is an increase from 2008, though not statistically significant.
In 2011, 76% of clients indicated that completing the application was very easy, while 17% indicated it was somewhat easy. Only 7% indicated that completing the application for vocational rehabilitation services was difficult (5% somewhat difficult and 2% very difficult).
Among the 7% of clients that indicated that completing the application for vocational rehabilitation services was somewhat or very difficult:
29% required help or indicated their counselor completed paperwork. 13% had trouble filling out forms and needed help. 12% had trouble understanding terms.
How easy was it for you to complete an application for vocational rehabilitation services?Primary Reasons not Easy
VT DVRBurlington-Middlebur
y
St. Albans-Newport
St. Johnsbury
-White River
Junction
Barre-Morrisville
Rutland-Bennington
Springfield-
Brattleboro
Rural and Agricultural
VR
HELP - Someone else helped, counselor did paperwork 29% 30% 21% 30% 24% 5% 58% 44%
HELP - Trouble filling out forms, needed help 13% 10% 12% 12% 30% 8% 9%
CONDITION - Trouble understanding, terms, language, confused 12% 18% 27% 13% 10% 15%
CONDITION - Trouble because of disability 11% 13% 23% 2% 23% 8%
CONDIITON - Trouble reading, writing, education 10% 16% 7% 5% 17% 13% 5%
HARD - Hard, Somewhat difficult, complicated 7% 2% 9% 19% 5% 13%
HARD - Directions, questions could have been clearer 6% 3% 4% 4% 9% 8% 9%
CONDITION - Some questions had to be explained, complicated 3% 3% 14% 3%
Note: columns listed as “0%” indicated instances where less than 0.5% gave this response. Blanks represent cases where no client gave this response.
105

In 2011, 92% of clients indicated that the staff were very or somewhat helpful in helping them to achieve their vocational rehabilitation goals.
VT DVR Burlington-Middlebury
St. Albans-Newport
St. Johnsbury-
White River
Junction
Barre-Morrisville
Rutland-Bennington
Springfield-Brattleboro
Rural and Agricultural
VR
Not at all helpful 5% % 6% 10% 6% 3% 5% 3%Not very helpful 3% 10% 3% 5% 2% 6%Somewhat helpful 10% 8% 13% 9% 15% 9% 8% 9%Very helpful 82% 81% 81% 78% 75% 86% 87% 82%Total 100% 100% 100% 100% 100% 100% 100% 100%
Results by region for 2011
Not at all helpful Not very helpful Somewhat helpful Very helpful0%
20%
40%
60%
80%
100%
5% 3%10%
82%
Q11 How helpful were the staff of VT DVR in helping you achieve your vocational rehabilitation goals?
106

2003 2006 2008 20110.0%
20.0%
40.0%
60.0%
80.0%
100.0% 92.8% 92.1% 91.7% 92.0%
Q11 How helpful were the staff of VT DVR in helping you achieve your vocational rehabilitation goals?
(% very or somewhat helpful)
Year of Survey Administration
107

How helpful were the staff of the Vermont Division of Vocational Rehabilitation in helping you achieve your vocational rehabilitation goals?
%Sig Diff
2011Sig Diff Trend
Year of Administration 2003 92.8% 2006 92.1% 2008 91.7% 2011 92.0% Region 2008 Burlington/Middlebury 89.5% St. Albans/Newport 90.9% St. Johnsbury/White River Junction 88.7% Barre/Morrisville 96.2% Rutland/Bennington 90.9% Springfield/Brattleboro 92.9% Rural and Agricultural VR 95.9% 2011 Burlington/Middlebury 89.7% St. Albans/Newport 93.9% St. Johnsbury/White River Junction 86.9% Barre/Morrisville 89.9% Rutland/Bennington 94.9% Springfield/Brattleboro 95.2% Rural and Agricultural VR 90.7%
(% of respondents indicating very or somewhat helpful)
108

Comments:
In 2011, 92% of clients indicated that the staff were very or somewhat helpful in helping them achieve their vocational rehabilitation goals. This is comparable to the percentage in 2008.
In 2011, 82% of clients indicated that the staff were very helpful; while 10% indicated that the staff were somewhat helpful in help them achieve their goals. Only 8% indicated that the staff were not helpful in helping them achieve their vocational rehabilitation goals (3% not very helpful and 5% not at all helpful).
Significant Differences by Group:
Clients with cases closed unsuccessfully are significantly less likely to be satisfied than other VT DVR clients (75% very satisfied or satisfied).
Among the 8% of clients that indicated that the staff were not helpful in helping them to achieve their vocational rehabilitation goals:
26% needed more support or guidance. 19% indicated they did not find a job. 15% indicated the services provided were not very effective. 15% indicated no services were provided or the services were of little help.
109

How helpful were the staff of the Vermont Division of Vocational Rehabilitation in helping you achieve your vocational rehabilitation goals?
Primary Reasons not Helpful
VT DVR Burlington-Middlebury
St. Albans-Newport
St. Johnsbury
-White River
Junction
Barre-Morrisville
Rutland-Bennington
Springfield-
Brattleboro
Rural and Agricultural
VR
SUPPORT - Need more guidance, support 26% 35% 10% 18% 29% 40% 18% 21%
WORK- Did not receive employment, Could not find me a job 19% 18% 30% 23% 13% 21% 13% 10%
EFFECTIVE - No help, very little help 15% 18% 7% 12% 20% 14% 20% 16%SUPPORT - No services provided, not much help 15% 3% 14% 22% 19% 30% 25%
SUPPORT - Did not achieve goal, working on, need guidance 12% 16% 20% 9% 4% 6% 23% 7%
WORK - No job, didn't receive much job search help 12% 29% 7% 17% 4% 5% 5% 17%
COMM - Counselor did not return calls, No follow up 9% 4% 13% 15% 3% 24%
POSITIVE - they tried to help, received some help 6% 8% 3% 6% 13% 13%
INFO - Not enough information provided 4% 21% 3% 4%
COMM - Better communication needed 3% 2% 7% 11%
EXPAND - Funding problems, No money for services 3% 18% 13%
INFO - Not enough, unaware of available services 3% 13% 3%
STAFF - Counselor too busy, pushed aside 2% 11%
STAFF - Qualified staff, knowledge of disabilities, services 1% 11%
Note: columns listed as “0%” indicated instances where less than 0.5% gave this response. Blanks represent cases where no client gave this response.
110

In 2011, 89% of clients indicated that it was very or somewhat easy to contact their vocational rehabilitation counselor.
VT DVR Burlington-Middlebury
St. Albans-Newport
St. Johnsbury-
White River
Junction
Barre-Morrisville
Rutland-Bennington
Springfield-Brattleboro
Rural and Agricultural
VR
Very difficult 4% 1% 5% 3% 3% 5% 6% 1%Somewhat difficult 7% 4% 4% 12% 9% 10% 5% Somewhat easy 12% 17% 11% 16% 10% 8% 11% 12%Very easy 77% 78% 81% 70% 77% 76% 79% 87%Total 100% 100% 100% 100% 100% 100% 100% 100%
Results by region for 2011
Very difficult Somewhat difficult Somewhat easy Very easy0%
20%
40%
60%
80%
100%
4% 7%12%
77%
Q12 How easy was it for you to contact your vocational rehabilitation counselor?
111

2003 2006 2008 20110.0%
20.0%
40.0%
60.0%
80.0%
100.0% 88.6% 92.1% 90.1% 89.3%
Q12 How easy was it for you to contact your vocational rehabilitation counselor?
(% very or somewhat easy)
Year of Survey Administration
112

How easy was it for you to contact your vocational rehabilitation counselor?
%Sig Diff
2011Sig Diff Trend
Year of Administration 2003 88.6% 2006 92.1% 2008 90.1% 2011 89.3% Region 2008 Burlington/Middlebury 91.7% St. Albans/Newport 90.5% St. Johnsbury/White River Junction 90.9% Barre/Morrisville 92.8% Rutland/Bennington 89.3% Springfield/Brattleboro 86.8% Rural and Agricultural VR 92.0% 2011 Burlington/Middlebury 94.9% St. Albans/Newport 91.5% St. Johnsbury/White River Junction 85.8% Barre/Morrisville 87.6% Rutland/Bennington 84.8% Springfield/Brattleboro 89.5% Rural and Agricultural VR 99.1% + +
(% of respondents indicating very or somewhat easy)
113

Comments:
In 2011, 89% of clients indicated that it was somewhat or very easy to contact their vocational rehabilitation counselor. This is comparable to the percentage in 2008.
In 2011, 77% of clients indicated that it was very easy to contact their vocational rehabilitation counselor, while 12% indicated that it was somewhat easy to contact their vocational rehabilitation counselor. Only 11% indicated that it was difficult to contact their vocational rehabilitation counselor (7% somewhat difficult and 4% very difficult).
Significant Differences by Group:
Rural and Agricultural VR (2011 score is significantly greater than the score for VT DVR as a whole).
Rural and Agricultural VR (a significant increase from 2008 to 2011).
Among the 11% of clients that indicated that it was difficult to reach their vocational rehabilitation counselor:
30% indicated they and their counselor made many calls before getting in touch. 28% indicated leaving multiple messages before receiving a call back. 16% indicated their counselor did not return calls or follow up.
114

How easy was it for you to contact your vocational rehabilitation counselor?Primary Reasons not Easy
VT DVRBurlington-Middlebur
y
St. Albans-Newport
St. Johnsbury
-White River
Junction
Barre-Morrisville
Rutland-Bennington
Springfield-
Brattleboro
Rural and Agricultural
VR
COMM - Leave multiple messages before getting a call back 30% 30% 17% 41% 29% 25% 36% 11%
COMM - Phone tag - leave a message and counselor called back 28% 28% 20% 29% 33% 20% 36% 36%
COMM - Counselor did not return calls, No follow up 16% 3% 8% 5% 18% 42% 14% 19%
COMM - Calls, mail not returned for days, weeks, wait 13% 17% 20% 10% 14% 11% 14%
COMM - Hard to reach counselor 13% 12% 24% 19% 11% 3% 13%
COMM - Voicemail, leave message, Never answer phone 11% 14% 12% 8% 15% 11% 8% 6%
COMM -They are too busy, They have large caseloads 6% 15% 10% 10% 4% 7%
COMM -Person never available (meetings, out of office) 3% 20% 4% 3%
POSITIVE - Easy able to reach counselor with no problems 2% 7% 2% 13%
Note: columns listed as “0%” indicated instances where less than 0.5% gave this response. Blanks represent cases where no client gave this response.
115

In 2006, nearly all clients (99%) found the agency office very or somewhat accessible to someone with their type of disability.
VT DVR Burlington-Middlebury
St. Albans-Newport
St. Johnsbury-
White River
Junction
Barre-Morrisville
Rutland-Bennington
Springfield-Brattleboro
Rural and Agricultural
VR
Not at all accessible 0% 1% 1%Not very accessible 1% % 1% 1% 1% 2% Somewhat accessible 4% 3% 1% 3% 9% 3% 3% 2%Very accessible 95% 96% 97% 96% 91% 96% 96% 97%Total 100% 100% 100% 100% 100% 100% 100% 100%
Results by region for 2011
Not at all accessible Not very accessible Somewhat accessible Very accessible0%
20%
40%
60%
80%
100%
% 1% 4%
95%Q13 How accessible was the VT DVR office for someone with your
type of disability?
116

2003 2006 2008 20110.0%
20.0%
40.0%
60.0%
80.0%
100.0%98.7% 99.0% 98.1% 99.0%
Q13 How accessible was the VT DVR office for someone with your type of disability?
(% very or somewhat accessible)
Year of Survey Administration
117

How accessible was the Vermont Division of Vocational Rehabilitation office for someone with your type of disability?
%Sig Diff
2011Sig Diff Trend
Year of Administration 2003 98.7% 2006 99.0% 2008 98.1% 2011 99.0% Region 2008 Burlington/Middlebury 97.2% St. Albans/Newport 95.8% St. Johnsbury/White River Junction 97.4% Barre/Morrisville 99.2% Rutland/Bennington 99.5% Springfield/Brattleboro 98.7% Rural and Agricultural VR 96.7% 2011 Burlington/Middlebury 99.7% St. Albans/Newport 98.0% St. Johnsbury/White River Junction 98.6% Barre/Morrisville 100.0% Rutland/Bennington 99.1% Springfield/Brattleboro 98.4% Rural and Agricultural VR 98.7%
(% of respondents indicating very or somewhat accessible)
118

Comments:
In 2011, 99% of clients indicated that the office was very or somewhat accessible to someone with their type of disability. This is comparable to the percentage in 2008.
In 2011, 95% of clients indicated that the office was very accessible, while 4% indicated that it was somewhat accessible. Only 1% indicated that the office was not very accessible to someone with their type of disability.
Among the few clients that indicated that the office was not accessible:
17% indicated difficulty with parking and handicapped parking. 12% indicated office was not accessible at all. 11% indicated difficulties with elevators and stairs.
119

How accessible was the Vermont Division of Vocational Rehabilitation office for someone with your type of disability?
Primary Reasons not Accessible
VT DVRBurlington-Middlebur
y
St. Albans-Newport
St. Johnsbury
-White River
Junction
Barre-Morrisville
Rutland-Bennington
Springfield-
Brattleboro
Rural and Agricultural
VR
TRANS - Parking, handicap parking, parking 17% 40% 15% 54%
NEGATIVE - Not accessible at all 12% 37% 39%
OFFICE - Elevators and stairs 11% 13% 34% 26% 34%
TRANS - Lots of walking 9% 13% 44% 16%
CONDITION - No materials, braille, interpreters, large print 9% 20% 19%
STAFF - Did not listen to my needs 6% 35%
STAFF - More caring, understanding and encouraging staff 6% 35%
STAFF - More supervision of staff, management of services 5% 17%
STAFF - No cooperation, no help 5% 17%
STAFF - Some good, some bad counselors 5% 17%
COMM - Better communication needed 5% 11% 13%
INFO - Not enough information provided 4% 16%
POSITIVE - Fine, somewhat accessible 4% 16% OFFICE - Mobility in building, small, hard getting around 4% 8% 11%
TRANS - Traffic 4% 21%
ACCESS - Greater accessibility of the VR office 4% 33%
SUPPORT - No services provided, not much help 4% 13%
TRANS - Distance, bus routes, train station 2% 19% 34%
TRANS - Transportation issue 2% 11% TRANS - Transportation in general 1% 37%
Note: columns listed as “0%” indicated instances where less than 0.5% gave this response. Blanks represent cases where no client gave this response.
120

In 2011, 72% of clients indicated that the services they received helped them become more financially independent.
VT DVR Burlington-Middlebury
St. Albans-Newport
St. Johnsbury-
White River
Junction
Barre-Morrisville
Rutland-Bennington
Springfield-Brattleboro
Rural and Agricultural
VR
Strongly disagree 9% 6% 9% 14% 15% 8% 5% 15%Somewhat disagree 8% 5% 11% 9% 2% 13% 5% 8%Neither agree nor disagree 11% 18% 11% 4% 10% 5% 16% 8%
Somewhat agree 26% 23% 25% 27% 27% 23% 32% 23%Strongly agree 46% 49% 43% 46% 46% 51% 42% 46%Total 100% 100% 100% 100% 100% 100% 100% 100%
Results by region for 2011
Strongly disagree
Somewhat disagree
Neither agree nor disagree
Somewhat agree
Strongly agree0%
20%
40%
60%
80%
100%
9% 8% 11%
26%
46%
Q14 Next I am going to read a list of statements and I would like to know how strongly you agree or disagree. The vocational rehabilita-tion services I received helped me become more financially indepen-
dent.
121

2003 2006 2008 20110.0%
20.0%
40.0%
60.0%
80.0%
100.0%
69.5% 66.0% 71.0% 72.3%
Q14 Next I am going to read a list of statements and I would like to know how strongly you agree or disagree. The vocational rehabilita-tion services I received helped me become more financially indepen-
dent.(% stronly or somewhat agree)
Year of Survey Administration
122

The vocational rehabilitation services I received helped me become more financially independent.
%Sig Diff
2011Sig Diff Trend
Year of Administration 2003 69.5% 2006 66.0% 2008 71.0% 2011 72.3% Region 2008 Burlington/Middlebury 71.7% St. Albans/Newport 69.5% St. Johnsbury/White River Junction 65.7% Barre/Morrisville 76.0% Rutland/Bennington 69.1% Springfield/Brattleboro 72.8% Rural and Agricultural VR 73.5% 2011 Burlington/Middlebury 71.2% St. Albans/Newport 68.4% St. Johnsbury/White River Junction 73.1% Barre/Morrisville 73.0% Rutland/Bennington 73.8% Springfield/Brattleboro 74.3% Rural and Agricultural VR 69.3%
(% of respondents indicating strongly or somewhat agree)
123

Comments:
Clients were asked how strongly they agreed or disagreed with the statement “The vocational rehabilitation services I received helped me become more financially independent.”
In 2011, 72% of clients somewhat or strongly agreed that the services they received had helped them become more financially independent. This is an increase from the percentage in 2008, though not statistically significant.
In 2011, 46% strongly agreed with this statement while 26% somewhat agreed that the services provided by vocational rehabilitation helped them to become more financially independent. Eleven percent of respondents neither agreed nor disagreed with the statements. Seventeen percent of clients disagreed that the services provided by vocational rehabilitation helped them to become more financially independent (with 9% strongly disagreeing and 8% somewhat disagreeing with the statement).
Among the 28% of clients that did not agree that the services they received helped them become more financially independent:
36% indicated they did not find employment. 22% indicated no services were provided or were of little help. 19% indicated they did not receive needed testing. 12% indicated they needed more guidance and support.
124

The vocational rehabilitation services I received helped me become more financially independent.
Primary Reasons Disagree
VT DVRBurlington-Middlebur
y
St. Albans-Newport
St. Johnsbury
-White River
Junction
Barre-Morrisville
Rutland-Bennington
Springfield-
Brattleboro
Rural and Agricultural
VR
WORK- Did not receive employment, Could not find me a job 36% 65% 52% 29% 38% 21% 21% 35%
SUPPORT - No services provided, not much help 22% 17% 18% 20% 41% 31% 8%
TEST - Didn't receive needed, desired testing 19% 15% 24% 28% 10% 11% 34% 28%
SUPPORT - Need more guidance, support 17% 21% 8% 11% 28% 24% 29%
FINANCE - No change financially 10% 7% 7% 19% 3% 38% 14%WORK - Cannot find better paying job, not earning much 7% 8% 12% 17% 7%
FINANCE- Did not receive needed financial help 6% 4% 14% 7% 3% 12% 8%
WORK - Unable or too difficult to work due to disability 6% 10% 7% 9% 22%
EFFECTIVE - used own resources to get job, training 4% 11% 5% 13%
STAFF - staff, counselor didn't listen 2% 19%
WORK - Had to find job, services on own 2% 19%
EFFECTIVE - Agency closed case or stopped services 1% 11%
Note: columns listed as “0%” indicated instances where less than 0.5% gave this response. Blanks represent cases where no client gave this response.
125

In 2011, 97% of clients indicated that the Vermont Division of Vocational Rehabilitation staff treated them with dignity and respect.
VT DVR Burlington-Middlebury
St. Albans-Newport
St. Johnsbury-
White River
Junction
Barre-Morrisville
Rutland-Bennington
Springfield-Brattleboro
Rural and Agricultural
VR
Strongly disagree 0% 1% 1% 1%Somewhat disagree 2% 1% 4% 5% 3% 1% Neither agree nor disagree 1% 3% 1% 1% 2% 2%
Somewhat agree 9% 8% 9% 10% 12% 9% 7% 4%Strongly agree 88% 89% 86% 84% 82% 90% 91% 93%Total 100% 100% 100% 100% 100% 100% 100% 100%
Results by region for 2011
Strongly disagree
Somewhat disagree
Neither agree nor disagree
Somewhat agree
Strongly agree0%
20%
40%
60%
80%
100%
0% 2% 1%9%
88%
Q15 Next I am going to read a list of statements and I would like to know how strongly you agree or disagree. The VT DVR staff treated
me with dignity and respect.
126

2003 2006 2008 20110.0%
20.0%
40.0%
60.0%
80.0%
100.0% 96.2% 97.2% 96.8% 96.5%
Q15 Next I am going to read a list of statements and I would like to know how strongly you agree or disagree. The VT DVR staff treated
me with dignity and respect.(% strongly or somewhat agree)
Year of Survey Administration
127

The Vermont Division of Vocational Rehabilitation staff treated me with dignity and respect.
%Sig Diff
2011Sig Diff Trend
Year of Administration 2003 96.2% 2006 97.2% 2008 96.8% 2011 96.5% Region 2008 Burlington/Middlebury 92.9% St. Albans/Newport 97.9% St. Johnsbury/White River Junction 98.4% Barre/Morrisville 99.4% Rutland/Bennington 96.1% Springfield/Brattleboro 97.8% Rural and Agricultural VR 96.4% 2011 Burlington/Middlebury 96.7% St. Albans/Newport 94.9% St. Johnsbury/White River Junction 93.8% Barre/Morrisville 94.5% Rutland/Bennington 98.9% Springfield/Brattleboro 98.5% Rural and Agricultural VR 97.3%
(% of respondents indicating strongly or somewhat agree)
128

Comments:
Clients were asked how strongly they agreed or disagreed with the statement “The staff treated me with dignity and respect.”
In 2011, 97% of clients somewhat or strongly agreed that staff had treated them with dignity and respect. This is comparable to the percentage in 2008.
In 2011, 88% strongly of clients strongly agreed with this statement, while 9% somewhat agreed that the staff of vocational rehabilitation treated them with dignity and respect. One percent of clients neither agreed nor disagreed with this statement while 2% somewhat disagreed with the statement.
Among the few clients that felt the staff had not treated them with dignity and respect:
30% indicated the counselor or other staff were rude and did not treat them with respect. 30% indicated their counselor did not return calls or follow up. 26% indicated the staff did not listen to their needs.
129

The Vermont Division of Vocational Rehabilitation staff treated me with dignity and respect.Primary Reasons Disagree
VT DVR Burlington-Middlebury
St. Albans-Newport
St. Johnsbury
-White River
Junction
Barre-Morrisville
Rutland-Bennington
Springfield-
Brattleboro
Rural and Agricultural
VR
STAFF - Counselor, staff did not treat me with respect, rude 30% 100% 22% 51% 27%
COMM - Counselor did not return calls, No follow up 30% 100% 22% 21% 21% 100%
STAFF - Did not listen to my needs 26% 30% 28% 100%
STAFF - Some good, some bad counselors 16% 18% 100%
STAFF - Counselor was not helpful, supportive 14% 18% 100%
POSITIVE - they tried to help, received some help 11% 100%
COMM - Hard to reach counselor 6% 22%
EFFECTIVE - Never received help 6% 22% CLIENT - Will not accept client back into program 6% 27%
COMM - Better communication needed 6% 27%
EFFECTIVE - Don't close cases, cut clients off 6% 27%
COMM - Hard to reach staff 5% 100%
NEGATIVE - Negative (general) 5% 25%
FINANCE - Financial help 4% 17% SUPPORT - Need more guidance, support 4% 21%
STAFF - staff attitude, disrespect, unprofessional 4% 14%
WORK- Did not receive employment, Could not find me a job 4% 14%
EFFECTIVE - Broken promises, no follow thru 3% 12%
SUPPORT - No services provided, not much help 1% 100%
Note: columns listed as “0%” indicated instances where less than 0.5% gave this response. Blanks represent cases where no client gave this response.
130

In 2011, 72% of clients indicated that the agency helped them reach their job goals.
VT DVR Burlington-Middlebury
St. Albans-Newport
St. Johnsbury-
White River
Junction
Barre-Morrisville
Rutland-Bennington
Springfield-Brattleboro
Rural and Agricultural
VR
Strongly disagree 11% 7% 11% 19% 15% 8% 8% 11%Somewhat disagree 5% 11% 11% 3% 1% 6% 5%Neither agree nor disagree 12% 19% 7% 11% 10% 14% 9% 5%
Somewhat agree 24% 18% 22% 26% 32% 17% 30% 20%Strongly agree 48% 44% 49% 40% 41% 55% 53% 60%Total 100% 100% 100% 100% 100% 100% 100% 100%
Results by region for 2011
Strongly disagree
Somewhat disagree
Neither agree nor disagree
Somewhat agree
Strongly agree0%
20%
40%
60%
80%
100%
11%5%
12%24%
48%
Q16 Next I am going to read a list of statements and I would like to know how strongly you agree or disagree. VT DVR helped me reach
my job goals.
131

2003 2006 2008 20110.0%
20.0%
40.0%
60.0%
80.0%
100.0%
71.6% 71.2% 73.1% 71.9%
Q16 Next I am going to read a list of statements and I would like to know how strongly you agree or disagree. VT DVR helped me reach
my job goals.(% strongly or somewhat agree)
Year of Survey Administration
132

The Vermont Division of Vocational Rehabilitation helped me reach my job goals.
%Sig Diff
2011Sig Diff Trend
Year of Administration 2003 71.6% 2006 71.2% 2008 73.1% 2011 71.9% Region 2008 Burlington/Middlebury 72.6% St. Albans/Newport 68.6% St. Johnsbury/White River Junction 72.5% Barre/Morrisville 81.8% Rutland/Bennington 73.4% Springfield/Brattleboro 70.9% Rural and Agricultural VR 73.0% 2011 Burlington/Middlebury 62.6% St. Albans/Newport 71.1% St. Johnsbury/White River Junction 66.5% Barre/Morrisville 73.2% Rutland/Bennington 72.0% Springfield/Brattleboro 82.6% Rural and Agricultural VR 80.0%
(% of respondents indicating strongly or somewhat agree)
133

Comments:
Clients were asked how strongly they agreed or disagreed with the statement “The agency helped me reach my job goals.”
In 2011, 72% of clients somewhat or strongly agreed that the agency helped them reach their job goals. This is a decrease compared to the percentage in 2008, though not statistically significant.
In 2011, 48% strongly of clients strongly agreed with this statement, while 24% somewhat agreed that the agency helped them reach their job goal. Twelve percent of clients neither agreed nor disagreed with this statement. Sixteen percent of clients disagreed that that the agency helped them reach their job goal (with 11% strongly disagreeing and 5% somewhat disagreeing).
Significant Differences by Group:
Clients with cases closed successfully are significantly more likely to agree than other VT DVR clients (86% very or somewhat agree).
Among the 28% of clients that indicated that the agency did not help them reach their job goals:
48% indicated they did not find employment. 16% indicated that while they did not have a job they were working on achieving goals. 15% needed more support or guidance. 14% indicated no services were provided or services were of little help.
134

The Vermont Division of Vocational Rehabilitation helped me reach my job goals.Primary Reasons Disagree
VT DVRBurlington-Middlebur
y
St. Albans-Newport
St. Johnsbury
-White River
Junction
Barre-Morrisville
Rutland-Bennington
Springfield-
Brattleboro
Rural and Agricultural
VR
WORK- Did not receive employment, Could not find me a job 48% 67% 55% 47% 51% 28% 31% 30%
WORK -No job yet-still working on achieving goals 16% 14% 3% 23% 7% 24% 27% 30%
SUPPORT - Need more guidance, support 15% 7% 11% 11% 24% 20% 29% 10%
SUPPORT - No services provided, not much help 14% 10% 12% 16% 30% 7% 8% 29%
NEGATIVE - Program did nothing or little to help 13% 11% 5% 14% 24% 10% 20% 9%
WORK - Had to find job, services on own 13% 8% 14% 11% 13% 16% 13% 29%
WORK - Dissatisfied with job, not what they wanted 10% 7% 3% 9% 6% 28% 29%
COMM - Counselor did not return calls, No follow up 7% 4% 15% 7% 14%
WORK - Help client get a job, more job services, job options 5% 5% 4% 14% 31%
EFFECTIVE - No help, very little help 2% 20% 9%
STAFF - Very helpful 2% 10%
STAFF - Changing counselors, switching too much 1% 3% 11%
Note: columns listed as “0%” indicated instances where less than 0.5% gave this response. Blanks represent cases where no client gave this response.
135

Problems and Areas for Improvement
In 2011, 15% of clients indicated they had experienced problems with the agency or the services provided by the Vermont Division of Vocational Rehabilitation.
Among those experiencing problems, 29% indicated that the agency worked to resolve the problem.
In 2011, approximately four in ten clients offered suggestions for service improvement.
136

In 2011, 15% of clients indicated they had experienced problems with the agency or the services provided by the Vermont Division of Vocational Rehabilitation.
VT DVR Burlington-Middlebury
St. Albans-Newport
St. Johnsbury-
White River
Junction
Barre-Morrisville
Rutland-Bennington
Springfield-Brattleboro
Rural and Agricultural
VR
Yes 15% 15% 11% 15% 20% 15% 14% 7%No 85% 85% 89% 85% 80% 85% 86% 93%Total 100% 100% 100% 100% 100% 100% 100% 100%
Results by region for 2011
Yes No0%
20%
40%
60%
80%
100%
15%
85%
Q22 Have you experienced any problems with VT DVR or the services they have provided to you?
137

2003 2006 2008 20110.0%
20.0%
40.0%
60.0%
80.0%
100.0%
18.5% 18.3% 13.3% 14.6%
Q22 Have you experienced any problems with VT DVR or the services they have provided to you?(% experiencing problems)
Year of Survey Administration
138

Have you experienced any problems with the Vermont Division of Vocational Rehabilitation or the services they have provided to you?
%Sig Diff
2011Sig Diff Trend
Year of Administration 2003 18.5% 2006 18.3% 2008 13.3% 2011 14.6% Region 2008 Burlington/Middlebury 14.9% St. Albans/Newport 16.2% St. Johnsbury/White River Junction 11.1% Barre/Morrisville 10.8% Rutland/Bennington 17.5% Springfield/Brattleboro 10.4% Rural and Agricultural VR 6.0% 2011 Burlington/Middlebury 14.6% St. Albans/Newport 11.0% St. Johnsbury/White River Junction 14.6% Barre/Morrisville 20.1% Rutland/Bennington 15.2% Springfield/Brattleboro 14.2% Rural and Agricultural VR 6.6% -
(% of respondents indicating yes)
139

Comments:
In 2011, 15% of clients indicated that they had experience problems with the Vermont Division of Vocational Rehabilitation or the services that the agency provided. This is an increase compared to the percentage in 2008, though not statistically significant.
Significant Differences by Group:
Rural and Agricultural VR (significantly smaller percentage in 2011 reported experiencing problems compared to VT DVR as a whole).
Among the 15% of clients that had experienced problems:
17% indicated they needed more guidance or support. 16% indicated their counselor did not return calls or follow up. 16% indicated it was difficult to reach staff. 16% indicated they did not find employment. 12% indicated they did not receive services or the services were of little help. 12% indicated the need for additional counselors. 10% needed more help in getting a job, more job services and options.
140
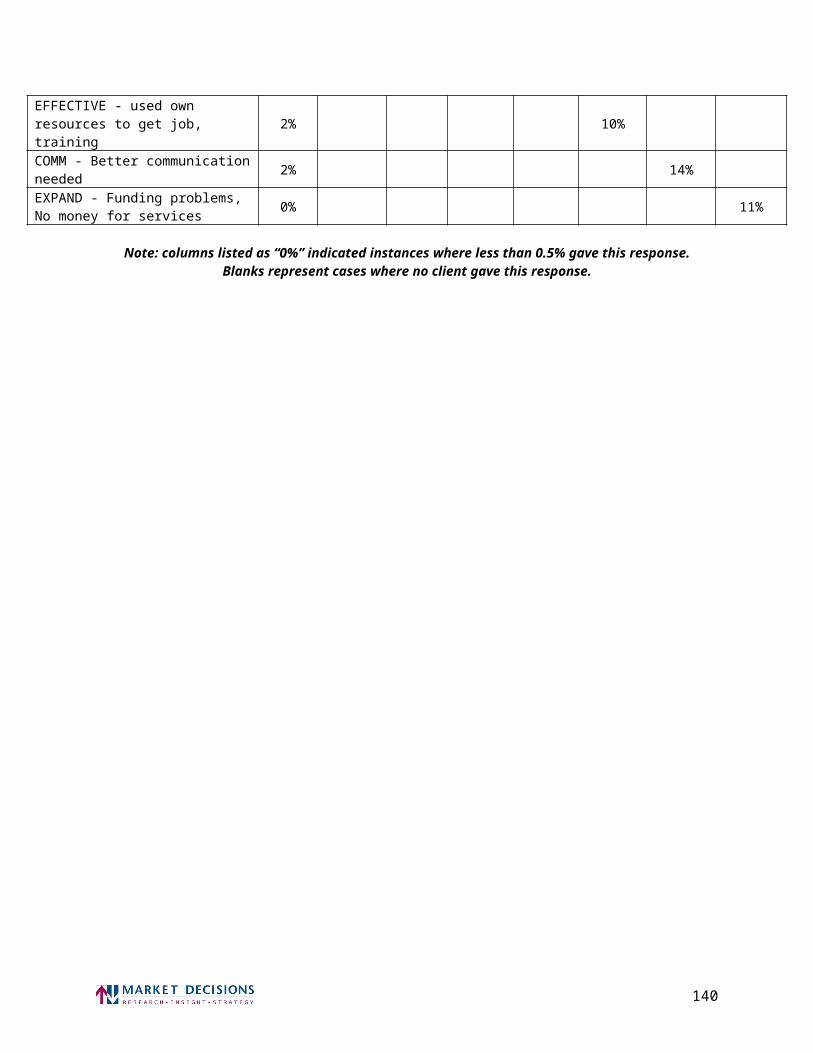
Have you experienced any problems with the Vermont Division of Vocational Rehabilitation or the services they have provided to you?
Primary Problems Experienced
VT DVRBurlington-Middlebur
y
St. Albans-Newport
St. Johnsbury
-White River
Junction
Barre-Morrisville
Rutland-Bennington
Springfield-
Brattleboro
Rural and Agricultural
VR
SUPPORT - Need more guidance, support 17% 18% 21% 16% 16% 19% 10% 33%
COMM - Counselor did not return calls, No follow up 16% 16% 25% 17% 12% 27% 3% 20%
COMM - Hard to reach staff 16% 19% 28% 15% 12% 6% 24% WORK- Did not receive employment, Could not find me a job 16% 26% 17% 19% 12% 7% 18%
SUPPORT - No services provided, not much help 12% 3% 18% 25% 7% 14% 11% 29%
STAFF - More counselors, staff, counselors are overworked 12% 19% 14% 3% 20% 5% 10% 16%
WORK - Help client get a job, more job services, job options 10% 15% 16% 25% 7% 29%
NEGATIVE - Program did nothing or little to help 5% 5% 16% 7%
STAFF - Changing counselors, switching too much 5% 5% 5% 9% 8%
POSITIVE - Took care of problem 4% 6% 17% EFFECTIVE - Better meet needs, work closely with client 4% 5% 17%
STAFF - staff attitude, disrespect, unprofessional 4% 5% 4% 4% 10%
SERVICES - Services for visually impaired, low vision aids 3% 17%
COMM - More contact, more frequent contact, more support 3% 9% 13%
EFFECTIVE - No help, very little help 3% 7% 10%
COMM - Time lags to get services, appointments 3% 14%
INFO - Not enough, unaware of available services 3% 7% 4% 6% 20%
141
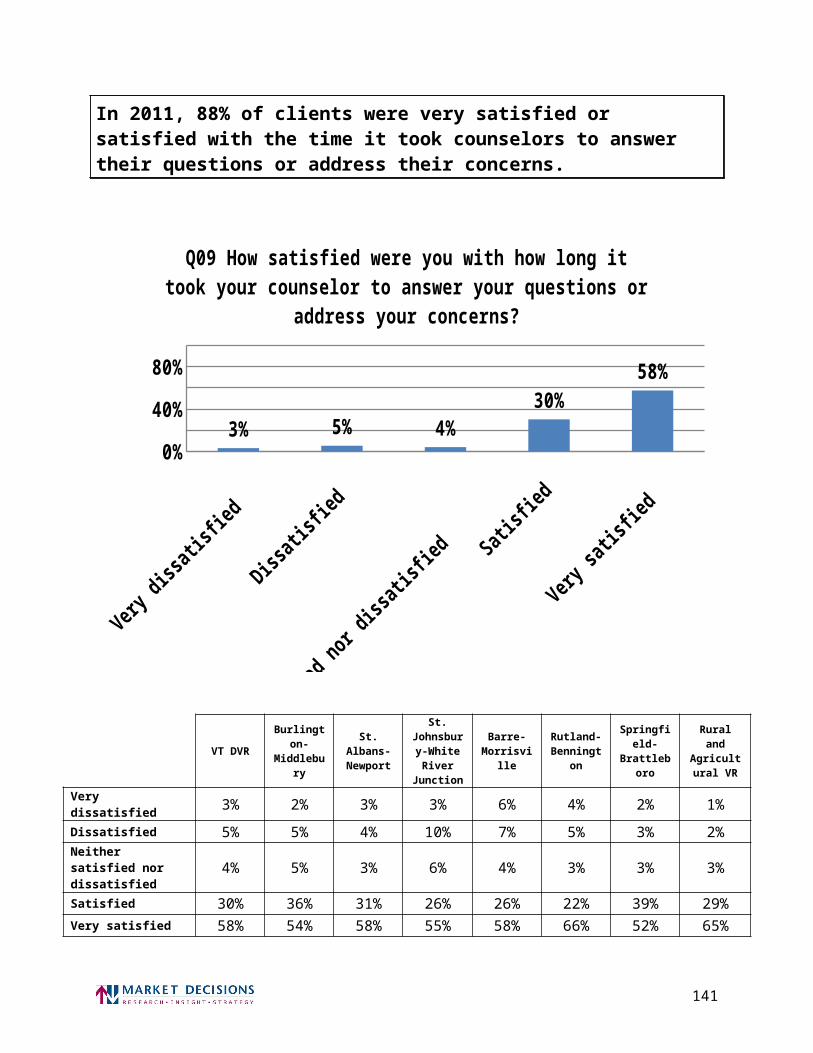
Have you experienced any problems with the Vermont Division of Vocational Rehabilitation or the services they have provided to you?
Primary Problems Experienced
VT DVRBurlington-Middlebur
y
St. Albans-Newport
St. Johnsbury
-White River
Junction
Barre-Morrisville
Rutland-Bennington
Springfield-
Brattleboro
Rural and Agricultural
VR
NEGATIVE - Dissatisfied with services and counselor 2% 6% 10%
EFFECTIVE - Client felt misunderstood 2% 11%
COMM - No follow up, should follow up more often 2% 13%
CONTROL - Felt pushed to do job, not what was wanted 0% 17%
EXPAND - more info needed, need to broaden programs 0% 17%
POSITIVE- Commendable efforts, services provided 0% 17%
WORK - Dissatisfied with job, not what they wanted 0% 17%
Note: columns listed as “0%” indicated instances where less than 0.5% gave this response. Blanks represent cases where no client gave this response.
142

Among those experiencing problems, 29% indicated that the agency worked to resolve the problem.
VT DVR Burlington-Middlebury
St. Albans-Newport
St. Johnsbury-
White River
Junction
Barre-Morrisville
Rutland-Bennington
Springfield-Brattleboro
Rural and Agricultural
VR
Yes 29% 21% 15% 38% 35% 48% 54%No 71% 79% 85% 100% 62% 65% 52% 46%Total 100% 100% 100% 100% 100% 100% 100% 100%
Results by region for 2011
Yes No0%
20%
40%
60%
80%
100%
29%
71%
Q23 Did VT DVR work to resolve this problem?(% among those experiencing problems)
143

2003 2006 2008 20110.0%
20.0%
40.0%
60.0%
80.0%
100.0%
36.3%29.4%
40.5%29.2%
Q23 Did VT DVR work to resolve this problem?(% indicating yes among those experiencing problems)
Year of Survey Administration
144

Did the Vermont Division of Vocational Rehabilitation work to resolve this problem?
%Sig Diff
2011Sig Diff Trend
Year of Administration 2003 36.3% 2006 29.4% 2008 40.5% 2011 29.2% Region 2008 Burlington/Middlebury 31.5% St. Albans/Newport 36.8% St. Johnsbury/White River Junction 44.8% Barre/Morrisville 60.0% Rutland/Bennington 51.6% Springfield/Brattleboro 30.2% Rural and Agricultural VR 2011 Burlington/Middlebury 21.4% St. Albans/Newport 15.1% St. Johnsbury/White River Junction 0.0%Barre/Morrisville 37.6% Rutland/Bennington 34.7% Springfield/Brattleboro 47.7% Rural and Agricultural VR 53.8%
(% of respondents indicating yes)
Comments:
In 2011, among those clients that had experienced problems, 29% indicated that the agency had worked to resolve the problem. This is a decrease in the percentage since 2008, though not statistically significant.
145

In 2011, approximately four in ten clients offered suggestions for service improvement.
Comments:
At the end of the survey, clients were asked what the agency could do to improve the services offered to the client and to others. These are summarized in the table below. Fifty-three percent of clients indicated that there was nothing else the agency could do and 8% were unsure of anything the agency could do to improve it services.
Three percent wanted better communication with the Division. Two percent of clients mentioned the need for more counselors. Other suggestions included the need to expand and improve programs (2%), the need to work more closely with clients (2%), increasing awareness of VT DVR to help more people (2%), returning calls more promptly (2%), and following up with clients (2%), , among other suggestions.
146

What could the Vermont Division of Vocational Rehabilitation do to improve the services it offers to you and others?
VT DVR Burlington-Middlebury
St. Albans-Newport
St. Johnsbury-White River
Junction
Barre-Morrisville
Rutland-Bennington
Springfield-Brattleboro
Rural and Agricultural
VR
COMM - Better communication needed 3% 2% 4% 1% 5% 3% 3%
STAFF - More counselors, staff, counselors are overworked 2% 5% 5% 4% 1% 1% 1%
EXPAND - More funds needed to expand and improve programs 2% 1% 5% 1% 2% 2% 1% 6%
EFFECTIVE - Better meet needs, work closely with client 2% 3% 1% 3% 1% 4% 1%
INFO - Increase awareness of program to help more people 2% 2% 2% 3% 4% 7%
COMM - Return call wait, too long returning calls 2% 3% 2% 3% 2%
COMM - No follow up, should follow up more often 2% 1% 4% 2% 2% 1% 1%
STAFF - Listen to client, understand needs, wants, ability 1% 1% 1% 2% 1% 2% 1% 1%
SUPPORT - More services needed to help with career goals 1% 1% 3% 3% 2% 1%
SUPPORT - Need more guidance, support 1% 3% 1% 2% 2% 3%
EDUCATION - Need more training available 1% 2% 1% 1% 1% 1% 1%
STAFF - More caring, understanding and encouraging staff 1% 1% 1% 3% 1%
COMM - Time lags to get services, appointments 1% 1% 1% 4% 2%
EXPAND - More services options, more programs 1% 1% 2% 1% 2% 1% 4%
INFO - clear, detailed information about services offered 1% 1% 2% 2% 1% 1% 1%
COMM -They are too busy, They have large caseloads 1% 3% 2% 1% 1%
STAFF - Qualified staff, knowledge of disabilities, services 1% 1% 1% 1% 1% 1%
EXPAND - Stronger network, agencies, businesses, doctors 1% 2% 2% 1% 1% 1%
WORK - Not enough career, job choices 1% 2% 2% 1% 1%
COMM -More frequent and, or productive appointments 1% 2% 1% 1% 1%
147

What could the Vermont Division of Vocational Rehabilitation do to improve the services it offers to you and others? (continued)
VT DVR Burlington-Middlebury
St. Albans-Newport
St. Johnsbury-White River
Junction
Barre-Morrisville
Rutland-Bennington
Springfield-Brattleboro
Rural and Agricultural
VR
WORK - Help client get a job, more job services, job options 1% 2% 1% 2%
EXPAND - More effort allotted to follow-up 1% 2% 3%
COMM - Hard to reach, hard to get a hold of 1% 1% 1% 2%
POSITIVE - Staff is great, very helpful 1% 4% 1% 1%
EXPAND - Funding problems, No money for services 1% 1% 2% 1% 1%
STAFF - Honest counselors, clear about what can be done 1% 2% 1% 1% 1%
SERVICES - Services for hearing impaired 1% 1% 3%
EFFECTIVE - Tailor to individual needs- know each client 1% 1% 2% 1% 1% 2%
TRANS - Transportation issue 1% 4%
WAIT - Took a long time to get help 1% 1% 1% 2%
COMM - Should be answering phones, Want to speak to person 1% 2% 2%
DEVICE - Computers, computer repairs, computer upgrade 1% 1% 1% 2% 1%
EFFECTIVE - Services should be easier to access 1% 2% 2%
COMM -Scheduling problems, different schedules 1% 1% 1% 1%
TEST - Testing, assessment to determine ability, interest 1% 0% 1% 2%
EFFECTIVE - More flexibility in eligibility for services 1% 3%
None 53% 50% 48% 45% 53% 56% 62% 54%
DK-REF Unsure 8% 7% 4% 11% 8% 7% 10% 8%
Total 100% 100% 100% 100% 100% 100% 100% 100%
Note: columns listed as “0%” indicated instances where less than 0.5% gave this response.Blanks represent cases where no client gave this response.
148
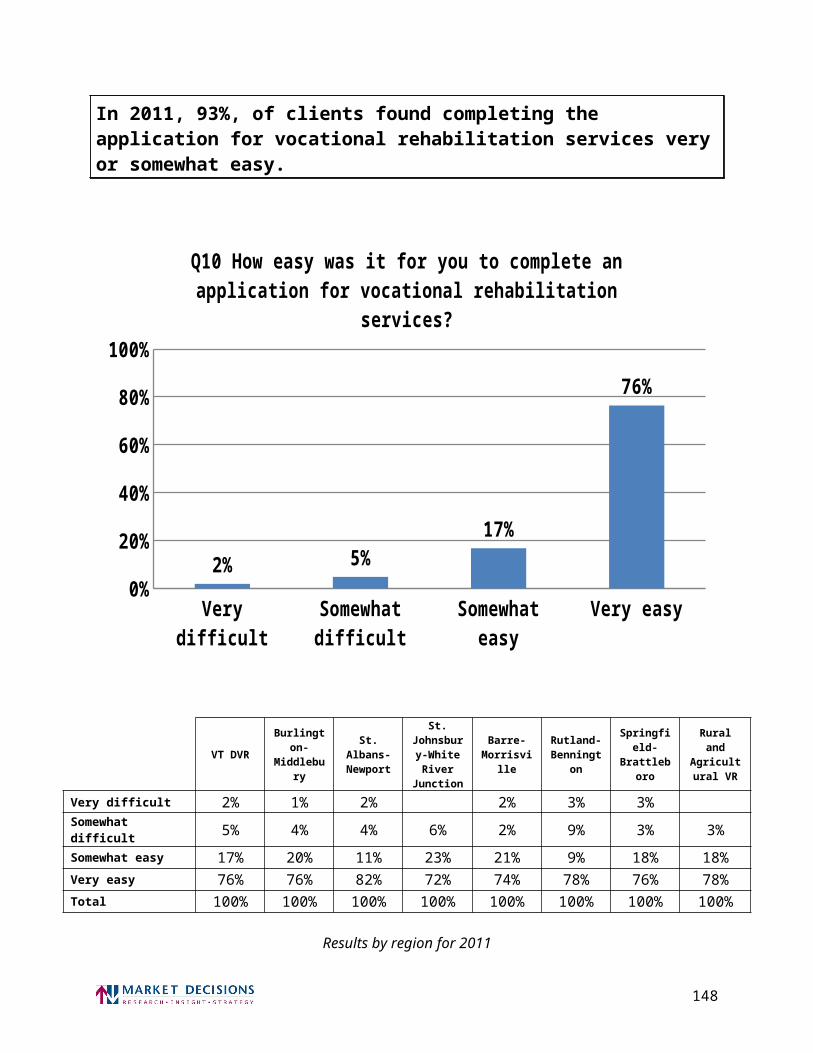
Current Employment Status
Forty-nine percent of clients were working full or part time.
Among those clients who were working, 82% were very satisfied or satisfied with their job in 2011.
The types of careers sought by clients were varied.
149

Forty-nine percent of clients were working full or part time.
These last few questions ask about what you are currently doing. Are you currently…
VT DVR Burlington-Middlebury
St. Albans-Newport
St. Johnsbury-
White River
Junction
Barre-Morrisvill
e
Rutland-Bennington
Springfield-
Brattleboro
Rural and Agricultural
VR
Working full time 15% 14% 21% 16% 12% 11% 14% 35%
Working part time 34% 35% 25% 33% 35% 39% 34% 26%
Currently looking for a job 27% 23% 33% 25% 33% 27% 27% 16%In school or receiving job training 15% 11% 15% 19% 20% 12% 19% 4%
Keeping house 4% 2% 6% 4% 5% 5% 4% 1%
Currently unable to work 12% 20% 11% 8% 10% 15% 4% 15%
Volunteering your time 5% 5% 5% 6% 4% 2% 7% 3%
Starting, have own business % 3% %Laid Off / Not Looking for Work 1% 1% 2% 1% 2% 4%
Other % 1%
None % 1% 1% 1%
DK % 1%
REF 1% 2% 1% 2%
Total 100% 100% 100% 100% 100% 100% 100% 100%Note: columns listed as “0%” indicated instances where less than 0.5% gave this response.
Blanks represent cases where no client gave this response.
Comments:
Overall, 15% of clients reported that they were currently working full time and 34% indicated that they were working part time. Twenty-seven percent of clients were currently looking for a job and another 15% were in school or receiving job training. Twelve percent of clients reported that they were unable to work.
150

Among those clients who were working, 82% were very satisfied or satisfied with their job in 2011.
VT DVR Burlington-Middlebury
St. Albans-Newport
St. Johnsbury-
White River
Junction
Barre-Morrisville
Rutland-Bennington
Springfield-Brattleboro
Rural and Agricultural
VR
Very dissatisfied 2% 4% 3% 2% 5% Dissatisfied 7% 10% 9% 4% 15% 3% 4% 5%Neither satisfied nor dissatisfied 9% 14% 6% 10% 10% 6% 8% 3%
Satisfied 33% 27% 25% 38% 32% 39% 36% 37%Very satisfied 49% 45% 58% 47% 43% 47% 52% 55%Total 100% 100% 100% 100% 100% 100% 100% 100%
Results by region for 2011
Very dissa
tisfied
Dissatisf
ied
Neither s
atisfied
nor dissa
tisfied Satis
fied
Very sat
isfied
0%20%40%60%80%
100%
2% 7% 9%33%
49%
Q26 Thinking about your current job, how satisfied are you with what you are doing?
151

2003 2006 2008 20110.0%
20.0%
40.0%
60.0%
80.0%
100.0%81.6% 86.9% 86.7% 81.9%
Q26 Thinking about your current job, how satisfied are you with what you are doing?
(% very satisfied or satisfied)
Year of Survey Administration
152

Thinking about your current job, how satisfied are you with what you are doing?
%Sig Diff
2011Sig Diff Trend
Year of Administration 2003 81.6% 2006 86.9% 2008 86.7% 2011 81.9% Region 2008 Burlington/Middlebury 83.2% St. Albans/Newport 80.2% St. Johnsbury/White River Junction 87.4% Barre/Morrisville 84.7% Rutland/Bennington 90.3% Springfield/Brattleboro 90.9% Rural and Agricultural VR 87.3% 2011 Burlington/Middlebury 71.9% St. Albans/Newport 82.7% St. Johnsbury/White River Junction 84.4% Barre/Morrisville 74.7% Rutland/Bennington 86.0% Springfield/Brattleboro 87.9% Rural and Agricultural VR 91.4%
(% of respondents indicating satisfied or very satisfied)
153

Comments:
In 2011, 82% were very satisfied or satisfied with their current job (among working clients). This is a decrease in the percentage in 2008.
In 2011, 49% of employed clients indicated that they were very satisfied with their current job, while 33% were satisfied. Nine percent of employed clients indicated that they were neither satisfied nor dissatisfied with their current job, while only 9% indicated some level of dissatisfaction (7% dissatisfied and 2% very dissatisfied).
Among the 16% of clients that were not satisfied with their current job:
27% indicated their pay does not meet their financial needs. 23% indicated they work too few hours. 17% indicated they are bored with their job. 12% indicated that they viewed their current job as temporary, not a career move.
154

Thinking about your current job, how satisfied are you with what you are doing?Primary Reasons not Satisfied
VT DVR Burlington-Middlebury
St. Albans-Newport
St. Johnsbury
-White River
Junction
Barre-Morrisville
Rutland-Bennington
Springfield-
Brattleboro
Rural and Agricultural
VR
FINANCE - Low pay- does not meet financial needs 27% 20% 38% 41% 11% 57% 22%
HOURS - Too few hours 23% 29% 26% 28% 23% 26%
JOB - Bored with job 17% 22% 37% 17% 22%
JOB - Not a career move, only temporary 12% 34% 13% 22% 14% 18%
EXPECTATION - Needs a job aligned with skills, training 10% 33% 11% 14%
EXPECTATION - Have another job, career, training in mind 9% 5% 5% 16% 22%
EXPECTATION - Better than nothing, employment limited 8% 7% 19% 5% 9% 11%
GROWTH - No challenges, few opportunities for growth 7% 23% 8%
JOB - Looking for a new job 5% 9% 22%
DEMANDING - Stressful 5% 11% 9% 18%
DEMANDING - Physically demanding 2% 15%
EXPECTATION - Job is not what I expected 2% 14%
ENVIRONMENT - Problems with employer or co-workers 0% 22%
Note: columns listed as “0%” indicated instances where less than 0.5% gave this response. Blanks represent cases where no client gave this response.
155

The types of careers sought by clients were varied.
Comments:
Clients, regardless of current work status, were asked the type of career they wanted. Their responses are summarized in the tables below.
The types of careers sought by these clients were quite varied. These include, among others:
Health care, medical services Human, social services, mental health Education Office work Starting my own business Food services Animal care
156

What type of job or career do you think you want?
VT DVRBurlington-Middlebur
y
St. Albans-Newport
St. Johnsbury
-White River
Junction
Barre-Morrisville
Rutland-Bennington
Springfield-
Brattleboro
Rural and Agricultural
VR
Any job 12% 12% 13% 13% 8% 16% 12% 6%
Health care, medical services 9% 8% 9% 10% 9% 8% 11% 6%
Human, social services, mental health 9% 8% 12% 14% 8% 10% 4% 4%
Job options are limited due to disability 7% 7% 7% 2% 2% 13% 8% 6%
Education 5% 3% 6% 6% 6% 6% 7% 1%
Office work 5% 5% 9% 1% 8% 4% 2% 3%
Business- start own 4% 3% 6% 3% 3% 5% 5% 4%
Food service 4% 2% 6% 3% 3% 4% 2% 5%
Animal care 3% 1% 2% 3% 4% 5% 6% 1%
Customer service 3% 3% 4% 3% 3% 3% 4%
Gardening, landscaping 3% 1% 4% 2% 1% 5% 3% 2%
Computer work 3% 3% 4% 3% 3% 4%
Child care 3% 4% 2% 3% 3% 2% 3% 3%
Media related field 2% 3% 2% 4% 4% 1% 2% 1%
Engineering 2% 2% 1% 2% 2% 1% 32%
Retired 2% 1% 2% 1% 2% 3% 3%
Agricultural 2% % 1% 7% 3% 4%
Writer 2% 2% 4% 3% 3% 1% 1%
Retail, sales 2% 2% 2% 2% 1% 2% 2% 1%
157

What type of job or career do you think you want? (continued)
VT DVRBurlington-Middlebur
y
St. Albans-Newport
St. Johnsbury
-White River
Junction
Barre-Morrisville
Rutland-Bennington
Springfield-
Brattleboro
Rural and Agricultural
VR
Electrical, plumbing, heating, welding, refrigeration 1% 1% 2% 5%
Coaching, sports director 1% 4% 2%
Financial- accountant, banker 1% 2% 1% 2% 2%
Research 1% 1% 2% 2% 1%
State, federal govt. job 1% 2% 1% 1% 1%
Architectural design, drafting 1% 3% 2%
Custodial, maintenance, cleaning 1% 1% 1% 1%
Science related field % % 1% 1%
Auto-repair, mechanics % 2%
Volunteer work % 1% 1%
Go back to school % 1% 1%
Driver % 1% 1%
Building, Construction % 1% 1%
Art, Photography, design % 1%
Music, theatre, performing arts % %
Other 2% 3% 3% 2% 1% 2% 4% 1%
None, do not want job 3% 5% 3% 4% 5% 1% 1% 15%
Unsure 17% 21% 14% 19% 14% 16% 19% 11%
Total 100% 100% 100% 100% 100% 100% 100% 100%
Note: columns listed as “0%” indicated instances where less than 0.5% gave this response. Blanks represent cases where no client gave this response.
158

Agency Specific Question
In 2011, 71% of clients indicated that they were informed that they could address problems with the Client Assistance Project.
In 2011, 77% of clients were able to receive needed services even when their counselor was not available.
In 2011, 75% of clients were satisfied with job placement services.
In 2011, 98% of clients felt welcome when coming to vocational rehabilitation for services.
In 2011, 34% of clients were able to access benefits counseling through vocational rehabilitation, while 18% of clients were not able to access benefits counseling.
Among those accessing benefits counseling services, 97% found these services valuable.
In 2011, 94% of clients indicated it was easy to access vocational rehabilitation services.
In 2011, 89% of clients indicated vocational rehabilitation services coordinated job placement services with the VABIR representative well.
In 2011, 83% of clients feel they are receiving the support needed to be successful in the long term.
In 2011, 33% of clients indicated that someone other than vocational rehabilitation helped them find a job.
Nearly all clients (95%) would refer a friend or relative to vocational rehabilitation.
159

In 2011, 71% of clients indicated that they were informed that they could address problems with the Client Assistance Project.
VT DVR Burlington-Middlebury
St. Albans-Newport
St. Johnsbury-
White River
Junction
Barre-Morrisville
Rutland-Bennington
Springfield-Brattleboro
Rural and Agricultural
VR
Yes 71% 70% 72% 65% 65% 74% 78% 85%No 29% 30% 28% 35% 35% 26% 22% 15%Total 100% 100% 100% 100% 100% 100% 100% 100%
Results by region for 2011
Yes No0%
20%
40%
60%
80%
100%
71%
29%
Q21 Were you informed that if you had a problem with VT DVR, you could address it with the Client Assistance Program or Project?
160

Comments:
In 2011, 71% of clients indicated that they were informed that if they had a problem, they could address this problem with the client assistance project. This is an increase compared to the percentage in 2008, though not statistically significant. In 2011, 29% of clients indicated that they were not informed.
By Region (In 2011)
In the Burlington/Middlebury Region, 70% of clients indicated that they were informed they could address problems with the client assistance program.
In the St. Albans/Newport Region, 72% of clients indicated that they were informed they could address problems with the client assistance program.
In the St. Johnsbury/White River Junction Region, 65% of clients indicated that they were informed they could address problems with the client assistance program.
In the Barre/Morrisville Region, 65% of clients indicated that they were informed they could address problems with the client assistance program.
In the Rutland/Bennington Region, 74% of clients indicated that they were informed they could address problems with the client assistance program.
In the Springfield/Brattleboro Region, 78% of clients indicated that they were informed they could address problems with the client assistance program.
In the Rural/Agricultural VR Region, 85% of clients indicated that they were informed they could address problems with the client assistance program.
161

In 2011, 77% of clients were able to receive needed services even when their counselor was not available.
VT DVR Burlington-Middlebury
St. Albans-Newport
St. Johnsbury-
White River
Junction
Barre-Morrisville
Rutland-Bennington
Springfield-Brattleboro
Rural and Agricultural
VR
Yes 77% 73% 79% 78% 67% 81% 81% 92%
No 23% 27% 21% 22% 33% 19% 19% 8%
Total 100% 100% 100% 100% 100% 100% 100% 100%
Results by region for 2011
Yes No0%
20%
40%
60%
80%
100%
77%
23%
VVR01 Were you able to receive needed services even when your vocational rehabilitation counselor was not available?
162

Comments:
In 2006, 77% of clients indicated they were able to receive needed services even when their counselor was not available. This is a decrease compared to the percentage in 2008, though not statistically significant.
163

In 2011, 75% of clients were satisfied with job placement services.
VT DVR Burlington-Middlebury
St. Albans-Newport
St. Johnsbury-
White River
Junction
Barre-Morrisville
Rutland-Bennington
Springfield-Brattleboro
Rural and Agricultural
VR
Very Satisfied 45% 48% 46% 44% 46% 42% 49% 22%
Satisfied 30% 29% 24% 31% 32% 34% 27% 39%
Neither Satisfied nor Dissatisfied 10% 13% 14% 3% 11% 9% 10% 17%
Dissatisfied 8% 8% 8% 7% 5% 9% 7% 17%
Very Dissatisfied 7% 2% 8% 15% 7% 6% 7% 6%
Total 100% 100% 100% 100% 100% 100% 100% 100%
Results by region for 2011
Very Satis
fiedSatis
fied
Neither S
atisfied
nor Dissa
tisfied Dissa
tisfied
Very Dissa
tisfied
0%20%40%60%80%
100%
45%30%
10% 8% 7%
VVR02 How satisfied were you with the job placement services?
164

Comments:
In 2011, 75% of clients indicated they were satisfied with job placement services. This is an increase compared to the percentage in 2008, though not statistically significant. Forty-five percent of clients were very satisfied and 30% of clients indicated they were satisfied. Ten percent of clients were neither satisfied nor dissatisfied. Fifteen percent of clients indicated they were dissatisfied or very dissatisfaction with job placement services.
Among those that were not satisfied the main reasons were that the job placement services were ineffective (37%), that the process was taking a long time (17%), that the job placement services really didn’t help (12%), and issues with communication and follow-up (12%).
How satisfied were you with the job placement services?Primary Reasons not Satisfied
VT DVR Burlington-Middlebury
St. Albans-Newport
St. Johnsbury-
White River
Junction
Barre-Morrisvill
e
Rutland-Bennington
Springfield-
Brattleboro
Rural and Agricultural
VR
Ineffective - still no job 37% 30% 34% 58% 40% 32% 35% 38%
Still in process - taking a long time 17% 17% 26% 19% 27% 7% 11% 7%
Did not really help me, not much help 12% 3% 13% 31% 10% 20% 6%
Communication problems, no follow-up 12% 19% 5% 10% 20% 10% 12% 6%
Coach, counselor did nothing, could have done more 8% 9% 21% 13%
Stopped going - a waste of time 4% 3% 3% 5% 10%
Got work on my own 4% 3% 7% 13%
Limited options available due to disability 4% 5% 6% 10% 16%
All jobs I could have found on my own 3% 3% 6% 11% 6%
Problems with coach, counselor - poor match for me 3% 19%
Did not match interest, ability, goal 2% 4% 6% 14%
Varied experiences; some bad, some good 2% 10%
Other 3% 12% 7% 7%
Unsure 9% 11% 5% 17% 16% 6%
Total 100% 100% 100% 100% 100% 100% 100% 100%
Note: columns listed as “0%” indicated instances where less than 0.5% gave this response. Blanks represent cases where no client gave this response.
165

In 2011, 98% of clients felt welcome when coming to vocational rehabilitation for services.
VT DVR Burlington-Middlebury
St. Albans-Newport
St. Johnsbury-
White River
Junction
Barre-Morrisville
Rutland-Bennington
Springfield-Brattleboro
Rural and Agricultural
VR
Very Welcome 81% 81% 83% 84% 69% 84% 83% 90%
Welcome 17% 19% 15% 14% 25% 16% 12% 9%
Not very Welcome 2% 2% 1% 5% 4% 1%
Not at all Welcome % 1% 1% 1%
Total 100% 100% 100% 100% 100% 100% 100% 100%
Results by region for 2011
Very Welcome Welcome Not very Welcome Not at all Welcome
0%
20%
40%
60%
80%
100%
81%
17%
2% 0%
VVR03 In thinking about the attitude of the staff and the office en-vironment, how welcome did you feel when coming to vocational re-
habilitation for services?
166

Comments:
In 2011, 98% of clients indicated they felt welcome coming to vocational rehabilitation for services. This comparable to the percentage in 2008. Eighty-one percent of clients felt very welcome and another 17% felt welcome when coming to vocational rehabilitation for services.
Among those that indicated they did not feel welcome, the main reasons were that they felt welcome until it was determined that they could not help the client (35%), that they felt “talked down to” (19%), long wait times (16%), and that they did not feel welcome in general (16%).
How welcome did you feel when coming to vocational rehabilitation for services? Primary Reasons not Welcome
VT DVR Burlington-Middlebury
St. Albans-Newport
St. Johnsbury-
White River
Junction
Barre-Morrisville
Rutland-Bennington
Springfield-
Brattleboro
Rural and Agricultural
VR
Welcome until determined they could not would not be able to help me
35% 39% 31% 45% 34%
Felt talked down to 19% 61% 15% 22%
Long wait times 16% 44%
Did not feel welcome 16% 100% 39% 17%
Depended on the day; sometimes welcome, sometimes not
8% 69%
Felt ignored - counselor apathetic 2% 100%
Unsure 8% 23%
Total 100% 100% 100% 100% 100% 100% 100%
Note: columns listed as “0%” indicated instances where less than 0.5% gave this response. Blanks represent cases where no client gave this response.
167

In 2011, 34% of clients were able to access benefits counseling through vocational rehabilitation, while 18% of clients were not able to access benefits counseling.
VT DVR Burlington-Middlebury
St. Albans-Newport
St. Johnsbury-
White River
Junction
Barre-Morrisville
Rutland-Bennington
Springfield-Brattleboro
Rural and Agricultural
VR
Yes 34% 34% 38% 28% 29% 45% 32% 20%
No 17% 13% 27% 21% 13% 9% 24% 18%
Did not need benefits counseling 48% 53% 35% 51% 58% 46% 45% 62%
Total 100% 100% 100% 100% 100% 100% 100% 100%
Results by region for 2011
Yes No Did not need benefits counseling
0%
20%
40%
60%
80%
100%
34%
17%
48%
VVR04 Were you able to access benefits counseling through voca-tional rehabilitation?
168

Comments:
In 2011, 34% of clients indicated they were able to access benefits counseling through vocational rehabilitation. This is a decrease in the percentage since 2008, though not statistically significant. Seventeen percent of clients were not able to access benefits counseling services (an increase since 2008 though again not statistically significant), and 48% of clients did not require benefits counseling services (comparable to 2008).
169
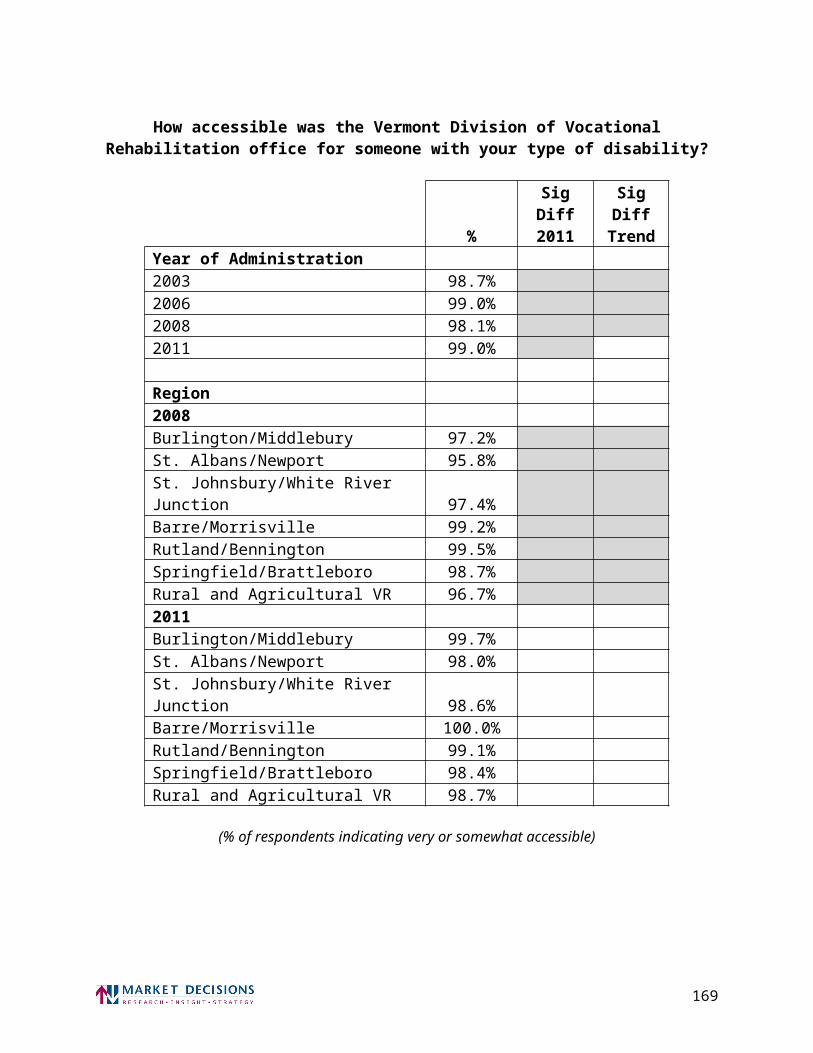
Among those accessing benefits counseling services, 97% found these services valuable.
VT DVR Burlington-Middlebury
St. Albans-Newport
St. Johnsbury-
White River
Junction
Barre-Morrisville
Rutland-Bennington
Springfield-Brattleboro
Rural and Agricultural
VR
Very Valuable 79% 74% 82% 87% 84% 79% 71% 78%
Somewhat Valuable 18% 18% 17% 11% 13% 20% 29% 16%
Not very Valuable 1% 6% 1% 5%
Not at all Valuable 1% 2% 2% 3% 2%
Total 100% 100% 100% 100% 100% 100% 100% 100%
Results by region for 2011
Very Valuable Somewhat Valuable
Not very Valuable Not at all Valuable0%
20%
40%
60%
80%
100%
79%
18%
1% 1%
VVR05 How valuable did you find this benefits counseling?
170

Comments:
Among those accessing benefits counseling services in 2011, 97% of clients indicated they found these services valuable. Seventy-nine percent of clients found these services very valuable and another 18% found these services somewhat valuable.
Among those that indicated they did not find their benefits counseling valuable, the main reason were that they were not eligible despite their condition (38%), that they received no assistance (15%), difficulties with benefits program counselors (14%), and difficulty in understanding their counselor (13%).
How valuable did you find this benefits counseling? Primary Reasons not Valuable
VT DVR Burlington-Middlebury
St. Albans-Newport
St. Johnsbury-
White River
Junction
Barre-Morrisville
Rutland-Bennington
Springfield-Brattleboro
Rural and Agricultural
VR
Was told not eligible despite condition, circumstances 38% 73%
Received no assistance 15% 100%
Difficulty with programs, benefits counselor attitude 14% 27%
Did not understand what counselor was saying - needed simple explanations
13% 100%
Did not learn anything new from benefits counseling 9% 100%
Waiting to meet, meetings rescheduled 7% 100%
Unsure 4% 100%
Total 100% 100% 100% 100% 100% 100% 100%
Note: columns listed as “0%” indicated instances where less than 0.5% gave this response. Blanks represent cases where no
171

In 2011, 94% of clients indicated it was easy to access vocational rehabilitation services.
VT DVR Burlington-Middlebury
St. Albans-Newport
St. Johnsbury-
White River
Junction
Barre-Morrisville
Rutland-Bennington
Springfield-Brattleboro
Rural and Agricultural
VR
Very Easy 77% 75% 82% 78% 69% 78% 77% 82%
Somewhat Easy 17% 21% 11% 12% 23% 20% 17% 13%
Somewhat Difficult 3% 1% 5% 5% 6% 3% 5%
Very Difficult 3% 2% 2% 5% 2% 2% 3%
Total 100% 100% 100% 100% 100% 100% 100% 100%
Results by region for 2011
Very Easy Somewhat Easy Somewhat Difficult Very Difficult0%
20%
40%
60%
80%
100%
77%
17%
3% 3%
VVR06 Overall, how easy was it for you to access vocational rehabili-tation services?
172

Comments:
In 2011, 94% of clients indicated it was easy to access vocational rehabilitation services. This is an increase compared to the percentage in 2008, though not statistically significant. Seventy-seven percent of clients indicated it was very easy and another 17% found it somewhat easy to access vocational rehabilitation services.
Among those that indicated it was not easy to access vocational rehabilitation services, the main reason were that they had simply given up on receiving VR services (9%), that they felt their counselor could have done more (9%), difficulties in reaching a counselor (7%), and difficulties in getting their questions answered (6%).
173

Overall, how easy was it for you to access vocational rehabilitation services? Primary Reasons not Difficult
VT DVR Burlington-Middlebury
St. Albans-Newport
St. Johnsbury
-White River
Junction
Barre-Morrisville
Rutland-Bennington
Springfield-
Brattleboro
Rural and Agricultural
VR
NEGATIVE - I've given up on services, program; a waste of time 9% 30% 14% 15%
EFFECTIVE - Felt counselor, agency could have done more to help me 9% 30% 12% 11%
COMM - Hard to reach counselor 7% 9% 27%
COMM - Difficulty getting questions answered, passed around 6% 23% 9%
EFFECTIVE - No help, very little help 6% 10% 5% 9% 31%
COMM - Calls, mail not returned for days, weeks, wait 5% 31%
COMM - Voicemail, leave message, Never answer phone 5% 31%
CLIENT - Uncertain about what is going on with their case 5% 9% 22%
COMM - Better communication needed 5% 27%
COMM -More frequent and, or productive appointments 5% 27%
COMM - Counselor never answered my questions 5% 19%
COMM - Hard to reach staff 5% 19%
STAFF - Counselor was not helpful, supportive 5% 19%
STAFF - staff, counselor didn't listen 4% 16%
ACCESS - Greater accessibility of the VR office 4% 22%
NOT ELIGIBLE - Do not qualify for services 4% 19%
FORMS - Paper work, difficulty with forms, etc. 4% 11% 7%
EFFECTIVE - Counselor had different goals, direction in mind 4% 30%
COMM - Time lags to get services, appointments 3% 4% 12%
WAIT - Took a long time to get help 3% 4% 12%
Note: columns listed as “0%” indicated instances where less than 0.5% gave this response. Blanks represent cases where no client gave this response.
174

Overall, how easy was it for you to access vocational rehabilitation services? Primary Reasons not Difficult
VT DVR Burlington-Middlebury
St. Albans-Newport
St. Johnsbury
-White River
Junction
Barre-Morrisville
Rutland-Bennington
Springfield-
Brattleboro
Rural and Agricultural
VR
INFO - Not enough information provided 3% 14% 26%
COMM - Counselor did not return calls, No follow up 3% 53%
CLIENT - More parent, family involvement 3% 12%
COMM - No follow through, get run around, nothing done 3% 12%
NEGATIVE - Program did nothing or little to help 3% 47%
TRANS - Transportation issue 3% 23%
DISCRIMINATION - Feels discriminated against 3% 14%
POSITIVE - Good times, bad times throughout program 3% 15%
COMM - Do not return calls, follow up, hard to contact 2% 19%
EFFECTIVE - Fight to get services, help is limited 2% 19%
REFERRED - Referred to another agency 2% 19%
STAFF - Changing counselors, switching too much 2% 19%
CONDITION - Trouble because of disability 2% 11%
EFFECTIVE - A lot of ideas, but no action 2% 11%
EFFECTIVE - Did not receive much help with goal 2% 11%
ACCESS - Locations changed or moved, Not easily accessible 2% 11%
EFFECTIVE - Better meet needs, work closely with client 2% 11%
SUPPORT - More services needed to help with career goals 1% 22%
EXPAND - Funding problems, No money for services 1% 21%
Note: columns listed as “0%” indicated instances where less than 0.5% gave this response. Blanks represent cases where no client gave this response.
175

In 2011, 89% of clients indicated vocational rehabilitation services coordinated job placement services with the VABIR representative well.
VT DVR Burlington-Middlebury
St. Albans-Newport
St. Johnsbury-
White River
Junction
Barre-Morrisville
Rutland-Bennington
Springfield-Brattleboro
Rural and Agricultural
VR
Very Well 71% 77% 75% 74% 59% 75% 64% 65%
Somewhat Well 17% 16% 15% 14% 28% 16% 16% 18%
Not very Well 3% 2% 3% 7% 1% 6% 9%
Not Well at all 8% 5% 6% 12% 5% 7% 14% 9%
Total 100% 100% 100% 100% 100% 100% 100% 100%
Results by region for 2011
Very Well Somewhat well Not very Well Not Well at all0%
20%
40%
60%
80%
100%
71%
17%
3%8%
VVR07 How well did Vocational Rehabilitation coordinate job placement services with the VABIR representative?
176

Comments:
In 2011, 89% of clients indicated vocational rehabilitation services coordinated job placement services with the VABIR representative very or somewhat well. Seventy-one percent of clients indicated services were coordinated very well and another 17% of clients indicated services were coordinated somewhat well. Only eleven percent felt vocational rehabilitation services did not coordinate well with the VABIR representative, with 3% indicating not very well and 8% indicating not well at all.
177

In 2011, 83% of clients feel they are receiving the support needed to be successful in the long term.
VT DVR Burlington-Middlebury
St. Albans-Newport
St. Johnsbury-
White River
Junction
Barre-Morrisville
Rutland-Bennington
Springfield-Brattleboro
Rural and Agricultural
VR
Yes 83% 79% 82% 82% 81% 84% 90% 82%
No 17% 21% 18% 18% 19% 16% 10% 18%
Total 100% 100% 100% 100% 100% 100% 100% 100%
Results by region for 2011
Yes No0%
20%
40%
60%
80%
100%
83%
17%
VVR08 Do you feel that you are getting the support needed to be successful in the long term?
178

Comments:
In 2011, 83% of clients feel they are receiving the support needed to be successful in the long term, comparable to 2008. Seventeen percent of clients feel they are not receiving the support needed to be successful in the long term.
Among those that indicated they were not receiving the support they needed to be successful in the long term, the main reason were that they there was no follow-up or they needed more frequent follow-up (13%), that the services were or little or no help (11%), and that they needed more guidance or support (9%).
179

Why do you feel you are not getting the needed support to be successful in the long term?Primary Reasons
VT DVR Burlington-Middlebury
St. Albans-Newport
St. Johnsbury
-White River
Junction
Barre-Morrisville
Rutland-Bennington
Springfield-
Brattleboro
Rural and Agricultural
VR
COMM - No follow up, should follow up more often 13% 9% 12% 6% 9% 35% 8%
EFFECTIVE - No help, very little help 11% 19% 13% 5% 19% 21% 4%
SUPPORT - Need more guidance, support 9% 15% 8% 21% 5% 5%
NEGATIVE - I've given up on services, program; a waste of time 8% 21% 16% 6% 4%
WORK- Did not receive employment, Could not find me a job 8% 12% 4% 9% 8% 14% 11%
EFFECTIVE - Felt counselor, agency could have done more to help me 6% 17% 12% 5% 5%
SUPPORT - More services needed to help with career goals 5% 2% 17% 14%
EDUCATION - Need more training available 5% 8% 17% 4%
CONDITION - Trouble because of disability 4% 13% 4% 5%
WORK - Had to find job, services on own 3% 4% 20% 5%
STAFF - Changing counselors, switching too much 3% 4% 13%
DISCRIMINATION - Feels discriminated against 3% 7% 14%
POSITIVE - they tried to help, received some help 3% 10% 5%
WORK - Disability, health makes it difficult to find work 3% 10% 5%
EFFECTIVE - Agency closed case or stopped services 2% 5% 6% 11%
EFFECTIVE - No clear purpose, solutions, answers 2% 11%
SUPPORT - Need help, like to get back into program 2% 10%
EFFECTIVE - used own resources to get job, training 2% 11%
EFFECTIVE - Real solutions for long-term advancement 1% 12%
COMM -Hard to remember, find phone number, who to contact 1% 12%
Note: columns listed as “0%” indicated instances where less than 0.5% gave this response. Blanks represent cases where no client gave this response.
180

In 2011, 33% of clients indicated that someone other than vocational rehabilitation helped them find a job.
VT DVR Burlington-Middlebury
St. Albans-Newport
St. Johnsbury-
White River
Junction
Barre-Morrisville
Rutland-Bennington
Springfield-Brattleboro
Rural and Agricultural
VR
Yes 33% 35% 32% 30% 45% 32% 31% 15%
No 67% 65% 68% 70% 55% 68% 69% 85%
Total 100% 100% 100% 100% 100% 100% 100% 100%
Results by region for 2011
Yes No0%
20%
40%
60%
80%
100%
33%
67%
VVR09 Did someone other than Vocational Rehabilitation help you find a job?
181

Comments:
Thirty-three percent of clients report that someone other than the Vermont Division of Vocational Rehabilitation helped them find a job. Among these clients receiving help form others, 25% indicated they themselves helped in finding a job, 16% a friend, 14% other Vermont agencies, 12% and family member and 10% indicated that the VT Department of Labor helped them find a job/
Who other than Vocational Rehabilitation helped you find a job?
VT DVR Burlington-Middlebury
St. Albans-Newport
St. Johnsbury-
White River
Junction
Barre-Morrisville
Rutland-Bennington
Springfield-
Brattleboro
Rural and Agricultural
VR
Self 25% 25% 24% 21% 28% 25% 26% 47%
Friend 16% 15% 21% 18% 18% 14% 15%
HCRS, other VT agency 14% 10% 10% 19% 7% 13% 28%
Family member 12% 15% 8% 14% 6% 14% 14% 12%
Department of Labor 10% 4% 2% 11% 20% 10% 15% 7%
College or school, teachers 9% 3% 11% 7% 21% 6% 4%
Employment agency private 6% 12% 7% 6% 3% 3% 5%
Counselor, counseling services 4% 5% 4% 3% 2% 7% 4%
Specific person 3% 8% 4% 2% 2%
VABIR 2% 6% 4% 4%
Vermont Associates 2% 1% 4% 2% 1% 15%
Other 3% 2% 5% 2% 5% 15%
Unsure 1% 1% 2%
Total 100% 100% 100% 100% 100% 100% 100% 100%
Note: columns listed as “0%” indicated instances where less than 0.5% gave this response. Blanks represent cases where no client gave this response.
182

Nearly all clients (95%) would refer a friend or relative to vocational rehabilitation.
VT DVR Burlington-Middlebury
St. Albans-Newport
St. Johnsbury-
White River
Junction
Barre-Morrisville
Rutland-Bennington
Springfield-Brattleboro
Rural and Agricultural
VR
Yes 95% 95% 94% 92% 91% 96% 98% 97%
No 5% 5% 6% 8% 9% 4% 2% 3%
Total 100% 100% 100% 100% 100% 100% 100% 100%
Results by region for 2011
Comments:
Ninety-five percent of clients indicated they would refer a friend or relative to the Division of Vocational Rehabilitation.
Yes No0%
20%
40%
60%
80%
100% 95%
5%
VVR10 Would you refer a friend or relative to vocational rehabilita-tion?
183

Respondent Characteristics
Male Female0%
20%
40%
60%
80%
100%
53%47%
Gender
184

< 25 25 - 34 35 - 44 45- 54 55 - 64 65+0%
20%
40%
60%
80%
100%
29%19% 16%
20%12%
3%
Age
185
Asian Black Hispanic Native American White%
20%
40%
60%
80%
100%
1% 1% 1% 1%
96%
Race/Ethnicity
186

Active Closed Sucessfully Closed Unsuccessfully0%
20%
40%
60%
80%
100%
66%
25%
9%
Case Status
187

Disability Category
Category %Unspecified 1%Deafness 1%Hard of Hearing 4%Neurological 3%Orthopedic 3%Medical 16%Amputation, Absence of limbs 2%Mental and Emotional Problems 42%Substance Abuse 1%Autism 1%Mental Retardation 6%Learning Disability 14%Traumatic Brain Injury 6%Total 100%
188