vta replacement parking study - metropolitan … technical... · · 2016-01-05vta replacement...
TRANSCRIPT
MARCH 2012
EISEN TR A N S P O R TAT I O N , EN V I R O N M E N TA L
A N D UR B A N PL A N N I N G
LETUNIC|
VTA REPLACEMENT PARKING STUDYFINAL REPORT Smart Growth Technical AssistanceTask Order 4-11
PREPARED FOR METROPOLITAN TRANSPORTATION COMMISSION
Santa Teresa Station

VTA Replacement Parking Study Metropolitan Transportation Commission
Nelson\Nygaard Consulting Associates Inc. ● Eisen|Letunic ● i
Table of Contents
Page
Executive Summary ............................................................................................................... ES-1
1 Introduction ......................................................................................................................1-1
2 Parking Demand Analysis ...............................................................................................2-1 Observed Parking Demand ................................................................................................................. 2-1 Modeled Parking Demand ................................................................................................................... 2-1
3 Scenario Analysis ............................................................................................................3-1
4 Recommended Replacement Parking Policy ....................................................................4-1 Guiding Principles .................................................................................................................................. 4-1 Station-Specific Replacement Parking Analysis ............................................................................... 4-2
Table of Figures
Page
Figure E-1 Study Area ............................................................................................................................ ES-3 Figure E-2 Station-Specific Replacement Parking Analysis ............................................................. ES-5 Figure 1-1 Study Area ............................................................................................................................. 1-3 Figure 1-2 VTA Station Tiers ................................................................................................................... 1-4 Figure 2-1 Current LRT Parking Lot Utilization .................................................................................... 2-2 Figure 2-2 Modeled 2010 and 2035 Ridership ................................................................................ 2-3 Figure 2-3 Current Household Characteristics within one Half-Mile of VTA LRT Station ............ 2-4 Figure 2-4 Modeled Parking Demand (2010) versus Observed Parking Demand (2011) ....... 2-6 Figure 2-5 2035 Parking Demand by Station .................................................................................... 2-7 Figure 2-6 2035 Unadjusted and Adjusted Parking Demand ......................................................... 2-8 Figure 2-7 Comparison of 2010 and 2035 Parking Demand ........................................................ 2-9 Figure 3-1 Modeled 2035 Ridership and Parking Demand ............................................................ 3-3 Figure 3-2 2035 Parking Demand with Parking Reductions ............................................................ 3-6 Figure 4-1 Station-Specific Replacement Parking Analysis .............................................................. 4-3
Appendices Appendix A Task 2: TOD Parking Management Strategies
Appendix B Task 3: Transit Parking Analysis Case Studies

VTA Replacement Parking Study Metropolitan Transportation Commission
Nelson\Nygaard Consulting Associates Inc. ● Eisen|Letunic ● E-1
EXECUTIVE SUMMARY With a drive-alone mode share of less than 30% at VTA's LRT stations1, compared to Caltrain’s 40%2 and BART’s 49%3, VTA’s current auto access rate is relatively low. Nonetheless, without a clear access and replacement parking policy, it may be difficult to reduce today’s automobile parking supply in order to free up land for transit-oriented development (TOD).This study, funded by the Metropolitan Transportation Commission (MTC) and coordinated with the Association of Bay Area Governments (ABAG) through a Smart Growth Technical Assistance grant, focuses on how much parking for transit riders should be replaced when VTA pursues transit-oriented development at its LRT stations. The study also evaluates various strategies that can help reduce overall TOD parking demand, including shared parking, priced parking, and Transportation Demand Management (TDM) strategies. It is hoped that VTA can use the findings to help develop a VTA Replacement Parking Policy as further implementation of VTA’s Joint Development Program.
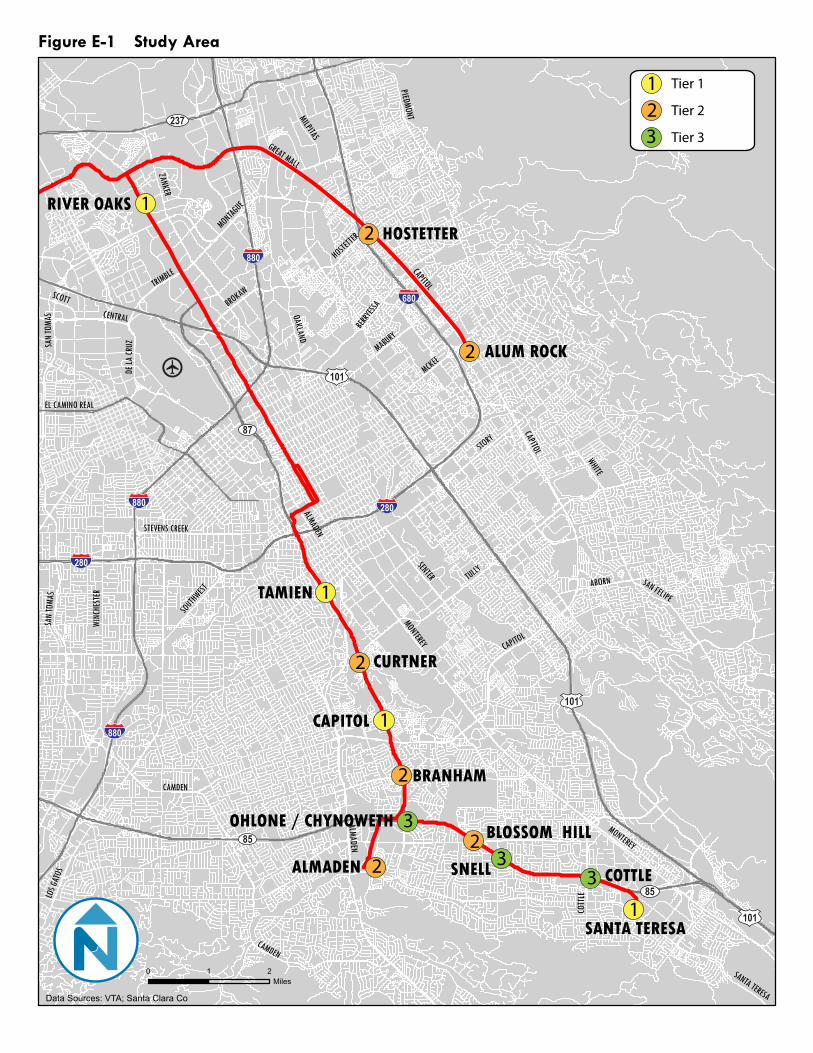
VTA has categorized each of the 13 light rail stations that are the subject of this study into three “tiers” based on each station’s potential for development and thus itspriority in being allocated TOD planning and financing resources. For the purpose of this study, VTA has limited the scope of the analysis to stations located within the City of San Jose, the jurisdiction in VTA’s service area with which the transit agency hascoordinated the most regarding their respective policies related to parking, an essential ingredient of TOD development.
Tier 1 stations are those with the highest potential for development based on VTA's Joint Development Policy and Priority Schedule, which was influenced by myriad factors, including the land use designations reflected in the City of San Jose's draft General Plan update, Envision San Jose 2040, and the amount of developable property at each station.These are the highest priority stations at which VTA would like to replace excess parking spaces with mixed-use development.
Tier 2 stations are those that also have development potential,due to their size and low parking utilization rates, but where VTA doesnot have near-term development plans or strategies, and therefore are not as high a priority as Tier 1sites.
Tier 3stations have very limited potential for future residential or commercial development, either because of physical constraints that make large-scale development infeasible, such as an irregular lot shape or topography, or simply because the lot is too small. Another criterion for Tier 3 stations is proximity to Tier 1 stations so, if necessary, they can absorbdisplaced parking from Tier 1station development. Thus, Tier 3stations are strategically planned to accommodate additional parking, while Tier 1, and eventually Tier 2, stations are planned to support residential and commercial development.
12005-2006 On-Board Passenger Survey, Final Report, October 2006. 2Caltrain Rider Omnibus Study, October 2010. 3BART Station Profile Study, 2008.

VTA Replacement Parking Study Metropolitan Transportation Commission
Nelson\Nygaard Consulting Associates Inc. ● Eisen|Letunic ● E-2
Many Tier 1 and 2stations are envisioned to become home to transit "villages” and "mixed-use neighborhoods" that combine higher density housing (up to 250 dwelling units per acre in some locations) with neighborhood-serving retail and commercial space. These land uses will be a departure from the existing single-family residential, automobile-dominant land uses that define the area around many of VTA’s light rail stations today.
Figure E-1 below shows the 13 light rail stationsthatare a part of this study and identifies the tier of each station.
MONTEREY
TULLY
ALMADENSTO
RY
WHITEMONTAGUE
OAKLAND
MCKEEMABURY
BERRYE
SSA
TRIMBLE
BROKAW
RETSEHCNIW
ELTTOC
SANTA TERESA
SCOTT
ZURC AL ED
CAPITOL
CAPITOL
ABORN
HOSTETTE
R
SOUTHWEST
SAN FELIPE
GREAT MALL
CAPITOL
LOS G
ATOS
MILPITAS
SENTER
MONTEREY
SAN
TOMA
S
STEVENS CREEK
CAMDEN
CAMDEN
ZANKER
PIEDMONT
ALMADEN
CENTRAL
SAN
TOMA
S
EL CAMINO REAL
SNELL COTTLE
TAMIEN
ALMADEN
BRANHAM
CAPITOL
CURTNER
ALUM ROCK
RIVER OAKS
HOSTETTER
BLOSSOM HILLOHLONE / CHYNOWETH
SANTA TERESA
680
101
85
85
87
237
880
880
280
280
880
101
101
Data Sources: VTA; Santa Clara Co
Figure E-1 Study Area
0 1 2Miles
3
1
32
3
2
2
1
2
1
2
21
1 Tier 1
2 Tier 2
3 Tier 3
VTA Replacement Parking Study Metropolitan Transportation Commission
Nelson\Nygaard Consulting Associates Inc. ● Eisen|Letunic ● E-4
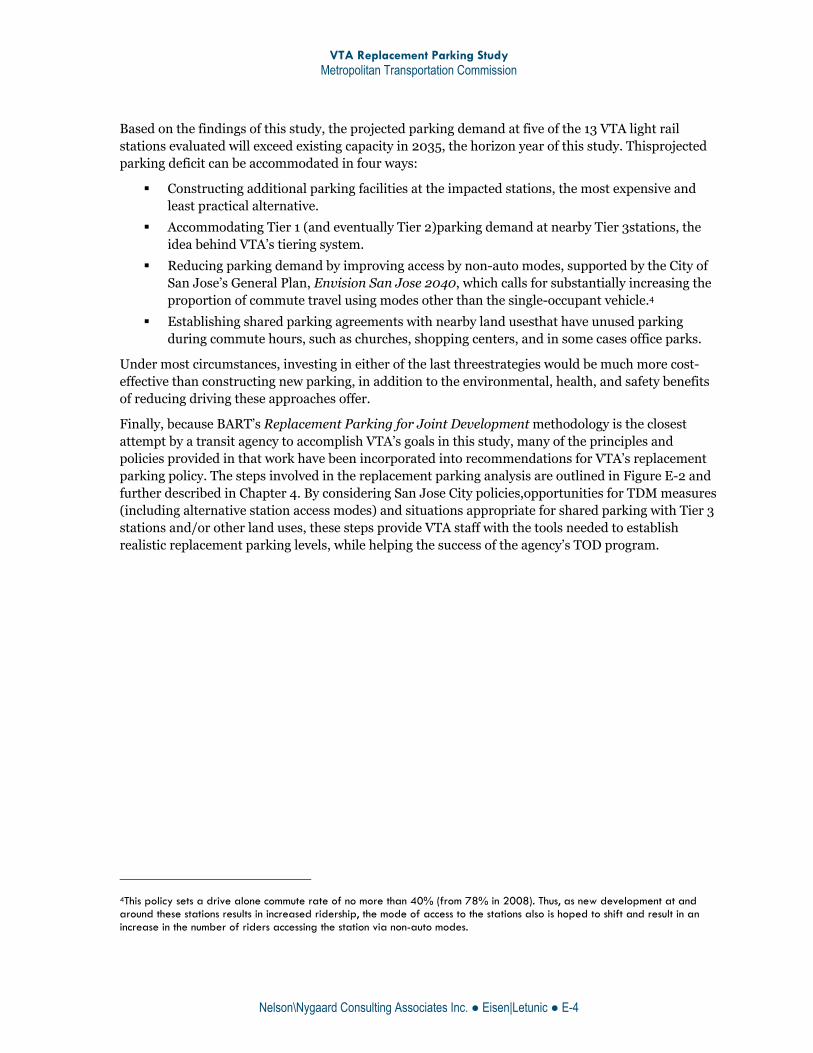
Based on the findings of this study, the projected parking demand at five of the 13 VTA light rail stations evaluated will exceed existing capacity in 2035, the horizon year of this study. Thisprojected parking deficit can be accommodated in four ways:
Constructing additional parking facilities at the impacted stations, the most expensive and least practical alternative.
Accommodating Tier 1 (and eventually Tier 2)parking demand at nearby Tier 3stations, the idea behind VTA’s tiering system.
Reducing parking demand by improving access by non-auto modes, supported by the City of San Jose’s General Plan, Envision San Jose 2040, which calls for substantially increasing the proportion of commute travel using modes other than the single-occupant vehicle.4
Establishing shared parking agreements with nearby land usesthat have unused parking during commute hours, such as churches, shopping centers, and in some cases office parks.
Under most circumstances, investing in either of the last threestrategies would be much more cost-effective than constructing new parking, in addition to the environmental, health, and safety benefits of reducing driving these approaches offer.
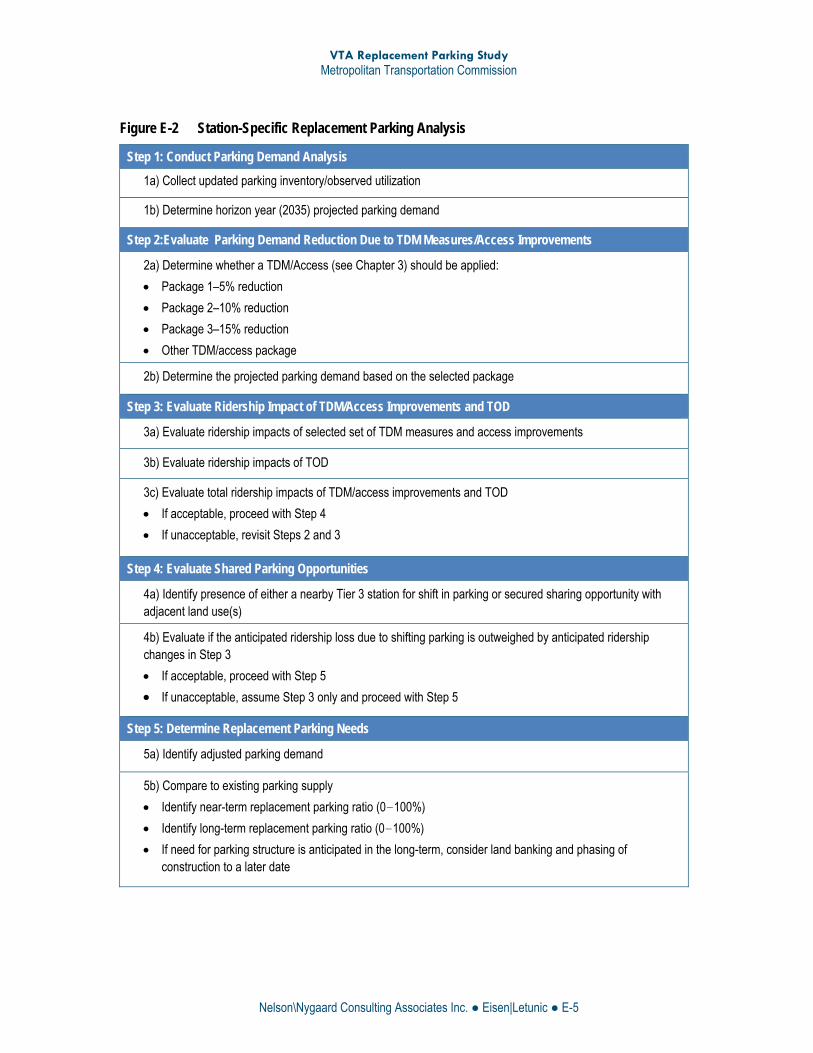
Finally, because BART’s Replacement Parking for Joint Development methodology is the closest attempt by a transit agency to accomplish VTA’s goals in this study, many of the principles and policies provided in that work have been incorporated into recommendations for VTA’s replacement parking policy. The steps involved in the replacement parking analysis are outlined in Figure E-2 and further described in Chapter 4. By considering San Jose City policies,opportunities for TDM measures (including alternative station access modes) and situations appropriate for shared parking with Tier 3 stations and/or other land uses, these steps provide VTA staff with the tools needed to establish realistic replacement parking levels, while helping the success of the agency’s TOD program.
4This policy sets a drive alone commute rate of no more than 40% (from 78% in 2008). Thus, as new development at and around these stations results in increased ridership, the mode of access to the stations also is hoped to shift and result in an increase in the number of riders accessing the station via non-auto modes.
VTA Replacement Parking Study Metropolitan Transportation Commission
Nelson\Nygaard Consulting Associates Inc. ● Eisen|Letunic ● E-5
Figure E-2 Station-Specific Replacement Parking Analysis
Step 1: Conduct Parking Demand Analysis
1a) Collect updated parking inventory/observed utilization
1b) Determine horizon year (2035) projected parking demand
Step 2:Evaluate Parking Demand Reduction Due to TDM Measures/Access Improvements
2a) Determine whether a TDM/Access (see Chapter 3) should be applied:
Package 1–5% reduction
Package 2–10% reduction
Package 3–15% reduction
Other TDM/access package
2b) Determine the projected parking demand based on the selected package
Step 3: Evaluate Ridership Impact of TDM/Access Improvements and TOD
3a) Evaluate ridership impacts of selected set of TDM measures and access improvements
3b) Evaluate ridership impacts of TOD
3c) Evaluate total ridership impacts of TDM/access improvements and TOD
If acceptable, proceed with Step 4
If unacceptable, revisit Steps 2 and 3
Step 4: Evaluate Shared Parking Opportunities
4a) Identify presence of either a nearby Tier 3 station for shift in parking or secured sharing opportunity with adjacent land use(s)
4b) Evaluate if the anticipated ridership loss due to shifting parking is outweighed by anticipated ridership changes in Step 3
If acceptable, proceed with Step 5
If unacceptable, assume Step 3 only and proceed with Step 5
Step 5: Determine Replacement Parking Needs
5a) Identify adjusted parking demand
5b) Compare to existing parking supply
Identify near-term replacement parking ratio (0—100%)
Identify long-term replacement parking ratio (0—100%)
If need for parking structure is anticipated in the long-term, consider land banking and phasing of construction to a later date


VTA Replacement Parking Study Metropolitan Transportation Commission
Nelson\Nygaard Consulting Associates Inc. ● Eisen|Letunic ● 1-1
1 INTRODUCTION A successful transit-oriented development (TOD) must satisfy multiple conditions in order to marry development and transit. One of the most significant factors is providing adequate parking for both transit patrons and project parking while optimizing the land for development. With a drive-alone mode share of less than 30% at VTA's LRT stations5, compared to Caltrain’s 40%6 and BART’s 49%7, VTA’s current auto access rate is relatively low. Nonetheless, without a clear access and replacement parking policy, it may be difficult to reduce today’s automobile parking supply in order to free up land for transit-oriented development (TOD).This study, funded by the Metropolitan Transportation Commission (MTC) and coordinated with the Association of Bay Area Governments (ABAG) through a Smart Growth Technical Assistance grant, focuses on the replacement parking for transit riders that should be provided in VTA’s TODs. A replacement parking analysis investigates how much of the existing parking supply (or demand) should be replaced when an existing parking facility is replaced by a different land use, e.g. a new TOD. Depending on an agency’s replacement parking policy and post-TOD projected parking demand at a particular station, these projects sometimes entail replacing an existing parking lot with a parking structure. The study also evaluates various strategies that can help reduce overall TOD parking demand, including shared parking, priced parking, and Transportation Demand Management (TDM) strategies. The findings have then been used to develop a VTA Replacement Parking Policy as further implementation of VTA’s Joint Development Program.
The analysis is focused on 13 light rail stations with park-and-ride facilities in the City of San Jose. The analysis builds upon VTA’s Joint Development Policy, which catalogues its real estate assets and identifies each station by its potential for future TOD (referred to as the Joint Development Portfolio). For the purpose of this analysis, VTA’s Real Estate Department further divided the San Jose stations into three tiers, relating to development potential and timing of development:8
Tier 1: Light rail stations and park-and-ride facilities that have the highest potential for development in the near term and would most benefit from a less than 1:1 replacement parking requirement.
Tier 2: Light rail stations and park-and-ride facilities that are suitable for development but not identified for near-term development due to myriad factors such as market demand, land use regulations, or long-range strategies.
Tier 3: Light rail stations and park-and-ride facilities that are adjacent to transit but are not feasible for development due to physical constraints or development complications. These assets are well-suited for parking and may accommodate parking shifted from nearby TODs.
52005-2006 On-Board Passenger Survey, Final Report, October 2006. 6Caltrain Rider Omnibus Study, October 2010. 7BART Station Profile Study, 2008. 8 Note that this categorization does not take into consideration that some Tier 3 stations may not be served by express trains in future conditions.
VTA Replacement Parking Study Metropolitan Transportation Commission
Nelson\Nygaard Consulting Associates Inc. ● Eisen|Letunic ● 1-2
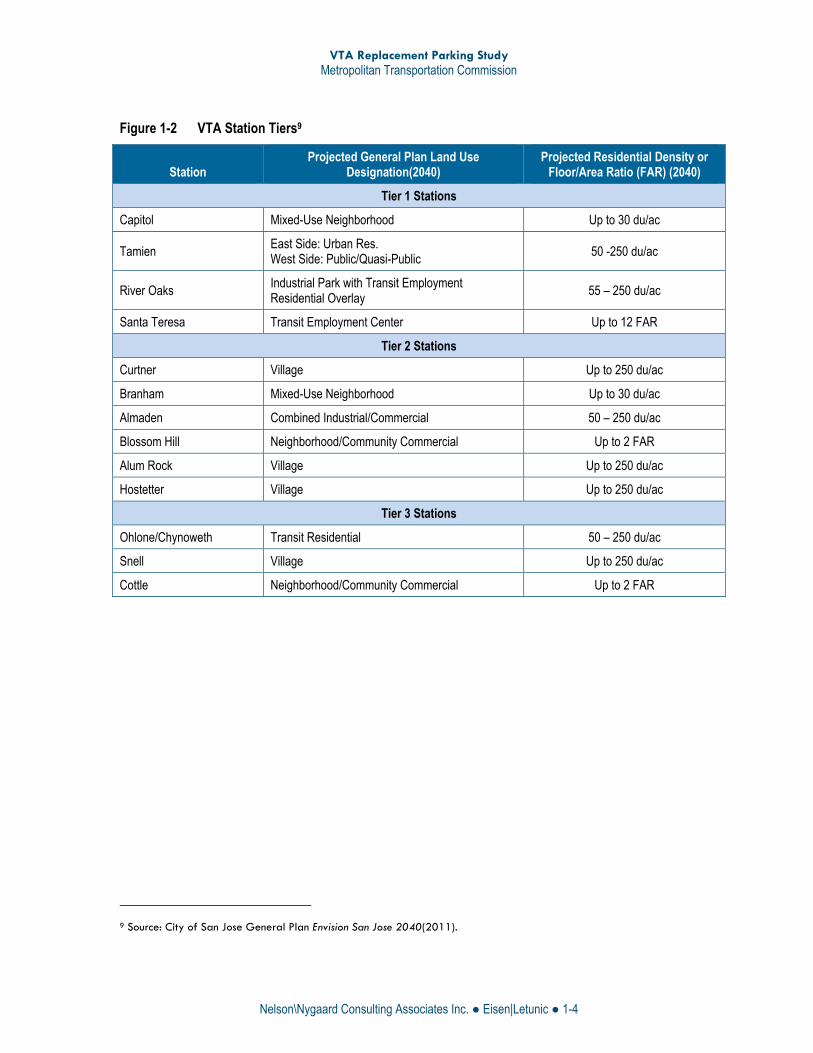
The three tiers have been used as guidance in this study to determine the appropriate replacement parking strategies and the potential for demand management strategies at each station (see Figures 1-1 and 1-2). Chapter 2 of this report describes current and modeled parking demand and mode split at the 13 evaluated stations. In Chapter 3, three exploratory parking scenarios are evaluated, developed to inform Chapter 4, where specific replacement parking recommendations are provided.

MONTEREY
TULLY
ALMADENSTO
RY
WHITEMONTAGUE
OAKLAND
MCKEEMABURY
BERRYE
SSA
TRIMBLE
BROKAW
RETSEHCNIW
ELTTOC
SANTA TERESA
SCOTT
ZURC AL ED
CAPITOL
CAPITOL
ABORN
HOSTETTE
R
SOUTHWEST
SAN FELIPE
GREAT MALL
CAPITOL
LOS G
ATOS
MILPITAS
SENTER
MONTEREY
SAN
TOMA
S
STEVENS CREEK
CAMDEN
CAMDEN
ZANKER
PIEDMONT
ALMADEN
CENTRAL
SAN
TOMA
S
EL CAMINO REAL
SNELL COTTLE
TAMIEN
ALMADEN
BRANHAM
CAPITOL
CURTNER
ALUM ROCK
RIVER OAKS
HOSTETTER
BLOSSOM HILLOHLONE / CHYNOWETH
SANTA TERESA
680
101
85
85
87
237
880
880
280
280
880
101
101
Data Sources: VTA; Santa Clara Co
Figure 1-1 Study Area
0 1 2Miles
3
1
32
3
2
2
1
2
1
2
21
1 Tier 1
2 Tier 2
3 Tier 3
VTA Replacement Parking Study Metropolitan Transportation Commission
Nelson\Nygaard Consulting Associates Inc. ● Eisen|Letunic ● 1-4
Figure 1-2 VTA Station Tiers9
Station Projected General Plan Land Use
Designation(2040) Projected Residential Density or
Floor/Area Ratio (FAR) (2040)
Tier 1 Stations
Capitol Mixed-Use Neighborhood Up to 30 du/ac
Tamien East Side: Urban Res. West Side: Public/Quasi-Public
50 -250 du/ac
River Oaks Industrial Park with Transit Employment Residential Overlay
55 – 250 du/ac
Santa Teresa Transit Employment Center Up to 12 FAR
Tier 2 Stations
Curtner Village Up to 250 du/ac
Branham Mixed-Use Neighborhood Up to 30 du/ac
Almaden Combined Industrial/Commercial 50 – 250 du/ac
Blossom Hill Neighborhood/Community Commercial Up to 2 FAR
Alum Rock Village Up to 250 du/ac
Hostetter Village Up to 250 du/ac
Tier 3 Stations
Ohlone/Chynoweth Transit Residential 50 – 250 du/ac
Snell Village Up to 250 du/ac
Cottle Neighborhood/Community Commercial Up to 2 FAR
9 Source: City of San Jose General Plan Envision San Jose 2040(2011).
VTA Replacement Parking Study Metropolitan Transportation Commission
Nelson\Nygaard Consulting Associates Inc. ● Eisen|Letunic ● 2-1
2 PARKING DEMAND ANALYSIS A first step toward identifying replacement parking levels that will be sufficient to accommodate future demand, without being excessive, is to predict with confidence future parking demand. This chapter evaluates 2035 projected parking demand at the 13 VTA light rail transit (LRT) stations evaluated in this study and also provides a discussion of how reliable these projections are.
OBSERVED PARKING DEMAND Parking projections are derived from parking rates in a base year in which parking levels are known. VTA offers automobile parking at 21 of its 62 light rail stations and maintains a monthly record of actual parking utilization at each LRT park-and-ride lot. Figure 2-1 shows current parking utilization data for the 13 stations that are the focus of this study.
These rates indicate that many stations are currently "over-parked;" that is, more parking is provided than is needed for existing transit patrons. This data shows that no station’s park-and-ride facilities are used at over three-quarters of capacity, covering a broad range of utilization rates, from only 6% full at the Capitol station, to 72% full at the Alum Rock station.
MODELED PARKING DEMAND Using output from VTA’s light rail transit ridership forecast, the agency uses a complex in-house parking demand model to help estimate future parking needs at its LRT stations.This process includes the following steps, which are described in further detail in the following sections:
1) Forecast ridership
2) Forecastaccess mode split
3) Forecast parking demand

VTA Replacement Parking Study Metropolitan Transportation Commission
Nelson\Nygaard Consulting Associates Inc. ● Eisen|Letunic ● 2-2
Figure 2-1 Current LRT Parking Lot Utilization
Station Parking Lot Capacity Parking Spaces Occupied1 Current Parking Utilization
Tier 1
Capitol 951 57 6%
Tamien2 369 89 24%
River Oaks3 22 15 67%
Santa Teresa 1,155 127 11%
Tier 2
Curtner 474 43 9%
Branham 271 35 13%
Almaden 189 45 24%
Blossom Hill 511 77 15%
Alum Rock 110 79 72%
Hostetter 100 18 18%
Tier 3
Ohlone/Chynoweth 549 253 46%
Snell 430 56 13%
Cottle 421 160 38%
Total 5,552 1,054 19%
1Values reflect annual average of 12 monthly counts. 2 The parking supply at Tamien station serves both VTA LRT and Caltrain parking; however, since neither charges a fee and since Caltrain’s lot is close to capacity, occupancy numbers may inadvertently include the vehicles of some Caltrain passengers. 3 The River Oaks station is located at VTA’s headquarters. Parking is, therefore, provided as a shared resource for VTA passengers and employees.
Source: VTA (2011)
1. Forecast Ridership ForecastingLRT ridership requires extensive population, demographic, economic, land use, and transportation data. VTA currently uses census tract-level population, housing, and employment projections for year 2035 from Association of Bay Area Government's (ABAG) Projections 2009 series, which the agency disaggregates into travel analysis zones (TAZs), smaller geographical units that form the basis of VTA's transportation model. VTA assumes the following future land use and transportation network/service characteristics:
Full build-out of planned TOD at light rail stations, according to Envision San Jose 2040
Number of multi-family units per TAZ

VTA Replacement Parking Study Metropolitan Transportation Commission
Nelson\Nygaard Consulting Associates Inc. ● Eisen|Letunic ● 2-3
Transit network improvements and expansions for 2035, including BART's full six-station expansion into Milpitas, San Jose, and Santa Clara; Bus Rapid Transit service on Routes 522, 523, and 568; and Caltrain electrification
Service improvements identified in VTA's Light Rail Transit Comprehensive Operations Analysis, such as 15-minute frequencies of light rail service on all lines (compared to 15-30 minutes today)10
Modeled 2010 and 2035 ridership for the 13 evaluated stations is provided in Figure 2-2.
Figure 2-2 Modeled 2010 and 2035 Ridership
2010
(Modeled)
2035
(Modeled)
% Increase/Decrease
2010 to 2035
Tier 1
Capitol 619 1,474 138%
Tamien 431 1,588 268%
River Oaks 463 1,678 262%
Santa Teresa 790 898 14%
Tier 2
Curtner 398 1,368 244%
Branham 186 363 95%
Almaden 130 495 281%
Blossom Hill 466 603 29%
Alum Rock 689 1,134 65%
Hostetter 458 789 72%
Tier 3
Ohlone/Chynoweth 645 1,188 84%
Snell 607 1,177 94%
Cottle 445 614 38%
Total 6,327 13,369 111%
Source: VTA (2011)
2. Forecast Access Mode Once future ridership is estimated, VTA predicts by what mode these future riders will access each station. The modelassumes that all passengers who live in TAZs adjacent to LRT stations, such as residents of current and future transit-oriented developments as designated in Envision San Jose 2040, will walk to the station. Passengers who live farther away are projected to drive, be dropped off,
102035 ridership forecasts are based on proposed LRT system improvements, including the Guadalupe Express and new Almaden – Mountain View train service. The Almaden shuttle will no longer exist in 2035.

VTA Replacement Parking Study Metropolitan Transportation Commission
Nelson\Nygaard Consulting Associates Inc. ● Eisen|Letunic ● 2-4
or take a bus to the station based on surveys, future bus improvements, and, if necessary to limit parking demand to lot capacity, parking pricing (although all parking is currently free of charge).
Other inputs to VTA's access mode choice model include: distance to station, nearby land uses, and passenger demographics. Figure 2-3 provides some of this information for the 13 VTA stations being evaluated. 15% of residents within a half-mile of the Tamien station, for example, do not currently drive to work, and an average of 1.8 cars are owned by these households, while residents within a half-mile of the Hostetter station have the lowest percentage of non-auto commuters (1%), and an average of 2.3 vehicles per household. These statistics help explain why the model predicts that 38% (173 out of 458) of Hostetter's passengers currently drive to the station, while only 18% (79 out of 431) of Tamien's passengers do so.
Figure 2-3 Current Household Characteristics within one Half-Mile of VTA LRT Station11
Station Population
(2000)
Median Household
Income (2000)
Average # Vehicles
Available Per Household
(2000)
% Residents Who Commute
by Transit, Bicycle or
Walk (2000)
Jobs
(2008)
Tier 1
Capitol 6,410 $74,499 2.0 4% 1,813
Tamien 7,914 $52,602 1.8 15% 1,017
River Oaks 1,906 $77,506 1.7 5% 6,342
Santa Teresa 2,590 $89,465 2.1 4% 2,159
Tier 2
Curtner 3,058 $37,777 1.4 8% 1,312
Branham 6,202 $81,127 2.4 4% 862
Almaden 6,047 $68,847 1.7 9% 2,758
Blossom Hill 6,306 $81,968 2.2 4% 1,460
Alum Rock 10,153 $55,751 2.1 7% 1,016
Hostetter 7,257 $80,430 2.3 1% 429
Tier 3
Ohlone/Chynoweth 3,960 $73,113 1.9 5% 3,089
Snell 7,083 $72,852 2.1 5% 1,543
Cottle 3,820 $85,670 2.0 6% 6,606
Average 5,593 $71,662 2.0 6% 2,339
Source: VTA (2011)
11Source: Center for Neighborhood Technology, TOD Database, which is based on U.S. Census 2000 data, the same source as ABAG Projections 2009, on which VTA bases its model.

VTA Replacement Parking Study Metropolitan Transportation Commission
Nelson\Nygaard Consulting Associates Inc. ● Eisen|Letunic ● 2-5
3. Forecast Parking Demand Following projection of mode of access, VTA analysts then calculate parking demand for each station by dividing the number of transit riders who are projected to access each station via car (referred to as Park-and-Ride or PNR) by a vehicle occupancy factor of 1.1 persons per car to account for the level of carpooling typical of VTA passengers.
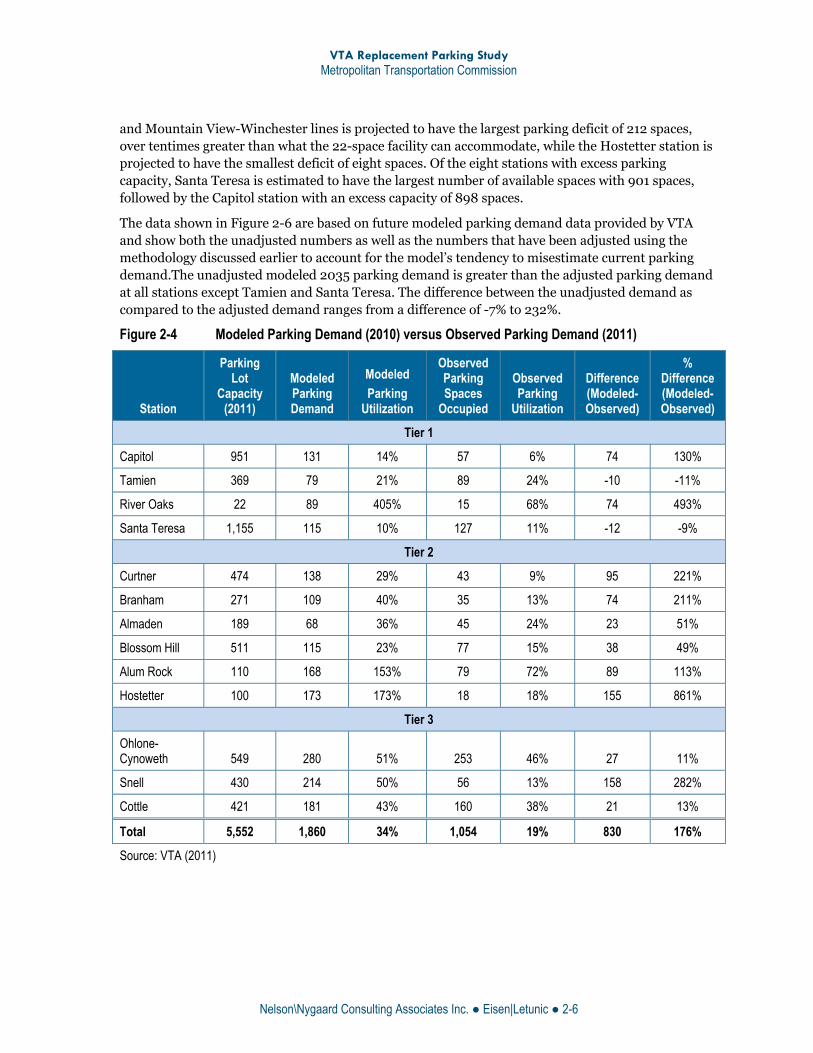
The model projects 2035 parking utilization based on the modeled 2010 values for current parking demand at each station, rather than observed rates. Although the VTA parking utilization model takes into consideration many passenger and land use characteristics that would be expected to influence access mode choice, when one compares the model’s estimates of 2010 parking demand to actual parking rates at each station, there are some discrepancies, many of them significant. As shown in Figure 2-4, the average modeled utilization of the 13 lots is 34%, whereas according to vehicle counts, the actual utilization is closer to 19%, almost half of the modeled rate. At the station level, the modeled utilization of one station (River Oaks) is 405% of its capacity, meaning that four times as many cars are estimated to currently park there than there are parking spaces (observed utilization is just 68%).
In fact, at 11 of the 13 stations that are the subject of this study, modeled 2010 utilization rates are higher than actual, indicating that (based on base year numbers) the model would predict higher future year utilization than may be necessary. At the remaining two stations, which are both in Tier 1, modeled parking rates that are slightly lower than the actual rates are also problematic in that this data could lead to a decision to allow for insufficient parking supply at these stations. It should be noted that actual rates are an average of monthly counts over a one-year period. Therefore, these numbers mask dailyfluctuations, which likely mean somewhat higher demand at some stations on certain days.
In order to address the model’s tendency to misestimate current parking demand, VTA staff adjusts the forecast numbers by the difference (positive or negative) between modeled 2035 and modeled 2010 parking demand and adds this difference to 2010 observed parking levels at each station.12
2035 Parking Demand Projections
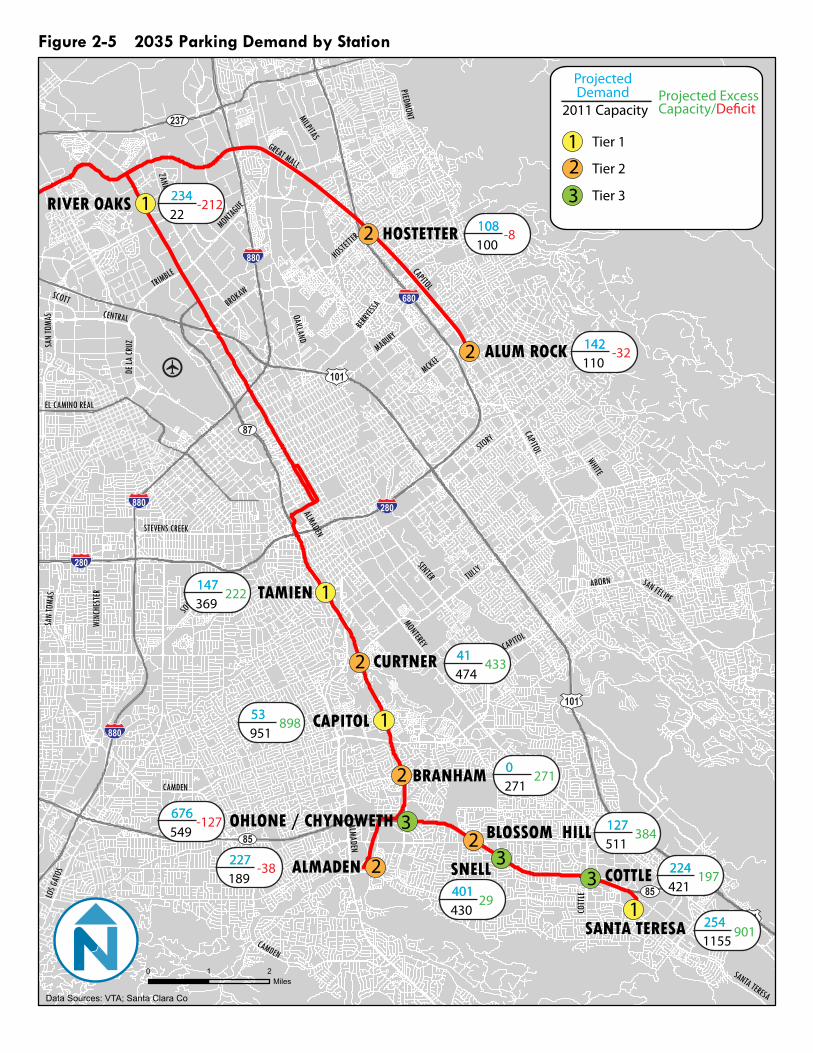
Due to projected population growth in VTA’s service area and increasing reliance on public transportation, VTA forecasts higher LRT ridership for 2035 as compared to today for all evaluated stations. Although passengers living in TAZs adjacent to stations are forecast to walk to the light rail station, many of those who will live farther away are projected to drive, hence parking utilization rates are also forecast to increase. Figure 2-5 shows the projected 2035 parking demand and excess parking capacity or parking deficit for each of the 13 stations evaluated, assuming no changes in parking supply from present day (and after the adjustments described in the previous section were made). Of the 13 stations, five are projected to experience a parking deficit while the remaining eight are projected to have availability. River Oaks station, which is served by both the Alum Rock-Santa Teresa
12 Modeled estimates can either be adjusted by the absolute difference or by the percentage difference. It is recommended that when the ratio of the modeled value to actual value is either very large or very small (either larger than 1.5 or smaller than 0.5) one should use the absolute difference rather than the percentage. When the ratio of modeled value to actual value is between 0.5 and 1.5 it is recommended that one computes the forecast using both methodologies, and then take the average of the two ratios. In VTA’s case, most ratios are either larger than 1.5 or smaller than 0.5, hence VTA uses the absolute difference to adjust the values.
VTA Replacement Parking Study Metropolitan Transportation Commission
Nelson\Nygaard Consulting Associates Inc. ● Eisen|Letunic ● 2-6
and Mountain View-Winchester lines is projected to have the largest parking deficit of 212 spaces, over tentimes greater than what the 22-space facility can accommodate, while the Hostetter station is projected to have the smallest deficit of eight spaces. Of the eight stations with excess parking capacity, Santa Teresa is estimated to have the largest number of available spaces with 901 spaces, followed by the Capitol station with an excess capacity of 898 spaces.
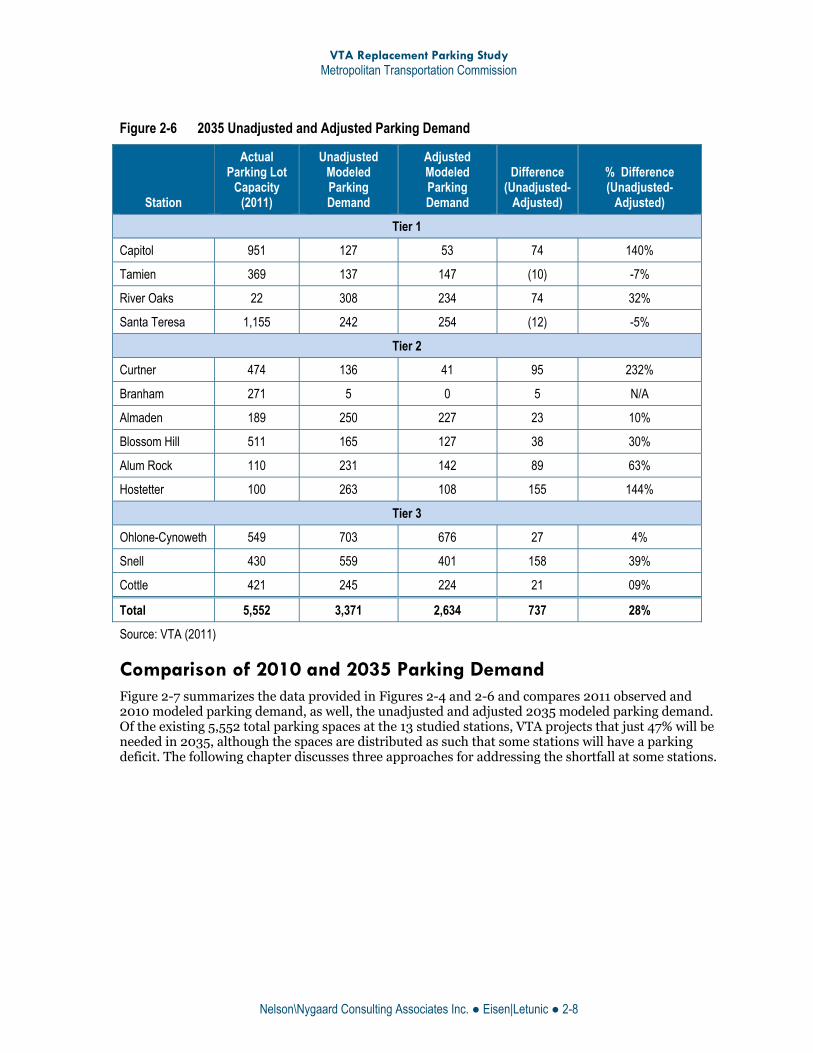
The data shown in Figure 2-6 are based on future modeled parking demand data provided by VTA and show both the unadjusted numbers as well as the numbers that have been adjusted using the methodology discussed earlier to account for the model’s tendency to misestimate current parking demand.The unadjusted modeled 2035 parking demand is greater than the adjusted parking demand at all stations except Tamien and Santa Teresa. The difference between the unadjusted demand as compared to the adjusted demand ranges from a difference of -7% to 232%.
Figure 2-4 Modeled Parking Demand (2010) versus Observed Parking Demand (2011)
Station
Parking Lot
Capacity (2011)
Modeled Parking Demand
Modeled
Parking Utilization
Observed Parking Spaces
Occupied
Observed Parking
Utilization
Difference (Modeled-Observed)
% Difference (Modeled- Observed)
Tier 1
Capitol 951 131 14% 57 6% 74 130%
Tamien 369 79 21% 89 24% -10 -11%
River Oaks 22 89 405% 15 68% 74 493%
Santa Teresa 1,155 115 10% 127 11% -12 -9%
Tier 2
Curtner 474 138 29% 43 9% 95 221%
Branham 271 109 40% 35 13% 74 211%
Almaden 189 68 36% 45 24% 23 51%
Blossom Hill 511 115 23% 77 15% 38 49%
Alum Rock 110 168 153% 79 72% 89 113%
Hostetter 100 173 173% 18 18% 155 861%
Tier 3
Ohlone-Cynoweth 549 280 51% 253 46% 27 11%
Snell 430 214 50% 56 13% 158 282%
Cottle 421 181 43% 160 38% 21 13%
Total 5,552 1,860 34% 1,054 19% 830 176%
Source: VTA (2011)
MONTEREY
TULLY
ALMADENSTO
RY
WHITEMONTAGUE
OAKLAND
MCKEEMABURY
BERRYE
SSA
TRIMBLE
BROKAW
RETSEHCNIW
ELTTOC
SANTA TERESA
SCOTT
ZURC AL ED
CAPITOL
CAPITOL
ABORN
HOSTETTE
R
SOUTHWEST
SAN FELIPE
GREAT MALL
CAPITOL
LOS G
ATOS
MILPITAS
SENTER
MONTEREY
SAN
TOMA
S
STEVENS CREEK
CAMDEN
CAMDEN
ZANKER
PIEDMONT
ALMADEN
CENTRAL
SAN
TOMA
S
EL CAMINO REAL
SNELL COTTLE
TAMIEN
ALMADEN
BRANHAM
CAPITOL
CURTNER
ALUM ROCK
RIVER OAKS
HOSTETTER
BLOSSOM HILLOHLONE / CHYNOWETH
SANTA TERESA
680
101
85
85
87
237
880
880
280
280
880
101
101
Data Sources: VTA; Santa Clara Co
Figure 2-5 2035 Parking Demand by Station
0 1 2Miles
3
1
32
3
2
2
1
2
1
2
21
110142142
-32
100108108
-822234234
-212
369147147
222
4744141
433
9515353
898
27100
271
189227227
-38
549676676
-127
430401401
29421224224
197
1155254254
901
511127127
384
1 Tier 1
2 Tier 2
3 Tier 3
2011 CapacityProjected ExcessCapacity/De�cit
DemandProjected
VTA Replacement Parking Study Metropolitan Transportation Commission
Nelson\Nygaard Consulting Associates Inc. ● Eisen|Letunic ● 2-8
Figure 2-6 2035 Unadjusted and Adjusted Parking Demand
Station
Actual Parking Lot
Capacity (2011)
Unadjusted Modeled Parking Demand
Adjusted Modeled Parking Demand
Difference (Unadjusted-
Adjusted)
% Difference (Unadjusted-
Adjusted)
Tier 1
Capitol 951 127 53 74 140%
Tamien 369 137 147 (10) -7%
River Oaks 22 308 234 74 32%
Santa Teresa 1,155 242 254 (12) -5%
Tier 2
Curtner 474 136 41 95 232%
Branham 271 5 0 5 N/A
Almaden 189 250 227 23 10%
Blossom Hill 511 165 127 38 30%
Alum Rock 110 231 142 89 63%
Hostetter 100 263 108 155 144%
Tier 3
Ohlone-Cynoweth 549 703 676 27 4%
Snell 430 559 401 158 39%
Cottle 421 245 224 21 09%
Total 5,552 3,371 2,634 737 28%
Source: VTA (2011)
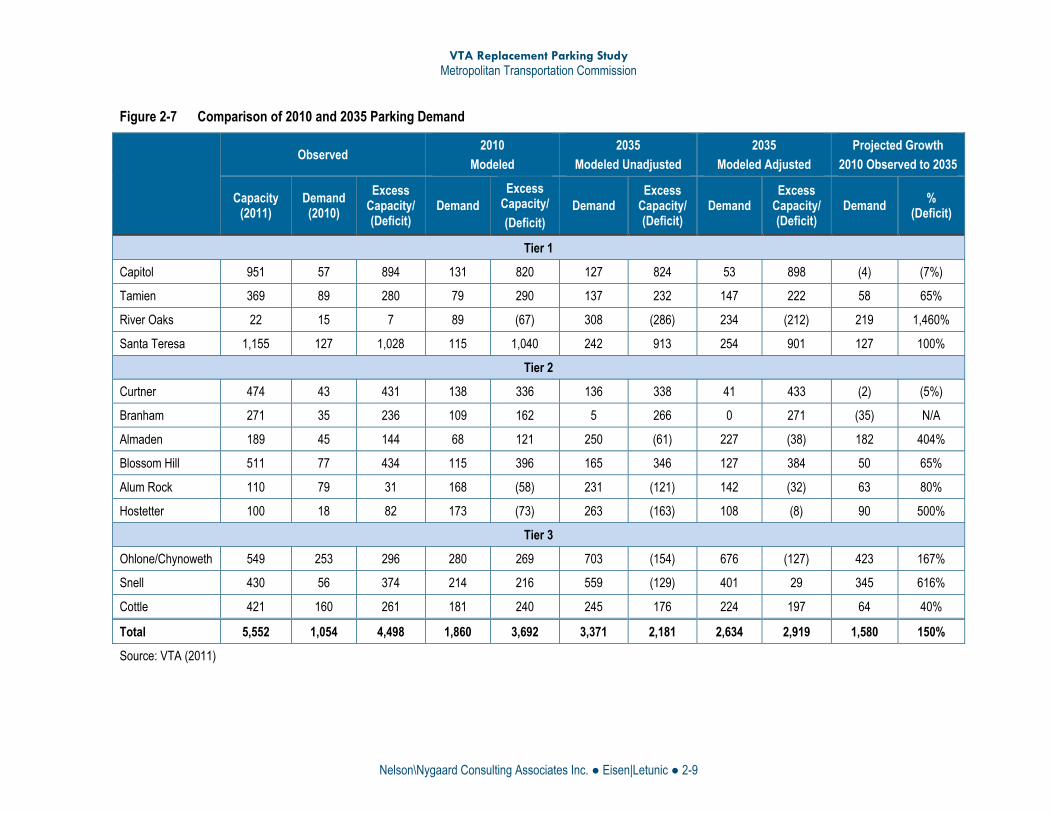
Comparison of 2010 and 2035 Parking Demand Figure 2-7 summarizes the data provided in Figures 2-4 and 2-6 and compares 2011 observed and 2010 modeled parking demand, as well, the unadjusted and adjusted 2035 modeled parking demand. Of the existing 5,552 total parking spaces at the 13 studied stations, VTA projects that just 47% will be needed in 2035, although the spaces are distributed as such that some stations will have a parking deficit. The following chapter discusses three approaches for addressing the shortfall at some stations.
VTA Replacement Parking Study Metropolitan Transportation Commission
Nelson\Nygaard Consulting Associates Inc. ● Eisen|Letunic ● 2-9
Figure 2-7 Comparison of 2010 and 2035 Parking Demand
Observed 2010
Modeled
2035
Modeled Unadjusted
2035
Modeled Adjusted
Projected Growth
2010 Observed to 2035
Capacity (2011)
Demand (2010)
Excess Capacity/ (Deficit)
Demand Excess
Capacity/
(Deficit) Demand
Excess Capacity/ (Deficit)
Demand Excess
Capacity/ (Deficit)
Demand %
(Deficit)
Tier 1
Capitol 951 57 894 131 820 127 824 53 898 (4) (7%)
Tamien 369 89 280 79 290 137 232 147 222 58 65%
River Oaks 22 15 7 89 (67) 308 (286) 234 (212) 219 1,460%
Santa Teresa 1,155 127 1,028 115 1,040 242 913 254 901 127 100%
Tier 2
Curtner 474 43 431 138 336 136 338 41 433 (2) (5%)
Branham 271 35 236 109 162 5 266 0 271 (35) N/A
Almaden 189 45 144 68 121 250 (61) 227 (38) 182 404%
Blossom Hill 511 77 434 115 396 165 346 127 384 50 65%
Alum Rock 110 79 31 168 (58) 231 (121) 142 (32) 63 80%
Hostetter 100 18 82 173 (73) 263 (163) 108 (8) 90 500%
Tier 3
Ohlone/Chynoweth 549 253 296 280 269 703 (154) 676 (127) 423 167%
Snell 430 56 374 214 216 559 (129) 401 29 345 616%
Cottle 421 160 261 181 240 245 176 224 197 64 40%
Total 5,552 1,054 4,498 1,860 3,692 3,371 2,181 2,634 2,919 1,580 150%
Source: VTA (2011)


VTA Replacement Parking Study Metropolitan Transportation Commission
Nelson\Nygaard Consulting Associates Inc. ● Eisen|Letunic ● 3-1
3 SCENARIO ANALYSIS As the data in the previous section shows, collective 2035 demand for parking is projected to be less than half of existing capacity of the 13 stations together;however,these projections also show demand outstripping supply at five of the stations. Assuming these demand projections are accurate, this section looks at three potential parking scenarios for addressing the projected shortage of parking. It is important to note that these are exploratory scenarios that help inform Chapter 4, where actual replacement parking recommendations are made.
Scenario 1 – Provide Additional Parking Scenario 1 addresses the projected parking deficit by constructing new parking facilities at four of the five stations currently projected to have a parking deficit in 2035; River Oaks, Alum Rock, Almaden, and Ohlone/Chynoweth. Hostetter was not included because a deficit of only eight spaces is projected, which is well within the margin of error of the forecast, as well as within the range of monthly fluctuations. This scenario assumes that no shifting between stations would occur and thus no consolidation of parking would be needed. Given the projected deficits at the four stations identified above, the following additional parking facilities would be necessary:
River Oaks (Tier 1) – 212-space facility
Alum Rock (Tier 2) – 32-space facility
Almaden (Tier 2) – 38-space facility
Ohlone/Chynoweth (Tier 3) – 127-space facility
Although the additional parking demand at Alum Rock and Almaden could possibly be met with additional surface parking, the demand at River Oaks and Ohlone/Chynoweth would likely require parking structures to be built. Given a conservative construction cost estimate of $25,000 per parking space13, a total investment of $8,475,000 would be necessary to construct the new parking at River Oaks and Ohlone/Chynoweth. Constructing new surface parking at Alum Rock and Almaden would conservatively cost $5,000 per parking space14, at a cost of $350,000. Thus, the capital cost would be roughly $8,825,000 for these 409 spaces, plus the lost opportunity cost of development. In addition, the annual operating and maintenance (O&M) cost typically exceeds $500 per space in a parking structure and $300 per space in a surface lot.15The annual O&M cost would thus be $190,000 for the 409 spaces. Although adding these spaces would provide a space for every car forecast to park at these stations, adding them would further reduce the already low collective occupancy of the spaces in the 13 studied stations from 47% to 44% in 2035.
13 Victoria Transport Policy Institute (2012) Parking Costs, Pricing and Revenue Calculator. Available at www.vtpi.org/parking.xls. 14 Ibid. 15 Ibid.

VTA Replacement Parking Study Metropolitan Transportation Commission
Nelson\Nygaard Consulting Associates Inc. ● Eisen|Letunic ● 3-2
Scenario 2 – Shift and Reduce Parking Supply When creating criteria to designate the three tiers of stations, VTA looked at the proximity of Tier 3 stations to those in Tier 1 so, if necessary, Tier 3 stations could absorb lost parking as a result of Tier 1station development. Thus, Tier 3stations are strategically planned to accommodate additional parking, while Tier 1, and eventually Tier 2, stations are planned to primarily support new development.
In Scenario 2, it is assumed that parking demand is shifted between stations with a supply deficit to those with available parking to address the projected parking deficits, thus reducing the number of new parking facilities that would need to be constructed. In other words, passengers who today park at a particular Tier 1 station would instead drive to a nearby Tier 3 station (or access the station by another mode) in the future.
This scenario takes into account the distance between stations among which passengers would shift, with proposed shifts limited to one or two miles in order to minimize the loss of VTA patrons due to the inconvenience of parking removal at a particular station. As a comparison, BART’s Replacement Parking for Joint Development (Willson, 2005) assumes that when BART parking supply is removed, and there is demand for that parking, a certain percent of drivers will switch to another BART access mode, and are therefore retained as BART riders, while some other percentage are assumed to stop using BART. The BART model, therefore, does not assume the sort of shifting from one station to another envisioned in this scenario. This difference makes sense given that BART stations – particularly those that provide auto parking – are typically much farther apart than are VTA LRT stations.
In their model, BART assumes that the percentage of drivers who are retained is the same as the non-drive mode share for that specific station. As an example, at Concord BART, 78% of patrons accessed the station by single-occupant vehicle when the model was developed, while 22% accessed the station by other modes (e.g., walking, bicycling, transit, or ridesharing). If BART were to hypothetically remove 100 well-utilized parking spaces at the Concord station, the model would assume that 22% (or 24 patrons, assuming a 1.1 vehicle occupancy) would continue accessing the same station, but by another mode, while 78% (or 86 patrons, assuming a 1.1. vehicle occupancy) would stop using BART for that trip. At MacArthur BART station, which had a lower drive-alone rate (49%) when the model was developed, a hypothetical reduction of 100 well-utilized parking spaces would lead to a 51% retention rate (56 patrons), while 49% (54 patrons) would be displaced. As such, the BART model indirectly takes into account station area characteristics, but is limited in its accuracy by not taking into account patrons who would choose to drive to an adjacent BART station rather than not make the trip on BART at all. For the analysis provided below, we have assumed the same relationship for VTA’s retention rate.
In this VTA scenario, the following shifts are proposed as a potential way to reduce the need for construction of new parking facilities when some of today’s parking lots are developed:
Shift the parking deficit of 38 spaces at Almaden (Tier 2) and 127 spaces at Ohlone/Chynoweth (Tier 3) to Branham (Tier 2), which has 271 available spaces. Since the distance between Almaden and Branham is roughly 2 miles, this shift will mean some PNR patronswould likely need to drive farther to park at a LRT station. This added driving distance will likely result in a loss of patrons, calculated using the BART methodology, as follows. Almaden is projected to have a PNR rate (drivers only) of 46% (refer to Figure 3-1); thus 54% of the patrons are assumed to access the station by other modes than driving. Therefore, 54% (21 patrons) of the 38 displaced drivers would be

VTA Replacement Parking Study Metropolitan Transportation Commission
Nelson\Nygaard Consulting Associates Inc. ● Eisen|Letunic ● 3-3
retained while 17 patrons may be lost. Ohlone/Chynoweth is projected to have a PNR rate of 57%; thus 43% of the patrons are assumed to access the station by other modes than driving. Hence, of the 127 spaces lost, roughly 72 patrons may be lost, while 55 patrons would be retained. This is a potentially significant loss in patrons and as such it may be more feasible to shift a smaller number of drivers.
At Tamien (Tier 1), reduce the parking supply by 219 spaces from 369 spaces to 150 spaces. The projected demand is 147 spaces. No shifting would be necessary.
At Santa Teresa (Tier 1), reduce the parking supply by 900 spaces from 1,155 to 255 spaces. The projected demand is 254 spaces.No shifting would be necessary.
At Capitol (Tier 1), reduce the parking supply by 898 spaces from 951 spaces to 53. Capitol is projected to have a PNR rate of 4%; thus 96% of the patrons are assumed to access the station by other modes than driving.
Figure 3-1 Modeled 2035 Ridership and Parking Demand
2035 Ridership
(Modeled) 2035 Parking Demand
(Modeled) % Patrons Parking
(PNR Rate)
Tier 1
Capitol 1,474 53 4%
Tamien 1,588 147 9%
River Oaks 1,678 234 14%
Santa Teresa 898 254 28%
Tier 2
Curtner 1,368 41 3%
Branham 363 0 0%
Almaden 495 227 46%
Blossom Hill 603 127 21%
Alum Rock 1,134 142 13%
Hostetter 789 108 14%
Tier 3
Ohlone/Chynoweth 1,188 676 57%
Snell 1,177 401 34%
Cottle 614 224 36%
Total 13,369 2,634 20%
Source: VTA (2011)
With these shifts in demand and reductions in existing parking supply, parking facilities would only need to be constructed at two stations; River Oaks (212-space parking structure) and Alum Rock (32-space surface parking), as projected future demand would be met at the other stations. This would result in a total capital construction cost of $5,500,000, plus land costs since this land could otherwise have been used for development.
VTA Replacement Parking Study Metropolitan Transportation Commission
Nelson\Nygaard Consulting Associates Inc. ● Eisen|Letunic ● 3-4
Transportation demand management policies, such as parking pricing, which are discussed in Scenario 3, would be a potential tool that could help encourage drivers to shift to an alternate station or access the preferred station by other modes than driving.
Scenario 3 – Shift Parking Supply and Reduce Parking Demand As described in Scenario 2, the construction of new parking structures at River Oaks and Alum Rock stations, in combination with the shifting of parking demand from stations with a projected parking deficit to those with excess parking supply, can adequately address the projected parking demand for 2035. In addition, there may be an opportunity to further reduce parking demand at the Tamien, Santa Teresa, and Capitol stations through the implementation of TDM programs, freeing up more land at Tier 1 stations for future development.
However, if in addition, parking demand is reduced at all stations through the implementation of TDM and access measures, less shifting to Tier 3 stations would be necessary, freeing up more space for future transit-oriented development and potentially eliminating the need for a parking structure at Alum Rock. This approach is supported by Envision San Jose 2040, which highlights the development of a balanced transportation system, in part via a drive-alone commute mode target for 2040 of no more than 40% of all trips, a significant reduction from 78% in 2008.
Listed below are three packages of potential programs that could reduce the demand for parking at light rail stations. As further detailed in Appendix A, it is difficult to quantify the impact of a particular TDM measure or TDM package on mode share. Therefore, although there are certainly cases in which certain measures have had a profound impact on mode choice in a given context, the following analysis relies on more conservative assumptions.
The three packages presented reflect groups of measures that are conservatively estimated to have a low (5% parking demand reduction), medium (10% parking demand reduction), or high impact (15% parking demand reduction) on parking demand. For a more detailed description of the measures as well as the evaluated impacts of these measures on reducing parking demand or encouraging the use of alternative modes of transportation, refer to Appendix A.
Package 1: Low Impact (5% parking reduction)
Moderate pedestrian and bicycle access improvements
Moderately improved wayfinding
Preferential parking for carpools
General marketing of transportation alternatives to residents
Package 2: Medium Impact (10% parking reduction)
All measures in Package 1 plus the following:
Additional investment in pedestrian and bicycle access
Shared parking with surrounding existing or new development
Transit &shuttle infrastructure improvements
Incentives for carpooling and other alternative modes
Package 3: High Impact (15% parking reduction)
All measures in Packages 1 and 2 plus the following:

VTA Replacement Parking Study Metropolitan Transportation Commission
Nelson\Nygaard Consulting Associates Inc. ● Eisen|Letunic ● 3-5
High investment in pedestrian and bicycle access
Market-based parking pricing16
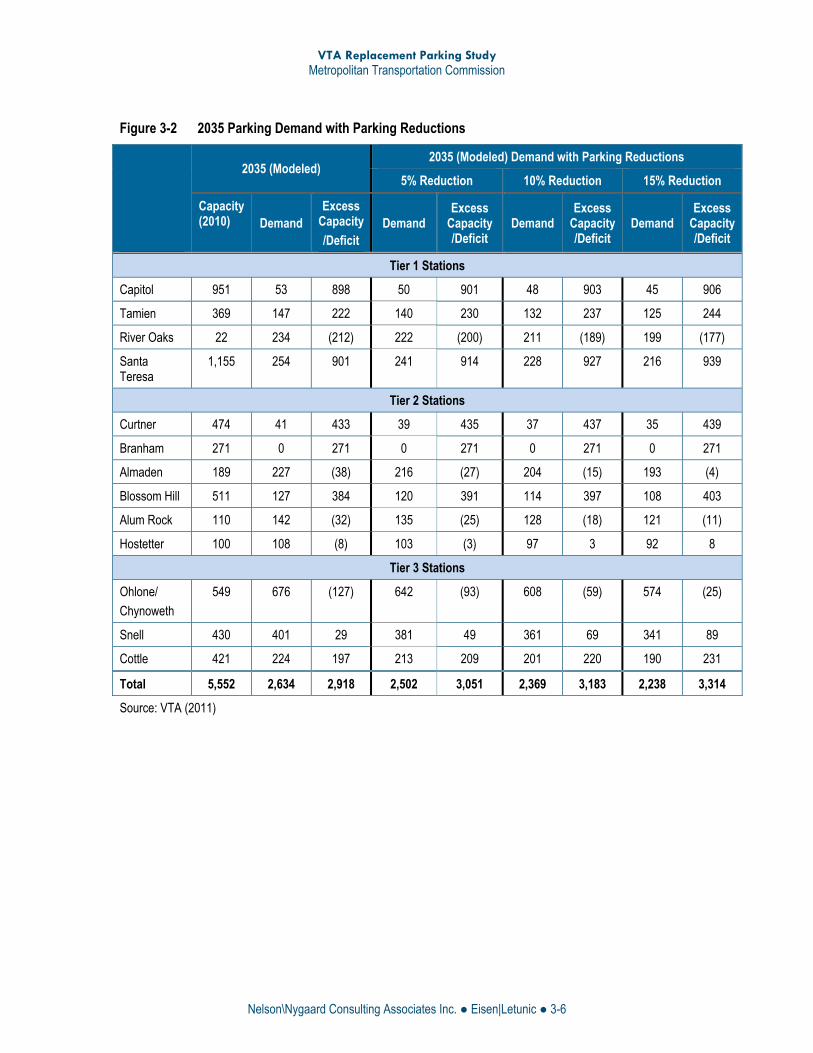
Figure 3-2 shows the impact that 5%, 10%, and 15% reduction in parking demand would have at each of the 13 stations evaluated.
A 10% reduction in parking demand would eliminate the parking deficit at Hostetter station while a 15% reduction would also almost completely eliminate the parking deficit at Alum Rock and Almaden, and would reduce the parking deficit at Ohlone/Chynoweth from 127 spaces to 25 spaces. The remaining parking deficit at these three stations could be shifted to Branham, which has 271 available spaces.
River Oaks has the largest projected parking deficit at 212 spaces. With a 15% reduction in parking demand, the deficit would be reduced to 177 parking spaces, which would still require the construction of additional parking facilities.
By reducing the demand for parking, the number of parking facilities that would potentially need to be constructed could be reduced to one and the projected number of stations with a significant parking deficit could be reduced from five to one.
16 Parking pricing may have limited effectiveness as long as there is an oversupply of LRT parking and employers in Santa Clara County provide free parking.
VTA Replacement Parking Study Metropolitan Transportation Commission
Nelson\Nygaard Consulting Associates Inc. ● Eisen|Letunic ● 3-6
Figure 3-2 2035 Parking Demand with Parking Reductions
2035 (Modeled) 2035 (Modeled) Demand with Parking Reductions
5% Reduction 10% Reduction 15% Reduction
Capacity(2010) Demand
Excess Capacity
/Deficit Demand
Excess Capacity /Deficit
Demand Excess
Capacity /Deficit
Demand Excess
Capacity /Deficit
Tier 1 Stations
Capitol 951 53 898 50 901 48 903 45 906
Tamien 369 147 222 140 230 132 237 125 244
River Oaks 22 234 (212) 222 (200) 211 (189) 199 (177)
Santa Teresa
1,155 254 901 241 914 228 927 216 939
Tier 2 Stations
Curtner 474 41 433 39 435 37 437 35 439
Branham 271 0 271 0 271 0 271 0 271
Almaden 189 227 (38) 216 (27) 204 (15) 193 (4)
Blossom Hill 511 127 384 120 391 114 397 108 403
Alum Rock 110 142 (32) 135 (25) 128 (18) 121 (11)
Hostetter 100 108 (8) 103 (3) 97 3 92 8
Tier 3 Stations
Ohlone/
Chynoweth
549 676 (127) 642 (93) 608 (59) 574 (25)
Snell 430 401 29 381 49 361 69 341 89
Cottle 421 224 197 213 209 201 220 190 231
Total 5,552 2,634 2,918 2,502 3,051 2,369 3,183 2,238 3,314
Source: VTA (2011)

VTA Replacement Parking Study Metropolitan Transportation Commission
Nelson\Nygaard Consulting Associates Inc. ● Eisen|Letunic ● 4-1
4 RECOMMENDED REPLACEMENT PARKING POLICY
Based on the findings in Chapter 3 and looking forward to the year 2035, the projected parking demand is about 47% of the 2010 capacity of the 13 evaluated San Jose stations. However, if the modeling is accurate, demand will outstrip supply at five individual VTA light rail stations. One way to address the projected parking deficit at these five stations is to construct additional parking facilities at the impacted stations. However, the construction of new parking facilities is costly and undermines VTA’s TOD goals.VTA’s strategic station ranking, in fact, acknowledges that some stations are too valuable to the system – both in terms of revenue and passenger generation – as development sites to use for additional parking. Furthermore, VTA may want to consider exercising caution when using the 2010 and 2035 modeling estimates to make financial and construction decisions, as it appears the modeled values may not reflect actual parking demand at the station-level.
The use of parking demand reduction and access improvement measures is another option for potential reduction in the amount of new parking that would need to be constructed. Envision San Jose 2040 has set a goal of creating a balanced transportation system by substantially increasing the proportion of commute travel using modes other than the single-occupant vehicle. Thus, as new development both at and around VTA stations will result in increased ridership, the mode of access to these stations will also shift and result in an increase in the number of riders accessing the station via non-auto modes. Investing in access improvements other than parking structures is a strategy that should be taken seriously, as it is most always a much more cost-effective approach than constructing additional parking, particularly if taking into account the external costs (e.g., local pollution, GHG emissions, health impacts, and safety impacts) of continued growth in driving and parking.
The following recommendations build on the findings of this study and also take into account parking policies of peer agencies (refer to Appendix B), particularly BART’s 2005 Replacement Parking for Joint Development, the most detailed and data-intensive replacement parking methodology currently available in North America. It is recommended that VTA implement a more simplified policy document than BART’s to guide replacement parking planning by tailoring selected principles and policies from BART’s methodology to reflect VTA’s conditions and service area. General guiding principles for a replacement parking policy are listed below, followed by a more detailed station-specific replacement parking analysis approach.
GUIDING PRINCIPLES The following is a list of recommended over-arching principles for any access and replacement parking policies:
VTA Replacement Parking Study Metropolitan Transportation Commission
Nelson\Nygaard Consulting Associates Inc. ● Eisen|Letunic ● 4-2
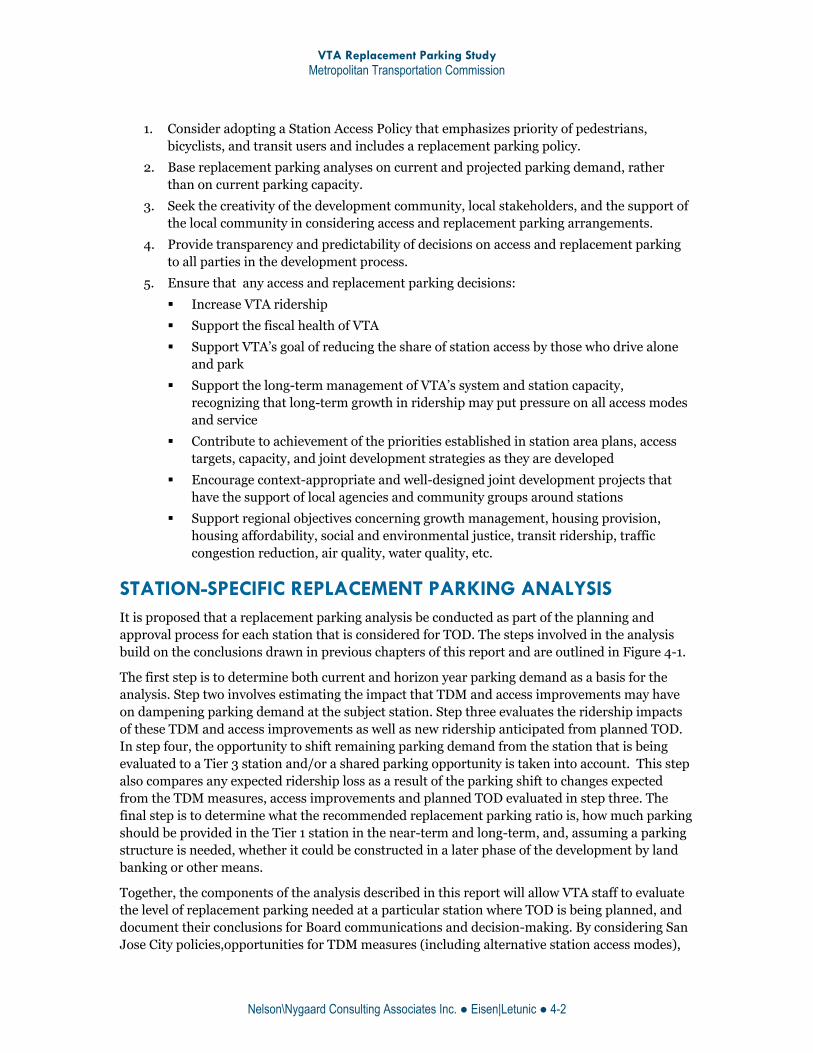
1. Consider adopting a Station Access Policy that emphasizes priority of pedestrians, bicyclists, and transit users and includes a replacement parking policy.
2. Base replacement parking analyses on current and projected parking demand, rather than on current parking capacity.
3. Seek the creativity of the development community, local stakeholders, and the support of the local community in considering access and replacement parking arrangements.
4. Provide transparency and predictability of decisions on access and replacement parking to all parties in the development process.
5. Ensure that any access and replacement parking decisions:
Increase VTA ridership
Support the fiscal health of VTA
Support VTA’s goal of reducing the share of station access by those who drive alone and park
Support the long-term management of VTA’s system and station capacity, recognizing that long-term growth in ridership may put pressure on all access modes and service
Contribute to achievement of the priorities established in station area plans, access targets, capacity, and joint development strategies as they are developed
Encourage context-appropriate and well-designed joint development projects that have the support of local agencies and community groups around stations
Support regional objectives concerning growth management, housing provision, housing affordability, social and environmental justice, transit ridership, traffic congestion reduction, air quality, water quality, etc.
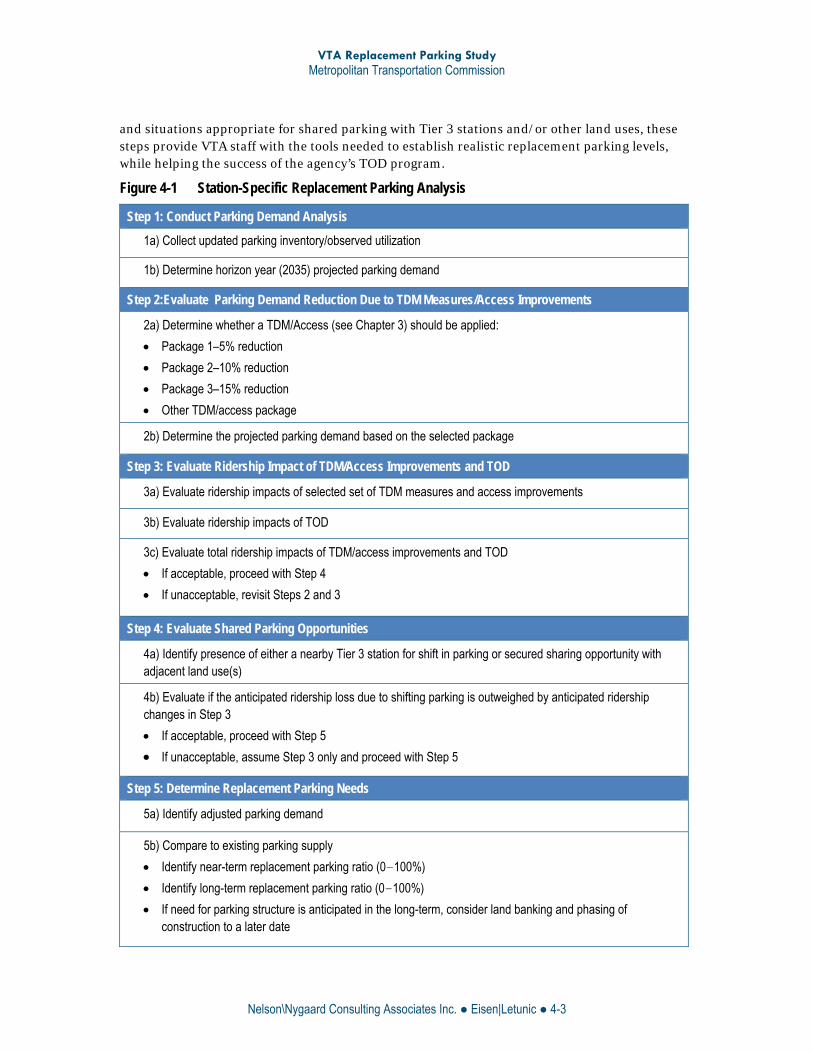
STATION-SPECIFIC REPLACEMENT PARKING ANALYSIS It is proposed that a replacement parking analysis be conducted as part of the planning and approval process for each station that is considered for TOD. The steps involved in the analysis build on the conclusions drawn in previous chapters of this report and are outlined in Figure 4-1.
The first step is to determine both current and horizon year parking demand as a basis for the analysis. Step two involves estimating the impact that TDM and access improvements may have on dampening parking demand at the subject station. Step three evaluates the ridership impacts of these TDM and access improvements as well as new ridership anticipated from planned TOD. In step four, the opportunity to shift remaining parking demand from the station that is being evaluated to a Tier 3 station and/or a shared parking opportunity is taken into account. This step also compares any expected ridership loss as a result of the parking shift to changes expected from the TDM measures, access improvements and planned TOD evaluated in step three. The final step is to determine what the recommended replacement parking ratio is, how much parking should be provided in the Tier 1 station in the near-term and long-term, and, assuming a parking structure is needed, whether it could be constructed in a later phase of the development by land banking or other means.
Together, the components of the analysis described in this report will allow VTA staff to evaluate the level of replacement parking needed at a particular station where TOD is being planned, and document their conclusions for Board communications and decision-making. By considering San Jose City policies,opportunities for TDM measures (including alternative station access modes),
VTA Replacement Parking Study Metropolitan Transportation Commission
Nelson\Nygaard Consulting Associates Inc. ● Eisen|Letunic ● 4-3
and situations appropriate for shared parking with Tier 3 stations and/or other land uses, these steps provide VTA staff with the tools needed to establish realistic replacement parking levels, while helping the success of the agency’s TOD program.
Figure 4-1 Station-Specific Replacement Parking Analysis
Step 1: Conduct Parking Demand Analysis
1a) Collect updated parking inventory/observed utilization
1b) Determine horizon year (2035) projected parking demand
Step 2:Evaluate Parking Demand Reduction Due to TDM Measures/Access Improvements
2a) Determine whether a TDM/Access (see Chapter 3) should be applied:
Package 1–5% reduction
Package 2–10% reduction
Package 3–15% reduction
Other TDM/access package
2b) Determine the projected parking demand based on the selected package
Step 3: Evaluate Ridership Impact of TDM/Access Improvements and TOD
3a) Evaluate ridership impacts of selected set of TDM measures and access improvements
3b) Evaluate ridership impacts of TOD
3c) Evaluate total ridership impacts of TDM/access improvements and TOD
If acceptable, proceed with Step 4
If unacceptable, revisit Steps 2 and 3
Step 4: Evaluate Shared Parking Opportunities
4a) Identify presence of either a nearby Tier 3 station for shift in parking or secured sharing opportunity with adjacent land use(s)
4b) Evaluate if the anticipated ridership loss due to shifting parking is outweighed by anticipated ridership changes in Step 3
If acceptable, proceed with Step 5
If unacceptable, assume Step 3 only and proceed with Step 5
Step 5: Determine Replacement Parking Needs
5a) Identify adjusted parking demand
5b) Compare to existing parking supply
Identify near-term replacement parking ratio (0—100%)
Identify long-term replacement parking ratio (0—100%)
If need for parking structure is anticipated in the long-term, consider land banking and phasing of construction to a later date

APPENDIX A Task 2:
TOD Parking Management Strategies


M E M O R A N D U M To: Therese Trivedi
From: Jessica ter Schure and Francesca Napolitan Victoria Eisen, Eisen|Letunic
Date: August 16, 2011
Subject: VTA Replacement Parking Study – Task 2: Parking Management Strategies
A key component when creating a successful transit-oriented development (TOD) is providing adequate parking for both transit patrons and the project itself while optimizing the land for development. This memorandum examines strategies that can reduce the auto access mode share to VTA’s light rail stations, focusing primarily on measures that reduce transit patrons’ parking needs. Although equally important, the scope of this study is less on the actual project parking demand. Nonetheless, a brief summary of potential measures that can reduce TOD project parking demand is provided.
A third aspect that is examined in this memo is how to evaluate how much parking to provide for transit riders compared to the current parking supply at each station. This is commonly referred to as a replacement parking analysis. An overview of BART’s Replacement Parking for Joint Development: An Access Policy Methodology is presented as it is currently the most robust methodology adopted by any North American transit system. Lastly, the concept of shared parking and its applicability to TOD development is described.
Transit Parking Reduction Strategies There are a number of strategies and measures that can encourage transit riders to walk, bike, carpool, or take transit to light rail stations rather than driving, thereby reducing the demand for parking at stations.
In this section, a number of physical improvements and parking management policies that can increase the alternative mode share are described. The improvements and policies described in this document reflect best practices as well as VTA adopted policies, including the agency’s2003 publication, Pedestrian Technical Guidelines and its 2008 Santa Clara Countywide Bicycle Plan. The pedestrian guidelines provide details on how to successfully improve the pedestrian environment both within and outside of station areas and guidance on best practices with regard to station way-finding. Similarly, the bike plan guides future development of major bicycling facilities in the county, including routes that serve VTA light rail stations.
Where there is documentation or research on the effects of measures to reduce vehicle trip generation or parking demand, a discussion of these effects is included. This report cites the most recent and relevant research available; however for some topics the most current data is over ten years old.1 That is not to say, however, that this research is not applicable. It should also be noted
1 A literature review was conducted to find the most up to date references. A number of articles that have been written in the past five to seven years source data from the early 2000’s and 1990’s that are cited in this report. Thus the data included in this report is the most current.
VTA REPLACEMENT PARKING STUDY | TASK 2: PARKING MANAGEMENT STRATEGIES Metropolitan Transportation Commission
Nelson\Nygaard Consulting Associates Inc. | Eisen|Letunic | 2
that for some measures, current research has only studied the effects of the specific measure on vehicle trips, not parking demand. While there is not a one to one relationship between vehicle trip generation and parking demand, there is a strong correlation, thus this information has been included to provide an approximate measure of effectiveness.
Physical Access Improvements
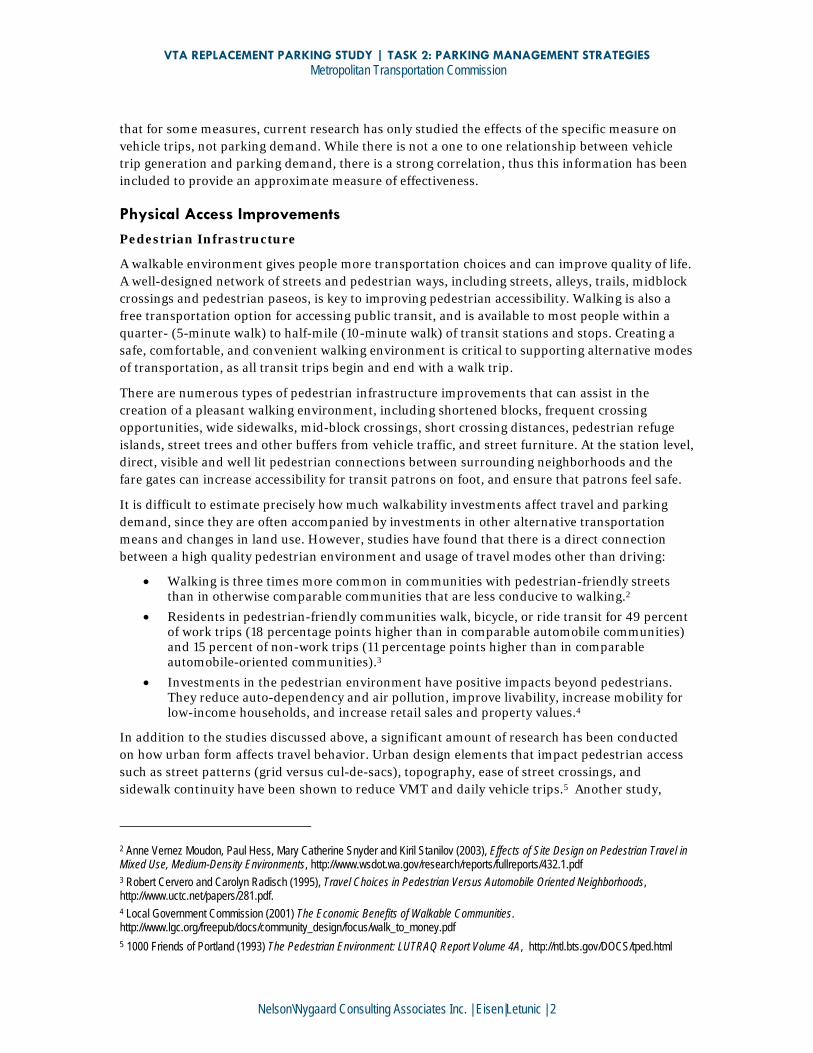
Pedestrian Infrastructure
A walkable environment gives people more transportation choices and can improve quality of life. A well-designed network of streets and pedestrian ways, including streets, alleys, trails, midblock crossings and pedestrian paseos, is key to improving pedestrian accessibility. Walking is also a free transportation option for accessing public transit, and is available to most people within a quarter- (5-minute walk) to half-mile (10-minute walk) of transit stations and stops. Creating a safe, comfortable, and convenient walking environment is critical to supporting alternative modes of transportation, as all transit trips begin and end with a walk trip.
There are numerous types of pedestrian infrastructure improvements that can assist in the creation of a pleasant walking environment, including shortened blocks, frequent crossing opportunities, wide sidewalks, mid-block crossings, short crossing distances, pedestrian refuge islands, street trees and other buffers from vehicle traffic, and street furniture. At the station level, direct, visible and well lit pedestrian connections between surrounding neighborhoods and the fare gates can increase accessibility for transit patrons on foot, and ensure that patrons feel safe.
It is difficult to estimate precisely how much walkability investments affect travel and parking demand, since they are often accompanied by investments in other alternative transportation means and changes in land use. However, studies have found that there is a direct connection between a high quality pedestrian environment and usage of travel modes other than driving:
Walking is three times more common in communities with pedestrian-friendly streets than in otherwise comparable communities that are less conducive to walking.2
Residents in pedestrian-friendly communities walk, bicycle, or ride transit for 49 percent of work trips (18 percentage points higher than in comparable automobile communities) and 15 percent of non-work trips (11 percentage points higher than in comparable automobile-oriented communities).3
Investments in the pedestrian environment have positive impacts beyond pedestrians. They reduce auto-dependency and air pollution, improve livability, increase mobility for low-income households, and increase retail sales and property values.4
In addition to the studies discussed above, a significant amount of research has been conducted on how urban form affects travel behavior. Urban design elements that impact pedestrian access such as street patterns (grid versus cul-de-sacs), topography, ease of street crossings, and sidewalk continuity have been shown to reduce VMT and daily vehicle trips.5 Another study,
2 Anne Vernez Moudon, Paul Hess, Mary Catherine Snyder and Kiril Stanilov (2003), Effects of Site Design on Pedestrian Travel in Mixed Use, Medium-Density Environments, http://www.wsdot.wa.gov/research/reports/fullreports/432.1.pdf 3 Robert Cervero and Carolyn Radisch (1995), Travel Choices in Pedestrian Versus Automobile Oriented Neighborhoods, http://www.uctc.net/papers/281.pdf. 4 Local Government Commission (2001) The Economic Benefits of Walkable Communities. http://www.lgc.org/freepub/docs/community_design/focus/walk_to_money.pdf 5 1000 Friends of Portland (1993) The Pedestrian Environment: LUTRAQ Report Volume 4A, http://ntl.bts.gov/DOCS/tped.html

VTA REPLACEMENT PARKING STUDY | TASK 2: PARKING MANAGEMENT STRATEGIES Metropolitan Transportation Commission
Nelson\Nygaard Consulting Associates Inc. | Eisen|Letunic | 3
which examined how urban form variables affect the number of pedestrian trips for recreation and shopping, showed that perceived safety, shade, and the frequency and desirability of seeing people while walking all encourage walking over vehicle trips.6
Bicycle Infrastructure
Bicycle system improvements that make commuting by bike easier and more convenient for more people can increase the number of transit patrons accessing stations by bike, particularly for passengers traveling farther than walking distance, up to about three miles or more. Improved bicycle facilities can increase access to and from transit hubs, thereby expanding the “catchment area”7 of the transit stop or station and increasing ridership. At transit stations, secure, long-term bicycle parking, such as bicycle lockers and, where warranted, bicycle stations, is critical in ensuring that patrons feel safe leaving their bike at the station.
Transit & Shuttle Infrastructure Improvements
Ensuring that transit riders have a comfortable and pleasant experience at the station is an important component to encouraging transit usage. Waiting areas that provide shelter from rain, wind, and the sun should be provided for light rail riders as well as for connecting services such as shuttles and local buses. Benches and other amenities, such as drinking fountains and restrooms, also help encourage non-auto access to and egress from stations.
Wayfinding
Transit riders need wayfinding signage to direct them from transit stops to nearby destinations and back. Pedestrian and bicycle wayfinding signage should be located at the eye level of pedestrians and cyclists, at a scale that is easily readable, and should be provided separately from vehicular wayfinding signage.
TOD Parking Demand Management Strategies
This section provides an analysis of parking demand strategies for residential, commercial and mixed-use transit-oriented development. Although they don’t directly address parking demand by transit passengers, they provide measures local jurisdictions and others can use to encourage new transit passengers who are less likely than the average rider to need parking at the station.
Off-Street Parking Pricing
One of the most significant factors affecting motorists’ choice of whether to drive or travel by another mode is the price of parking at the destination. Managing on- and off-street transit station parking pricing is an important strategy for reducing peak-hour trip generation, localized traffic congestion, and parking demand.
Research shows that increasing parking fees can significantly reduce parking demand. Empirically derived as well as modeled parking demand elasticities for area-wide changes in parking price generally range from -0.1 to -0.6, with -0.3 being the most frequently cited value.8 For example, if the daily cost to park increased from $1 to $2, a 100 percent price increase,
6 Susan Handy, Kelly Clifton, and Janice Fisher (1998) The Effectiveness of Land Use Policies as a Strategy for Reducing Auto Dependence : A Study of Austin Neighborhoods, http://www.des.ucdavis.edu/faculty/handy/Austin_Report.pdf 7 A transit catchment area is the geographic area from which a transit station draws riders. 8 TCRP Report 95 Chapter 13 “Parking Pricing and Fees: Traveler Response to Transportation”. 2005.
VTA REPLACEMENT PARKING STUDY | TASK 2: PARKING MANAGEMENT STRATEGIES Metropolitan Transportation Commission
Nelson\Nygaard Consulting Associates Inc. | Eisen|Letunic | 4
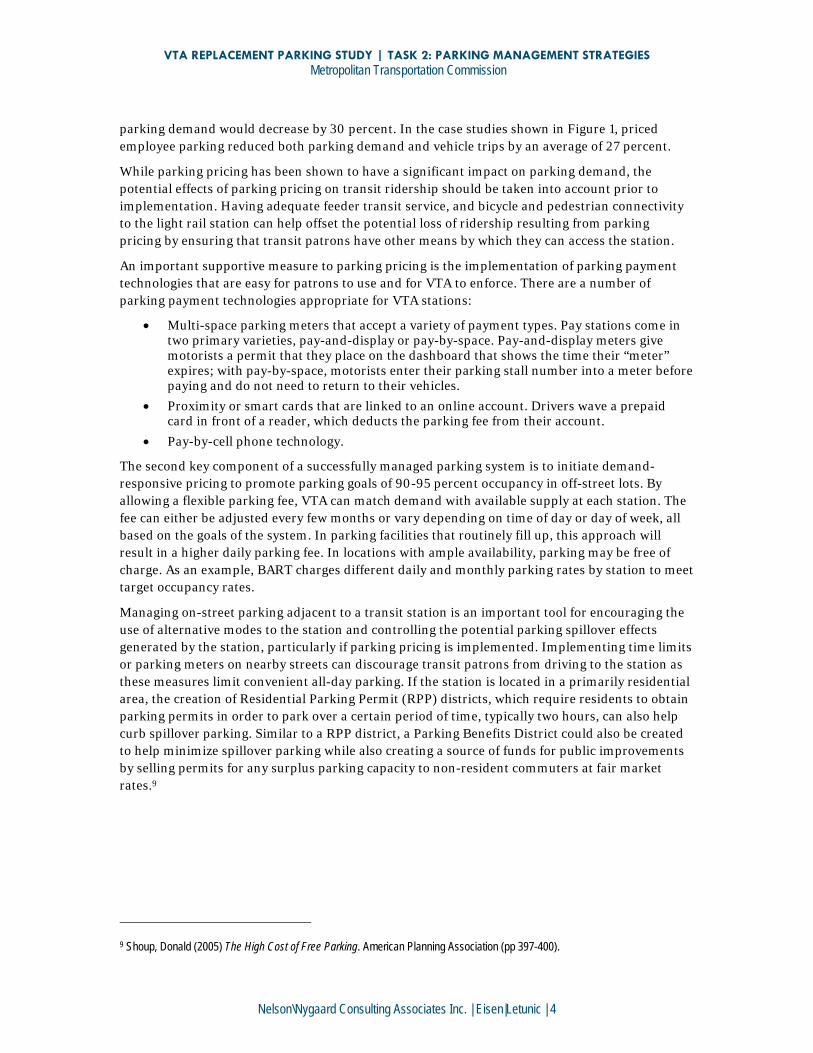
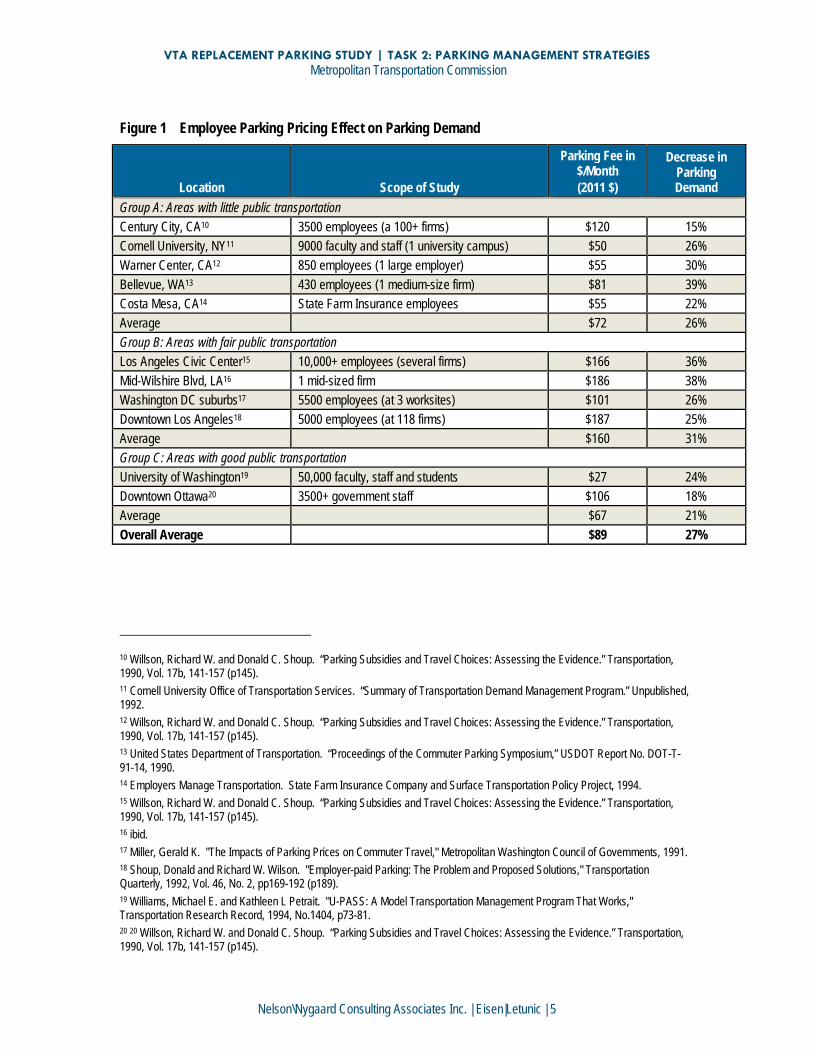
parking demand would decrease by 30 percent. In the case studies shown in Figure 1, priced employee parking reduced both parking demand and vehicle trips by an average of 27 percent.
While parking pricing has been shown to have a significant impact on parking demand, the potential effects of parking pricing on transit ridership should be taken into account prior to implementation. Having adequate feeder transit service, and bicycle and pedestrian connectivity to the light rail station can help offset the potential loss of ridership resulting from parking pricing by ensuring that transit patrons have other means by which they can access the station.
An important supportive measure to parking pricing is the implementation of parking payment technologies that are easy for patrons to use and for VTA to enforce. There are a number of parking payment technologies appropriate for VTA stations:
Multi-space parking meters that accept a variety of payment types. Pay stations come in two primary varieties, pay-and-display or pay-by-space. Pay-and-display meters give motorists a permit that they place on the dashboard that shows the time their “meter” expires; with pay-by-space, motorists enter their parking stall number into a meter before paying and do not need to return to their vehicles.
Proximity or smart cards that are linked to an online account. Drivers wave a prepaid card in front of a reader, which deducts the parking fee from their account.
Pay-by-cell phone technology.
The second key component of a successfully managed parking system is to initiate demand-responsive pricing to promote parking goals of 90-95 percent occupancy in off-street lots. By allowing a flexible parking fee, VTA can match demand with available supply at each station. The fee can either be adjusted every few months or vary depending on time of day or day of week, all based on the goals of the system. In parking facilities that routinely fill up, this approach will result in a higher daily parking fee. In locations with ample availability, parking may be free of charge. As an example, BART charges different daily and monthly parking rates by station to meet target occupancy rates.
Managing on-street parking adjacent to a transit station is an important tool for encouraging the use of alternative modes to the station and controlling the potential parking spillover effects generated by the station, particularly if parking pricing is implemented. Implementing time limits or parking meters on nearby streets can discourage transit patrons from driving to the station as these measures limit convenient all-day parking. If the station is located in a primarily residential area, the creation of Residential Parking Permit (RPP) districts, which require residents to obtain parking permits in order to park over a certain period of time, typically two hours, can also help curb spillover parking. Similar to a RPP district, a Parking Benefits District could also be created to help minimize spillover parking while also creating a source of funds for public improvements by selling permits for any surplus parking capacity to non-resident commuters at fair market rates.9
9 Shoup, Donald (2005) The High Cost of Free Parking. American Planning Association (pp 397-400).
VTA REPLACEMENT PARKING STUDY | TASK 2: PARKING MANAGEMENT STRATEGIES Metropolitan Transportation Commission
Nelson\Nygaard Consulting Associates Inc. | Eisen|Letunic | 5
Figure 1 Employee Parking Pricing Effect on Parking Demand
Location Scope of Study
Parking Fee in $/Month (2011 $)
Decrease in Parking Demand
Group A: Areas with little public transportation Century City, CA10 3500 employees (a 100+ firms) $120 15% Cornell University, NY11 9000 faculty and staff (1 university campus) $50 26% Warner Center, CA12 850 employees (1 large employer) $55 30% Bellevue, WA13 430 employees (1 medium-size firm) $81 39% Costa Mesa, CA14 State Farm Insurance employees $55 22% Average $72 26% Group B: Areas with fair public transportation Los Angeles Civic Center15 10,000+ employees (several firms) $166 36% Mid-Wilshire Blvd, LA16 1 mid-sized firm $186 38% Washington DC suburbs17 5500 employees (at 3 worksites) $101 26% Downtown Los Angeles18 5000 employees (at 118 firms) $187 25% Average $160 31% Group C: Areas with good public transportation University of Washington19 50,000 faculty, staff and students $27 24% Downtown Ottawa20 3500+ government staff $106 18% Average $67 21% Overall Average $89 27%
10 Willson, Richard W. and Donald C. Shoup. “Parking Subsidies and Travel Choices: Assessing the Evidence.” Transportation, 1990, Vol. 17b, 141-157 (p145). 11 Cornell University Office of Transportation Services. “Summary of Transportation Demand Management Program.” Unpublished, 1992. 12 Willson, Richard W. and Donald C. Shoup. “Parking Subsidies and Travel Choices: Assessing the Evidence.” Transportation, 1990, Vol. 17b, 141-157 (p145). 13 United States Department of Transportation. “Proceedings of the Commuter Parking Symposium,” USDOT Report No. DOT-T-91-14, 1990. 14 Employers Manage Transportation. State Farm Insurance Company and Surface Transportation Policy Project, 1994. 15 Willson, Richard W. and Donald C. Shoup. “Parking Subsidies and Travel Choices: Assessing the Evidence.” Transportation, 1990, Vol. 17b, 141-157 (p145). 16 ibid. 17 Miller, Gerald K. "The Impacts of Parking Prices on Commuter Travel," Metropolitan Washington Council of Governments, 1991. 18 Shoup, Donald and Richard W. Wilson. "Employer-paid Parking: The Problem and Proposed Solutions," Transportation Quarterly, 1992, Vol. 46, No. 2, pp169-192 (p189). 19 Williams, Michael E. and Kathleen L Petrait. "U-PASS: A Model Transportation Management Program That Works," Transportation Research Record, 1994, No.1404, p73-81. 20 20 Willson, Richard W. and Donald C. Shoup. “Parking Subsidies and Travel Choices: Assessing the Evidence.” Transportation, 1990, Vol. 17b, 141-157 (p145).

VTA REPLACEMENT PARKING STUDY | TASK 2: PARKING MANAGEMENT STRATEGIES Metropolitan Transportation Commission
Nelson\Nygaard Consulting Associates Inc. | Eisen|Letunic | 6
Incentives for Carpooling
For transit patrons for whom modes other than driving to transit may not be feasible, carpooling may be an option. Providing preferential, reserved carpool parking near station entrances and, when parking is priced, reduced fees, can help incentivize carpooling.
Project Parking Strategies There are a number of policies and programs that residential and mixed-use developments near transit can adopt to reduce parking demand and increase residents’ and employees’ use of alternative modes of transportation. Although these programs may not have a direct effect on transit station parking demand, since they live nearby, these new passengers aren’t likely to drive to the station, thus adding ridership without adding parking demand. In addition, research has shown that parking demand is lower at TOD locations when compared to conventional suburban developments; thus, policies such as reduced minimum parking requirements and unbundled parking may be appropriate for VTA light rail stations.
In November 2010, the findings of a collaborative study conducted by the VTA Planning Department and a team of San Jose State University graduate students examining parking utilization at residential TODs in Santa Clara County were released. The purpose of the study, entitled A Parking Utilization Survey of Transit-Oriented Development Residential Properties in Santa Clara County, was to determine if other recent research that has found that TOD developments in the Bay Area are over-supplying parking is true for TOD projects near VTA light rail and Caltrain stations. If so, this would provide evidence that reduced parking requirements may be feasible around Santa Clara County TODs.
A survey of actual parking utilization for residents of 12 housing developments near VTA light rail and Caltrain stations found that the supply rate is higher than the parking demand rate for all 12 sites (22 percent higher on average), indicating that more parking is being provided than is actually needed.21 This finding suggests that local parking code requirements for residential TOD properties in Santa Clara County, and other similar locations, could be reduced by up to 26 percent given total parking utilization rates, without risk of underparking development.
In light of the findings of this study, as well as policies that have been successful at other TOD sites, a brief discussion of programs that may be appropriate for VTA light rail stations are discussed below.
Parking Requirement Adjustments
Most cities’ minimum parking requirements typically take into account only two variables: land use and the size of development. However, they fail to take into account a number of other factors that affect parking demand, including geography (e.g. pedestrian environment, proximity to transit, and availability of services), demography (e.g. income, household size, and vehicle ownership rates), and other relevant factors that affect parking demand (e.g. the presence of transportation demand management programs).
Reduced parking requirements could be established for TODs near VTA light rail stations where cities think parking demand will be lower. Another option is to eliminate minimum parking
21 All 12 sites were observed to have significant unused parking spaces during the peak parking demand period of 12:00 midnight and 4:00 AM, ranging between 17 and 39 percent of the available parking spaces observed as unused.

VTA REPLACEMENT PARKING STUDY | TASK 2: PARKING MANAGEMENT STRATEGIES Metropolitan Transportation Commission
Nelson\Nygaard Consulting Associates Inc. | Eisen|Letunic | 7
requirements. This would not necessarily mean that no new parking would be constructed but rather that market forces would determine the appropriate level of supply based on market demands. By reducing the amount of parking required, a larger portion of a site can be developed into usable space. It should be noted that a Residential Permit Parking District or Parking Benefits District may need to be created if transit patrons are parking in the TOD development.
Research completed in 2007 for the National Academy of Science Transportation Research Board shows that automobile use in TODs is far lower than in conventional developments. The analysis found that ITE parking and trip generation rates have a serious “suburban bias” and do not take into account the effects of internal trip capture in mixed use sites or the transit access of TODs. 22
A survey of relevant literature also found lower vehicle ownership rates for rental units in projects of moderate density located in areas with good transit access, as listed below. These examples are intended to provide a range of parking rates in comparable TOD locations that can provide a general sense of what adequate minimum parking rates may potentially be for development at and near VTA light rail stations. These examples also illustrate that households in TODs tend to have lower vehicle ownership rates than conventional suburban developments, thus further strengthening the case for lower minimum parking at TODs.
Downtown Hayward: A 2004 survey of Downtown Hayward residents living in new rental and for-sale developments near the Hayward BART station owned on average 0.69 vehicles/bedroom23 compared to a citywide average household vehicle ownership rate of 1.8.24
Dublin/Pleasanton BART Station: A parking analysis for a development project proposed for the new West Dublin/Pleasanton BART station found the following parking supply ratios for other transit-oriented development projects surveyed, which provides a range of rates that are being used at TODs: 25
An average of 1.41 spaces/unit supplied at TOD projects across California
A range of 1.08 spaces/unit to 1.5 spaces/units supplied at Pleasant Hill BART TOD project
An average of 1.31 spaces/unit supplied at the Alameda County BART TOD project and Fruitvale BART TOD project.
1.5 spaces/unit required in the East Dublin BART Transit Center Stage 1 Development Plan
These rates are lower than the City of Pleasanton citywide vehicle ownership rate of 1.56 vehicles per renter household.26
Unbundled Parking
Parking costs are generally included in the sale or rental price of housing and commercial space. Although the cost of parking is often hidden in this way, parking is never free; instead the cost to
22 Transit Cooperative Research Program Report 128, Effects of TOD on Housing, Parking, and Travel. 2008 23 City of Hayward Department of Community and Economic Development, “Downtown Hayward BART Station Housing Survey – Summary of Responses” (9/27/04), page 2. 24 2000 U.S. Census 25 TJKM Transportation Consultants, “Draft Triggering Analysis for the West Dublin BART Transit Village Development in the City of Dublin” (7/19/07), page 25. 26 2000 U.S. Census data.
VTA REPLACEMENT PARKING STUDY | TASK 2: PARKING MANAGEMENT STRATEGIES Metropolitan Transportation Commission
Nelson\Nygaard Consulting Associates Inc. | Eisen|Letunic | 8
construct and maintain the “free” parking is hidden in the cost of all other goods and services, whether they be housing, employment or a gallon of milk. For all commercial and residential development near VTA light rail stations, the cost to lease or purchase parking could be unbundled from the cost to lease or purchase the usable space, thereby providing a financial incentive to residents and employers to lease only the amount of parking they need. For residential development, unbundled parking may prompt some residents to dispense with one or all of their cars and to take more of their trips by other modes. Charging market-based pricing for parking is the single most effective strategy to encourage households to own fewer cars, and subsequently reduce parking demand.27 According to a study by Todd Litman, unbundling residential parking can significantly reduce household vehicle ownership.28
Carsharing
Carsharing programs allow people to have access to a shared fleet of vehicles on an as-needed basis. Usage charges are assessed at an hourly and/or mileage rate, in addition to a refundable deposit and/or a low annual membership fee. Car-sharing supports Transit Oriented Development by reducing parking demand by enabling households to own fewer or no vehicles.
A UC Berkeley study of San Francisco’s City CarShare found that when people joined the car-sharing organization, nearly 30 percent reduced their household vehicle ownership and two-thirds avoided purchasing another car. 29 A study entitled The Impact of Carsharing on Household Vehicle Holdings: Results from a North American Shared-Use Vehicle Survey30
conducted in late 2008 surveyed 6,281 car sharing organization members in the U.S. and Canada both before and after each household joined to determine car sharing’s impacts on household vehicle ownership. Based on the survey information collected, the average number of vehicles owned per household “before” carsharing was 0.47, while the rate “after” joining a carsharing organization was 0.23. When the data is broken down by nation of survey respondent, the Canadian average “before” carsharing was 0.31 vehicles per household and 0.13 vehicles per household “after,” while the average U.S. vehicle holdings per household were 0.55 and 0.29 respectively.
Parking Cash-Out
The majority of North American employers provide free or reduced price parking for their employees as a fringe benefit. Under a parking cash-out requirement, employers are allowed to continue this practice on the condition that they offer the cash value of the parking subsidy to any employee who does not drive to work. Offering employees the option of “cashing out” their subsidized parking space can incentivize employees to ride transit, bike, walk, or carpool to work, thereby reducing parking demand and vehicle commute trips and emissions.
Research performed by Donald Shoup at the University of California-Los Angeles found that single occupancy vehicle trips declined by 17 percent and other modes increased significantly
27 Shoup & Willson (1980); Comsis (1993); Valk & Wasch (1998); Pratt (2000) 28 Victoria Transport Policy Institute (2009), Parking Requirement Impacts on Housing Affordability, http://www.vtpi.org/park-hou.pdf 29 Robert Cervero and Yu-Hsin Tsai (2003), San Francisco City CarShare: Travel-Demand Trends and Second-Year Impacts, Institute of Urban and Regional Development, http://repositories.cdlib.org/cgi/viewcontent.cgi?article=1026&context=iurd 30 Martin, Shaheen, and Lidicker, “The Impact of Carsharing on Household Vehicle Holdings: Results from a north American Shared-Use Vehicle Survey.” Transportation Sustainability Research Center (TSRC). March 15, 2010

VTA REPLACEMENT PARKING STUDY | TASK 2: PARKING MANAGEMENT STRATEGIES Metropolitan Transportation Commission
Nelson\Nygaard Consulting Associates Inc. | Eisen|Letunic | 9
(carpooling by 64 percent, transit by 50 percent, and walking/biking by 33 percent) after a parking cash-out program was introduced at various urban and suburban worksites with varying levels of transit service. These mode shifts resulted in an average 12 percent fewer vehicle miles traveled (VMT) per year per employee. This reduction is equivalent to removing one of every eight cars driven to work.31 The analysis found that reductions in auto trips tend to increase over time, as more employees find opportunities to reduce their driving and take advantage of the parking cash-out “fringe benefit.”
Parking cash-out is already state law in California, but it only applies to employers with 50 employees or more that lease their parking and whose parking costs can be separated out as a line item on their lease.
Subsidized Transit Passes
In recent years, growing numbers of transit agencies have teamed with universities, employers, building developers, or entire districts and neighborhoods to provide universal or subsidized transit passes to certain riders (students, employees, residents, etc). These passes typically provide unlimited transit rides on local or regional transit providers for a low monthly fee, often absorbed entirely by the employer, school, or developer. By incentivizing transit use through subsidies, demand for parking is reduced as there is a mode shift from driving to transit.
VTA currently operates both an employer-sponsored as well as residential Eco Pass programs, which both provide annual passes that provide unlimited rides on all VTA bus and light rail services seven days a week. Employers pay an annual fee to provide the pass to full-time employees regardless of how many employees use the pass. The pass is a small sticker attached to a VTA-produced photo ID card and is presented as proof of payment. A Residential Eco Pass is also available for purchase by residential communities of 25 or more units, such as condominium, apartment, or townhouse developments. Similar to the employer sponsored Eco Pass, the Residential Eco Pass is purchased by the residential communities for all residents. The communities pay an annual fee to provide the pass to all residents regardless of how many residents use the pass.
Figure 2 shows the drive-alone and transit mode splits before and after subsidized transit pass implementation in different locations. These studies show reductions in drive-alone mode share of four to 42 percent, with an average reduction of 19 percent. In addition, these case studies show a wide range of increased transit mode share of between 25 and 145 percent with an average rise of 95 percent. While there is not an exact one to one relationship between increasing the use of transit and reduced parking demand, as some new transit users may not be switching from driving alone to transit, there will be some reduction in parking demand due to increased transit mode share.
31 Donald C. Shoup, Evaluating the Effects of Cashing Out Employer-Paid Parking: Eight Case Studies, http://www.arb.ca.gov/research/apr/past/93-308a.pdf.
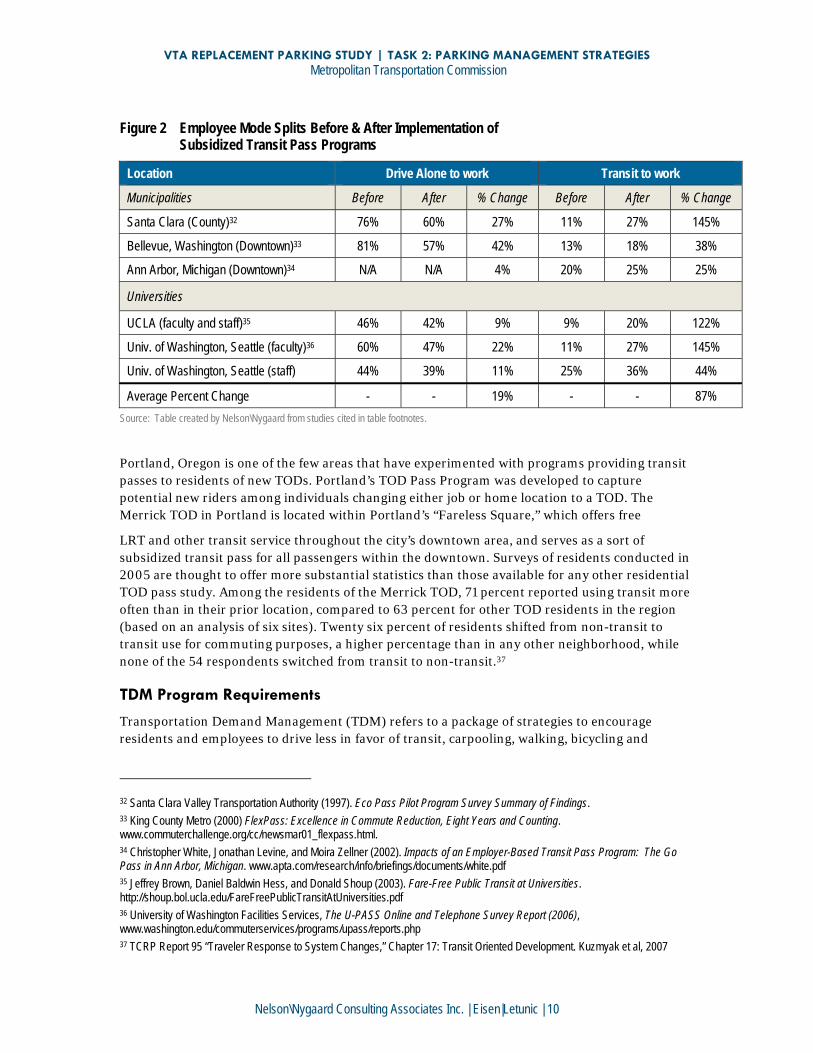
VTA REPLACEMENT PARKING STUDY | TASK 2: PARKING MANAGEMENT STRATEGIES Metropolitan Transportation Commission
Nelson\Nygaard Consulting Associates Inc. | Eisen|Letunic | 10
Figure 2 Employee Mode Splits Before & After Implementation of Subsidized Transit Pass Programs
Location Drive Alone to work Transit to work
Municipalities Before After % Change Before After % Change
Santa Clara (County)32 76% 60% 27% 11% 27% 145%
Bellevue, Washington (Downtown)33 81% 57% 42% 13% 18% 38%
Ann Arbor, Michigan (Downtown)34 N/A N/A 4% 20% 25% 25%
Universities
UCLA (faculty and staff)35 46% 42% 9% 9% 20% 122%
Univ. of Washington, Seattle (faculty)36 60% 47% 22% 11% 27% 145%
Univ. of Washington, Seattle (staff) 44% 39% 11% 25% 36% 44%
Average Percent Change - - 19% - - 87% Source: Table created by Nelson\Nygaard from studies cited in table footnotes.
Portland, Oregon is one of the few areas that have experimented with programs providing transit passes to residents of new TODs. Portland’s TOD Pass Program was developed to capture potential new riders among individuals changing either job or home location to a TOD. The Merrick TOD in Portland is located within Portland’s “Fareless Square,” which offers free
LRT and other transit service throughout the city’s downtown area, and serves as a sort of subsidized transit pass for all passengers within the downtown. Surveys of residents conducted in 2005 are thought to offer more substantial statistics than those available for any other residential TOD pass study. Among the residents of the Merrick TOD, 71 percent reported using transit more often than in their prior location, compared to 63 percent for other TOD residents in the region (based on an analysis of six sites). Twenty six percent of residents shifted from non-transit to transit use for commuting purposes, a higher percentage than in any other neighborhood, while none of the 54 respondents switched from transit to non-transit.37
TDM Program Requirements
Transportation Demand Management (TDM) refers to a package of strategies to encourage residents and employees to drive less in favor of transit, carpooling, walking, bicycling and
32 Santa Clara Valley Transportation Authority (1997). Eco Pass Pilot Program Survey Summary of Findings. 33 King County Metro (2000) FlexPass: Excellence in Commute Reduction, Eight Years and Counting. www.commuterchallenge.org/cc/newsmar01_flexpass.html. 34 Christopher White, Jonathan Levine, and Moira Zellner (2002). Impacts of an Employer-Based Transit Pass Program: The Go Pass in Ann Arbor, Michigan. www.apta.com/research/info/briefings/documents/white.pdf 35 Jeffrey Brown, Daniel Baldwin Hess, and Donald Shoup (2003). Fare-Free Public Transit at Universities. http://shoup.bol.ucla.edu/FareFreePublicTransitAtUniversities.pdf 36 University of Washington Facilities Services, The U-PASS Online and Telephone Survey Report (2006), www.washington.edu/commuterservices/programs/upass/reports.php 37 TCRP Report 95 “Traveler Response to System Changes,” Chapter 17: Transit Oriented Development. Kuzmyak et al, 2007

VTA REPLACEMENT PARKING STUDY | TASK 2: PARKING MANAGEMENT STRATEGIES Metropolitan Transportation Commission
Nelson\Nygaard Consulting Associates Inc. | Eisen|Letunic | 11
teleworking. Listed below are a number of potential TDM strategies that could be implemented at
TOD sites for residents, employees, and transit patrons:
Secure bicycle parking
Parking pricing
Carsharing
Free or partially subsidized transit passes
Showers/changing facilities
Guaranteed Ride Home
Information on transportation alternatives, such as bus schedules and bike maps
Dedicated employee transportation coordinator
Carpool matching programs
Preferential carpool/vanpool parking
Telecommuting and compressed work schedules
TDM programs should be required for TOD development as the impact of a TDM program will be greater for sites well served by frequent transit, when compared to a site not well served by transit. Implementing a TDM program requirement could be done for each individual project through the conditions of approval process, however, it is recommended that a set of minimum TDM requirements be set for all new TOD development. Another option is to create specific plans for all areas within a certain distance of light rail stations that set specific requirements for new development including various TDM measures. The City of San Mateo has done this for the areas surrounding Caltrain stations through the development of the San Mateo Rail Corridor Transit-Oriented Development Plan (Corridor Plan).
Transportation Demand Management (TDM) programs have been shown to reduce employee vehicle trips by up to 38 percent, with the largest reductions achieved through parking pricing.38 However, these results are more common in distinct geographic areas or for a specific company, rather than a whole city. Nevertheless, in Bellevue, WA, the drive-alone rate has dropped from 76 percent in 1993 to 69 percent in 2001, a 10 percent decrease, in large part due to its Commute Trip Reduction Ordinance. Downtown Bellevue worksites dropped from 72.9 to 58.5 percent - a 20 percent decrease. In Cambridge, MA, a Parking & TDM Ordinance particularly affects residents who work in Cambridge. This group displayed a nearly 24 percent drop in drive alone trips with a 35 percent increase in bicycle trips.
Replacement Parking Policy To facilitate a context-sensitive evaluation of the most cost-effective mix of TOD, replacement parking and alternative access improvements for each VTA light rail station, a replacement parking tool could be developed.
BART has created such a tool to aid that agency in the development of TOD projects at BART stations. In 2005, BART commissioned the development of Replacement Parking for Joint Development: An Access Policy Methodology, which was prepared by Richard Willson, PhD. This methodology includes a spreadsheet that allows BART to model and evaluate the capital and operating costs and ridership and revenue impacts of alternative combinations of development,
38 Shoup & Willson (1980); Comsis (1993); Valk & Wasch (1998); Pratt (2000).
VTA REPLACEMENT PARKING STUDY | TASK 2: PARKING MANAGEMENT STRATEGIES Metropolitan Transportation Commission
Nelson\Nygaard Consulting Associates Inc. | Eisen|Letunic | 12
parking, and access improvements. Notably, the model incorporates available data on the unique characteristics of each station and its surrounding area, such as station ridership and peak hour line capacity and current access mode split, as well as available literature on the ridership impacts of TOD. Many of the coefficients used in the model are based directly on the findings of comprehensive research on the travel patterns of the residents and employees of TODs and existing communities within walking distance of rail transit stations throughout California, published in Travel Characteristics of Transit Oriented Development in California, conducted by Hollie Lund, Robert Cervero, and Richard Willson in 200439.
Another key element of the BART study is a set of process and outcome principles that are designed to provide a structured way of evaluating access/replacement parking scenarios. The process principles emphasize creative and flexible solutions, which reflect the unique nature of each station and ensure that the process is transparent. Increasing ridership is stressed as an outcome principle as well as supporting the fiscal health of BART, reducing the number of patrons who access the station via private automobile and helping achieve the priorities established in Comprehensive Station Plans.
Since the BART TOD Policy was adopted in 2005, the Access Policy Methodology has been applied in a variety of station area planning processes. The model has been used to inform the BART Board and staff about potential impacts of alternatives, rather than to directly determine the parameters of development and parking on BART property. In several high profile cases (e.g. MacArthur Transit Village and South Hayward), BART and/or its local government partners have been reluctant to endorse the mix of TOD and parking that the model suggests would maximize ridership and system revenues due to concerns over spillover parking and lost parking revenue.
Model Methodology
The BART Replacement Parking Model is a four step model:
1. Policy and context issues
2. Build scenarios
3. Evaluate scenarios
4. Select preferred strategy and write specifications
Policy and Context Issues
The first step is to collect the information shown in Figure 3 for the station being evaluated and conduct an assessment of replacement parking issues as shown in figure 4. As part of this process, an inventory of other types of access improvements, such as bus, shuttle, taxi, drop-off, carshare or ridesharing should be developed.
39 Lund, H., R. Cervero, and R. Willson (2004), Travel Characteristics of Transit Oriented Development in California, Final Report., Funded by a Caltrans Transportation Grant – Statewide Planning Studies, FTA Section 5313(b)

VTA REPLACEMENT PARKING STUDY | TASK 2: PARKING MANAGEMENT STRATEGIES Metropolitan Transportation Commission
Nelson\Nygaard Consulting Associates Inc. | Eisen|Letunic | 13
Figure 3 Station Information Profile40
Category Characteristic Condition
Station Characteristics Station type
Transportation function
Station weekday ridership ‘04 (exits)
Average weekday round trip fare paid from station
Weighted average service density
Station Draw (where riders are coming from)
Station Area Characteristics Population w/in ½ mile
Employment w/in ½ mile
Parking BART parking
Parking utilization @ 1 PM
Reliance on parking (number of BART spaces per weekday rider)
Other parking-related access issues, e.g., overflow parking
Other Access Modes Transit
Shuttles
Pedestrian
Carpooling
Bicycling
BART Plans Access plan?
Comprehensive Station Plan?
City Plans
Transit Operator Plans
Status of development solicitation
40 BART Replacement Parking for Joint Development: An Access Policy Methodology. pg 10.

VTA REPLACEMENT PARKING STUDY | TASK 2: PARKING MANAGEMENT STRATEGIES Metropolitan Transportation Commission
Nelson\Nygaard Consulting Associates Inc. | Eisen|Letunic | 14
Figure 4 Replacement Parking Possibilities
Issue Status
Is station parking fully utilized?
Is nearby, non-BART parking fully utilized? Can replacement parking be provided off-site or by using shared parking arrangements?
Can parking demand be shifted to other stations?
Are there possibilities for replacement parking funding from other parties (e.g., grant funds, redevelopment)?
What is city perspective on deviation from 1:1 replacement parking?
What other planning issues exist? What is the parking management readiness in the station area, i.e., cities and property owners have spillover prevention programs ready (e.g., permits, meters, time limits)?
After compiling the information shown in Figure 3 and Figure 4, the top five policy context issues for the station are ranked in order to help BART facilitate discussions with the local land use jurisdiction, to determine if there are additional criteria that should be used in the evaluation of access/replacement parking alternatives.
Build Scenarios
The second step is to build a series of development and access/replacement parking scenarios. One of the objectives of this step is to facilitate interaction and discussion between BART and City partners, the development community and local transit providers in the development of the scenarios. Figure 5 lists the key inputs for each potential development scenario. The BART methodology suggests that three scenarios be developed for testing, but depending on circumstances, between two and five scenarios might be developed.

VTA REPLACEMENT PARKING STUDY | TASK 2: PARKING MANAGEMENT STRATEGIES Metropolitan Transportation Commission
Nelson\Nygaard Consulting Associates Inc. | Eisen|Letunic | 15
Figure 5 Joint Development Scenarios
Existing
Condition Scenario A Scenario B Scenario C
Size of development parcel
# units residential (rental)
# units for sale housing
Retail (sf)
# of BART parking spaces on development site
Unused spaces at BART station assumed to be available for those displaced by development
Off-site replacement of BART spaces (in station area)
BART patron parking resources at another station area (BART or non- BART facilities)
Parking spaces provided for joint development
BART parking spaces shared with the joint development
Total non-shared spaces provided (BART + joint development)
Parking charges on the BART parking
New transit/shuttle programs
New carpool program/ incentives
New walk/bike programs
New on-street parking management programs (e.g., permit or time limits)
Other access improvements
Economic issues
Local barriers to TOD and how they are addressed
VTA REPLACEMENT PARKING STUDY | TASK 2: PARKING MANAGEMENT STRATEGIES Metropolitan Transportation Commission
Nelson\Nygaard Consulting Associates Inc. | Eisen|Letunic | 16
Evaluate Scenarios
Once the scenarios have been created, the next step is to evaluate each against BART’s process and outcome principles, whose general focus is the effects of any replacement parking decisions on ridership and the fiscal health of BART. Thus, the first step is to evaluate ridership loss or gain as a result of changes in existing station parking, joint development, and other factors is estimated using the spreadsheet BART has developed to model these factors, which is based on trip generation data from the Institute of Transportation Engineers and the Travel Characteristics of TOD in California report. The evaluation also takes into account the presence of parking spillover control measures such as residential parking permit programs.
Next, the fiscal impact to BART for each of the scenarios is evaluated. This takes into account the fare revenue impact of changes in station ridership, revenue from parking charges, revenue from ground rent associated with a change in replacement parking policy, and revenue from partnerships/external grants. The change in operating costs for parking (maintenance, security, maintenance costs associated with a shift from surface parking to parking structures), new operating costs for BART service, BART’s participation in operating costs for new access modes, and BART participation in annualized cost of access capital improvements are also taken into account.
Lastly, four other factors are analyzed: long term BART capacity, the degree to which the scenario supports BART’s plans (e.g. comprehensive station area plans, access plans, and other adopted policies), the degree to which the scenario supports local partnerships for context-appropriate development, and the degree to which the scenario supports local and regional goals. Local goals include: context-appropriate and well-designed; local support, partnerships, and reduce TOD barriers. Regional goals include: provision of housing, housing affordability, congestion, and air quality.
Select Preferred Strategy and Write Specifications
After the analysis of the various scenarios is completed, BART staff, working in cooperation with local jurisdictions, will recommend a joint development and access/replacement parking scenario, which can then be considered by the BART Board of Directors and articulated in Requests for Proposals for station development.
Potential Implications for VTA
In Task 4 of the VTA Replacement Parking project, replacement parking policy recommendations will be developed. Sections of BART’s methodology will likely be included; however, we anticipate that the recommended tool will be a much simplified version of BART’s methodology and may include criteria which are not included in BART’s replacement parking model.
Shared Parking Policy Shared parking is a collection of parking spaces which is shared between various land uses, typically within a single development; however an entire downtown, shopping or residential district can also create a pool of shared parking spaces. The number of spaces that can be shared between different uses depends on how the parking demand generated by each use varies over the course of the day and week. All land uses generate unique levels and patterns of parking demand. Mixed-use TOD projects can present an excellent opportunity for shared parking because of the staggered demand peaks for parking associated with different uses. Parking supplies at mixed-use

VTA REPLACEMENT PARKING STUDY | TASK 2: PARKING MANAGEMENT STRATEGIES Metropolitan Transportation Commission
Nelson\Nygaard Consulting Associates Inc. | Eisen|Letunic | 17
locations accommodate these demand fluctuations more efficiently than segregated supplies, by accommodating peaking uses for one use with spaces left vacant by other uses, thereby substantially reducing the combined number of parking spaces needed. For example, spaces occupied by daytime retail shoppers or office workers are largely empty during the evening and can be filled, or “shared,” with residents and their guests who park overnight or patrons of nearby restaurants.
Residential and mixed-use developments located near transit stations where commuter parking is provided are well suited for shared parking situations as peak demand for commuter parking occurs during weekdays, enabling restaurant patrons, shoppers or residents who have weeknight and weekend peak parking demands to utilize these spaces.
Conclusions There are a number of physical improvements and parking management strategies that can reduce demand for parking at transit stations and encourage the use of other modes, including physical improvements to the bicycle and pedestrian networks and parking pricing. Of these measures, parking pricing has been shown to be one of the most effective strategies for reducing parking demand, with research finding an average reduction in parking demand of 27 percent, depending on price.
Current research conducted by the VTA Planning Department and San Jose State University has shown that residential developments at TOD sites in Santa Clara County are currently overparked. This suggests that changes to minimum parking requirements for TODs may be appropriate.
In addition to reducing parking demand through physical improvements and demand management programs and policies, shared parking scenarios enable uses with complementary peak parking demands, such as office and residential, to share parking spaces, reducing the number of parking spaces that need to be constructed and allowing a greater portion of the site to be developed as usable space.
As a next step, an analysis of the appropriate transit parking supply at each VTA station will be undertaken. The BART replacement parking methodology will serve as guide in the development of parking supply recommendations for VTA light rail stations.

APPENDIX B Task 3:
Transit Parking Analysis Case Studies

M E M O R A N D U M To: Therese Trivedi
From: Jessica ter Schure and Francesca Napolitan
Victoria Eisen, Eisen|Letunic
Date: August 16, 2011
Subject: VTA Replacement Parking Study – Task 3: Transit Parking Analysis Case Studies
Introduction Five case studies were conducted to help inform Task 3 of the VTA Replacement Parking Study, which estimates the appropriate transit parking supply at each station. The purpose of these case studies is to illustrate how land use and parking pricing affect access mode choice at U.S. suburban light rail systems, particularly those with TOD. We researched four comparable systems – Sacramento RTD, Denver RTD, Portland Metro, and Washington D.C. Metrorail (WMATA) – plus BART, which, although it is a heavy rail system, has done more analytic work in this area than any other transit operator in the country. In addition to contacting the agencies directly, a literature search looked for third party analyses that might provide the information we’re looking for. These case studies revealed an apparent lack of data on the explicit impact of TOD and parking pricing on station access mode choice and, therefore, an urgent need for analysis along the lines of VTA’s Replacement Parking Study.
Inquiries Planning staff at each of the five surveyed operators were asked the following questions to assess their agency’s parking management policies and impacts:
1. Station access mode split data by station typology: Does your agency classify stations by land use type and/or density? If so, do you have comparative mode split data for the various typologies?
This question sought to understand whether agencies had defined a hierarchy of station types or typologies according to surrounding development and/or auto parking supply and pricing and, if so, if access mode split by station type is tracked.
2. Before/after TOD development on mode split: Has TOD been constructed on or immediately adjacent to any of your stations? If so, do you have before/after data that shows the effect of TOD on mode split?
We asked transit agencies with TOD on or adjacent to light rail stations whether they had data that shows the impact TOD has had on station access mode.
3. Effect of pricing on access mode split: Has your agency instituted parking pricing at any of your stations? If so, do you have before/after data on the effect of pricing and/or other TDM programs on access mode split? If pricing was instituted at any TOD stations, have you been able to separate the effect of these factors on mode choice?
VTA REPLACEMENT PARKING STUDY | TASK 3: TRANSIT PARKING ANALYSIS CASE STUDIES Metropolitan Transportation Commission
Nelson\Nygaard Consulting Associates Inc. | Eisen|Letunic | 2
This question sought to identify the effect of pricing and other demand management programs on access mode split, station choice and ridership. It sought to understand whether passengers who previously drove to stations either now drive to other stations that do not charge for parking; if they now access stations via other means, such as walk or bike; or if they have stopped riding transit altogether.
4. Replacement parking policy: Does your agency have a replacement parking policy that allows less than one space to replace each lost space at TOD? If so, could you please send a copy of that policy and any supportive background information?
Rail transit operators were asked whether they have explicit policies that allow less than one-to-one parking replacement for any spaces lost to TOD, and the rationale/conditions that must be met in order to allow fewer replacement spaces.
Findings
Multiple operators employ station typologies; that is, they differentiate their rail stations into categories based on various land use density and access mode characteristics. Sacramento categorizes its light rail stations into five land use frameworks, each with corresponding densities: Urban Core/Downtown, Urban Center, Employment Center, Residential Center, and Commuter Center. For each framework, the District offers suggestions on appropriate parking ratios; however, the agency does not collect access mode split data by station type.
Station access mode split data by station typology
WMATA has started to develop station typologies based on land use and transportation characteristics, but they haven’t yet been formally adopted. BART has a station typology matrix that categorizes its stations into five categories based on surrounding land use and predominant access modes: Auto Dependent, Intermodal-Auto Reliant, Balanced Intermodal, Urban with Parking, and Urban. The corresponding access modes range from park-and-ride access for auto dependent stations to pedestrian and bike access at urban stations. However, similar to Sacramento, BART does not analyze access mode split data by station category.
Although all operators surveyed have access mode split data for individual stations, none of the agencies we contacted have analyzed mode split by station category. It is out of the scope of this project to collect station-specific data and perform this analysis.
In order to discern the impact of TOD on transit access mode choice, an operator must collect before/after data as close to the commencement of construction of the TOD as possible; otherwise, other factors, such as parking pricing, bicycle or transit access improvements, other nearby development and the ups and downs of the local economy can prevent drawing clear conclusions as to the effect of the new development. Most TOD around WMATA stations predates the time that mode choice survey data has been collected electronically. Although TOD has been built on and/or near TriMet, Denver RTD and BART stations, and all operators have data on station-specific mode access, even those with TOD, none of the five operators surveyed has analyzed the specific effect of TOD on access mode choice.
Effect of TOD development on access mode split
Among the operators surveyed, more have tracked the effect of parking pricing on mode choice than TOD. Denver RTD and BART have implemented parking pricing and have performed limited
Effect of parking pricing on access mode split
VTA REPLACEMENT PARKING STUDY | TASK 3: TRANSIT PARKING ANALYSIS CASE STUDIES Metropolitan Transportation Commission
Nelson\Nygaard Consulting Associates Inc. | Eisen|Letunic | 3
studies on its impact on ridership and access mode split. In 2008, Denver implemented a parking management program at 34 of its 74 stations with the goals of more efficiently utilizing existing parking facilities, inducing patrons to shift to less-used stations, and reducing the implicit subsidy free parking offers. Analysis of the program – which charges $1-$4 per day depending on the station and other factors – has shown that parking fees have had no discernable impact on parking utilization or ridership. WMATA charges for parking at 44 of its 86 stations – between $4.25 and $4.50/day. However, because the agency has been charging since the stations opened, there is no data on the effect of parking pricing on access mode or ridership.
BART has a Board-approved market-based pricing policy that calls for daily parking fees when certain demand metrics are met. The policy allows parking prices to fluctuate on a monthly basis depending on demand. For example, when average usage of parking spaces exceeds 50 percent of available supply, three days a week for four consecutive weeks, the fee is $2.00. For instance, in February 2009, BART increased daily parking fees at the Colma station from $1 to $2. BART staff then compared the station's average daily ridership and parking utilization from two weeks before and two weeks after the price increase and found a decrease of only 22 passengers, a 0.6 percent decline in ridership (from 3,666 average weekday entries to 3,644). Daily parking fee payments at Colma Station, however, dropped by an average of 78 payments per weekday. BART therefore surmised that the increase in parking fees encouraged some riders to use access modes other than driving and parking at the station.
BART and TriMet in Portland have transit parking policies that do not require a 1:1 replacement for spaces lost to TOD. As described in previous tasks, BART's replacement parking policy identifies a number of variables that help determine the proper ratio of replacement parking based on pre-TOD parking utilization and access mode split, as well as projected impacts from development and parking loss.
Replacement parking policies
Rather than requiring developers to replace parking spaces displaced by joint development projects, TriMet allows park & ride facilities to be developed if one or more of the following conditions apply:
The facility’s current capacity can be replaced at another location that offers access to comparable transit service and serves a similar travel-shed, and movement of the facility serves some other long-term goal, such as reducing future operating costs or encouraging transit-oriented development.
Market value of the land indicates that Park & Ride use is an economic underutilization – in this case, sale or ownership transfer of the land should be used to leverage some other benefit to the Tri-Met system.
The facility is replaced by new transit-oriented development of at least 30 units per acre (residential), at least 75 employees per acre (employment areas) and/or a development of Station Area, Town Center, or Regional Center density as defined by Metro's Regional Framework Plan.
Although Denver RTD has no specific written policies regarding parking replacement, since December 2010 their Board has allowed the agency to study the potential of replacing each parking space displaced by TOD with less than one space. WMATA’s informal parking replacement policy is 1:1, even for joint development on their property. They are working to
VTA REPLACEMENT PARKING STUDY | TASK 3: TRANSIT PARKING ANALYSIS CASE STUDIES Metropolitan Transportation Commission
Nelson\Nygaard Consulting Associates Inc. | Eisen|Letunic | 4
change this, and have tried to do a similar analysis to what we’re doing toward that end, but have been stymied by a lack of clear data.
Analysis This case study analysis sheds light on the degree to which other agencies evaluate the impact of TOD and parking pricing on station access mode split, and their corresponding replacement parking policies. This research shows that, although some operators classify their stations into typologies (urban, suburban, etc.), none have quantified access mode split by category. Some operators, such as BART, evaluate station-specific parking pricing impacts on ridership and mode split, and use this data to adjust parking fees. Finally, many operators, such as Portland TriMet, BART, and Denver RTD either have adopted or are experimenting with parking replacement policies of less than one-to-one to help facilitate TOD; however, no operator has explicit information on TOD's impact on station access mode split.
Although transit-oriented development has replaced parking at at least one station of each of the transit operators surveyed, and parking pricing has been implemented at some, little data is available that documents the effect of these activities on parking demand, mode shift and ridership. VTA's desire to analyze the impacts of TOD on parking demand, access mode choice and ridership is much needed and will be unique among peer rail transit operators.