vs30 characterization of texas, oklahoma, and kansas using
TRANSCRIPT

VS30 Characterization of Texas, Oklahoma,and Kansas Using the P-Wave SeismogramMethod
Georgios Zalachoris,a) Ellen M. Rathje,b) M.EERI, and Jeffrey G. Painec)
The P-wave seismogram method is used to develop estimates of the timeaveraged shear wave velocity of the upper 30 m (VS30) at 251 seismic stationsin Texas, Oklahoma, and Kansas. Geologic conditions at the sites are documentedusing large-scale geologic maps. The VS30 values from the P-wave seismogrammethod agree well with the limited in situ measurements across the study area andcorrelate well with the mapped geologic units. Compared with the VS30 proxyvalues assigned to the stations by the Next Generation Attenuation–East(NGA-East) project, the P-wave seismogram method generally produces largerVS30 estimates. These differences are likely due to the fact that very few VSmeasurements in Texas, Oklahoma, and Kansas were available for use in thedevelopment of the NGA-East proxies. Analysis of the P-wave seismogramVS30 values indicates that, in this geographic area, incorporating rock typealong with geologic age better distinguishes the average VS30 of these materialsthan geologic age alone. [DOI: 10.1193/102416EQS179M]
INTRODUCTION
Seismicity rates in some areas of central and eastern North America (CENA), such asnorth Texas/Oklahoma/south Kansas, have increased by more than an order of magnitudeover the last several years (Petersen et al. 2016). This enhanced seismicity has increased theinterest in ground motion prediction equations (GMPEs) for these areas, and has highlightedthe need for more detailed site characterization at ground motion recording stations.
The time-averaged shear wave velocity of the upper 30 m of the crust (VS30) has becomethe standard measure for the subsurface geotechnical/geologic conditions at a site and theevaluation of ground motion amplification in GMPEs (e.g., Abrahamson et al. 2014, Booreet al. 2014). Due to the lack of existing in-situ measurements of shear wave velocity profilesat recording stations in CENA (only 6% of the stations included in NGA-East database havemeasured VS30 values, Goulet et al. 2014), VS30 proxy methods have been used to estimateVS30 values at most of the recording sites used in the development of GMPEs for CENA.Proxy methods relate VS30 to parameters such as surface geology, topographic slope, or
a) Visiting Scholar – Post Doctoral Fellow, Dept. of Civil, Architectural, and Environmental Engineering,Univ. of Texas, Austin, TX 78712
b) Warren S. Bellows Professor, Dept. of Civil, Architectural, and Environmental Engineering, Univ. of Texas,Austin, TX 78712
c) Senior Research Scientist, Bureau of Economic Geology, Jackson School of Geosciences, Univ. of Texas,Austin, TX 78713
Earthquake Spectra, Volume 33, No. 3, pages 943–961, August 2017; © 2017, Earthquake Engineering Research Institute943

terrain. These proxy methods have been developed predominantly for active tectonic regions,such as Wills and Clahan (2006) for geology, Wald and Allen (2007) for topographic slope,and Yong et al. (2012) for terrain. For CENA, Kottke et al. (2012) developed geology-basedVS30 proxy relationships by dividing the geologic conditions into 19 categories based onfactors such as glaciation, the presence of residual soils, geologic age and depositional envir-onment. Parker et al. (2017) revised the work of Kottke et al. (2012) to develop a hybridgeology-slope proxy method for CENA based on statistical analysis of 2,754 sites with mea-sured VS30 values. The sites were grouped by attributes including geologic age, lithology,glaciation history and location relative to known basins, and the relationship between VS30and 30 arc-second slope gradients was also taken into account for some groups. This workwas done as part of the Next Generation Attenuation - East (NGA-East) project (http://peer.berkeley.edu/ngaeast/).
An alternative to the proxy methods is the P-wave seismogram method (Kim et al. 2016,Ni et al. 2014, Hosseini et al. 2016), which estimates VS30 from the recorded ground motionsat a site using the fundamentals of wave propagation. Kim et al. (2016) showed that theP-wave seismogram method predicts VS30 with less bias and less variability than the variousproxy methods. As a result, we chose to apply the P-wave seismogram method to estimateVS30 for seismic stations located in the central midcontinent states of Texas, Oklahoma, andKansas. These VS30 estimates are compared with the mapped geology from large-scalegeologic maps and with those predicted by the Parker et al. (2017) hybrid geology-slopeproxy method for CENA. An electronic supplement is provided that compiles the recordingstations for which the P-wave seismogram method was applied, the P-wave seismogramresults, and geologic descriptions for the seismic stations.
P-WAVE SEISMOGRAM METHOD
The P-wave seismogram method is based on the fact that propagating seismic waves tendto be refracted to a more vertical position as they travel through softer material towards theground surface. As a result, the vertical component of the P-wave amplitude tends to be largerthan the radial component for softer sites. The analytical expressions in Aki and Richards(2002) for the radial and vertical displacement at the free surface from a single P-wave withan incident angle i (Figure 1a), can be used to derive an expression for the ratio of the radial tovertical particle velocity:
EQ-TARGET;temp:intralink-;e1;41;239
_UR
_UZ
¼ 2VSp cos j1� 2p2V2
S
(1)
where _UR is the radial particle velocity, _UZ is the vertical particle velocity, VS is the shearwave velocity of the medium, j is the angle of the reflected SV wave, and p is the ray para-meter. Solving for VS, we obtain:
EQ-TARGET;temp:intralink-;e2;41;154VS ¼cos j�
ffiffiffiffiffiffiffiffiffiffiffiffiffiffiffiffiffiffiffiffiffiffiffiffiffiffiffiffiffifficos2jþ 2
�_UR_UZ
�2
r
�2p�
_UR_UZ
� (2)
944 G. ZALACHORIS, E. M. RATHJE, AND J. G. PAINE

The ray parameter, p, and the angle j are related and can be expressed as:
EQ-TARGET;temp:intralink-;e3;62;436p ¼ sin iVP
¼ sin jVS
(3)
EQ-TARGET;temp:intralink-;e4;62;394j ¼ sin�1ðpVsÞ: (4)
The particle velocities _UR and _UZ can be retrieved from recorded velocity time series orintegration of recorded acceleration time series with the horizontal components rotated to thedirection of the azimuth between the earthquake epicenter and the seismic station. Kim et al.(2016) used the initial portions of the time series to select the first peak value of ( _UZ) and thenthe corresponding value of ( _UR) at the same moment in time.
Kim et al. (2016) estimated the ray parameter, p, by assuming a simplified two-layercrustal velocity model, as shown in Figure 1b:
EQ-TARGET;temp:intralink-;e5;62;277p ¼sin
�tan�1
�R1
D1
��
VP1
¼sin
�tan�1
�R2
D2
��
VP2
(5)
where R1 and R2 are the horizontal distances travelled in the upper and lower layers, respec-tively, D1 is the thickness of the upper layer, D2 is the hypocentral depth minus D1, VP1
andVP2
are the P-wave velocities of the upper and lower layers, respectively, and R is the epi-central distance and equal to R1 þ R2 (Figure 1b). VP1
, VP2, and D1 are obtained based on an
assumed crustal velocity model. To apply the P-wave seismogram proxy method, Kim et al.(2016) utilized the crustal velocity models developed by the Electric Power Research Insti-tute (EPRI) for CENA (EPRI 1993).
The P-wave seismogram method is applied as follows: (1) assume a value of angle j;(2) estimate the ray parameter, p, using Equation 5; (3) compute VS using Equation 2;(4) compute a new value of angle j using Equation 4; and (5) repeat steps 3 and 4 untiltwo consecutively computed values of angle j fall within a predetermined level of tolerance.
Figure 1. Schematic of: (a) reflection of incident P-wave at the free surface, (b) simplified two-layer system used for computations in P-wave Seismogram method. UR and UZ are the radial andvertical particle displacements, respectively.
VS30 CHARACTERIZATIONOF TEXAS, OKLAHOMA, AND KANSAS USING THE P-WAVE SEISMOGRAMMETHOD 945

The estimated VS value is representative of the time-averaged shear wave velocity of theupper zmeters (VSZ). Kim et al. (2016) assumed that the depth z is estimated as the product ofthe pulse duration of the source time function and the estimated shear wave velocity(z ¼ τp � VSZ), an expression which is equivalent to the wavelength of the S-wave.The authors recommended a value of τp equal to 0.1 s which they considered appropriatefor small magnitude earthquakes (M ¼ 3�4). The final step of the P-wave seismogrammethod is the conversion of VSZ to VS30. Kim et al. (2016) used 821 published measuredshear wave velocity profiles in CENA to develop regression relationships between VSZ andVS30. The regression was performed separately for glaciated and non-glaciated regions.
APPLICATION OF P-WAVE SEISMOGRAM METHOD
To obtain a substantial number of earthquake ground motions to be used for the devel-opment of VS30 estimates at seismic station locations in Texas, Oklahoma, and Kansas, acatalog of earthquake events with epicenters located in the region was created using thecomprehensive database accessed via the website of the Incorporated Research Institutionsfor Seismology, IRIS (https://www.iris.edu/hq/). Earthquake events occurring after January2005 within a specified area (Figure 2a), with magnitudes greater than 3.0, were selected. Thelocations and magnitudes of the selected earthquakes are illustrated in Figure 2a. More than400 seismic recording stations were operational in Texas, Oklahoma, and Kansas at sometime between 2005 and 2015 (Figure 2b). A substantial effort was made to apply the P-waveseismogram method to all the seismic stations illustrated in Figure 2b. Due to the large epi-central distances and the associated weak signals and/or the increased noise levels at many of
Figure 2. Locations of (a) selected earthquake events, and (b) seismic recordings stations inTexas, Oklahoma and Kansas.
946 G. ZALACHORIS, E. M. RATHJE, AND J. G. PAINE

the seismic stations, the P-wave seismogram was successfully implemented for only 251 ofthe available seismic stations.
Ground motion data recorded at the 251 stations were retrieved using tools available onthe website of IRIS (i.e., Standing Order for Data, or SOD, software, https://ds.iris.edu/ds/nodes/dmc/software/downloads/sod/). All collected time series were processed in a uniformmanner. The downloaded recordings were instrument corrected (i.e., instrument responsewas removed), the mean was removed and linear detrending was performed. The recordswere examined for obvious irregularities (i.e., clipping, distortion, apparent high noise)on an individual basis. Any records with signal-to-noise ratio (SNR) persistently less than3 within the bandwidth of the recording instrument were rejected. Finally, three-componentvelocity time series were obtained for each record. A total of 2,871 processed recordingswere used to estimate VS30 at the 251 seismic stations.
Once the appropriate velocity time series were identified, the P-wave seismogrammethod was applied, as described above. For the purposes of this study, we utilized the crus-tal velocity models developed by EPRI (1993). For Texas, Oklahoma, and Kansas, the crustalvelocity structures associated with the Gulf Coast Plain, the Southern Great Plains, and theCentral Plains were used. Table 1 presents these crustal velocity models. To test the sensi-tivity of the results to the assumed crustal velocity models, separate VSZ estimates wereobtained using an alternative set of crustal velocity models from the NGA-East project(Dreiling et al. 2014, Table 1). Using these velocity models, the average effect on the esti-mated VS30 values is on the order of 2% to 7%, which is considered minimal.
Table 1. Crustal velocity models used in P-wave Seismogram method
EPRI (1993) Crustal Velocity Models
Gulf Coast Plain Southern Great Plains Central Plains
LayerThickness
(km)VP
ðkm∕sÞ LayerThickness
(km)VP
ðkm∕sÞ LayerThickness
(km)VP
ðkm∕sÞ1 7 4 1 2 5 1 3 4.52 8 5.3 2 14 6.1 2 22 6.23 15 6.5 3 15 6.7 3 15 6.74 – 8.2 4 14 7.2 4 – 7.9
5 – 8.2
NGA-E (Dreiling et al. 2014) Crustal Velocity Models
Gulf Coast/Mississippi Embayment Central North America
Layer Thickness (km) VP ðkm=sÞ Layer Thickness (km) VP ðkm=sÞ1 4 5.9 1 12 6.12 12.5 6.2 2 8 6.53 13.5 6.6 3 14 6.74 11 7.3 4 6 6.85 – 8 5 – 8.1
VS30 CHARACTERIZATIONOF TEXAS, OKLAHOMA, AND KANSAS USING THE P-WAVE SEISMOGRAMMETHOD 947
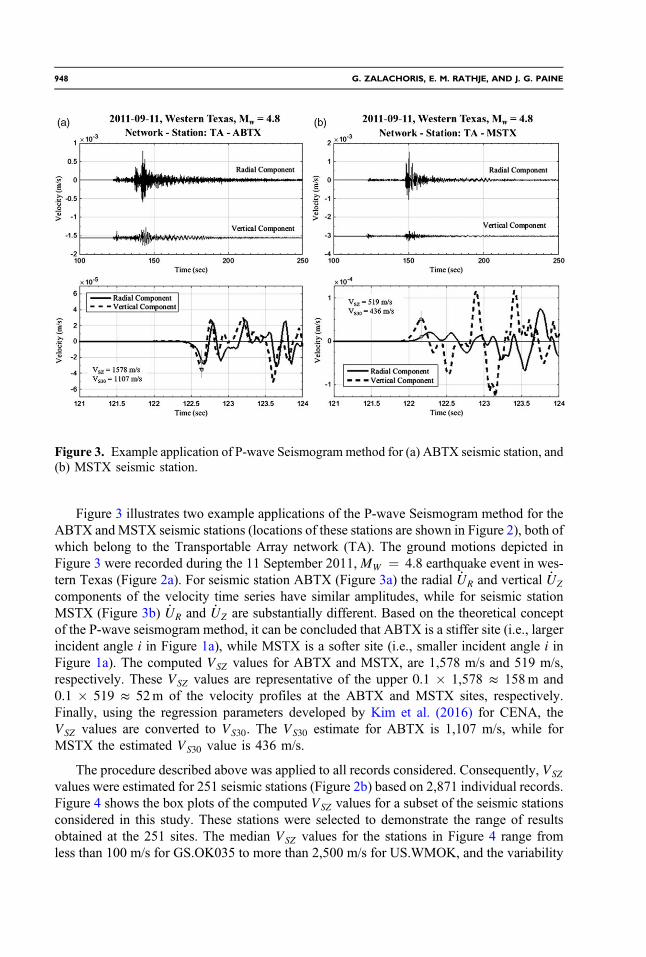
Figure 3 illustrates two example applications of the P-wave Seismogram method for theABTX andMSTX seismic stations (locations of these stations are shown in Figure 2), both ofwhich belong to the Transportable Array network (TA). The ground motions depicted inFigure 3 were recorded during the 11 September 2011, MW ¼ 4.8 earthquake event in wes-tern Texas (Figure 2a). For seismic station ABTX (Figure 3a) the radial _UR and vertical _UZ
components of the velocity time series have similar amplitudes, while for seismic stationMSTX (Figure 3b) _UR and _UZ are substantially different. Based on the theoretical conceptof the P-wave seismogram method, it can be concluded that ABTX is a stiffer site (i.e., largerincident angle i in Figure 1a), while MSTX is a softer site (i.e., smaller incident angle i inFigure 1a). The computed VSZ values for ABTX and MSTX, are 1,578 m/s and 519 m/s,respectively. These VSZ values are representative of the upper 0.1 � 1,578 ≈ 158m and0.1 � 519 ≈ 52m of the velocity profiles at the ABTX and MSTX sites, respectively.Finally, using the regression parameters developed by Kim et al. (2016) for CENA, theVSZ values are converted to VS30. The VS30 estimate for ABTX is 1,107 m/s, while forMSTX the estimated VS30 value is 436 m/s.
The procedure described above was applied to all records considered. Consequently, VSZ
values were estimated for 251 seismic stations (Figure 2b) based on 2,871 individual records.Figure 4 shows the box plots of the computed VSZ values for a subset of the seismic stationsconsidered in this study. These stations were selected to demonstrate the range of resultsobtained at the 251 sites. The median VSZ values for the stations in Figure 4 range fromless than 100 m/s for GS.OK035 to more than 2,500 m/s for US.WMOK, and the variability
Figure 3. Example application of P-wave Seismogram method for (a) ABTX seismic station, and(b) MSTX seismic station.
948 G. ZALACHORIS, E. M. RATHJE, AND J. G. PAINE
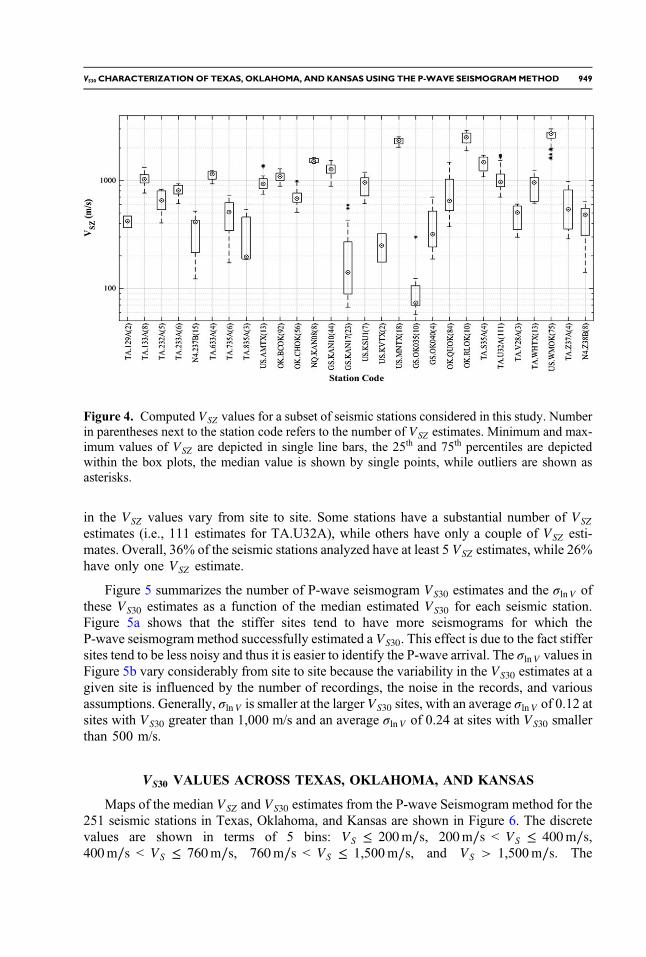
in the VSZ values vary from site to site. Some stations have a substantial number of VSZestimates (i.e., 111 estimates for TA.U32A), while others have only a couple of VSZ esti-mates. Overall, 36% of the seismic stations analyzed have at least 5 VSZ estimates, while 26%have only one VSZ estimate.
Figure 5 summarizes the number of P-wave seismogram VS30 estimates and the σlnV ofthese VS30 estimates as a function of the median estimated VS30 for each seismic station.Figure 5a shows that the stiffer sites tend to have more seismograms for which theP-wave seismogrammethod successfully estimated a VS30. This effect is due to the fact stiffersites tend to be less noisy and thus it is easier to identify the P-wave arrival. The σlnV values inFigure 5b vary considerably from site to site because the variability in the VS30 estimates at agiven site is influenced by the number of recordings, the noise in the records, and variousassumptions. Generally, σlnV is smaller at the larger VS30 sites, with an average σlnV of 0.12 atsites with VS30 greater than 1,000 m/s and an average σlnV of 0.24 at sites with VS30 smallerthan 500 m/s.
VS30 VALUES ACROSS TEXAS, OKLAHOMA, AND KANSAS
Maps of the median VSZ and VS30 estimates from the P-wave Seismogram method for the251 seismic stations in Texas, Oklahoma, and Kansas are shown in Figure 6. The discretevalues are shown in terms of 5 bins: VS ≤ 200m∕s, 200m∕s < VS ≤ 400m∕s,400m∕s < VS ≤ 760m∕s, 760m∕s < VS ≤ 1,500m∕s, and VS > 1,500m∕s. The
Figure 4. Computed VSZ values for a subset of seismic stations considered in this study. Numberin parentheses next to the station code refers to the number of VSZ estimates. Minimum and max-imum values of VSZ are depicted in single line bars, the 25th and 75th percentiles are depictedwithin the box plots, the median value is shown by single points, while outliers are shown asasterisks.
VS30 CHARACTERIZATIONOF TEXAS, OKLAHOMA, AND KANSAS USING THE P-WAVE SEISMOGRAMMETHOD 949

smallest VS30 value in the study area was from 10 recordings at GS.OK035 in western Okla-homa (VS30 ¼ 123m∕s), while the largest VS30 was computed from nine recordings at TA.V37A in southeastern Kansas (VS30 ¼ 1,706m∕s). A continuous map of interpolated VS30
was developed (Figure 6c) using the VS30 estimates and inverse distance weighting (IDW)interpolation based on 3 neighboring points. To demonstrate the relationship between theP-wave seismogram results and the geologic features across the study area, the digitalstate-wide geologic maps compiled by the United States Geological Survey (USGS) Divisionof Mineral Resources (DMR) (http://mrdata.usgs.gov/geology/state/) for Texas, Oklahoma,and Kansas are shown in Figure 6d. It is important to note that the interpolated VS30 valuesshown in Figure 6c do not capture local variations in geology and subsurface conditions,because the spacing of the seismic stations at which VS30 was estimated is relativelylarge (i.e., ∼70 km across much of the study area). This issue is even more relevant inthe Basin and Range region in western Texas, where the spacing between VS30 estimatesis 200 to 300 km. Nonetheless, the map in Figure 6c still provides a useful visualizationof the VS30 distribution across the study area.
Figure 6 shows that the computed VS30 values are smaller (i.e., <400m∕s) along the GulfCoast and within the Dallas-Fort Worth (DFW) area, and near the Panhandle region ofwestern Oklahoma. The Gulf Coast is characterized by a broad plain of Quaternary andTertiary unconsolidated material (alluvium, terrace, clay, silt, sand deposits; Figure 6d)and the stations in the DFW area are located mostly on Holocene alluvium deposited bythe Trinity River. These geologic descriptions are consistent with the estimated VS30 valuesof less than 400 m/s.
The VS30 values in Figure 6 are higher (i.e., >760m∕s) within the Llano Uplift andNorth-Central Plains in Texas, the Wichita and Arbuckle Mountains in southern Oklahoma,
Figure 5. (a) Number of VS30 estimates for each station as a function of the estimated VS30 and(b) standard deviation of the natural logarithm of VS30 (σlnV ) for each station as a function of theestimated VS30.
950 G. ZALACHORIS, E. M. RATHJE, AND J. G. PAINE
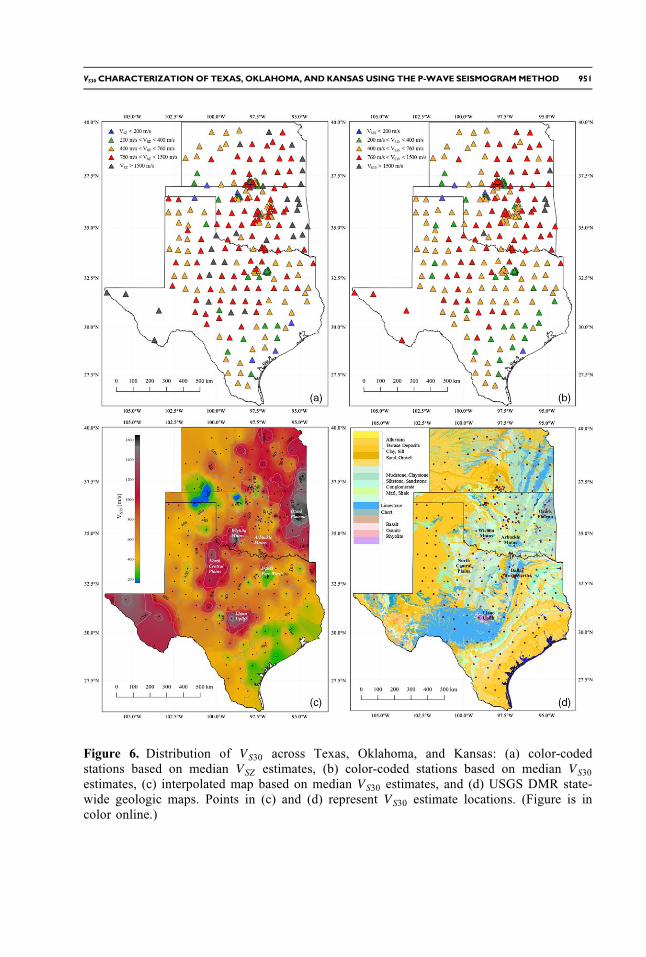
Figure 6. Distribution of VS30 across Texas, Oklahoma, and Kansas: (a) color-codedstations based on median VSZ estimates, (b) color-coded stations based on median VS30estimates, (c) interpolated map based on median VS30 estimates, and (d) USGS DMR state-wide geologic maps. Points in (c) and (d) represent VS30 estimate locations. (Figure is incolor online.)
VS30 CHARACTERIZATIONOF TEXAS, OKLAHOMA, AND KANSAS USING THE P-WAVE SEISMOGRAMMETHOD 951
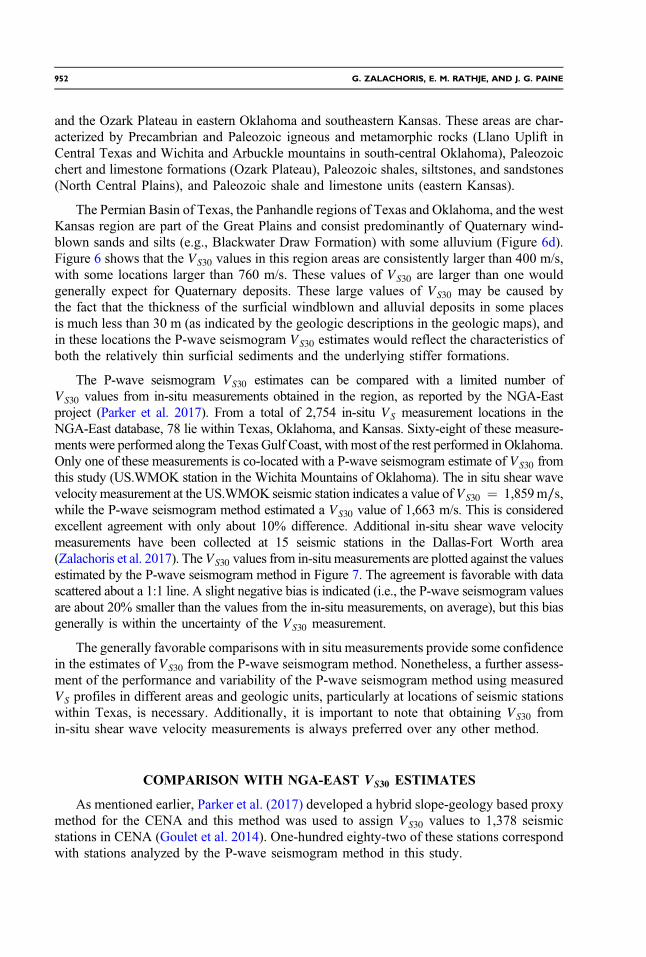
and the Ozark Plateau in eastern Oklahoma and southeastern Kansas. These areas are char-acterized by Precambrian and Paleozoic igneous and metamorphic rocks (Llano Uplift inCentral Texas and Wichita and Arbuckle mountains in south-central Oklahoma), Paleozoicchert and limestone formations (Ozark Plateau), Paleozoic shales, siltstones, and sandstones(North Central Plains), and Paleozoic shale and limestone units (eastern Kansas).
The Permian Basin of Texas, the Panhandle regions of Texas and Oklahoma, and the westKansas region are part of the Great Plains and consist predominantly of Quaternary wind-blown sands and silts (e.g., Blackwater Draw Formation) with some alluvium (Figure 6d).Figure 6 shows that the VS30 values in this region areas are consistently larger than 400 m/s,with some locations larger than 760 m/s. These values of VS30 are larger than one wouldgenerally expect for Quaternary deposits. These large values of VS30 may be caused bythe fact that the thickness of the surficial windblown and alluvial deposits in some placesis much less than 30 m (as indicated by the geologic descriptions in the geologic maps), andin these locations the P-wave seismogram VS30 estimates would reflect the characteristics ofboth the relatively thin surficial sediments and the underlying stiffer formations.
The P-wave seismogram VS30 estimates can be compared with a limited number ofVS30 values from in-situ measurements obtained in the region, as reported by the NGA-Eastproject (Parker et al. 2017). From a total of 2,754 in-situ VS measurement locations in theNGA-East database, 78 lie within Texas, Oklahoma, and Kansas. Sixty-eight of these measure-ments were performed along the Texas Gulf Coast, with most of the rest performed in Oklahoma.Only one of these measurements is co-located with a P-wave seismogram estimate of VS30 fromthis study (US.WMOK station in the Wichita Mountains of Oklahoma). The in situ shear wavevelocity measurement at the US.WMOK seismic station indicates a value of VS30 ¼ 1,859m∕s,while the P-wave seismogram method estimated a VS30 value of 1,663 m/s. This is consideredexcellent agreement with only about 10% difference. Additional in-situ shear wave velocitymeasurements have been collected at 15 seismic stations in the Dallas-Fort Worth area(Zalachoris et al. 2017). TheVS30 values from in-situ measurements are plotted against the valuesestimated by the P-wave seismogram method in Figure 7. The agreement is favorable with datascattered about a 1:1 line. A slight negative bias is indicated (i.e., the P-wave seismogram valuesare about 20% smaller than the values from the in-situ measurements, on average), but this biasgenerally is within the uncertainty of the VS30 measurement.
The generally favorable comparisons with in situ measurements provide some confidencein the estimates of VS30 from the P-wave seismogram method. Nonetheless, a further assess-ment of the performance and variability of the P-wave seismogram method using measuredVS profiles in different areas and geologic units, particularly at locations of seismic stationswithin Texas, is necessary. Additionally, it is important to note that obtaining VS30 fromin-situ shear wave velocity measurements is always preferred over any other method.
COMPARISON WITH NGA-EAST VS30 ESTIMATES
As mentioned earlier, Parker et al. (2017) developed a hybrid slope-geology based proxymethod for the CENA and this method was used to assign VS30 values to 1,378 seismicstations in CENA (Goulet et al. 2014). One-hundred eighty-two of these stations correspondwith stations analyzed by the P-wave seismogram method in this study.
952 G. ZALACHORIS, E. M. RATHJE, AND J. G. PAINE

Figure 8 compares the P-wave seismogram VS30 estimates of the present study with thosefrom Parker et al. (2017) for NGA-East for the stations common in the data sets. For 37% of theseismic stations the VS30 estimates from the hybrid slope-geology proxy method and the P-waveseismogram method are within�25% of each other. The P-wave seismogram method estimatesare more than 25% smaller than the NGA-East estimates for 15% of the stations (these arepredominantly Mesozoic sites), and they are more than 25% larger than the NGA-East estimatesfor 48% of the stations (these are predominantly Quaternary, Tertiary, and Paleozoic sites).
For stations located on Paleozoic units (i.e., Llano Uplift, North-Central Plains, Wichitaand Arbuckle mountains, Ozark Plateau) the NGA-East proxy assigns a VS30 of 684 m/s toeach site, while the P-wave seismogram method provides a range of estimates that extend tomuch larger values. For example, the US.WMOK station with an in situ measured VS30 of1,859 m/s and P-wave seismogram estimate of 1,663 m/s falls into this category. These dif-ferences with the NGA-East proxy values is possibly due to the Paleozoic VS measurementsin the NGA-East database representing weathered Paleozoic sites that are different than thosein the study area of Texas, Oklahoma, and Kansas. Parker et al. (2017) recognized the lim-itations of their hybrid slope-geology proxy for Paleozoic formations based on the largevariability in the measured VS30 values for this unit.
The other condition for which the P-wave seismogram estimates of VS30 are larger is forthe stations located on Quaternary and Tertiary units. Here the NGA-East proxy methodassigns VS30 between 200 m/s and 400 m/s, and the P-wave seismogram method estimateslarger VS30 values possibly due to the relatively small thickness of the younger sedimentsunderlain by stiffer geologic units in parts of the study area. As noted earlier, this observation
Figure 7. Comparison of estimated P-wave seismogram VS30 values with VS30 values obtainedfrom in-situ measurements at co-located seismic stations.
VS30 CHARACTERIZATIONOF TEXAS, OKLAHOMA, AND KANSAS USING THE P-WAVE SEISMOGRAMMETHOD 953
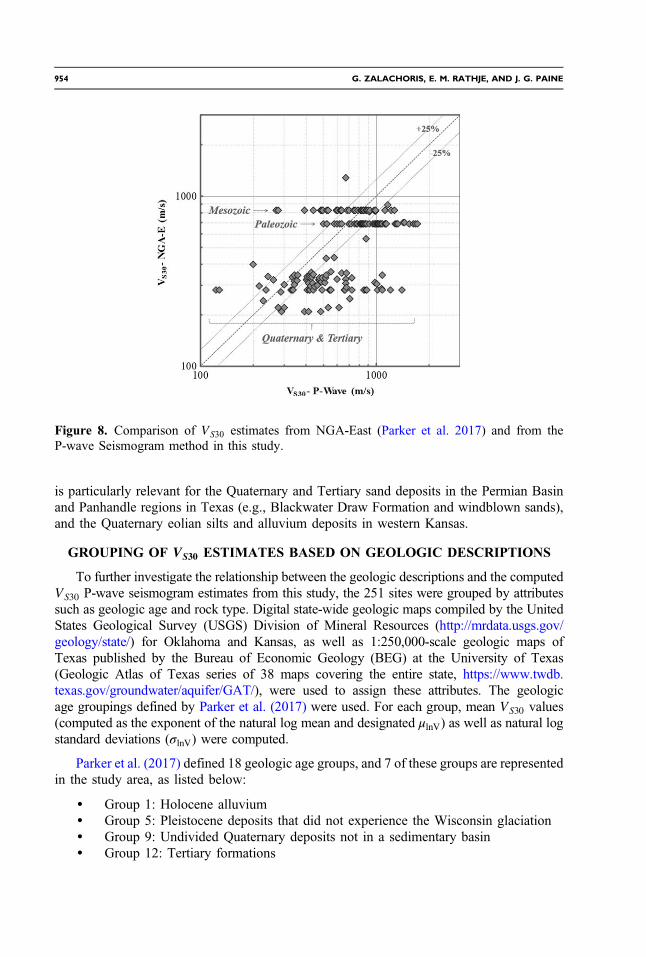
is particularly relevant for the Quaternary and Tertiary sand deposits in the Permian Basinand Panhandle regions in Texas (e.g., Blackwater Draw Formation and windblown sands),and the Quaternary eolian silts and alluvium deposits in western Kansas.
GROUPING OF VS30 ESTIMATES BASED ON GEOLOGIC DESCRIPTIONS
To further investigate the relationship between the geologic descriptions and the computedVS30 P-wave seismogram estimates from this study, the 251 sites were grouped by attributessuch as geologic age and rock type. Digital state-wide geologic maps compiled by the UnitedStates Geological Survey (USGS) Division of Mineral Resources (http://mrdata.usgs.gov/geology/state/) for Oklahoma and Kansas, as well as 1:250,000-scale geologic maps ofTexas published by the Bureau of Economic Geology (BEG) at the University of Texas(Geologic Atlas of Texas series of 38 maps covering the entire state, https://www.twdb.texas.gov/groundwater/aquifer/GAT/), were used to assign these attributes. The geologicage groupings defined by Parker et al. (2017) were used. For each group, mean VS30 values(computed as the exponent of the natural log mean and designated μlnV) as well as natural logstandard deviations (σlnV) were computed.
Parker et al. (2017) defined 18 geologic age groups, and 7 of these groups are representedin the study area, as listed below:
• Group 1: Holocene alluvium• Group 5: Pleistocene deposits that did not experience the Wisconsin glaciation• Group 9: Undivided Quaternary deposits not in a sedimentary basin• Group 12: Tertiary formations
Figure 8. Comparison of VS30 estimates from NGA-East (Parker et al. 2017) and from theP-wave Seismogram method in this study.
954 G. ZALACHORIS, E. M. RATHJE, AND J. G. PAINE

• Group 13: Mesozoic formations• Group 15: Paleozoic formations not in the Illinois Basin that did not experience the
Wisconsin glaciation• Group 17: Precambrian formations
In terms of rock type, the documented geologic descriptions were divided into six rock typegroups based on the relative stiffness of the formations. Three groups represent differenttypes of soil deposits and three groups represent soft-to-hard rock formations, as listed below:
• Group A: Alluvial and terrace deposits• Group B: Clay, silt, and loess; not alluvium• Group C: Sand and gravel; not alluvium• Group D: Sedimentary formations of varying degrees of cementation; mudstone,
claystone, siltstone, sandstone, conglomerate, marl, and shale• Group E: Limestone, chalk, and evaporite• Group F: Chert, basalt, granite, and rhyolite
Figure 9. Histograms of P-wave seismogram VS30 estimates for different NGA-East geologicproxy groups.
VS30 CHARACTERIZATIONOF TEXAS, OKLAHOMA, AND KANSAS USING THE P-WAVE SEISMOGRAMMETHOD 955

Tab
le2.
MeanVS3
0(μ
lnV)andstandard
deviation(σ
lnV)values
fordifferentgeologic
ageandrock
type
groupings
NGA-East
Group
GeologicAge
RockTyp
eGroup
Npts
μ lnVðm
∕sÞ
σ lnV
Parkeret
al.(201
7)
Npts
μ lnVðm
∕sÞ
σ lnV
1Cenozoic-Quaternary-HoloceneAllu
vium
A/C
13363
0.44
308
210
0.23
5Cenozoic-Quaternary-Pleistocene
A/B/C
36440
0.61
284
271*
0.36
9Cenozoic-Quaternary-Undivided
A/B/C
20512
0.52
154
296*
0.43
12Cenozoic-Tertiary
All
B/C/D/F
4244
20.34
111
315*
0.31
Clay
B13
349
0.25
Sand,
gravel,sand
ston
e,mud
ston
eC/D
2847
80.30
Basalt
F1
1077
N/A
13Mesozoic
All
C/D/E
4961
20.42
2082
20.68
Sand/sandstone,clay/claystone,shale,marl
C/D
2954
30.41
Lim
estone,chalk,
evaporite
E20
727
0.37
15Paleozoic
All
D/E/F
9181
30.40
9668
40.61
Sandstone,mud
ston
e,siltstone
D74
756
0.39
Lim
estone,chalk,
evaporite
E12
981
0.27
Granite,chert
F3
1578
0.05
17Precambrian
All
F2
1434
0.01
3769
90.85
15/17
Paleozoic/Precambrian
Granite,chert,rhyo
lite
F5
1519
0.06
*Note:
Parkeret
al.(2016)
includes
slop
egradient
term
.
956 G. ZALACHORIS, E. M. RATHJE, AND J. G. PAINE

Figure 9 shows the histogram of the P-wave seismogram VS30 values for six of the geologicage groups from NGA-East. Group 17 (Precambrian) is not plotted because only two esti-mates are available for this group. The computed μlnV and σlnV are shown and these valuesare compared with those from Parker et al. (2017) in Table 2.
Figure 10. Histograms of P-wave seismogram VS30 estimates for revised NGA-East geologicproxy groups that distinguish rock type.
VS30 CHARACTERIZATIONOF TEXAS, OKLAHOMA, AND KANSAS USING THE P-WAVE SEISMOGRAMMETHOD 957
For the three Quaternary groups (Groups 1, 5, and 9), the μlnV and σlnV from this studyare larger than reported in Parker et al. (2017). The μlnV are between about 360 m/s and510 m/s for this study, while they are between 210 m/s and 300 m/s in Parker et al.(2017), and the σlnV are between about 0.45 and 0.6 for this study and between 0.23and 0.43 in Parker et al. (2017). The differences are likely due to the fact that many ofthe Quaternary sites in the study area represent relatively narrow alluvial channels or wind-blown deposits with sediments that are relatively thin (i.e., less than 30 m). Many of theQuaternary sites included in the Parker et al. (2017) data set are from the broad alluvialbasins, such as the Mississippi Embayment, which have deeper unconsolidated soil depositsand thus smaller VS30. The five Quaternary sites from this study that are associated withthicker sediments along the Gulf Coast have μlnV equal to 271 m/s, which is more consistentwith the values reported by Parker et al. (2017).
For the Tertiary group (Group 12, Figure 9 and Table 2) the μlnV is larger for this study(442 m/s vs. 315 m/s) but the σlnV are similar. For the Mesozoic group (Group 13), the μlnVand σlnV are smaller for this study. And for the Paleozoic (Group 15) and Precambrian (Group17) groups, the μlnV are larger for this study but the σlnV are smaller. These differences are notsurprising given that the study area for Parker et al. (2017) included the entirety of central andeastern North America, and this study is focused on a smaller study area. Indeed, only 78 ofthe 2,754 VS30 values in the Parker et al. (2017) data set were located in Texas, Oklahoma, orKansas.
Our initial investigation of the histograms of sites separated based on rock type groups didnot yield better results than those shown in Figure 9 for geologic age groups. However, separat-ing the rock type groups within the older geologic age groups (Groups 12, 13, and 15) did resultin a statistically significant improvement. Statistical differences were determined using the twoF-tests described in Parker et al. (2017). The histograms for the separate rock type groups withinthese geologic age groups are shown in Figure 10 and the μlnV and σlnV are listed in Table 2.For Tertiary Group 12, rock type group B (clay sites) display smaller μlnV and σlnV than rocktypes C/D (sand/gravel/sandstone/mudstone/shale sites). For Mesozoic Group 13, rock typesC/D display a significantly smaller μlnV than rock type E (limestone/chalk, evaporite). ForPaleozoic Group 15, rock type D displays a smaller μlnV than rock type E which in turn hasa smaller μlnV than rock type F (granite, chert, rhyolite). In fact, the Paleozoic and Precambriansites of rock type F are all very similar with μlnV equal to 1,519 m/s and σlnV equal to 0.06.
DISCUSSION AND CONCLUSIONS
Estimates of VS30 at 251 seismic stations located within Texas, Oklahoma, and Kansaswere developed using the P-wave seismogrammethod and a total of 2,871 earthquake record-ings. Based on the P-wave seismogram VS30 values and inverse distance weighting, a pre-liminary VS30 map of the study area was created. This map captures the broad variations ofVS30 across the study area, including regions of rock with VS30 greater than 1,000 m/s andunconsolidated sediments with VS30 less than 400 m/s.
For the limited locations where VS30 values derived from in-situ shear wave velocitymeasurements were available, the P-wave seismogram estimates of VS30 agreed favorably.Although, on average, the P-wave seismogram values were about 20% smaller than those
958 G. ZALACHORIS, E. M. RATHJE, AND J. G. PAINE
from in-situ measurements, this can be considered within the uncertainty of the measure-ments. This favorable comparison demonstrates that if in-situ measurements of shearwave velocity are not available, the P-wave seismogram approach can provide a high-qualityestimate of VS30 for a seismic station.
Compared with the VS30 values assigned to the stations by the NGA-East hybridslope-geology proxy technique (Parker et al. 2017), the P-wave seismogram method gener-ally estimated larger VS30 values. Almost 50% of the sites analyzed in this study have P-waveseismogram VS30 values more than 25% larger than the NGA-East assigned values. Thesedifferences are likely due to differences in the characteristics of the geologic units in the studyarea relative to the characteristics of the sites in the VS30 database of Parker et al. (2017). Only78 of the 2,754 in situ VS measurements in Parker et al. (2017) were located in the study areaof Texas, Oklahoma, and Kansas.
The geologic conditions (i.e., geologic age and rock type) at each P-wave seismogramVS30 site were documented using large scale geologic maps. For the geologic age groups usedby Parker et al. (2017), the μlnV and σlnV from this study were different than reported inParker et al. (2017). Again, this result is likely due to differences in the geologic character-istics in the study area relative to the sites in Parker et al. (2017). The VS30 values from thepresent study also indicate that it is important to differentiate between rock types within theTertiary, Mesozoic, Paleozoic, and Precambrian geologic age groups. Statistical differencesin terms of both μlnV and σlnV were observed among the different rock types present in thesegeologic age groups (Table 2).
Based on this study, the following protocols are recommended for assigning VS30 valuesto seismic stations in Texas, Oklahoma, and Kansas. In-situ measurement of shear wavevelocity is always preferred and should be used if at all possible. If in-situ measurementsare not available, VS30 values derived using the P-wave seismogram method should beused because they are based on site-specific data. Finally, if neither in-situ VS measurementsnor P-wave seismogram VS30 estimates are available, then proxy techniques should beemployed. For sites in Texas, Oklahoma, and Kansas, the combined geologic age androck type proxy groups shown in Figures 9 and 10, and Table 2, should be used to assignVS30 to sites rather than the NGA-East hybrid slope-geology proxy technique (Parker et al.2017) because few in-situ VS measurements in Texas, Oklahoma, and Kansas were used inthe development of the NGA-East proxy method.
Finally, although the P-wave seismogram VS30 values derived in this study were consistentwith the general geologic conditions across the study area and agreed well with limited in-situVS measurements, additional site-specific validation of its performance and variability isneeded. In situ VS profile measurements at different seismic stations and within different geo-logic units of Texas, Oklahoma, and Kansas are required for this validation. A regional VSZ toVS30 conversion would also improve the VS30 estimates from the P-wave seismogram method.
ACKNOWLEDGMENTS
This work was sponsored through funding from the State of Texas through the TexNetSeismic Monitoring Project, from the Industrial Associates of the Center for Integrated Seis-mic Research (CISR) at the Bureau of Economic Geology of the University of Texas, and
VS30 CHARACTERIZATIONOF TEXAS, OKLAHOMA, AND KANSAS USING THE P-WAVE SEISMOGRAMMETHOD 959

from the Texas Department of Transportation under Project 0-6916. This funding is grate-fully acknowledged. This work also benefited significantly from interactions with the NGA-East Geotechnical Working Group, in particular Grace Parker, Byungmin Kim, JonathanStewart, and Youssef Hashash.
REFERENCES
Abrahamson, N. A., Silva, W. J., and Kamai, R., 2014. Summary of the Abrahamson, Silva, andKamai NGA-West 2 ground-motion relations for active crustal regions, Earthquake Spectra30, 1025–1055.
Aki, K., and Richards, P. G., 2002. Quantitative Seismology, University Science Books,Sausalito, CA, 700 pp.
Boore, D. M., Stewart, J. P., Seyhan, E., and Atkinson, G. M., 2014. NGA-West2 Equations forPredicting PGA, PGV, and 5% Damped PSA for Shallow Crustal Earthquakes, EarthquakeSpectra 30, 1057–1085.
Dreiling, J., Isken, M. P., Mooney, W. D., Chapman, M. C., and Godbee, R. W., 2014. NGA-EastRegionalization Report: Comparison of Four Crustal Regions within Central, and EasternNorth America using Waveform Modeling, and 5%-Damped Pseudo-Spectral AccelerationResponse, PEER Report 2014/15. PEER, Berkeley, CA, available online at: http://peer.berkeley.edu/publications/peer_reports.html.
Electric Power Research Institute (EPRI), 1993. Guidelines for determining design basis groundmotions, Report No. TR-102293, Palo Alto, CA.
Goulet, C. A., Kishida, T., Ancheta, T. D., Cramer, C. H., Darragh, R. B., Silva, W. J., Hashash,Y. M. A., Harmon, J.A., Stewart, J. P., Wooddell, K. E., and Youngs, R. R., 2014. PEERNGA-East Database, PEER Report 2014/17, Pacific Earthquake Engineering Research Center,Berkeley, CA. Available online at: http://peer.berkeley.edu/publications/peer_reports.html.
Hosseini, M., Somerville, P., Skarlatoudis, A., Bayless, J., and Thio, H. K., 2016. Constrainingshallow subsurface S wave velocities with the initial portion of local P waves recorded atmultiple seismic networks including ANSS, and EarthScope Transportable Array in theCEUS, Final Technical Report Award Number: G14AP00110.
Incorporated Research Institutions for Seismology (IRIS), available at https://www.iris.edu/hq/.
Kim, B., Hashash, Y. M. A., Rathje, E. M., Stewart, J. P., Ni, S., Somerville, P. G., Kottke, A. R.,Silva, W. J., and Campbell, K. W., 2016. Subsurface shear-wave velocity characterizationusing P-wave seismograms in central, and eastern North America, Earthquake Spectra 32,143–169.
Kottke, A. R., Hashash, Y. M. A., Stewart, J. P., Moss, C. J., Nikolaou, S., Rathje, E. M., Silva,W. J., and Campbell, K. W., 2012. Development of geologic site classes for seismic site ampli-fication for central, and eastern North America, Paper No. 4557, in Proc. 15th World Conf. onEarthquake Eng., 24–28 September 2012, Lisbon, Portugal.
Ni, S, Li, Z., and Somerville, P., 2014. Estimating subsurface shear velocity with radial to verticalratio of local P-waves, Seismol. Res. Lett. 85, doi: 10.1785/0220130128.
Pacific Earthquake Engineering Research Center (PEER), 2015. NGA-East: Median Ground-Motion Models for Central and Eastern North America, PEER Report 2015/04, PEER,Berkeley, CA, available at http://peer.berkeley.edu/publications/peer_reports.html.
Parker, G. A., Harmon, J. A., Stewart, J. P., Hashash, Y. M. A., Kottke, A. R., Rathje, E. M.,Silva, W., and Campbell, K. W., 2017. Proxy-based VS30 estimation in central, and easternNorth America, Bull. Seisol. Soc. Am., accepted for publication.
960 G. ZALACHORIS, E. M. RATHJE, AND J. G. PAINE

Petersen, M. D., Moschetti, M. P., Powers, P. M., Moschetti, M. P., Hoover, S. M., Llenos, A. L.,Ellsworth, W. L., Michael, A. J., Rubinstein, J. L., McGarr, A. F., and Rukstales, K. S., 2016.One-Year Seismic Hazard Forecast for the Central and Eastern United States from Induced andNatural Earthquakes, U.S. Geological Survey Open-File Report 2016–1035, 58 pp.
United States Geological Survey (USGS) Division of Mineral Resources (DMR). State-WideGeologic Maps, available at https://mrdata.usgs.gov/geology/state/.
Wald, D. J., and Allen, T. I., 2007. Topographic slope as a proxy for seismic site conditions, andamplification, Bull. Seisol. Soc. Am. 97, 1379–1395.
Wills, C. J., and Clahan, K. B., 2006. Developing a Map of Geologically Defined Site-ConditionCategories for California, Bull. Seisol. Soc. Am. 96, 1483–1501.
Yong, A., Hough, S. E., Iwahashi, J., and Braverman, A., 2012. A terrain based site conditionsmap of California with implications for the contiguous United States, Bull. Seismol. Soc. Am.,102, 114–12.
Zalachoris, G., Rathje, E., Cox, B., and Chen, T., 2017. Application of the P-wave seismogrammethod for VS30 characterization of Texas, Oklahoma, and Kansas, 3rd International Con-ference on Performance-Based Design in Earthquake Geotechnical Engineering, Vancouver,BC, Canada.
(Received 24 October 2016; accepted 15 February 2017)
VS30 CHARACTERIZATIONOF TEXAS, OKLAHOMA, AND KANSAS USING THE P-WAVE SEISMOGRAMMETHOD 961