volumeandnumberofneuronsofthe …bib.irb.hr/datoteka/8839.8839.pdf · volumeandnumberofneuronsofthe...
TRANSCRIPT

Volume and Number of Neurons of theHuman Hippocampal Formation in
Normal Aging and Alzheimer’s Disease
GORAN SIMIC,1 IVICA KOSTOVIC,1 BENGT WINBLAD,2 AND NENAD BOGDANOVIC2*1Department of Anatomy, Section of Neuroanatomy, Croatian Institute for Brain Research,
School of Medicine Zagreb, Zagreb, 10000, Croatia2Department of Clinical Neuroscience and Family Medicine, Geriatric Section,
Karolinska Institute, Huddinge University Hospital, S-141 86 Huddinge, Sweden
ABSTRACTIn order to observe changes owing to aging andAlzheimer’s disease (AD) in the volumes of
subdivisions of the hippocampus and the number of neurons of the hippocampal formation, 18normal brains from subjects who died of nonneurological causes and had no history oflong-term illness or dementia (ten of these brains comprised the aged control group) and 13AD brains were analyzed. An optimized design for sampling, measuring volume by using theCavalieri principle, and counting the number of neurons by using the optical disector wasimplemented on 50 µm-thick cresyl-violet sections.
The mean total volume of the principal subdivisions of the hippocampal formation (fasciadentata, hilus, CA3-2, CA1, and subiculum) showed a negative correlation with age in normalsubjects (r 5 20.56, 2P , 0.05), and a 32% mean reduction in the AD group compared withcontrols (P , 0.001). This finding supports the measurement of the coronal cross-sectionalarea and the volume of the hippocampal formation in the clinical diagnosis of AD.
There was an inverse relationship between the age of normal subjects and the number ofneurons in CA1 (r 5 20.84, 2P , 0.0001) and subiculum (r 5 20.49, 2P , 0.05) but not inother subdivisions. Pronounced AD-related reductions in neuron number were found only inthe subiculum and the fascia dentata. Compared with controls, both losses represented 23% ofneurons (P , 0.05). These results 1) confirm that AD is a qualitatively different process fromnormal aging and 2) reveal the regional selectivity of neuron loss within the hippocampalformation in aging andAD, whichmay be relevant to understanding themechanisms involvedin the neuron loss associated with the two processes. J. Comp. Neurol. 379:482–494,1997. r 1997 Wiley-Liss, Inc.
Indexing terms: cortex; memory; stereology; neurobiology
There are many good reasons why it is important toknow the number of neurons. The number of neuronsdetermines the functional capacity of the brain or anyparticular neural structure (Bok, 1959; Jerison, 1973). Anincrease in the number of neurons of the central nervoussystem is the main phylogenetic trend in the evolution ofmammals, especially primates and humans (Brodmann,1909; Pearson and Pearson, 1976). Because all neurons inthe human cerebral cortex are postmitotic at the momentof birth and, therefore, cannot be regenerated, a loss canlead to significant and irreversible behavioral changes(Rakic, 1985).Many studies have proposed that the loss of neurons in
the hippocampus is amorphological correlate of thememoryimpairment seen in aging and disease-related dementia(Ball, 1977; Burke and Light, 1981; Mani et al., 1986;
Morris and Kopelman, 1986). Alzheimer’s disease (AD) isaccompanied by very early cell degeneration in the hippo-campus, which is associated with the deterioration ofmemory processes (Hyman et al., 1984). In advanced AD
Contract grant sponsor: Gun and Bertil Stohnes Stiftelse; Contract grantsponsor: Stiftelsen for Gamla Tjanarinnor; Contract grant sponsor: Stif-telsen Sigurd och Elsa Goljes Minne; Contract grant sponsor: Einer Belven;Contract grant sponsor: European Brain Bank Network Program; Contractgrant sponsor: Ministry of Science of the Republic of Croatia; Contractgrant number 0108-118.*Correspondence to: Nenad Bogdanovic, M.D., Department of Clinical
Neuroscience and Family Medicine, Geriatric Section Karolinska Institute,Huddinge University Hospital, S-141 86 Huddinge, Sweden. E-mail:[email protected] 26 April 1996; Revised 28 October 1996; Accepted 7 November
1996
THE JOURNAL OF COMPARATIVE NEUROLOGY 379:482–494 (1997)
r 1997 WILEY-LISS, INC.

cases, the hippocampus is one of the most profoundlyaffected regions of the brain (Braak and Braak, 1991), andthe consistency of hippocampal histopathology has led to adescription of AD as a ‘‘hippocampal dementia’’ (Ball et al.,1985).However, the relation of AD to the aging process of the
normal human brain has remained unclear. Because thebrains of most nondemented elderly individuals containneurofibrillary tangles (NFTs), senile (neuritic) plaques(SPs), and neuropil threads (NTs) at autopsy, it has beenproposed that the difference in neuron loss between agingandAD could be only quantitative (Selkoe, 1982; Terry andKatzman, 1983; Berg, 1985; Khachaturian, 1985). Becauseit is not possible to determine whether NFTs, SPs, and NTsrepresent nonspecific, age-related changes or are signs ofearly preclinical AD (Ulrich, 1985), it has been suggestedthat there is an overlapping continuum (or ‘‘clinicopatho-logic spectrum’’) in the pathologic process between elderlynondemented individuals, those with early stages of AD,and those withAD (Mann et al., 1984). The finding that thedistribution of AD-type changes in nondemented elderlyindividuals roughly matches the AD pattern supportedthis view of a commonality in the molecular pathology thatleads to NFTs and SPs in both aging andAD (Arriagada etal., 1992).On the other hand, in the last several years, many
authors have rejected the concept of AD as an exaggerated(or accelerated) normal aging process, because many ge-netic, biological, and clinical factors suggest that ADinvolves separate degenerative processes (Friedland et al.,1988; Mann, 1994; Selkoe, 1994; Hardy, 1996; Sandbrinket al., 1996). Although the AD process may take years tomanifest itself, the atrophic phase develops relativelyrapidly (Jarvik, 1978; Jobst et al., 1994). It seems that,with this phase, beyond a certain ‘‘threshold’’ (Roth, 1986),some specific AD-related process is associated with neuro-nal loss (West et al., 1994).In an attempt to resolve the relationship ofAD to normal
human brain aging, we were guided by the pioneeringwork of West and collaborators (West and Gundersen,1990; West, 1993; West et al., 1994). By studying the fivemajor subdivisions of the hippocampal formation (granulecell layer, hilus, CA3 and 2, CA1, and subiculum) in threegroups of subjects (subjects who died of AD, normalsubjects above 65 years of age as controls, and normalsubjects under 65 years of age), the aims of our study were1) to determine possible losses in the volume and numberof neurons related to normal aging and 2) to compare theregional pattern of volume and neuron reduction betweennormal aging and AD. We started from the assumptionthat, if a difference in the regional pattern of volume andneuronal loss in the normal aging and AD groups could beproven, then this would mean that AD involves a specificdisease process that is not necessarily linked with theaging process of the brain.Most studies dealing with the number of neurons are
based on profile, but not particle, estimation (Agduhr,1941; Floderus, 1944; Abercrombie, 1946) and rarely fulfillrequirements for lack of bias (Gundersen, 1986). In suchstudies, the data represent indirect estimates of neurondensity obtained from improperly sampled sections, and,usually, nothing is known about the volume of the investi-gated structure. Consequently, the results are unreliableand incompatible (Coleman and Flood, 1987; Swaab and
Uylings, 1987; Coggeshall, 1992; Coggeshall and Lekan,1996).
MATERIALS AND METHODS
Materials
The study was based on 18 normal and 13 AD postmor-tem human brains from the Zagreb Collection of HumanBrains and the Huddinge Brain Bank. All brains wereobtained at routine autopsies in accordance with the lawsof both countries and with the permission of the ethicalcommittee. The brains were divided into three groups. Thefirst group included brains from 18 subjects who died ofnonneurological causes and had no history of long-termillness or dementia (mean age 58 years, range 16–99). Thesecond group of brains was a subgroup of the first andconsisted of ten subjects (mean age 80 years, range 71–99).Themean age of this control group approximatelymatchedthe mean age of the AD group. The third group includedthe brains from 13 patients with clinically and pathologi-cally confirmed AD (mean age 84 years, range 65–92).Clinical diagnosis was based on combined DSM-III-R(American Psychiatric Association, 1987) and NINCDS-ADRDA (McKhann, 1984) criteria. The neuropathologicaldiagnosis of definite AD was determined by using CERADcriteria (Mirra, 1993; Bogdanovic andMorris, 1995). Brainsfrom AD patients with other major neuropathologicalfindings, e.g., multiinfarct dementia, were excluded fromthe analysis.All of the brains were fixed within 24 hours of death.
Basic data about the patients from whom brains wereobtained, and the causes of death are shown in Table 1.
TABLE 1. Information About the Patients FromWhomBrains Were Obtained
Case no. Sex Age (years) Source1 Cause of death
Normal aging1 F 16 ZC Traffic accident2 M 17 ZC Hyperthermia3 M 20 ZC Murder4 M 25 ZC Traffic accident5 M 28 ZC Traffic accident6 M 33 ZC Perforation of duodenal ulcer7 M 47 ZC Traffic accident8 F 52 ZC Traffic accident
Age-matched controls9 M 71 HBB Cardiopulmonary insufficiency10 M 75 HBB Myocardial infarction11 F 76 HBB Pneumonia12 F 77 HBB Bronchopneumonia13 M 78 HBB Myocardial infarction14 F 78 HBB Traffic accident15 M 80 HBB Myocardial infarction16 M 80 HBB Rupture of aorta17 F 88 HBB Lung cancer18 F 99 HBB Traffic accident
Alzheimer’s disease19 F 65 HBB Pulmonary embolism20 M 77 HBB Massive hemorrhage from
esophagus21 M 80 HBB Rupture of aorta22 M 83 HBB Pulmonary embolism23 F 83 HBB Bronchopneumonia24 F 86 HBB Bronchopneumonia25 F 86 HBB Cardiopulmonary insufficiency26 M 87 HBB Cardiopulmonary insufficiency27 F 88 HBB Cardiopulmonary insufficiency28 F 88 HBB Liver cancer29 F 90 HBB Bronchopneumonia30 F 92 HBB Massive intestinal hemorrhage31 M 92 HBB Pulmonary embolism
1ZC, Zagreb Collection of Human Brains; HBB, Huddinge Brain Bank.
HIPPOCAMPUS IN AGING AND ALZHEIMER’S DISEASE 483

Methods
Sectioning and histology. After fixation in 4% formal-dehyde buffered with 0.1 M phosphate buffer for 8–32months, the left hippocampus was removed from eachbrain and cut in the rostrocaudal direction in 3-mm-thickslabs, with a random position for the first cut within thefirst rostral 3 mm interval. To determine shrinkage of thetissue in the period from cutting the slabs to final mount-ing of sections, the areas of three randomly chosen slabswere determined for every hippocampus before the embed-ding procedure by point counting under a dissectingmicroscope by using a quadratic grid with an interpointdistance of 1 mm. The slabs were dehydrated through agraded series of ethanol solutions (70%, 70%, 96%, 96%,100%, and 100%; 12 hours each) and ether-absolute alco-hol solution (with ether and alcohol in equal parts) for 180minutes twice. The slabs were then embedded in 2%celloidin (Cedukol, Merck, cat. no. 4363) for 24 hours, 4%celloidin for the next 24 hours, and finally in 8% celloidinuntil adequately hardened.One 50-µm-thick section was cut from the rostral part of
each slab. The sections were collected in 70% ethanol, putin 50% ethanol, then put in 5% ethanol for 2 minutes, thenput in distilled water for 5 minutes, and finally in stainingsolution. Staining solution was comprised of 1 part of 0.5%cresyl-violet in distilled water mixed with 4 parts ofdistilled water. The mounted sections were placed in thestaining solution until adequate staining was achieved.After that, the sections were placed in distilled water twicefor 5 minutes and then through a graded series of alcoholsolutions [50% ethanol, 70% ethanol with a few (two tofour) drops of 25% acetic acid in distilled water, 70%ethanol, and 95% ethanol] for 10minutes each. Finally, thesections were placed in ether-alcohol solution (2 parts of etherand 1 part of absolute alcohol) for 5 minutes, rinsed withxylene for 5 minutes, and mounted with a cover glass usingPermountmountingmedium. For determination of the extentof tissue shrinkage, the areas of the three previously selectedslabswere then reestimated (Uylings et al., 1986).Estimates of the reference volume and numerical
density of the neuron-containing subdivisions of the
hippocampal formation. All measurements were car-ried out on the left temporal lobe with an Olympus VideoStereological Analysis System (manufactured by BICO,Copenhagen). The system was based on a Zeiss Axioskopmicroscope mounted with a Hamamatsu C3077 CCD videocamera with a 50 mm Canon lens. The camera wasinterfaced via a Sony camera adapter CMA-D2 and aCommodore Amiga 2000 computer to a Sony Trinitroncolor monitor.For generation of the point counting grids of required
interpoint distance and the counting frames of requiredareas (both were superimposed on the screen picture) andfor the control of the x and y movement of the microscopicstage through two Multicontrol 2000 programmable step-ping motors, the GRID v2.0 software (Interactivision ApS,Silkeborg) was used. Measurement of the vertical move-ment of the stage (i.e., the height of the disector) was imple-mented by using a Heidenhain MT-12 digital microcator,which measures movements with a precision of 0.5 µm.Analysis of the brains was made without the investigator’sknowledge of the group identity or the age of the subjects.The first step in quantification was delineation of the
subfields of the hippocampal formation (HF). This was
made by using a low-power magnification of the videoimage imported from the section and was printed on aSony color video printer Mavigraph UP-5000P. Definitionsof the neuron-containing layers of the HF were madeaccording to well-known architectonic and topographicdata (Lorente de No, 1934; Braak 1972, 1974, 1980;Stephan, 1975; Schwerdtfeger, 1984; Rosene and VanHoesen, 1987; Duvernoy, 1988). For description of demar-cation lines, see West and Gundersen (1990).In the second step, estimates of the reference volume of
the delineated subdivisions of the HFweremade accordingto the classic mathematical principle of Cavalieri (1966):The volume of an object is the sum of the areas ofindividual profiles of the object on a set of systematicallypositioned parallel sections through the object (with ran-dom placement of the first section) multiplied by a knownconstant distance (in our case, 3mm) between profiles. Theareas of the delineated profiles of the subfields on thesections were estimated by counting the points that hit theprofiles in a quadratic lattice superimposed on the printedvideo image. The coefficient of error (CE) for the estimatesof volumes of the subfields less than 0.10 was achieved byusing the nomogram developed by Gundersen and Jensen(1987). This nomogram determines what the interpointdistance of the point lattices should be, so that 50–100points would hit a given set of 8–15 sections per hippocam-pus. According to the nomogram and suggestions given inWest and Gundersen (1990), we used point-counting gridswith different interpoint distances for different subdivi-sions: 2 mm for subiculum and CA1, 1 mm for CA3-2 andhilus, and 0.2 mm for the granule cell layer.The third step was measuring the numerical density of
neurons in the HF subdivisions by using the disectormethod (Sterio, 1984; Gundersen et al., 1988a,b). Anestimate of numerical density within an individual with apredetermined CE of less than 0.10 was achieved withabout 100 observations per one subdivision in one hippo-campus performed in a systematic randommanner. Assum-ing that all cells to have one, and only one, nucleus,estimates were based on counting nuclei. The cells wereclassified either as neurons or as glial cells. Classificationof a cell as a neuron was made on the basis of a combina-tion of the following observations: 1) neuronal nuclei werelarger and less stained than those of glial cells, and 2)neurons mostly contained a distinct nucleolus and clearlydefined cytoplasm containing Nissl bodies. Cells that couldnot be classified as neurons were categorized as glial cells;therefore, they were not counted. The areas of the countingframes were dimensioned, so that one to two neuronalnuclei would typically be sampled in a disector of a 20 µmheight. This height was chosen, because it was a comfort-able distance over which tomake observations. The dimen-sions of the counting frames used to obtain the samplingintensity mentioned had different sizes in the differentsubdivisions of HF: 8,112 µm2 for subiculum and hilus,3,588 µm2 for CA1 and CA3-2, and 391 µm2 for the fasciadentata, as shown in Figure 1. The systematic randomdisector samples were obtained by stepping using themeander path function of the GRID v2.0 program. Theparticular hippocampal subdivision was first outlined onthe screen at a low magnification by using the cursor.Then, a 3100 oil-immersion objective with a numericalaperture of 1.40 was moved into place, and the appropriatecounting frame was superimposed on the screen. The
484 G. SIMIC ET AL.

desired horizontal and vertical step lengths, for whichhighly precise servocontrolled motors move the sections ina raster pattern, giving systematic disector samples, weredimensioned in such a way that approximately 100 disec-tor samples per hippocampus were obtained. Frames thatdid not fall entirely within the outlined area were countedas fractional frames (depending on the number of corners
of the frame hitting the outlined area). Neurons for whichthe clearest nuclear profiles fell within the disector volumeand did not touch either of the two (left and bottom)forbidden lines or the ‘‘look-up’’ plane were counted. Thetotal number of neurons was obtained by multiplying thenumerical density of the particular hippocampal subdivi-sion with its reference volume.
Fig. 1. Counting frames used in the different subdivisions of the hippocampal formation. Thedimensions of the frames are indicated at the top of each micrograph. A: Granule cell layer (GCL). B:Hilus.C: CA3-2.D: CA1. E: subiculum.
HIPPOCAMPUS IN AGING AND ALZHEIMER’S DISEASE 485
Statistical analysis was carried out by means of theStatistica v4.0 program (Statsoft, Inc.). The age-relatedreduction in volume and loss of neurons were describedwith Pearson’s coefficient of correlation (r) and were evalu-ated for each group of hippocampi (normal, controls, AD)by testing the linear regression. Regressions with 2Pvalues of Pearson’s coefficient of correlation less than 5%were defined as statistically significant. AD-related vol-ume and neuronal loss were evaluated with unpaired(one-sided) Student’s t tests: data from subjects in the ADgroup were compared with the age-matched control group.The value of P less than 0.05 was chosen as the criteria forthe level of confidence.
RESULTS
Shrinkage measurements
There was no correlation in either direction between theshrinkage and the age of the subjects, as can be seen inTable 2. Although the extent of the shrinkage was large,the difference in shrinkage between brains was rathersmall. Therefore, an identical areal shrinkage correctionfactor (40%) was used for all brains. For determination ofthe shrinkage in the third dimension (assuming thatshrinkage is similar in all three dimensions), we used thevalue of the square root of the areal shrinkage as acorrection factor on slab thickness used in the Cavalieriformula.
Qualitative observations
Localized regions of neuronal loss in the CA1 field werean almost constant finding in normal older brains (Fig. 2).Similar changes, usually of a greater extent, were alsoobserved in AD hippocampi (Fig. 3). On the other hand,unlike normal brains, in most AD cases, an apparentdiffuse loss of neurons from almost all subfields of HF wasalso observed (Fig. 4). A predominant mechanism of neuro-nal death in all subdivisions was necrotic death character-ized by cell swelling and gliosis (Saper, 1985). Neurons inthe early stage of this change (except granule cells of thefascia dentata) had ballooned cell bodies, and most of themcontained an amorphous poorly stained zone that corre-sponded to the developing NFTs (Fig. 5A). At a later stage,the neuron dies, leaving behind an insoluble tangle (‘‘ghosttangle’’) and accompanying gliosis. In AD brains as well asin older aging brains, astrocyte-like cells surrounding dyingneurons were predominant, particularly in the subiculum. Asmall proportion of AD neurons (and, very rarely, of normalaging neurons) in all subfields (particularlyCA1) ofHF, exceptthe fascia dentata, underwent granulovacuolar degeneration(Fig. 5B). Most of them contained NFTs, and those withdiminished nuclei were not counted. In addition, localizedregions of neuronal loss in the CA3-2 field (a so-called ‘‘resis-tant sector’’ of HF) were occasionally observed in normalolder brains as well as in AD brains (Fig. 6), and a normalhippocampus with seven digitations was found (Fig. 7).
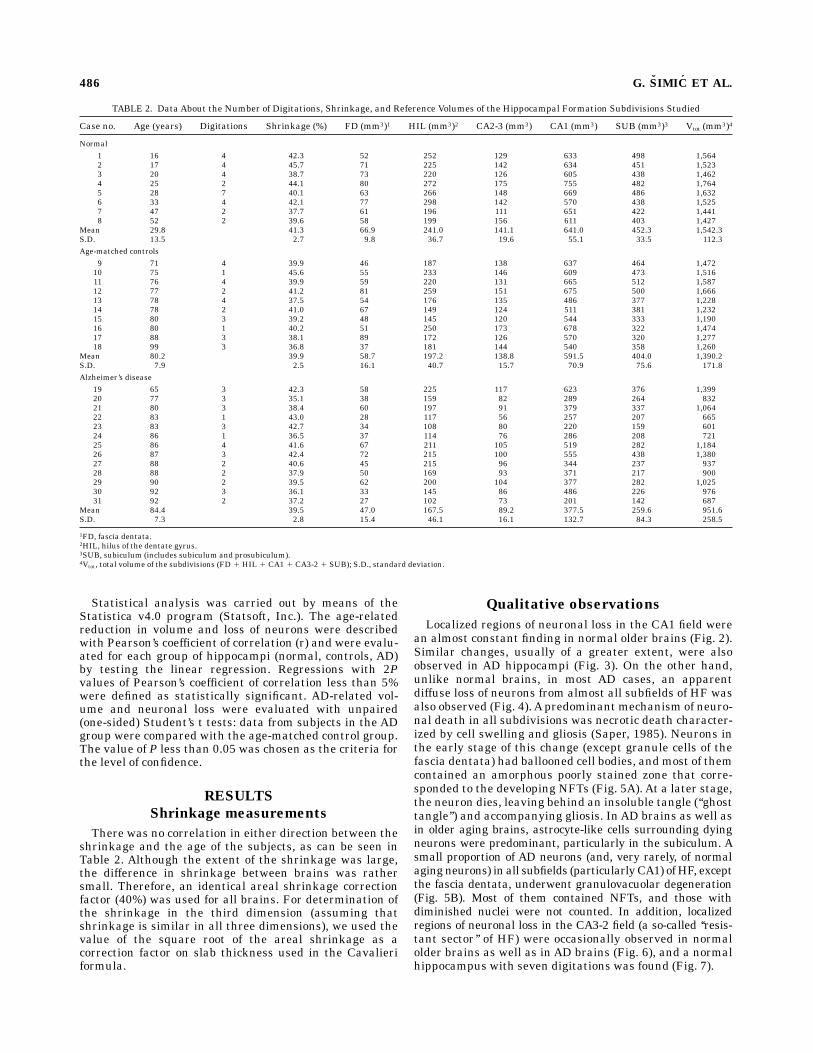
TABLE 2. Data About the Number of Digitations, Shrinkage, and Reference Volumes of the Hippocampal Formation Subdivisions Studied
Case no. Age (years) Digitations Shrinkage (%) FD (mm3)1 HIL (mm3)2 CA2-3 (mm3) CA1 (mm3) SUB (mm3)3 Vtot (mm3)4
Normal1 16 4 42.3 52 252 129 633 498 1,5642 17 4 45.7 71 225 142 634 451 1,5233 20 4 38.7 73 220 126 605 438 1,4624 25 2 44.1 80 272 175 755 482 1,7645 28 7 40.1 63 266 148 669 486 1,6326 33 4 42.1 77 298 142 570 438 1,5257 47 2 37.7 61 196 111 651 422 1,4418 52 2 39.6 58 199 156 611 403 1,427
Mean 29.8 41.3 66.9 241.0 141.1 641.0 452.3 1,542.3S.D. 13.5 2.7 9.8 36.7 19.6 55.1 33.5 112.3Age-matched controls
9 71 4 39.9 46 187 138 637 464 1,47210 75 1 45.6 55 233 146 609 473 1,51611 76 4 39.9 59 220 131 665 512 1,58712 77 2 41.2 81 259 151 675 500 1,66613 78 4 37.5 54 176 135 486 377 1,22814 78 2 41.0 67 149 124 511 381 1,23215 80 3 39.2 48 145 120 544 333 1,19016 80 1 40.2 51 250 173 678 322 1,47417 88 3 38.1 89 172 126 570 320 1,27718 99 3 36.8 37 181 144 540 358 1,260
Mean 80.2 39.9 58.7 197.2 138.8 591.5 404.0 1,390.2S.D. 7.9 2.5 16.1 40.7 15.7 70.9 75.6 171.8Alzheimer’s disease
19 65 3 42.3 58 225 117 623 376 1,39920 77 3 35.1 38 159 82 289 264 83221 80 3 38.4 60 197 91 379 337 1,06422 83 1 43.0 28 117 56 257 207 66523 83 3 42.7 34 108 80 220 159 60124 86 1 36.5 37 114 76 286 208 72125 86 4 41.6 67 211 105 519 282 1,18426 87 3 42.4 72 215 100 555 438 1,38027 88 2 40.6 45 215 96 344 237 93728 88 2 37.9 50 169 93 371 217 90029 90 2 39.5 62 200 104 377 282 1,02530 92 3 36.1 33 145 86 486 226 97631 92 2 37.2 27 102 73 201 142 687
Mean 84.4 39.5 47.0 167.5 89.2 377.5 259.6 951.6S.D. 7.3 2.8 15.4 46.1 16.1 132.7 84.3 258.5
1FD, fascia dentata.2HIL, hilus of the dentate gyrus.3SUB, subiculum (includes subiculum and prosubiculum).4Vtot, total volume of the subdivisions (FD 1 HIL 1 CA1 1 CA3-2 1 SUB); S.D., standard deviation.
486 G. SIMIC ET AL.

Estimates of the volume and number ofneurons of the neuron-containing
subdivisions of the HF
The data concerning the volumes (corrected for tissueshrinkage in all three dimensions) for each subdivision ofthe HF are presented in Table 2. The total volume, i.e., thesum of the volumes of all five principal subdivisions of theHF (fascia dentata, hilus, CA3-2, CA1, and subiculum), foreach hippocampus is plotted as a function of age in Figure8. A significant negative correlation between the totalvolume of the HF subdivisions with age was found(r 5 20.56, 2P 5 0.02). Compared with controls, a signifi-cant reduction of 32% in the mean total volume of the HFsubdivisions of AD brains was found (t 5 4.54, d.f. 5 21,P 5 0.0001).Data concerning the number of neurons in each subdivi-
sion of the HF as well as the total number of neurons ineach hippocampus are presented in Table 3. Figure 9shows the total number of neurons in each of the hippocam-pal subdivisions for every individual. Significant negative
regressions were seen between age and neuron numbers inCA1 (r 5 20.84, 2P 5 0.00001) and subiculum (r 5 20.49,2P 5 0.04) as well as between age and the total number ofneurons (r 5 20.73, 2P 5 0.001). The loss of neuronspredicted on the basis of regression lines was from25.994,800 neurons at the age of 16 to 8.465,200 at the ageof 99 (overall loss of 67% of neurons) for CA1 and from6.190,200 neurons at the age of 16 to 4.198,200 at the ageof 99 (overall loss of 32% of neurons) for the subiculum.There were no statistically significant correlations be-tween age and the numbers of neurons in the fasciadentata, the hilus, and the pyramidal cell layer of CA3-2.Compared with age-matched controls, statistically sig-
nificant AD-related reductions in the number of neuronswere found in the subiculum (t 5 1.81, d.f. 5 21, P 5 0.04)and the granule cell layer (t 5 2.71, d.f. 5 21, P 5 0.007)but not in other subdivisions. Compared with controls,both of these losses represented 23% of neurons. A signifi-cant positive correlation between the total number ofneurons in the HF subdivisions (particularly of CA1) andthe number of hippocampal digitationswas found (r 5 0.50,2P 5 0.02; for CA1 r 5 0.45, 2P 5 0.03; Fig. 10A,B).
DISCUSSION
Wefind celloidin blocks in combination with cresyl-violetdye very suitable for counting neurons, because the neu-rons are reliably stained and the sections have a very good
Fig. 2. An example of localized region of neuron loss in the CA1field of a normal elderly person (88-year-old subject no. 17) on a frontalsection through the rostral part of hippocampal formation.At the placeof neuron loss, gliosis and revascularization are seen. Scale bar 5 0.1mm.
Fig. 3. Big necrotic region in the CA1 field of an Alzheimer’sdisease (AD) patient (87-year-old subject no. 26). Scale bar 5 1 mm.
Fig. 4. Diffuse loss of neurons from almost all parts of hippocampalformation of anAD patient (88-year-old subject no. 28). Frontal sectionthrough the hippocampal body. Scale bar 5 1 mm.
HIPPOCAMPUS IN AGING AND ALZHEIMER’S DISEASE 487

quality. Hippocampal atrophy is a common feature ofadvancedAD (Tomlinson et al., 1970) and a relatively goodradiographic marker of the disease (Killiany et al., 1993;Lehericy et al., 1994). For example, hippocampal atrophywas found in 87% of AD cases in one large study by usingcomputerized tomography (De Leon et al., 1989). In thisstudy, we have found a mean reduction of 32% in the totalvolume of the subdivisions of the HF in AD patientscompared with controls. These results are in accordancewith the previously reported mean reductions of 10% (Dela Monte, 1989) and 31% (Huesgen et al., 1993) in the areaof the hippocampus on the coronal cross section in ADpatients, and they are also compatible with the results ofMRI studies that reported reductions in total hippocampalvolume of 36–60% (Bobinski et al., 1995), 40% (Seab et al.,1988), 41% (Erkinjuntti et al., 1993), and 48.8% (Kesslaket al., 1991) in AD patients vs controls. In conclusion, ourresults support themeasurement of the area of the hippocam-pus in the frontal plane onCT andMRI scans (and, if possible,volume) in shaping the antemortal diagnosis of AD.The normal hippocampus with seven digitations found
in this study is a rare finding, because only one to fivedigitations are usually found (with the incidence of five
Fig. 5. A: Neuron in the CA1 of an AD patient (90-year-old subjectno. 29) in the early stage of necrotic cell death with an amorphous,poorly stained zone that corresponds to the developing neurofibrillarytangles (NFT; arrow).B:Another example of a dying neuron (arrow) inthe CA1 in the same patient. The neuron is full of degeneratingvacuoles. Most of such neurons contained NFT, and those withdiminished nuclei were not counted. Scale bar 5 500 µm.
Fig. 6. An example of sharply demarcated region of neuron loss inthe CA3 field in an AD patient (92-year-old subject no. 30). Like inFigure 2, at the place of neuron loss, gliosis and revascularization areseen. Scale bar 5 0.1 mm.
Fig. 7. Normal hippocampus with seven digitations (arrowheads;28-year-old subject no. 5). Arrow shows vertical digitation (which isnot counted). This is a rare finding, because only one to five digitationsare usually found.
Fig. 8. Total volume of the neuron-containing subdivisions of thehippocampal formation. The open circles represent brains from nor-mal individuals, the crossed open circles represent controls, and thesolid circles represent AD brains. The dashed line represents asignificant regression for the normal brains, and the full line repre-sents regression for the AD group. Among normal subjects, there is asignificant negative correlation with age (2P , 0.05). The values of theAD group are significantly smaller than in the controls (P , 0.001).
488 G. SIMIC ET AL.

digitations less than 1%) (Gertz et al., 1972). Because asignificant positive correlation between the total numberof neurons of theHF subdivisions (particularly of CA1) andthe number of hippocampal digitationswas found (r 5 0.50,2P 5 0.02; for CA1 r 5 0.45, 2P 5 0.03), we suppose thathippocampal digitation does not reflect cortical atrophy(Zuckerkandl, 1887) or some ‘‘obstruction’’ during develop-ment (Giacomini, 1884) but is a result of the ‘‘gyration’’ ofthe hippocampus. This is in agreement with the fact thatCA1 is the main component of the digitations and is thefield that contributed most to the evolutionary progressionof the retrocommissural hippocampus (Stephan and Man-olescu, 1980; Stephan, 1983).
Considering neuron numbers, the only study compa-rable to ours is the one by West and collaborators (West etal., 1994), which is a continuation of the two previouslypublished studies (West andGundersen, 1990;West, 1993).In that study, significant negative regressions were foundbetween age and neuron number in the hilus and subicu-lum, representing 37% and 43% reductions, respectively,over the ages studied. The mean numbers of neurons perhippocampus in the hilus, CA1, and the subiculum of theAD group were significantly smaller than those of the agematched control group (1.16 3 106 vs. 1.54 3 106 for hilus,4.40 3 106 vs. 13.75 3 106 for CA1, and 2.93 3 106 vs.5.51 3 106 for subiculum). The most pronounced AD-
TABLE 3. Data About the Number of Neurons in Each Subdivision of the Hippocampal Formation and theTotal Number of Neurons in Each Hippocampus
Case no. Age (years) FD (106)1 HIL (106)2 CA2-3 (106) CA1 (106) SUB (106)3 Ntot (106)4 CE (Ntot)5
Normal1 16 17.7 2.2 3.1 26.3 5.0 54.3 0.1152 17 19.8 1.4 2.8 30.2 5.3 59.5 0.3533 20 20.7 1.6 2.4 26.7 4.5 55.9 0.2774 25 14.9 1.8 2.5 17.1 6.7 43.0 0.2565 28 18.0 1.3 2.3 17.6 7.5 46.7 0.1696 33 17.0 1.9 2.7 22.5 4.7 48.8 0.0987 47 20.9 1.5 3.0 14.8 6.5 46.7 0.2018 52 11.6 1.5 3.0 11.6 5.2 32.9 0.117Mean N 29.8 17.6 1.7 2.7 20.9 5.7 48.5S.D. 13.5 3.1 0.3 0.3 6.6 1.1 8.4CV6 0.45 0.18 0.18 0.11 0.32 0.19 0.17Mean CE7 0.080 0.098 0.066 0.069 0.060 0.216BV (N)8 0.161 0.139 0.075 0.302 0.191BV2/OCV2 (%)9 80 67 56 95 91Age-matched controls9 71 15.7 1.6 2.3 10.5 6.2 36.3 0.14210 75 14.2 1.0 2.3 10.8 3.2 31.5 0.09111 76 15.9 1.2 2.6 12.4 2.7 34.8 0.24512 77 20.3 1.3 2.4 10.9 5.0 39.9 0.27113 78 21.8 2.1 3.1 16.2 5.3 48.5 0.33414 78 15.3 1.2 2.3 9.8 3.5 32.1 0.31915 80 12.3 1.1 2.2 9.6 3.4 28.6 0.24316 80 11.8 1.2 2.5 12.2 3.4 31.1 0.10917 88 24.3 1.5 2.9 11.2 3.9 43.8 0.28118 99 13.9 1.3 2.4 14.3 5.1 37.0 0.171Mean N 80.2 16.6 1.4 2.5 11.8 4.2 36.4S.D. 7.9 4.2 0.3 0.3 2.1 1.1 6.2CV 0.10 0.25 0.21 0.12 0.18 0.26 0.17Mean CE 0.072 0.105 0.076 0.071 0.067 0.230BV (N) 0.239 0.170 0.080 0.154 0.262BV2/OCV2 (%) 91 72 53 82 94Alzheimer’s disease19 65 13.2 1.8 3.0 13.1 4.1 35.2 0.15520 77 10.9 1.0 1.8 11.3 2.9 27.9 0.20221 80 15.7 1.6 2.2 9.2 3.8 32.5 0.32322 83 12.9 1.3 2.1 8.4 2.8 27.5 0.32923 83 11.4 1.5 2.2 10.1 3.8 29.0 0.14924 86 10.3 1.5 2.4 13.6 5.8 33.6 0.33725 86 15.1 1.1 2.3 11.4 3.6 33.5 0.22926 87 18.5 1.2 2.9 17.9 4.6 45.1 0.30027 88 14.2 1.4 2.8 7.5 2.6 28.5 0.19728 88 10.2 1.4 2.0 5.4 1.3 20.3 0.28529 90 12.4 1.5 2.9 12.4 3.1 32.3 0.22230 92 11.6 1.2 2.4 9.8 2.3 27.3 0.19931 92 8.8 1.2 2.1 4.9 1.0 18.0 0.159Mean N 84.4 12.7 1.4 2.4 10.4 3.2 30.1S.D. 7.3 2.7 0.2 0.4 3.5 1.3 6.8CV 0.09 0.21 0.14 0.17 0.34 0.41 0.23Mean CE 0.098 0.088 0.099 0.085 0.093 0.246BV (N) 0.186 0.095 0.113 0.329 0.399BV2/OCV2 (%) 78 53 57 94 95
1FD, fascia dentata.2HIL, hilus of the dentate gyrus.3SUB, subiculum (includes subiculum and prosubiculum).4Ntot, total number of neurons in neuron-containing layers (FD 1 HIL 1 CA 1 CA3-2 1 SUB); S.D., standard deviation.5CE(Ntot), coefficient of error of the total neuron number for one subject. The formula for CE(Ntot) determination is given inAppendixA.6CV, coefficient of variation (CV 5 S.D./mean).7Mean CE, the mean coefficient of error of all individual estimates of the total neuron number, i.e., computable variation (OCE) of the stereological estimate of N [CE(SN) iscalculated in the same manner as CE(SP), as described in Appendix A, where Ni 5 Qi 3 Pi/Fi]; mean CE(Ntot), coefficient of error of the total neuron number for the group. Theformula for CE(Ntot) determination is given inAppendixA.8BV (N), biological variation, i.e., estimate of the true biological variance of N; BV(N) 5
ŒOCV2(N) 2 OCE2(N),where OCV2(N) is the total observed variance, and OCE2(N) is the estimated stereological sampling variance. For details, see Kroustrup and Gundersen (1983).9BV2/OCV2, proportion of the biological variance contributing to the observed variance of the total neuron number among the hippocampal subdivisions.
HIPPOCAMPUS IN AGING AND ALZHEIMER’S DISEASE 489
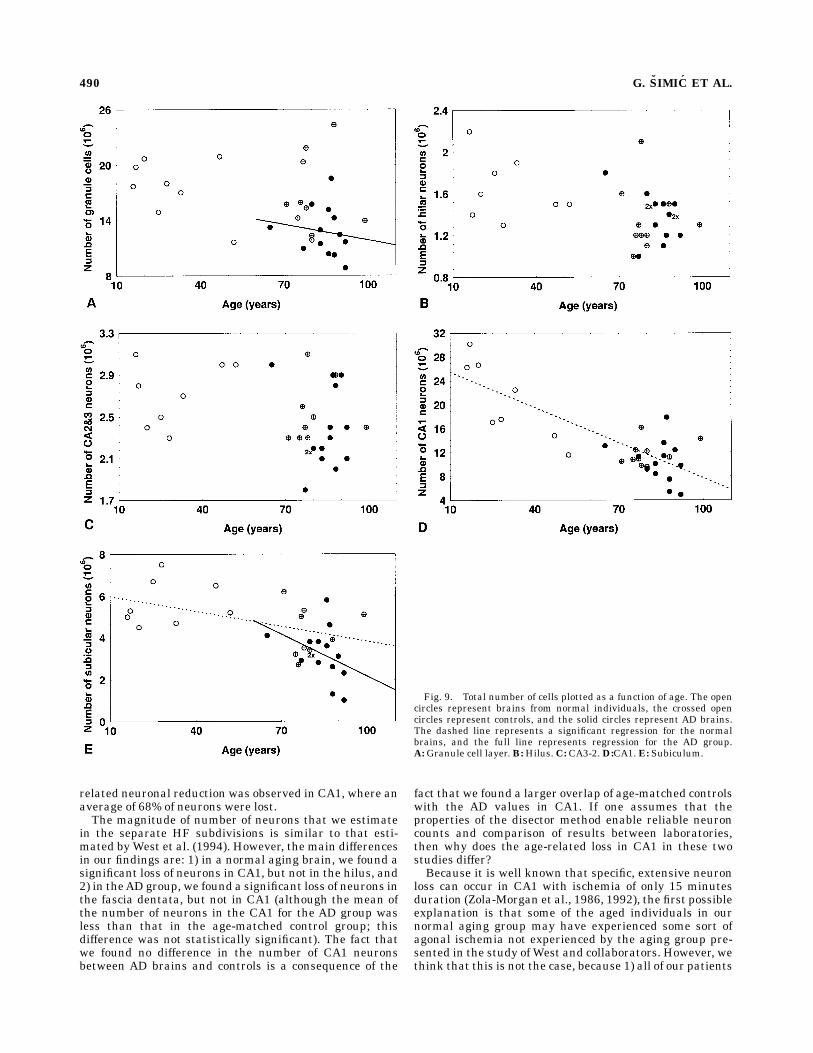
related neuronal reduction was observed in CA1, where anaverage of 68% of neurons were lost.The magnitude of number of neurons that we estimate
in the separate HF subdivisions is similar to that esti-mated byWest et al. (1994). However, the main differencesin our findings are: 1) in a normal aging brain, we found asignificant loss of neurons in CA1, but not in the hilus, and2) in theAD group, we found a significant loss of neurons inthe fascia dentata, but not in CA1 (although the mean ofthe number of neurons in the CA1 for the AD group wasless than that in the age-matched control group; thisdifference was not statistically significant). The fact thatwe found no difference in the number of CA1 neuronsbetween AD brains and controls is a consequence of the
fact that we found a larger overlap of age-matched controlswith the AD values in CA1. If one assumes that theproperties of the disector method enable reliable neuroncounts and comparison of results between laboratories,then why does the age-related loss in CA1 in these twostudies differ?Because it is well known that specific, extensive neuron
loss can occur in CA1 with ischemia of only 15 minutesduration (Zola-Morgan et al., 1986, 1992), the first possibleexplanation is that some of the aged individuals in ournormal aging group may have experienced some sort ofagonal ischemia not experienced by the aging group pre-sented in the study of West and collaborators. However, wethink that this is not the case, because 1) all of our patients
Fig. 9. Total number of cells plotted as a function of age. The opencircles represent brains from normal individuals, the crossed opencircles represent controls, and the solid circles represent AD brains.The dashed line represents a significant regression for the normalbrains, and the full line represents regression for the AD group.A:Granule cell layer.B:Hilus.C: CA3-2.D:CA1. E: Subiculum.
490 G. SIMIC ET AL.

in this group except two died in hospital in circumstancesof maximum health care with no clinical evidence forpremortal agonal state, 2) we were not able to demonstrateshrunken ‘‘red neurons’’ in control haematoxylin-eosinpreparations of the opposite (right) hippocampi as a sign ofischemia, and 3) all of these patients had a very lowcontent of initial NFTs and, under the clinical and patho-logical criteria described in the Materials and Methodssection, were not considered as ‘‘initial AD’’ (therefore, wechose them as controls).From our point of view, a second and more plausible
explanation is that interindividual differences are verylarge, so the sample size of both studies seems to be toosmall to reduce the standard error of the mean values ofthe two overlapping groups (AD group and controls) to apoint where the effects of aging and AD can be detectedreliably. Our data differ especially in the AD group. In theAD group, we have six cases with a larger number of CA1neurons than were reported by West et al. (1994). Thisleads to an increased overlap between the AD and age-matched control groups. However, we find our results to bein very good agreement with recent findings of DNAdamage patterns in the AD hippocampus (Paul Lucassen,unpublished data, personal communication).One interesting aspect of our findings is that there is
loss of neurons in CA1 during normal aging but noapparent atrophy in CA1. In AD brains compared with
age-matched controls, there is a loss of volume but notmuch change in number. These data suggest that there isneuron loss in CA1 during normal aging and that it isparticularly atrophy in CA1, and not neuron loss, thatdistinguishesAD brains from the controls. We assume thatatrophic changes in the neuropil of CA1 in AD brains maybe the consequence of a lowered compensatory neuronalplasticity and degeneration of dendrites that receive subicu-lar and perforant pathway projecting axons (Mizutani andKasakava, 1995).Nevertheless, beside the differences mentioned, it can be
concluded that both studies confirm the differences in thepattern of neuron number reduction associated with nor-mal aging and that associated with AD and can beconsidered compatible in a wider context. This is particu-larly true for the subiculum. A significant reduction ofsubicular neurons may represent a most profound anddetrimental deficit in AD patients compared with age-matched controls, because these fibers constitute the ‘‘backprojections’’ necessary for establishing declarative ‘‘long-term memories’’ (Lopes da Silva et al., 1990; Rolls, 1991;Traub and Miles, 1991) and serve as a major efferentcomponent of HF information processing to entorhinalcortex and to other cortical and subcortical regions (Roseneand Van Hoesen, 1977; Van Hoesen, 1982). Cell lossdocumented in other subfields of HF may further compro-mise the flow of information through the intrinsic hippo-campal circuitry and produce severe anterograde amnesia(Zola-Morgan et al., 1986). Another contribution to theisolation of HF from the association cortex in AD (‘‘discon-nection syndrome’’) is the inevitable severe loss of entorhi-nal layers II and III stellate and small pyramidal neurons,which isolates the hippocampal input via the perforantpathway (Braak and Braak, 1991; Hyman et al., 1984,1986), as well as the loss in layer IV large multipolarneurons, which prevents receipt of the hippocampal output(Hodges et al., 1992).To avoid misinterpretation of the results, it should be
emphasized that the relationship between the quantityand location of NFTs, and SPs, cell loss, and the degree ofdementia is not straightforward (Alafuzoff et al., 1987;Tomlinson, 1989; Braak and Braak, 1991; Terry et al.,1991). In our preliminary data (not published), we werealso unable to find any correlation between NFTs and thenumber of neurons in the HF subdivisions, especially inthe initial, preclinical stage of AD. Moreover, a certainextent of neuron loss is tolerated without concomitantfunctional loss because of redundant neuronal elementsand compensatory structural, physiological, and biochemi-cal processes (Hyman et al., 1987; Gertz et al., 1991).There are certainly limits to the degree to which a reduc-tion in the number of neurons can be tolerated, but thequestion of how and when neuron loss translates tofunctional impairment is still not resolved.On the basis of qualitative findings and the data ob-
tained, we suppose that localized losses of CA1 andsubicular neurons during normal agingmay bemorphologi-cal correlates of the so-called ‘‘benign senile forgetfulness’’(Winocur, 1988; Braak and Braak, 1991; Bouras et al.,1993; Hof and Morrison, 1994). For example, one suchclinically and pathologically well-documented case wasreported by Yamazaki et al. (1993). At the same time, adiffuse degeneration and neuron loss of vulnerable neuro-nal populations, such as the projecting neurons of subicu-lum and fascia dentata, together with simultaneous
Fig. 10. A: A significant positive correlation between the totalnumber of neurons and the number of digitations (r 5 0.50, 2P , 0.05).B: A significant positive correlation between the CA1 number ofneurons and the number of digitations (r 5 0.45, 2P , 0.05).
HIPPOCAMPUS IN AGING AND ALZHEIMER’S DISEASE 491

changes in other cortical areas and the septohippocampalsystem, may be the cause of a more severe disruption ofhippocampal circuitry and the memory decline seen in AD(Van Hoesen et al., 1991; DeLacoste and White, 1993).In conclusion, it is likely that the regional pattern of
neuronal loss differs qualitatively and quantitatively be-tween the normal aging group and the AD group, particu-larly in the subiculum and fascia dentata. The loss ofneurons in these regions is a result of the pathologicalprocess involved in AD but not in normal aging. Our data,thus, argue further against the hypothesis that AD ispurely an acceleration of aging.
ACKNOWLEDGMENTS
The technical assistance of ZdenkaCmuk, Danica Budin-scak, and Bozica Popovic (Croatian Institute for BrainResearch) and of Inga Volkmann (Huddinge Brain Bank)is greatly appreciated.
LITERATURE CITED
Abercrombie, M. (1946) Estimation of nuclear populations from microtomesections. Anat. Rec. 94:239–247.
Agduhr, E. (1941) A contribution to the technique of determining thenumber of nerve cells per volume unit of tissue. Anat. Rec. 80:191–202.
Alafuzoff, I., K. Iqbal, H. Friden, R. Adolfsson, and B. Winblad (1987)Histopathological criteria for progressive dementia disorders: Clinical-pathological correlation and classification by multivariate data analy-sis. Acta Neuropathol. 74:209–225.
American PsychiatricAssociation (1987) Diagnostic and Statistical Manualof Mental Disorders, Third Edition, Revised. Washington, DC: Ameri-can Psychiatric Association.
Arriagada, P.V., K. Marzloff, and B.T. Hyman (1992) Distribution ofAlzheimer-type pathologic changes in nondemented elderly individualsmatches the pattern inAlzheimer’s disease. Neurology 42:1681–1688.
Ball, M.J. (1977) Neuronal loss, neurofibrillary tangles and granulovacu-olar degeneration in the hippocampus with ageing and dementia. ActaNeuropathol. 37:111–118.
Ball, M.J., M. Fisman, V. Hachinski, V. Blume, A. Fox, V.A. Kral, A.J.Kirshen, H. Fox, and H. Merskey (1985) A new definition of Alzheimer’sdisease: A hippocampal dementia. Lancet 1:14–16.
Berg, L. (1985) Does Alzheimer’s disease represent an exaggeration ofnormal aging?Arch. Neurol. 42:737–739.
Bobinski, M., J. Weigel, H.M. Wisniewski, M. Tarnawski, B. Reisberg, B.Mlodzik, M.J. de Leon, and D.C. Miller (1995) Atrophy of hippocampalformation subdivisions correlates with stage and duration of Alzhei-mer’s disease. Dementia 6:205–210.
Bodganovic, N., and J.H. Morris (1995) Diagnostic criteria for Alzheimer’sdisease in multi-centre brain banking. In F.F. Cruz-Sanchez, R. Ravid,and M.L. Cuzner (eds): Neuropathological Diagnostic Criteria for BrainBanking. Amsterdam: IOS Press, pp. 20–29.
Bok, S.T. (1959) Histonomy of the Cerebral Cortex. Amsterdam: Elsevier.Bouras, C., P.R. Hof, and J.H. Morrison (1993) Neurofibrillary tangle
densities in the hippocampal formation in a non-demented populationdefine subgroups of patients with differential early pathological changes.Neurosci. Lett. 153:131–135.
Braak, H. (1972) Zur pigmentarchitektonik der grosshirnrinde des men-schen. II. Subiculum. Z. Zellforsch. 131:235–254.
Braak, H. (1974) On the structure of the human archicortex. I. The Cornuammonis. A Golgi and pigment architectonic study. Cell Tissue Res.152:349–383.
Braak, H. (1980) Architectonics of the Human Telencephalic Cortex.Studies of Brain Function, Vol. 4. Berlin: Springer, p. 147.
Braak, H., and E. Braak (1991) Neuropathological staging of Alzheimer-related changes. Acta Neuropathol. 82:239–259.
Brodmann, K. (1909) Vergleichende Lokalisationslehre der Grosshirnrindein ihren Prinzipien dargestellt auf Grund des Zellenbaues. Leipzig: A.Barth.
Burke, D.M., and L.L. Light (1981) Memory and aging. Psychol. Bull.90:513–546.
Cavalieri, B. (1966) Geometria Degli Indivisibili. Torino: Unione Tipogra-fico.
Coggeshall, R.E. (1992)A consideration of neural counting methods. TrendsNeurosci. 15:9–13.
Coggeshall, R.E., and H.A. Lekan (1996) Methods for determining numbersof cells and synapses: A case for more uniform standards of review. J.Comp. Neurol. 364:6–15.
Coleman, P.D., and D.G. Flood (1987) Neuron numbers and dendritic extentin normal aging andAlzheimer’s disease. Neurobiol. Aging 8:521–545.
DeLacoste, M.C., and C.L. White (1993) The role of cortical connectivity inAlzheimer’s disease pathogenesis: A review and model system. Neuro-biol. Aging 14:1–16.
De la Monte, S.M. (1989) Quantitation of cerebral atrophy in preclinicaland end-stageAlzheimer’s disease. Ann. Neurol. 25:450–459.
De Leon, M.J., A.E. George, L.A. Stylopoulos, G. Smith, and D.C. Miller(1989) Early marker for Alzheimer’s disease: The atrophic hippocam-pus. Lancet 9:672–673.
Duvernoy, H.M. (1988) The Human Hippocampus. An Atlas of AppliedAnatomy. Munchen: J.F. Bergman.
Erkinjuntti, T., D.H. Lee, F. Gao, R. Steenhuis, M. Eliasziw, R. Fry, H.Merskey, and V.C. Hachinski (1993) Temporal lobe atrophy on magneticresonance imaging in diagnosis of early Alzheimer’s disease. Arch.Neurol. 50:305–310.
Floderus, S. (1944) Untersuchungen uber den Bau der menschlichenHypophysemit besonderer Berucksichtigung der qualitativenmikromor-phologischen Verhaltnisse. APMIS 53:1–276.
Friedland, R.P., E. Koss, J.V. Haxby, C.L. Grady, J. Luxenberg, and M.B.Schapiro (1988)Alzheimer’s disease: Clinical and biological heterogene-ity. Ann. Intern. Med. 109:298–311.
Gertz, H.-J., H. Kruger, S. Patt, and J. Cervos-Navarro (1991) Tangle-bearing neurons show more extensive dendritic trees than tangle-freeneurons in area CA1 of the hippocampus in Alzheimer’s disease. BrainRes. 548:260–266.
Gertz, S.D., R. Lindenberg, and G.W. Piavis (1972) Structural variations inthe rostral human hippocampus. Hopkins Med. J. 130:367–376.
Giacomini, C.H. (1884) Fascia dentata du grand hippocampe dans lecerveau de l’homme. Arch. Ital. Biol. 5:396–417.
Gundersen, H.J.G. (1986) Stereology of arbitrary particles. A review ofunbiased number and size estimators and a presentation of some newones, in memory of William Thompson. J. Microsc. 143:3–45.
Gundersen, H.J.G., and E.B. Jensen (1987) The efficiency of systematicsampling in stereology and its prediction. J. Microsc. 147:229–263.
Gundersen, H.J.G., P. Bagger, T.F. Bendtsen, S.M. Evans, L. Korbo, N.Marcussen, A. Møller, K. Nielsen, J.R. Nyengaard, B. Pakkenberg, F.B.Sørensen, A. Vesterby, and M.J. West (1988a) The new stereologicaltools: Disector, fractionator, nucleator and point sampled intercepts andtheir use in pathological research and diagnosis. APMIS 96:857–881.
Gundersen, H.J.G., T.F. Bendtsen, L. Korbo, N. Marcussen, A. Møller, K.Nielsen, J.R. Nyengaard, B. Pakkenberg, F.B. Sørensen, A. Vesterby,and M.J. West (1988b) Some new, simple and efficient stereologicalmethods and their use in pathological research and diagnosis. APMIS96:379–394.
Hardy, J. (1996) Molecular genetics of Alzheimer’s disease. Acta Neurol.Scand. 93:13–17.
Hodges, J.R., D.P. Salmon, and N. Butters (1992) Semantic memoryimpairment in Alzheimer’s disease: Failure to access or degradedknowledge? Neuropsychologia 4:301–314.
Hof, P.R., and J.H. Morrison (1994) The cellular basis of cortical disconnec-tion in Alzheimer’s disease and relating dementing conditions. In R.D.Terry, R. Katzman, and K.L. Bick (eds): Alzheimer’s Disease. NewYork:Raven Press, pp. 197–229.
Huesgen, C.T., P.C. Burger, B.J. Crain, and G.A. Johnson (1993) In vitromicroscopy of the hippocampus in Alzheimer’s disease. Neurology43:145–152.
Hyman, B.T., A.R. Damasio, G.W. Van Hoesen, and C.L. Barnes (1984)Alzheimer’s disease: Cell specific pathology isolates the hippocampalformation. Science 225:1168–1170.
Hyman, B.T., G.W. Van Hoesen, L.J. Kromer, and A.R. Damasio (1986)Perforant pathway changes and thememory impairment ofAlzheimer’sdisease. Ann. Neurol. 20:472–481.
492 G. SIMIC ET AL.

Hyman, B.T., L.J. Kromer, and G.W. Van Hoesen (1987) Reinnervation ofthe hippocampal perforant pathway zone in Alzheimer’s disease. Ann.Neurol. 21:259–267.
Jarvik, L. (1978) Genetic factors and chromosomal aberrations in Alzhei-mer’s disease, senile dementia, and related disorders. In R. Katzman,R.D. Terry, and K.L. Bick, KL (eds): Alzheimer’s Disease. New York:Raven Press, pp. 273–278.
Jerison, J. (1973) Evolution of the Brain and Intelligence. New York:Academic Press.
Jobst, K.A., A.D. Smith, and M. Szatmari (1994) Rapidly progressingatrophy ofmedial temporal lobe inAlzheimer’s disease. Lancet 343:829–830.
Kesslak, J.P., O. Nalcioglu, and C.W. Cotman (1991) Quantification ofmagnetic resonance scans for hippocampal and parahippocampal atro-phy inAlzheimer’s disease. Neurology 41:51–54.
Khachaturian, Z.S. (1985) Diagnosis of Alzheimer’s disease. Arch. Neurol.42:1097–1105.
Killiany, R.J., M.B. Moss, M.S. Albert, T. Sandor, J. Tieman, and F. Jolesz(1993) Temporal lobe regions on magnetic resonance imageing identifypatients with earlyAlzheimer’s disease. Arch. Neurol. 50:949–954.
Kroustrup, J.P., and H.J.G. Gundersen (1993) Sampling problems in aheterogeneous organ: Quantitaton of relative and total volume ofpancreatic islets by light microsopy. J. Microscopy 132:43–55.
Lehericy, S., M. Baulac, J. Chiras, L. Pierot, N.Martin, B. Pillon, B. Deweer,B. Dubois B., and C. Marsault (1994) Amygdalohippocampal MRvolumemeasurements in the early stages ofAlzheimer’s disease.Am. J.Neuroradiol. 15:929–937.
Lopes da Silva, F.H., M.P. Witter, P.H. Boeijinga, and A.H.M. Lohman(1990) Anatomical organization and physiology of the limbic cortex.Physiol. Rev. 70:453–511.
Lorente de No, R. (1934) Studies on the structure of the cerebral cortex. II.Continuation of the study of the ammonic system. J. Psychol. Neurol.46:113–177.
Mani, R.B., J.B. Lohr, and D.V. Jeste (1986) Hippocampal pyramidal cellsand aging in the human:Aquantitative study of neuronal loss in sectorsCA1 to CA4. Exp. Neurol. 94:29–40.
Mann, D.M.A. (1994) Alzheimer’s disease: Progress in pathological andaetiological aspects. Rev. Clin. Gerontol. 4:43–60.
Mann, D.M.A., P.O. Yates, and B. Marcyniuk (1984) Alzheimer’s preseniledementia, senile dementia of Alzheimer’s type and Down’s syndrome inmiddle age form an age related continuum of pathological changes.Neuropathol. Appl. Neurobiol. 10:185–207.
McKhann, G., D. Drachman, M. Folstein, R. Katzman, D. Price, and E.M.Stadlan (1984) Clinical diagnosis of Alzheimer’s disease: Report of theNINCDS-ADRDAWork Group under the auspices of the Department ofHealth and Human Services Task Force on Alzheimer’s Disease.Neurology 34:939–944.
Mirra, S.S., M.N. Hart, and R.D. Terry (1993) Making the diagnosis ofAlzheimer’s disease. Arch. Pathol. Lab. Med. 117:132–144.
Mizutani, T., and M. Kasakava (1995) Degeneration of the intrahippocam-pal routes of the perforant and alvear pathways in senile dementia ofAlzheimer type. Neurosci. Lett. 184:141–144.
Morris, R.G., andM.D. Kopelman (1986) Thememory deficits in Alzheimer-type dementia: A review. Q. J. Exp. Psychol. 38:575–602.
Pearson, R., and L. Pearson (1976) The Vertebrate Brain. London: Aca-demic Press.
Rakic, P. (1985) Limits in neurogenesis in primates. Science 227:1054–1056.
Rolls, E.T. (1991) The representation and storage of information in neuro-nal networks in the primate cerebral cortex and hippocampus. In R.Durbin, C. Miall, and G. Mitchinson (eds): The Computing Neuron.Workingham:Addison-Wesley, pp. 125–159.
Rosene, D.L., and G.W. Van Hoesen (1977) Hippocampal efferents reachwidespread areas of the cerebral cortex and amygdala in the rhesusmonkey. Science 198:315–317.
Rosene, D.L., and G.W. Van Hoesen (1987) The hippocampal formation ofthe primate brain. In E.G. Jones and A. Peters (eds): Cerebral Cortex,Vol. 6: Further Aspects of Cortical Function, Including Hippocampus.NewYork: Plenum, pp. 345–456.
Roth, M. (1986) The association of clinical and neurological findings and itsbearing on the classification and aetiology of Alzheimer’s disease. Br.Med. Bull. 42:42–50.
Sandbrink, R., T. Hartmann, C.L. Masters, and K. Beyreuther (1996) Genescontributing toAlzheimer’s disease. Mol. Psychiatr. 1:27–40.
Saper, C.B. (1985) The value of alternative morphological approaches toAlzheimer’s disease. Neurobiol. Aging 8:576–577.
Schwerdtfeger, W.K. (1984) Structure and Fiber Connections of the Hippo-campus. AComparative Study. Berlin: Springer, p. 74.
Seab, J.P., W.J. Jagust, T.S. Wong, M.S. Roos, B.R. Reed, and T.F. Budinger(1988) Quantitative NMR measurements of hippocampal atrophy inAlzheimer’s disease. Magnet. Reson. Med. 8:200–208.
Selkoe, D.J. (1982) Molecular pathology of the aging human brain. TrendsNeurosci. 5:332–336.
Selkoe, D.J. (1994) Cell biology of the amyloid beta-protein precursor andthe mechanism of Alzheimer’s disease. Annu. Rev. Cell. Biol. 10:373–403.
Stephan, H. (1975) Allocortex. In W. Bargmann (ed): Handbuch derMikroskopischen Anatomie des Menschen, Bd 4: Nervensystem, Teil 9.Berlin: Springer.
Stephan, H. (1983) Evolutionary trends in limbic structures. Neurosci.Biobehav. Rev. 7:367–374.
Stephan, H., and J. Manolescu (1980) Comparative investigations onhippocampus in insectivores and primates. Z. Mikrosk. Anat. Forsch.94:1025–1050.
Sterio, D.C. (1984) The unbiased estimation of number and sizes ofarbitrary particles using the disector. J. Microsc. 134:127–136.
Swaab, D.F., and H.B.M. Uylings (1987) Density measures: Parameters toavoid. Neurobiol. Aging 8:574–576.
Terry, R.D., and R. Katzman (1983) Senile dementia of the Alzheimer’stype: Defining a disease. In R. Katzman and R.D. Terry (eds): TheNeurology of Aging. NewYork: FADavis, pp. 51–84.
Terry, R.D., E. Masliah, D.P. Salmon, N. Butters, R. DeTeresa, R. Hill, L.Hansen, and R. Katzman (1991) Physical basis of cognitive alterationsin Alzheimer’s disease: Synapse loss is the major correlate of cognitiveimpairment. Ann. Neurol. 30:572–580.
Tomlinson, B.E. (1989) The neuropathology of Alzheimer’s disease—Issuesin need of resolution. Neuropathol. Appl. Neurobiol. 15:491–512.
Tomlinson, B.E., G. Glessed, andM. Roth (1970) Observations on the brainsof demented old people. J. Neurol. Sci. 11:205–242.
Traub, R.D., and R. Miles (1991) Neuronal Networks of the Hippocampus.Cambridge: University Press.
Ulrich, J. (1985)Alzheimer changes in nondemented patients younger thansixty-five: A possible early stage of Alzheimer’s disease and seniledementia of Alzheimer’s type. Ann. Neurol. 17:273–277.
Uylings, H.B.M., C.G. van Eden, and M.A. Hofman (1986) Morphometry ofsize/volume variables and comparison of their bivariate relations in thenervous system under different conditions. J. Neurosci. Methods 18:19–37.
Van Hoesen, G.W. (1982) The parahippocampal gyrus. New observationsregarding its cortical connections in the monkey. Trends Neurosci.5:345–350.
Van Hoesen, G.W., B.T. Hyman, andA.R. Damasio (1991) Entorhinal cortexinAlzheimer’s disease. Hippocampus 1:1–8.
West, M.J. (1993) Regionally specific loss of neurons in the aging humanhippocampus. Neurobiol. Aging 14:287–293.
West, M.J., and H.J.G. Gundersen (1990) Unbiased stereological estima-tion of the number of neurons in the human hippocampus. J. Comp.Neurol. 296:1–22.
West, M.J., P.D. Coleman, D.G. Flood, and J.C. Troncoso (1994) Differencesin the pattern of hippocampal neuronal loss in normal aging andAlzheimer’s disease. Lancet 344:769–772.
Winocur, G. (1988) A neuropsychological analysis of memory loss with age.Neurobiol. Aging 9:487–494.
Yamazaki, M., M. Hamamoto, M. Yoshimura, Y. Itoh, and T. Miyazaki(1993) An autopsy case with recent memory disturbance, characterizedby localized atrophy of parahippocampal gyrus, subiculum and amyg-dala. Rinsho Shinkeigaku 33:50–55.
Zola-Morgan, S., L.R. Squire, and D.G. Amaral (1986) Human amnesia andthe temporal lobe region: Enduring memory impairment following abilateral lesion limited to field CA1 of the hippocampus. J. Neurosci.6:2950–2967.
Zola-Morgan, S., L.R. Squire, N.L. Rempel, R.P. Clower, and D.G. Amaral(1992) Enduring memory impairment in monkeys after ischemic dam-age to the hippocampus. J. Neurosci. 12:2582–2596.
Zuckerkandl, E. (1887) Uber das Reichzentrum. Stuttgart: Enke.
HIPPOCAMPUS IN AGING AND ALZHEIMER’S DISEASE 493

APPENDIX A. FORMULAE FOR THE CECALCULATION
The CE (Ntot) for one subject is calculated by using theformula
CE(Ntot ) 5 ŒS(CE(SP))2 1 S(CE(SQ/SF))2
where
CE(oi51
n
Pi) 5Œ(3A 1 C 2 4B)/12
oi51
n
Pi
,
and
A 5 oi51
n
Pi ? Pi , B 5 oi51
n21
Pi ? Pi11, C 5 oi51
n
Pi ? Pi12,
and
CE(SQ/SF) 5ŒCE2(SQ) 1 CE2(SF) 22. ? Cov(SQ,SF)
SQ ? SF,
where CE(SQ) and CE(SF) are calculated in the samemanner as CE(SP) described above, and the covariance is
calculated by using the formula
Cov(SQ,SF) 53D 1 G 2 4E
12,
where
D 5 oi51
n
Qi ? Fi,
E 5 oi51
n Fi ? Qi11 1 Fi11 ? Qi
2
and
G 5 oi51
n Fi ? Qi12 1 Fi12 ? Qi
2
(P, number of grid points counted on each section; Q,number of the nuclei counted; F, number of the disectorframes; n, total number of sections; i, individual sections).The CE (Ntot) for the group of m subjects is calculated byusing the formula
CE(N) 5Œ1
m oj51
m
CE2(N).
For details, see Gundersen and Jensen (1987) and Westand Gundersen (1990).
494 G. SIMIC ET AL.