volume 43, number 1 january 2011 - utah
TRANSCRIPT

UTAH'S GEOLOGIC HAZARDS
January 2011Volume 43, Number 1
U T A H G E O L O G I C A L S U R V E Y
SURVEY NOTES

Over the past 12 months the UGS has had a staff turnover rate of close to 10 percent. Collectively, the outgoing staff represent a loss of over 200 years of experience. About half of these were retirements, and half were resignations. This turnover rate is more than double what has been typical for the UGS over the past 10 years. The high turnover is due to a variety of factors, but one obvious factor has influenced the retirements—that is the evolving age profile of staff geoscientists. Seven years ago the age profile for geoscientists at the UGS had a single peak between 45 and 55 years old, and two-thirds of the staff were over the age of 45. Presently, that age peak has moved seven years, and a greater number of geoscientists are considering retirement. The peak has shrunk in relative size, but the age profile suggests the increased rate of retirements will continue for another decade. A sec-ondary, younger, age peak is now showing up as replacements fill the vacancies.
Although the increased rate of retire-ments represents a loss of valuable exper-tise, it also represents opportunities for new geology graduates to join the UGS. Today’s graduates leave college with dif-ferent skill sets than what their predeces-sors had—for example, almost all have good computer skills and are GIS literate. In addition, today’s geologic challenges require a broader geoscience skill set compared to traditional geology needs several decades ago. Despite the increased rate of retirements and resignations, we have been able to fill all the openings with talented people whom we hope will stay and have productive careers with the UGS. The dominant degree for geoscientists at the UGS is a master’s degree (55 percent; 30 percent have a bachelor’s degree and 13 percent have a doctorate). This pattern is similar to other state geologi-cal surveys across the U.S., as is the age profile with a peak between 50 and 60 years old. When these two factors are consid-ered together, state geological surveys will need about 500 new master’s-level graduates over the next
decade to maintain existing staffing levels. There is national concern about what has been called the “Great Crew Change”: an aging workforce juxtaposed against an anemic supply of qualified and trained scientists and engineers (Status of the Geoscience Workforce, American Geological Institute Report, 2009). Although a “Great Crew Change” seems to have started at the UGS, we see little evidence that the supply of graduates (or experienced candidates) is affecting the quality of applicants. Indeed, the number of students enrolled in Earth science post-graduate programs at Utah’s universities is reportedly strong. It remains to be seen whether this situation will change once the economy rebounds and the private sector starts more aggressive hiring.
Design: Jeremy GleasonCover: An active landslide on the Wasatch Plateau in the Seely Creek drainage. The lower landslide averaged 14 feet of movement per year between 2004 and 2009. Photograph by Rich Giraud.
Survey Notes is published three times yearly by Utah Geological Survey, 1594 W. North Temple, Suite 3110, Salt Lake City, Utah 84116; (801) 537-3300. The Utah Geological Survey provides timely scientific information about Utah’s geologic environment, resources, and hazards. The UGS is a division of the Department of Natural Resources. Single copies of Survey Notes are distributed free of charge within the United States and reproduction is encouraged with recognition of source. Copies are available at geology.utah.gov/surveynotes. ISSN 1061-7930
The Director’s Perspective
by Richard G. Allis
ContentsLand Subsidence and Earth
Fissures in Cedar Valley .........................1Updated Landslide Maps of Utah ................4GPS Monitoring of Slow-Moving
Landslides .............................................6Liquefaction in the April 15, 2010,
M 4.5 Randolph Earthquake ..................7Glad You Asked ..........................................8Teacher’s Corner ........................................9GeoSights .................................................10Survey News ............................................11Energy News ............................................12New Publications .....................................13
StateofUtah Gary R. Herbert, Governor
DepartmentofNaturalResources Michael Styler, Executive Director
UGSBoard Kenneth Puchlik, Chair William Loughlin Jack Hamilton Tom Tripp Alisa Schofield Mark Bunnell Donald Harris Kevin Carter (Trust Lands
Administration-ex officio)
UGSStaff
Administration Richard G. Allis, Director Kimm Harty, Deputy Director John Kingsley, Associate Director Starr Losee, Secretary/Receptionist
Dianne Davis, Administrative Secretary Kathi Galusha, Accounting Officer Linda Bennett, Accounting Technician Michael Hylland, Technical Reviewer Robert Ressetar, Technical Reviewer
EditorialStaff Vicky Clarke Lori Douglas, Stevie Emerson,
Jeremy Gleason, Jay Hill
StateEnergyProgram Chris Tallackson
Denise Beaudoin, Jerriann Ernsten, Brandon Malman, Jim Levy,
Will Chatwin, Deborah Boren, Alair Emory, Alex Dalpé-Charron,
Sherry Childers, Stefan Wilson, Alex Scott
GeologicHazards Steve Bowman Richard Giraud, William Lund,
Greg McDonald, Jessica Castleton, Gregg Beukelman, Chris DuRoss, Tyler Knudsen, Corey Unger, Lisa Brown, Jim Ollerton, Barry Solomon, Adam McKean
GeologicInformationandOutreachSandra Eldredge Christine Wilkerson, Patricia Stokes, Mark Milligan, Stephanie Earls, Emily Chapman, Lance Weaver,
Gentry Hammerschmid, Jim Davis, Marshall Robinson
GeologicMapping Grant Willis Jon King, Douglas Sprinkel, Janice Hayden, J. Buck Ehler, Kent Brown, Basia Matyjasik, Don Clark, Bob Biek, Paul Kuehne
GroundWaterandPaleontology Michael Lowe
James Kirkland, Janae Wallace, Martha Hayden, Hugh Hurlow, Don DeBlieux, Kim Nay, Paul Inkenbrandt, Lucy Jordan, Kevin Thomas, Rebecca Medina, Walid Sabbah, Rich Emerson, Stefan Kirby, Scott Madsen, Toby Hooker
EnergyandMineralsDavid Tabet Robert Blackett, Craig Morgan,
Mike Laine, Jeff Quick, Taylor Boden, Thomas Chidsey, Cheryl Gustin, Tom Dempster, Brigitte Hucka, Stephanie Carney, Ammon McDonald, Ken Krahulec, Valerie Davis, Brad Wolverton, Sonja Heuscher, Mike Vanden Berg, Andrew Rupke, Mark Gwynn

In May 2009, Enoch City contacted the Utah Geological Survey (UGS) to investigate a possible “fault” that was damaging streets, sidewalks, and curbs and gutters in a new subdivision in north Enoch. During a recon-naissance investigation, the UGS found a 2.4-mile-long earth fissure that had formed in response to land subsidence caused by ground-water over-draft of the local aquifer. In the affected subdivision, the fissure crosses several undeveloped lots, and in addition to damaging streets and side-walks, vertical displacement across the fissure has reversed the flow direc-tion of a sewer line so that it is no longer possible to gravity-drain sewage effluent from the subdivision. The likely relation of the fissure to ground-water pumping was communicated to Enoch City, the Utah Division of Water Rights, Iron County, and the Central Iron County Water Conservancy District (CICWCD). The CICWCD subsequently funded the UGS to conduct a detailed investigation of the Enoch earth fissure, and to determine if land subsidence and earth fissures were affecting other areas in Cedar Valley.
Although earth fissures have been documented in the rural Escalante Desert, the discovery of the Enoch fissure is significant because it is the first one in Utah that has encroached into a develop-ing area. In other western states, land subsid-ence and earth fissures have caused hundreds of millions of dollars in damage to buildings, roads, bridges, railroads, utilities, well casings, dams, canals, and other infrastructure.
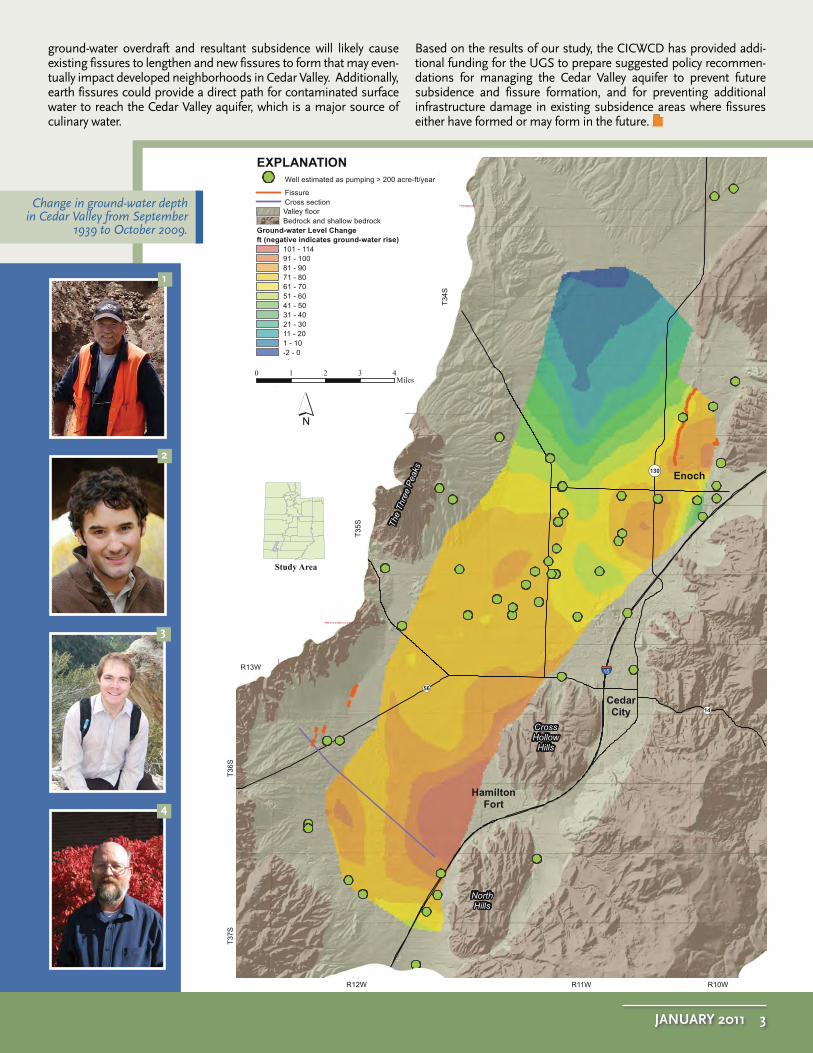
Our investigation focused on an evaluation of water-table decline and the distribution, thick-ness, and texture of basin-fill deposits in Cedar Valley—these are all critical components to land subsidence and fissure formation in the arid southwestern United States. A comparison of historical water-level data with new UGS mea-surements shows that ground-water discharge in excess of recharge since 1939 has lowered the ground-water surface in Cedar Valley by as much as 114 feet. Using nearly 300 well drillers’ logs, we produced a map and simplified cross sections of Cedar Valley’s basin-fill sediments that show a high percentage of fine-grained material (chiefly clay) that is particularly prone to compaction upon dewatering.
Vertical displacement along the Enoch-graben-west fis-sure has damaged 3-year-old asphalt-concrete pavement in the Parkview subdivision; view is to the south.
LANDSUBSIDENCEANDEARTHFISSURESINCEDARVALLEY,SOUTHWESTUTAH
Location of earth fissures in Cedar Valley. White lines are contours of approximately equal ground-surface elevation change (feet) since 1950, based on comparison of historical leveling and modern GPS data.
by William Lund, Tyler Knudsen, Paul Inkenbrandt, and Mike Lowe
JANUARY2011 1

High-precision Global Positioning System (GPS) surveying of benchmark elevations indicates that more than 110 square miles of the ground surface in Cedar Valley has subsided as much as 4 feet since 1950. In response to the land subsidence, at least 3.9 miles (total length) of earth fissures have formed in the western and north-eastern parts of Cedar Valley. The Enoch-graben-west earth fissure is the longest (2.4 miles) fissure, and is the only fissure that exhibits vertical displacement. Significant fissure-related damage in Cedar Valley is currently limited to the partially developed Parkview subdi-vision in Enoch City; however, to the north the Enoch-graben-west fissure also trends through and has displaced the ground surface in a heavily used livestock pasture/feeding area creating a poten-tial for ground-water contamination. Aerial photographs show that the Enoch-graben-west fissure began forming more than 50 years ago, and that the fissure grew approximately 900 feet to the south between 1997 and 2006. The main developed area of Enoch City lies approximately 1000 feet south of the current fissure tip. Addi-
tionally, linear features of unknown origin observed on aerial photos and the presence of an isolated sinkhole south of State Route 56 are generally along trend with the earth fissures west of Quichapa Lake, and may indicate the possibility of a more extensive zone of fissuring on the west side of Cedar Valley.
Our investigation results show that the maximum amount of land subsidence and earth fissure formation in Cedar Valley coincide with areas of significant ground-water-level decline and the presence of compressible fine-grained sediment in the subsurface. We conclude that long-term ground-water pumping in excess of recharge is the cause of the land subsidence and earth fissures in Cedar Valley. If ground-water levels in Cedar Valley continue to decline 3 feet per year (current average rate of decline), average basin-wide subsidence will likely continue at a rate of 0.04 to 2.4 inches per year. Continued
Tyler Knudsen is a Project Geologist with the UGS Geologic Hazards Program. He has a B.S. degree in Geology from the University of Utah and an M.S. degree in Geol-ogy from the University of Nevada, Las Vegas. Since joining the UGS in 2006, Tyler's work has focused on geologic-hazard mapping and paleoseismic studies in southwestern Utah.
WilliamLund has 38 years of experience as an engineering geologist—7 years with geotechnical consulting firms in Arizona, California, and Oregon, and 31 years with the UGS. He is a former deputy director of the UGS, presently is the Geologic Hazards Program Senior Scientist, and is manager of the UGS’ Southern Regional Office in Cedar City. He is a Licensed Professional Geologist in Utah, Registered Geologist in Arizona, and Certified Engineering Geologist in Oregon, and is a past president of the Intermountain Section of the Association of Engineering Geologists, Utah Geological Association, and Dixie Geological Society.
Paul Inkenbrandt graduated from the University of Southern Indiana with a B.S. degree in Geology in 2005. He went on to work for the Kentucky Geologi-cal Survey for a year, and then moved to Utah to attain an M.S. degree in Geology from Utah State University. He completed his thesis on Cache Valley aqui-fers in fall 2010. He has been with the UGS Ground-Water and Paleontology Program since September 2009.
Mike Lowe has been with the UGS since 1989 and has been involved with geologic-mapping projects, geologic-hazard assessments, and ground-water investigations. He is currently manager of the Ground-Water and Paleontology Program. Prior to joining the UGS, he worked as a well-site geologist in the petroleum industry in Texas from 1981 to 1982, and was County Geologist for Davis and Weber Counties from 1985 to 1989.
ABOUTTHEAUTHORS
Schematic cross section showing water wells and the distribution of fine-grained sediments across southern Cedar Valley; see map of change in ground-water depth for location of cross section.
432
1
2 SURVEYNOTES
!(
!(
!(
!(
!(
!(
!(
!(!(
!(
!(
!(
!(
!(!(
!(!(
!(!(
!(
!(
!(
!(
!(
!(
!(
!(
!( !(
!(
!(
!(
!(
!(
!(
!(
!(
!(
!(
!(!(
!(
!(
!(
!(
!(
!(
!( !(
!(
!(
!(
Enoch
HamiltonFort
CedarCity !(14
!(56
!(130
EXPLANATION!( Well estimated as pumping > 200 acre-ft/year
FissureCross sectionValley floorBedrock and shallow bedrock
Ground-water Level Changeft (negative indicates ground-water rise)
101 - 11491 - 10081 - 9071 - 8061 - 7051 - 6041 - 5031 - 4021 - 3011 - 201 - 10-2 - 0
T36S
T37S
T35S
T34S
R13W
R12W R11W R10W
0 1 2 3 4Miles
Study Area
§̈¦15
´
CrossHollow
Hills
NorthHills
The
Thre
e Pe
aks
!(
!(
!(
!(
!(
!(
!(
!(!(
!(
!(
!(
!(
!(!(
!(!(
!(!(
!(
!(
!(
!(
!(
!(
!(
!(
!( !(
!(
!(
!(
!(
!(
!(
!(
!(
!(
!(
!(!(
!(
!(
!(
!(
!(
!(
!( !(
!(
!(
!(
Enoch
HamiltonFort
CedarCity !(14
!(56
!(130
EXPLANATION!( Well estimated as pumping > 200 acre-ft/year
FissureCross sectionValley floorBedrock and shallow bedrock
Ground-water Level Changeft (negative indicates ground-water rise)
101 - 11491 - 10081 - 9071 - 8061 - 7051 - 6041 - 5031 - 4021 - 3011 - 201 - 10-2 - 0
T36S
T37S
T35S
T34S
R13W
R12W R11W R10W
0 1 2 3 4Miles
Study Area
§̈¦15
´
CrossHollow
Hills
NorthHills
The
Thre
e Pe
aks
4
3
2
1
ground-water overdraft and resultant subsidence will likely cause existing fissures to lengthen and new fissures to form that may even-tually impact developed neighborhoods in Cedar Valley. Additionally, earth fissures could provide a direct path for contaminated surface water to reach the Cedar Valley aquifer, which is a major source of culinary water.
Based on the results of our study, the CICWCD has provided addi-tional funding for the UGS to prepare suggested policy recommen-dations for managing the Cedar Valley aquifer to prevent future subsidence and fissure formation, and for preventing additional infrastructure damage in existing subsidence areas where fissures either have formed or may form in the future.
Change in ground-water depth in Cedar Valley from September
1939 to October 2009.
JANUARY2011 3

UPDATEDLANDSLIDEMAPSOFUTAH
by Ashley H. Elliott and Kimm M. Harty
Significant economic losses are associ-ated with landslides, and Utah contains numerous landslides and landslide-prone geologic units. In the early 1980s and mid-2000s, above-normal precipitation resulted in many landslides that caused millions of dollars in losses. Many land-slides in Utah result from the reactiva-tion of pre-existing landslides, hillslope modifications of landslide-prone geo-logic units, and natural gravity-related downslope earth movements. Exposure to landslide hazards only increases as development expands onto hillslopes, onto alluvial fans at the mouths of flood-prone canyons, and into other landslide-prone areas.
To increase awareness of the land-slide hazard in Utah, the Utah Geologi-cal Survey (UGS) in 1991
published a statewide
map and database compila-tion of landslides using pre-1989
published and unpublished sources. Since then, many new geologic maps and updated studies have been published that show additional landslide locations. In an effort to incorporate this new infor-mation and improve the understand-ing of landslides and their distribution throughout Utah, we created an updated version of the landslide maps and data-base using a geographic information system (GIS). The updated information is available in GIS format as well as PDF format and depicts 46 topographic land-slide maps at a scale of 1:100,000 (1 inch = 1.6 miles). The new maps add land-slide data documented in 240 geologic maps and internal UGS landslide inves-tigations completed between 1989 and mid-2007. These new data allowed us
to refine some of the existing landslide boundaries and add approximately 12,000 to the approximately 10,000 previously documented.
The maps and asso-ciated GIS data provide a way to identify the loca-tion and extent of previous landslid-ing. The more than 22,000 land-slides depicted on the maps cover
more than 5 percent of Utah. The maps show various types of landslides includ-ing generally deep-seated, slow-moving landslides (such as rotational and trans-lational slides); fast-moving, generally shallow landslides (debris flows and slides); earthquake-induced landslides (lateral spreads and flows); and land-slides undifferentiated from other Qua-ternary deposits (such as talus, colluvial, and rock-fall deposits). In addition, the GIS data provide more-specific landslide attribute information including depth of landslide deposit, type of material, type of movement, historical landslide events, landslide-prone geologic units, possible movement causes, and original map ref-erences.
Local jurisdictions, developers, geotech-nical consultants, the general public, and others interested in landslides can use the landslide maps and database to identify potential landslide hazards and the need for site-specific geologic-hazard and geotechnical investigations in areas of proposed development. Although proper planning and avoidance of land-slide-prone areas are usually the best ways to reduce landslide-related losses, avoidance is not always possible. Where avoidance is not possible, site-specific geologic-hazard and geotechnical inves-tigations can identify engineering tech-niques that may be used to stabilize slopes or reduce the impacts from land-slides.
The updated Landslide Maps of Utah (2010, by A.H. Elliot and K.M. Harty) are available on DVD as Utah Geological Survey Map 246DM.
cal Survey (UGS) in 1991 existing landslide boundaries and add approximately 12,000 to the approximately 10,000 previously documented.
The maps and associated GIS data provide a way to identify the location and extent of previous landsliding. The more than 22,000 landslides depicted on the maps cover
Examples of damage caused by landsliding in the mid-2000s. A guest house destroyed by a 2005 rock fall in Provo (above) and damage to a house in South Weber caused by a rapidly moving landslide in 2006 (left).
4 SURVEYNOTES

Deep or unclassified landslide – Generally 10 feet (3 m) thick or more and shows characteristic landslide morphology. May include areas where landslide density is too great to show individual landslides separately.
Landslide undifferentiated from talus and/or colluvial deposits – May include deep or shallow landslides mapped with talus and/or colluvial deposits.
Landslide and/or landslide undifferentiated from talus, colluvial, rock-fall, glacial, and soil-creep deposits – May include deep or shallow landslides mapped with talus, colluvial, rock-fall, glacial, and/or soil-creep deposits; primarily mapped and compiled by Roger B. Colton, U.S. Geo-logical Survey.
Not classified – Includes areas not mapped in the original studies compiled for this map, as well as mapped areas with no identified landsliding.
Landslide maps for the northwestern portion of the Kanab 30' x 60' quadrangle as depicted in the earlier UGS compilation (below) and the updated compilation (right). The updated map shows added landslides and redefined landslide boundaries based on new information.
ForadditionalinformationonlandslidesinUtah,refertothefollowingUGSpublications:
Case, W.F., 2001, Landslides – what they are, why they occur: Utah Geological Survey Public Information Series 74, available online at geology.utah.gov/online/pdf/pi-74.pdf.
Christenson, G.E., and Ashland, F.X., 2007, A plan to reduce losses from geologic hazards in Utah – recommendations of the Governor’s Geologic Hazards Working Group 2006-2007: Utah Geological Survey Circular 104, 30 p.
Giraud, R.E., and Shaw, L.M., 2007, Landslide susceptibility map of Utah: Utah Geologi-cal Survey Map 228DM, 11 p., 1 plate, scale 1:500,000.
Utah Geological Survey, 1998, Homeowner’s guide to recognizing and reducing landslide damage on their property: Utah Geological Survey Public Information Series 58, available online at geology.utah.gov/online_html/pi/pi-58/index.htm.
JANUARY2011 5
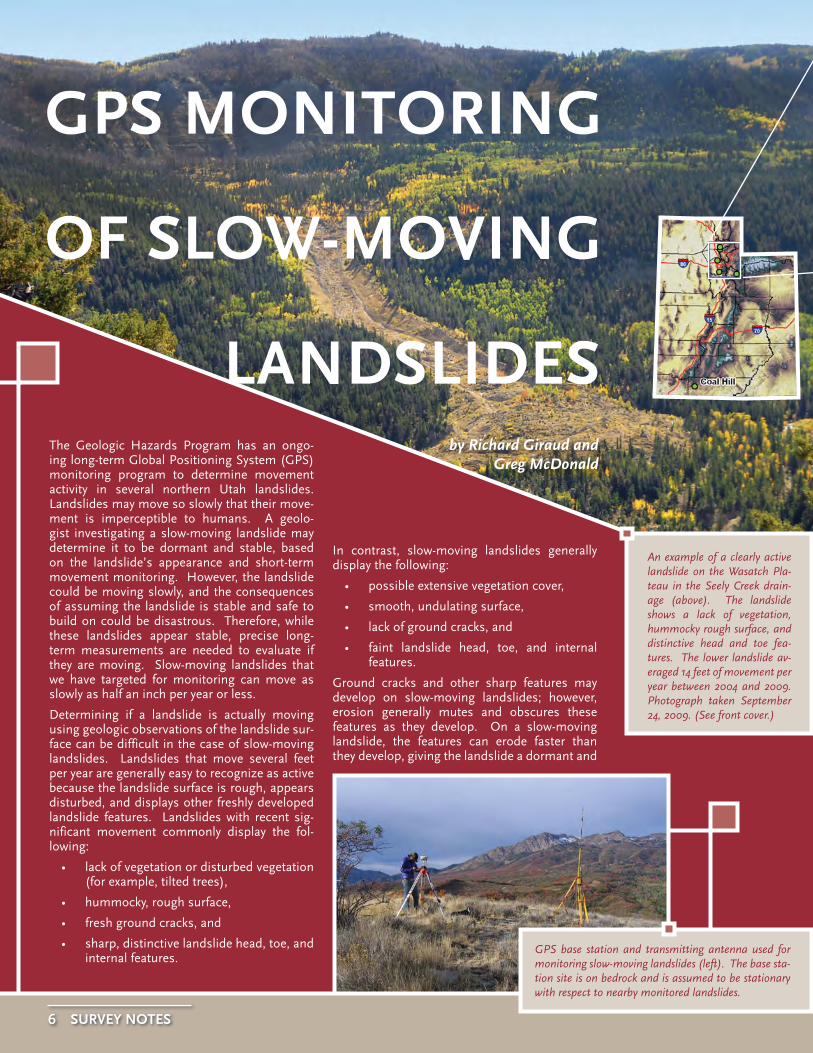
The Geologic Hazards Program has an ongo-ing long-term Global Positioning System (GPS) monitoring program to determine movement activity in several northern Utah landslides. Landslides may move so slowly that their move-ment is imperceptible to humans. A geolo-gist investigating a slow-moving landslide may determine it to be dormant and stable, based on the landslide’s appearance and short-term movement monitoring. However, the landslide could be moving slowly, and the consequences of assuming the landslide is stable and safe to build on could be disastrous. Therefore, while these landslides appear stable, precise long-term measurements are needed to evaluate if they are moving. Slow-moving landslides that we have targeted for monitoring can move as slowly as half an inch per year or less.
Determining if a landslide is actually moving using geologic observations of the landslide sur-face can be difficult in the case of slow-moving landslides. Landslides that move several feet per year are generally easy to recognize as active because the landslide surface is rough, appears disturbed, and displays other freshly developed landslide features. Landslides with recent sig-nificant movement commonly display the fol-lowing:
• lack of vegetation or disturbed vegetation (for example, tilted trees),
• hummocky, rough surface,
• fresh ground cracks, and
• sharp, distinctive landslide head, toe, and internal features.
In contrast, slow-moving landslides generally display the following:
• possible extensive vegetation cover,
• smooth, undulating surface,
• lack of ground cracks, and
• faint landslide head, toe, and internal features.
Ground cracks and other sharp features may develop on slow-moving landslides; however, erosion generally mutes and obscures these features as they develop. On a slow-moving landslide, the features can erode faster than they develop, giving the landslide a dormant and
by Richard Giraud and Greg McDonald
LANDSLIDES
GPSMONITORING
OFSLOW-MOVING
An example of a clearly active landslide on the Wasatch Pla-teau in the Seely Creek drain-age (above). The landslide shows a lack of vegetation, hummocky rough surface, and distinctive head and toe fea-tures. The lower landslide av-eraged 14 feet of movement per year between 2004 and 2009. Photograph taken September 24, 2009. (See front cover.)
GPS base station and transmitting antenna used for monitoring slow-moving landslides (left). The base sta-tion site is on bedrock and is assumed to be stationary with respect to nearby monitored landslides.
6 SURVEYNOTES

stable appearance when the landslide is actually unstable and moving slowly.
One method of determining slow rates of landslide movement is with a survey-grade GPS instrument that uses infor-mation broadcast by a satellite network to accurately determine the location of points on the landslide within approxi-mately 0.5 inch horizontal and 2 inches vertical. GPS monitoring involves remeasuring the points on the land-slide surface over time. Depend-ing on annual precipitation, several years of monitoring may be needed to identify movement. Our monitor-ing program includes collecting GPS measurements once a year unless sig-nificant movement is detected; in that case, measurement frequency may be increased to collect additional data while the landslide is moving. Land-slides rarely move uniformly along their entire length, so repeated moni-toring of points distributed through-out the entire landslide is necessary to identify movement and plot its distri-bution. Additional monitoring points are needed outside the landslide to determine landslide boundaries.
Our main goal is to detect repeated landslide movement over a period of several years in landslides that appear to be dormant or slow moving. If movement is detected, our monitoring program can be refined to determine if the landslide moves continuously throughout the year or seasonally (gen-erally during the spring). Movement patterns can then be compared with records of precipitation and ground-water levels to see what associations may exist. Other studies have shown that periods of above-normal precipita-tion and high ground-water levels com-monly trigger landslide movement.
Multiple measurements also provide movement rates and direction for dis-tinct survey points on a landslide. A history of landslide movement aids in anticipating future landslide move-ment, managing landslide movement problems, and providing information to aid subsequent landslide investiga-tion.
The Geologic Hazards Program cur-rently monitors several slow-moving or potentially slow-moving landslides in northern Utah. Site selection for monitoring is based on nearby urban development, risk, and available moni-toring resources. The following land-slides are currently monitored:
• Green Pond and Bear Wallow, Snowbasin Road, State Route 226, Weber and Morgan Counties.
• Creekside Drive, Mountain Green, Morgan County.
• Springhill Drive, North Salt Lake, Davis County (example of a slow-moving landslide in a subdivision).
• Potato Hill and Little Valley, Draper, Salt Lake County.
• Unnamed landslide near Mill Hollow Reservoir, Wasatch County.
• Coal Hill, east of Zion National Park, State Route 9, Kane County.
Monitoring results for the Spring-hill Drive landslide are available at geology.utah.gov/utahgeo/hazards/landslide/springhill09/index.htm. Additional information on landslides in Utah is available at geology.utah.gov/ghp/index.htm.
The Bear Wallow landslide complex near Snowbasin (left) is an example of a slow-moving landslide, show-ing vegetation cover and a smooth undulating landslide surface. Parts of some internal landslides within the complex have moved as rapidly as 8 inches per year, but most monitored points move 1 inch or less per year. Photograph taken December 3, 2009.
The UGS conducted a brief field reconnaissance following the April 15, 2010, magnitude (M) 4.5 Randolph earthquake, which occurred about 6 miles northeast of Randolph near the base of the Crawford Mountains in northern Utah. The Randolph earthquake was unusual in that it generated liquefaction (rare for M <5), includ-ing sand boils (eruptions of liquefied sand) along the Bear River about a half mile west of the earthquake epicenter. The earthquake is thus one of the smallest recorded with modern instrumentation to generate liquefaction. We attribute the occurrence of liquefaction to highly susceptible sediments very near the epicenter; however, anomalously high ground motions may have also contributed to the liquefaction.
LIQUEFACTION IN THE APRIL 15, 2010, M 4.5 RANDOLPH
EARTHQUAKEby Chris DuRoss
Sand boils (eruptions of liquefied sand) formed along the Bear River during the April 15, 2010, Randolph earth-
quake. Scale card is about 6.5 inches long.
JANUARY2011 7

Plants can enlighten geologists as to the rock beneath. Geobotany, also called phytogeography, is the scientific study of the distribution of plants. Climate is con-sidered the primary control on plant life, but within a particular climatic region the rock beneath soil—known as the parent material of soil—is typically the key factor influencing the vegetation growing above. Rock ultimately determines soil moisture characteristics, nutrient avail-ability, and concentrations of essential elements. Therefore, certain plants are associated with specific rock types. Limestone, dolomite, shale, gypsum, chert, gabbro, rock salt, and ultramafic rocks (e.g., dunite, peridotite, serpenti-nite), for example, are known for their distinctive floras. Since before the advent of agriculture humans have used plants as a guide to find sought-after rocks and minerals. Today, the methodologies of geobotany are still applicable, practical, and even cost-effective to the geologist.
Dramatic changes in vegetation can occur with changes in geology. In mountain ranges of the Great Basin, big sagebrush growing on sandstone abruptly transi-tions to bristlecone pine on dolomite. The distribution of the California poppy in Arizona closely correlates with copper mineralization, which in turn corre-sponds with fault lines. In Utah, many of the state’s endemic plant species (those found nowhere else on Earth) are restricted to growing on a single geologic unit—the Green River, Moenkopi, Navajo, Mancos, and Chinle Formations
each claim several endemic species. In the Uinta Basin, Graham’s beardtongue is found only on sparsely vegetated expo-sures of the upper Green River Formation oil shale deposits. Graham’s beardtongue could come under increasing threat in the future due to loss of habitat from oil and gas exploration, drilling, and tar sand and oil shale mining, and consequently has been proposed for a threatened status listing under the Endangered Species Act.
The use of plants to find ore bodies is called geobotanical prospecting. It has been effective in locating mineral deposits worldwide, such as tin and tungsten in England; nickel, cobalt, and iron in Russia; copper and silver in Montana; bitumen in California and by the Caspian Sea; and copper and nickel in central and southern Africa. There are three commonly applied methods in geobotan-ical prospecting: (1) mapping of indicator plants, (2) assessing plant appearance and physiology, and (3) chemical testing of plants known to accumulate specific elements.
Indicator Plant Mapping
Indicator plant species mark sites that are likely enriched in a particular element or mineral. Usually these places are toxic or intolerable for other plant species, elimi-nating any competition. Here in Utah, prince’s plume grows in selenium- and calcium-rich soil; tufted evening-prim-rose, onion, wild buckwheat in calcium- and sulfur-rich soil; and desert trumpet grows in gypsiferous soil.
In southeastern Utah on the Colorado Plateau, geologist Helen Cannon in the 1940s and 1950s pioneered the use of
plants as a tool for prospecting carnotite, a radioactive uranium ore. Cannon con-firmed that Astragalus species (including milk-vetch and locoweed) pinpoint areas of selenium-rich uranium ore. Cannon also documented 50 other plants on the plateau associated with mineralized ground.
For half a century, aerial photo interpreta-tion has been used as a tool for locating indicator plants, anomalous vegetation patterns, and evaluating plant health. Indicator plant mapping has gained a powerful tool in the past few decades with remote sensing, or the imaging of Earth via satellite. Remote sensing uses parts of the electromagnetic spectrum, such as infrared or ultraviolet light, to detect plant species otherwise undetect-able when just the visible-light spectrum is examined. These plants are then used to glean clues about an area’s geology. Because so much of Earth’s bedrock is covered by vegetation, interpreting the flora from imagery derived from remote sensing has been an increasingly impor-tant technique in geologic mapping.
Desert trumpet (Eriogonum inflatum), above, on the Colorado Plateau, June 1949. Desert trumpet is an indicator plant for sulfur-rich soils and gypsiferous ore deposits. Photo by Helen Cannon, courtesy of the U.S. Geological Survey.
Prince's plume (Stanleya pinnata), below, tolerates highly mineralized soil and indicates selenium and sulfur-rich soils, and gypsum deposits. Photo courtesy of Wayne Padgett, Bureau of Land Management.
by Jim Davis
Glad You AskedWhat are the Roots of Geobotany?
Graham's beardtongue (Penstemon grahamii) is endemic to Utah's Uinta Basin and the adjacent Piceance Basin of Colorado. It grows only on the upper Green River Formation. Photo courtesy of Michael Vanden Berg.
8 SURVEYNOTES

Plant Appearance and Physiology
Plants exhibiting symptoms of toxicity, stunted growth, or a difference in flower or leaf color can also implicate poten-tial mineral deposits. A strange and amazing example is the western spider-wort: blue stamens in its flowers change to a pink color when radiation is present in the environment. Iron, manganese, zinc, phosphorus, calcium, and copper at certain concentrations can produce chlo-rosis in plants—a yellowing of the leaves due to hindrance of the photosynthetic process. Serpentine-derived soils contain toxic metals such as nickel, chromium, and cobalt, and also lack nutrients, such as calcium, potassium, phosphorus and nitrogen, producing widely spaced and stunted plants, a condition referred to as serpentine syndrome.
Chemical Testing
The most common geobotanical method, chemical testing of plants, is called biogeochemical prospecting. Some metal-loving plants, known as hyperaccumu-lators, can have extraordinarily high metallic element concentrations when growing above ore bodies. For example, zinc builds up in the tissues of aspen, common yarrow, and mouse ear cress. The mouse ear cress, found in the central Wasatch Range, Oquirrh Mountains, and Stansbury Island, has been known to grow on old sacks of zinc oxide and can contain around 120 pounds of zinc per
ton of plant ash. Locations having high levels of particular elements in plants may be considered prime candidates for further, more in-depth mineral explo-ration. Big sagebrush and four-wing saltbush have been used as indicator plants for gold. Sagebrush does not directly absorb gold, but rather arsenic and antimony in its twigs and stems, elements linked with Carlin-type gold deposits (microscopic particles not recov-erable by panning). Similarly, on the Colorado Plateau, juniper and saltbush branch tips concentrate uranium; deep roots enable detection of ore bodies as much as 70 feet below the surface.
Recommended Web sites:
Digital Atlas of the Vascular Plants of Utah: earth.gis.usu.edu/plants/
USDA Plants Database: plants.usda.gov/
Tufted evening-primrose (Oenothera caespitosa), left, is a common associate of uranium-indicator plants and occurs in calcium-rich soil. Photo courtesy of Wayne Padgett, Bureau of Land Management.
Thompson's locoweed (Astragalus thompsonae), right, growing above uranium-rich ore deposits on the Colorado Plateau, was one of the indicator plants Cannon identified in her pioneering studies in geo-botany. Photo by Helen Cannon, courtesy of the U.S. Geological Survey.
Last October, 770 students from schools up and down the Wasatch Front descended on the UGS to celebrate Earth Science Week. School classes, some having as many as 100 students, were divided into five groups, which then rotated through five 15-minute activity stations. The activities included panning for "gold," observing stream erosion and deposition, identifying rocks and min-erals, and learning about dinosaur fossils.
Thanks to the volunteers from various agencies and organizations, the week was a resounding success. We were pleased to see participants gain a better under-standing and appreciation for the Earth sciences, which has been the mission of Earth Science Week since its inception in 1998 by the American Geological Insti-tute. The methods we use to accomplish this mission—engaging students in discovering the Earth sciences, reminding people that Earth science is all around us, and motivating geoscientists to share their knowledge and enthusiasm about the Earth—appear to be effective!
Teacher’s CornerEarth Science Week 2010
Locoweed (Astragalus sp.) in bloom on the Colorado Plateau. Photo courtesy of Wayne Padgett, Bureau of Land Management.
JANUARY2011 9

By Mark Milligan
GeologicInformation:
The Devil seems to have inspired many geographic place names. According to the U.S. Board on Geographic Names, 34 geographic features bear the name Devils Kitchen, and three of them are found in Utah. The Devils Kitchen that is the subject of this “GeoSights” article is a relatively small (about 700 feet across) south-facing amphitheater exposing red-rock hoodoos at the head of Red Creek in the Wasatch Range, about 14 road miles northeast of the town of Nephi in Juab County.
About 60 to 70 million years ago the rock at Devils Kitchen was gravel, sand, and mud deposited by streams flow-ing out of a now-long-gone mountain range. Continuing deposition resulted in deep burial which, coupled with deep time, compressed and cemented the sedi-ment, transforming it into rock. Begin-ning roughly 17 million years ago, move-ment of the Wasatch fault slowly uplifted the Wasatch Range, with Devils Kitchen along for the ride. The rise of the Wasatch Range empowered erosion to excavate and expose the rock we see today.
Conglomerate, sandstone, and mudstone are the dominant rock types at Devils Kitchen. Overall these rocks are relatively
soft and erode easily, but not too easily or nothing more than rounded muddy hills would remain. The conglomerate and sandstone are locally resistant enough to protect the underlying and interbedded mudstone, allowing for near-vertical cliff faces.
Howtogetthere:
Devils Kitchen is on the Nebo Loop National Scenic Byway in the southern Wasatch Range. The byway is closed to automobiles during the winter months, when it is groomed for snowmobilers, snowshoers, and cross-country skiers.
From the south, take I-15 to exit 225 (Utah State Highway 132) in Nephi. Go east (right) on Highway 132 for 4.7 miles, then turn left onto the Nebo Loop National Scenic Byway (Forest Service Road 048/ Salt Creek Canyon Road). Devils Kitchen is another 8.7 miles north on the byway, which ends in Payson.
From the north take I-15 to exit 250 (Main Street/ Utah State Highway 115) in Payson. Go south (left) on Main Street for 0.8 mile, then turn left onto 100 North. Stay on 100 North for 0.5 mile, then turn right onto 600 East, which becomes South Payson Canyon Road, which in turn becomes the Nebo Loop National Scenic Byway. Devils Kitchen is approximately 28.5 miles from the intersection of 100 North and 600 East. Past Devils Kitchen, the byway con-tinues to Highway 132 near Nephi.
Devils Kitchen is best seen from an over-look platform located about 200 yards south of the roadside parking lot, at the end of a paved and wheelchair-accessible trail.
Devils Kitchen, Juab County, Utah G
eoSi
gh
ts
Geology and weather conspired to carve Devils Kitchen. A grid of vertical fractures (called “joints”) creates zones of weakness within the horizontal beds of conglomerate and sandstone (A). These joints form conduits for the infiltration of surface and ground water, which enhances weathering along the joints. Weathering is further enhanced by the area’s harsh winter climate, which produces freeze-thaw cycles that act to break apart the rock. The broken rock is then washed away by snow melt and rain. This process of weathering and erosion continues to widen the joints, eventually leaving remnant fins (B) and hoodoos (C). Weathering and erosion continue to excavate and carve new sculptures and will eventually destroy the old ones. Illustration from Shadows of Time—the Geology of Bryce Canyon National Park by Frank DeCourten, 1994.
With its red hoodoos, Devils Kitchen looks a bit like a miniature Bryce Canyon. The mineral hematite (iron oxide) creates the red color.
10 SURVEYNOTES
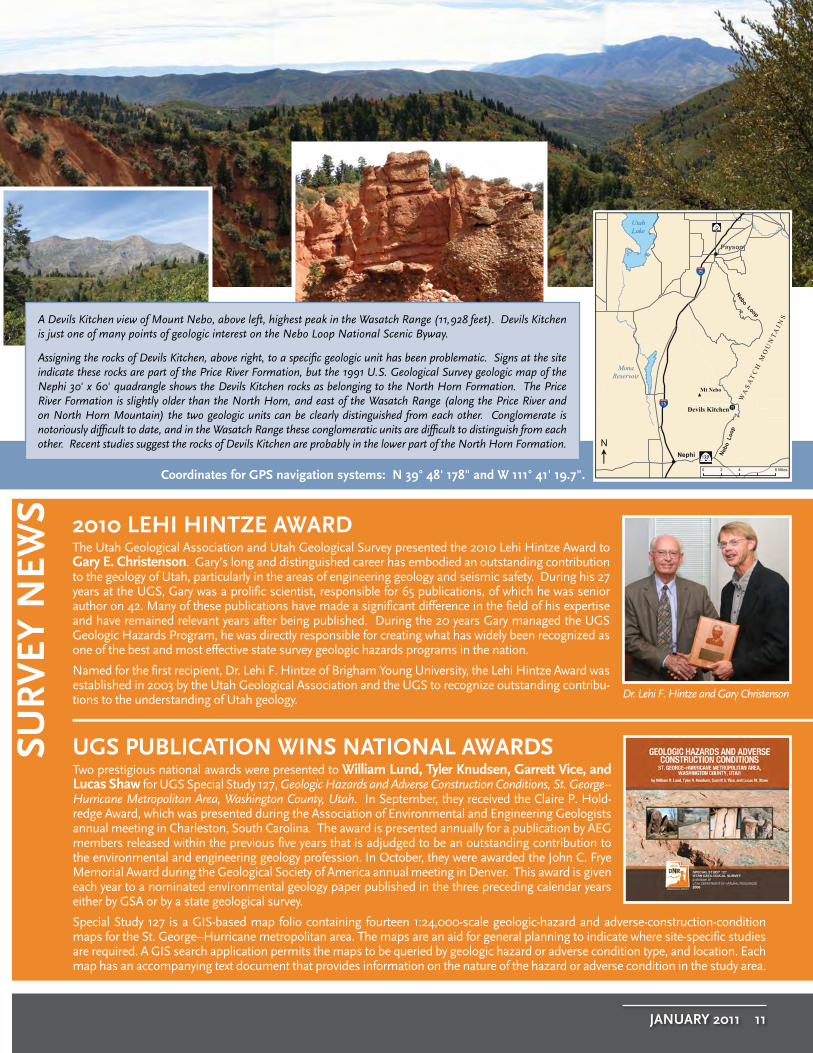
CoordinatesforGPSnavigationsystems:N39°48'178"andW111°41'19.7".
A Devils Kitchen view of Mount Nebo, above left, highest peak in the Wasatch Range (11,928 feet). Devils Kitchen is just one of many points of geologic interest on the Nebo Loop National Scenic Byway.
Assigning the rocks of Devils Kitchen, above right, to a specific geologic unit has been problematic. Signs at the site indicate these rocks are part of the Price River Formation, but the 1991 U.S. Geological Survey geologic map of the Nephi 30' x 60' quadrangle shows the Devils Kitchen rocks as belonging to the North Horn Formation. The Price River Formation is slightly older than the North Horn, and east of the Wasatch Range (along the Price River and on North Horn Mountain) the two geologic units can be clearly distinguished from each other. Conglomerate is notoriously difficult to date, and in the Wasatch Range these conglomeratic units are difficult to distinguish from each other. Recent studies suggest the rocks of Devils Kitchen are probably in the lower part of the North Horn Formation.
The Utah Geological Association and Utah Geological Survey presented the 2010 Lehi Hintze Award to GaryE.Christenson. Gary’s long and distinguished career has embodied an outstanding contribution to the geology of Utah, particularly in the areas of engineering geology and seismic safety. During his 27 years at the UGS, Gary was a prolific scientist, responsible for 65 publications, of which he was senior author on 42. Many of these publications have made a significant difference in the field of his expertise and have remained relevant years after being published. During the 20 years Gary managed the UGS Geologic Hazards Program, he was directly responsible for creating what has widely been recognized as one of the best and most effective state survey geologic hazards programs in the nation.
Named for the first recipient, Dr. Lehi F. Hintze of Brigham Young University, the Lehi Hintze Award was established in 2003 by the Utah Geological Association and the UGS to recognize outstanding contribu-tions to the understanding of Utah geology.
2010LEHIHINTZEAWARD
UGSPUBLICATIONWINSNATIONALAWARDSSUR
VEY
NEW
S
Two prestigious national awards were presented to WilliamLund,TylerKnudsen,GarrettVice,andLucasShaw for UGS Special Study 127, Geologic Hazards and Adverse Construction Conditions, St. George–Hurricane Metropolitan Area, Washington County, Utah. In September, they received the Claire P. Hold-redge Award, which was presented during the Association of Environmental and Engineering Geologists annual meeting in Charleston, South Carolina. The award is presented annually for a publication by AEG members released within the previous five years that is adjudged to be an outstanding contribution to the environmental and engineering geology profession. In October, they were awarded the John C. Frye Memorial Award during the Geological Society of America annual meeting in Denver. This award is given each year to a nominated environmental geology paper published in the three preceding calendar years either by GSA or by a state geological survey.
Special Study 127 is a GIS-based map folio containing fourteen 1:24,000-scale geologic-hazard and adverse-construction-condition maps for the St. George–Hurricane metropolitan area. The maps are an aid for general planning to indicate where site-specific studies are required. A GIS search application permits the maps to be queried by geologic hazard or adverse condition type, and location. Each map has an accompanying text document that provides information on the nature of the hazard or adverse condition in the study area.
Payson
Nephi
●
●
Nebo Loop
Mt Nebo▲
WA
SA
TC
H M
OU
NTA
I NS
lN
Nebo
Loo
p
UtahLake
MonaReservoir
öDevils Kitchen
0 4 82 Miles
Payson
Nephi
●
●
Nebo Loop
Mt Nebo▲
WA
SA
TC
H M
OU
NTA
I NS
lN
Nebo
Loo
p
UtahLake
MonaReservoir
öDevils Kitchen
0 4 82 Miles
Payson
Nephi
●
●
Nebo Loop
Mt Nebo▲
WA
SA
TC
H M
OU
NTA
I NS
lN
Nebo
Loo
p
UtahLake
MonaReservoir
öDevils Kitchen
0 4 82 Miles
Dr. Lehi F. Hintze and Gary Christenson
JANUARY2011 11

September 2010 saw a number of transitions for the Utah State Energy Program (USEP). Most significant was a change in lead-ership. Jason Berry, who led the USEP for three years, accepted a position as Residental Energy Efficiency Program Manager at PacifiCorp/Rocky Mountain Power. Jason was the primary archi-tect of an unprecedented array of USEP programs initiated in 2009 with $45 million in American Recovery and Reinvestment Act (ARRA) funding from the U.S. Department of Energy (DOE). As the current manager of the USEP, I appreciate Jason’s vision and efforts which have immensely accelerated the pace, direc-tion, and awareness of energy efficiency and renewable energy issues and progress in Utah. The impact of these programs was recently cited by the American Council for an Energy Efficient Economy (ACEEE) in its 2010 State Energy Efficiency Score-card report. In October, the ACEEE recognized Utah as a state “moving ahead strongly on energy efficiency,” improving from a rank of 23rd to 12th among 51 states and territories monitored by the ACEEE (source: www.aceee.org/sector/state-policy/score-card).
September also marked the USEP’s compliance with a DOE deadline to have $45 million in ARRA funds obligated, or under contract, for all programs funded under the ARRA. The ARRA-focused efforts of the USEP now shift to the assistance and supervision of sub-awardees as they execute these contracts, cre-ating jobs and delivering measureable results related to energy. The organizational impact of these ARRA programs is reflected in the expansion of USEP staff from four to thirteen employees who are administering ARRA-funded programs in addition to the USEP’s ongoing programs. A new position was assigned to Jer-riann Ernsten, ARRA Programs Manager, to coordinate the staff efforts toward helping towns and contractors stay in compli-ance with federal law as they move forward implementing a wide array of projects related to energy efficiency improvement and renewable energy. The entire USEP staff has rapidly expanded its knowledge base beyond energy issues and policy to understand-ing how to demonstrate compliance with federal laws regarding
fair wages, historic preservation, environmental protection, and use of American-made goods. Because all ARRA funds must be used by October 2012, the learning curve has been extremely steep for all parties, including the DOE.
The decision by the DOE to expand the role of state energy offices (SEOs) to include job creation represents a bold and historic challenge. The DOE has traditionally contracted directly with contractors to develop energy projects and programs. The choice by the DOE to delegate or decentralize energy invest-ments to states makes sense because the best energy project in one area may differ greatly from the best energy project in another town or business. For example, one organization may benefit most from an energy retrofit of a city hall, while another may benefit from the addition of a solar electric or hot water system. To successfully deploy the scope of ARRA funding, SEOs must develop relationships and partnerships outside the set of organizations and projects the state traditionally supported. Managing projects that stimulate job creation and progress in energy savings through this local approach is much more com-plex than relying on huge public works projects. However, it is respectful of local preference and control, and consistent with an approach necessary for energy projects.
It has been remarkable to observe how ARRA has not only stimu-lated short-term job creation, but has also been a catalyst for an entirely new landscape of relationships, inspiration, and oppor-tunity for many Utah citizens, businesses, and organizations. Only 18 months remain to complete scores of ARRA-funded energy retrofits in thousands of buildings, install hundreds of renewable energy systems, deliver energy workforce training and reach tens of thousands of people through education and out-reach programs. As we work to meet these challenges, the USEP remains committed to helping Utahns shape progress in energy efficiency and renewable energy development through its tradi-tional efforts on technical support and service.
Summary of ARRA-funded programs managed by the Utah State Energy Program.
ENERGYOFFICEINTRANSITIONBy Chris Tallackson
Segment ARRAFunding PercentageofTotal No.ofPrograms
Building Efficiency $17,000,000 38% 6
Renewable Energy $14,200,000 31% 5
Energy Efficiency Conservation Block Grant to Small Cities $9,500,000 21% 16
Energy Efficient Appliance Rebate Program $2,600,000 6% 1
Energy Education and Training $1,000,000 2% 3
Planning, Policy, Transportation $750,000 2% 3
Total $45,050,000 100% 34
ENERGYNEWS
12 SURVEYNOTES

Jeremy Gleason is our new graphic designer, replacing Richard Austin. Jeremy recently moved to Utah from California and has a Bachelor of Fine Arts in Graphic Design from Cal Poly Pomona. Best of luck to Richard in his new endeavor with Davis County.
The Geologic Hazards Program (GHP) bids farewell to AshleyElliott. Thanks, Ashley, for your work on Utah landslides! She is replaced by JimOllerton, an engineering geologist who has worked as a geologic consultant for the past 12 years. Also joining GHP isAdamMcKean. Adam is working on the data preservation project and Utah’s landslide inventory while com-pleting his M.S. in Geology at Brigham Young University (BYU).
Chris Tallackson replaces Jason Berry as the Utah State Energy Program (USEP) manager. Chris has been the USEP Energy Rebate Coordinator for the past year. Best wishes to Jason who accepted a position with PacifiCorp. AlexScotthas joined USEP as the new Home Performance Program Special-ist. Alex has an M.S. in Urban Planning from the University of Utah.
The Energy and Minerals Program welcomes geologist MarkGwynn, replacing RogerBon who retired in August. Mark has an M.S. in Geology from the University of Utah.
MarshallRobinson has accepted a position with the Geologic Information and Outreach Program. He has a B.S. in Geology from BYU. Welcome to the UGS!SU
RV
EYN
EWS EMPLOYEENEWS
Interim geologic map of the Heiners Creek quadrangle, Morgan and Summit Counties, Utah, by James C. Coogan, 31 p., 1 pl., OFR-575 ������������������������������������������������� $13�95
Annual review and forecast of Utah coal production and distribution—2009, by Michael D. Vanden Berg, 37 p., ISBN 978-1-55791-838-3, C-112 ������������������������������ $12�95
Interim geologic map of the Saint John quadrangle, Tooele County, Utah, by Stefan M. Kirby, 11 p., 2 pl., scale 1:24,000, OFR-572 ���������������������������������������������������� $13�95
Interim geologic map of unconsolidated deposits in the Santaquin quadrangle, Utah and Juab Counties, Utah, by Barry J. Solomon, 34 p., 1 pl., scale 1:24,000, OFR-570 �������������������������������������������������������������������� $13�95
Interim geologic map of unconsolidated deposits in the Payson Lakes quadrangle, Utah County, Utah, by Barry J. Solomon, 29 p., 1 pl., scale 1:24,000, OFR-571 ��������� $13�95
Interim geologic map of the Orem quadrangle, Utah County, Utah, by Barry J. Solomon, 42 p., 1 pl., scale 1:24,000, OFR-567 ���������������������������������������������������� $13�95
Zion National Park geologic-hazards study area, Washington and Kane Counties, Utah, by William R. Lund, Tyler Knudsen, and David Sharrow, DVD (97 p., 9 pl. [contains GIS data]), ISBN 978-1-55791-833-8, SS-133 ������������������������������������������������������������������������ $24�95
Geologic map and coloration facies of the Jurassic Navajo Sandstone, Snow Canyon State Park and areas of the Red Cliffs Desert Reserve, Washington County, Utah, by Gregory B. Nielsen and Marjorie A. Chan, CD (15 p., 2 pl.), OFR-561 �������������������������������������������������������������������� $14�95
Interim geologic map of the Henefer quadrangle, Morgan and Summit Counties, Utah, by James C. Coogan, 30 p., 1 pl., OFR-576 ����������������������������������������������������������� $13�95
Progress report geologic map of the Rush Valley 30' x 60' quadrangle, Tooele, Utah, and Salt Lake Counties, Utah, by Donald L. Clark, Stefan M. Kirby, and Charles G. Oviatt, 60 p., 1 pl., scale 1:100,000, OFR-568 ����������������������� $17�95
Science-based land-use planning tools to help protect ground-water quality, Cedar Valley, Iron County, Utah, by Mike Lowe, Janae Wallace, Walid Sabbah, and Jason L. Kneedy, CD (33 p. + 92 p. appendices, 6 pl.), ISBN 978-1-55791-836-9, SS-134 ������������������������������������������������� $24�95
Interim geologic map of the Co-op Creek quadrangle, Wasatch County, Utah, by Kurt N. Constenius, James C. Coogan, and Jon K. King, 29 p., 1 pl., scale 1:24,000, OFR-574 �������������������������������������������������������������������� $13�95
Landslide maps of Utah, by Ashley H. Elliott and Kimm M. Harty, DVD (14 p., 46 pl. {contains GIS data]), ISBN 978-1-55791-837-6, M-246DM �������������������������������� $24�95
Interim geologic map of the Faust quadrangle, Tooele County, Utah, by Stefan M. Kirby, 12 p., 2 pl., scale 1:24,000, OFR-573 ���������������������������������������������������� $13�95
Geologic map of the east half of the Salt Lake City 1° x 2° quadrangle (Duchesne and Kings Peak 30' x 60' quadrangles), Duchesne, Summit, and Wasatch Counties, Utah (digitized from U�S� Geological Survey Miscellaneous Investigation Series Map I-1997, 1992), by Bruce Bryant, DVD (2 pl. [contains GIS data]), scale 1:125,000, ISBN 155791-824-6, MP-10-1DM ������������������������������������� $24�95
NEWPUBLICATIONS
JANUARY2011 13

PRSRT STDU.S. Postage
PAID Salt Lake City, UT Permit No. 4728
UTAH GEOLOGICAL SURVEY1594 W. North Temple, Suite 3110Box 146100 Salt Lake City, UT 84114-6100
Address service requestedSurvey Notes
NATURALRESOURCESMAP&BOOKSTORE
mapstore.utah.gov1594WNorthTemple
SaltLakeCity,UT84116801-537-3320or1-888-UTAHMAP
Monday–Thursday7:00a.m.–6:00p.m.
The Utah Geological Survey conducted a geologic-hazard investigation of a portion of Zion National Park (ZNP) to provide the National Park Service with geologic-hazard information for future park management. The ZNP Geologic-Hazard Study Area is a 154-square-mile area that encompasses Zion Canyon, Kolob Canyons and Kolob Terrace, the Zion–Mount Carmel Highway corridor, and all currently developed and high-use areas of the park.
Results of this investigation include nine GIS-based geologic-hazard maps that cover flooding and debris flows, rock fall, landslides, surface faulting, liquefaction, collapsible soil, expansive soil and rock, gypsiferous soil and rock, and soil piping and erosion. The maps are an aid for general planning to indicate where site-specific studies are required.
By William R. Lund, Tyler R. Knudsen, and David L. Sharrow
AVAILABLENOW!SpecialStudy133$24.95
mapstore.utah.gov
FOLLOWUS!
UGSBlog
geology.utah.gov/blog
UGSFacebook
UGSTwitter