vol 1, no 7. a framework of characteristics for...
TRANSCRIPT
CETIS Analytics Series ISSN 2051-9214
Produced by CETIS for JISC
Analytics Series
Vol 1, No 7.
A Framework of Characteristics for Analytics By Adam Cooper (CETIS)

JISC CETIS Analytics Series: Vol.1 No.7. A Framework of Characteristics for Analytics
2
A Framework of Characteristics for Analytics
Adam Cooper (CETIS)
Table of Contents
1. Introduction ................................................................................................................................................................... 3
2. Characteristics, Categories and Definitions ..................................................................................................................... 3
3. The Framework of Characteristics .................................................................................................................................. 4
3.1 Explanation/Discussion of the Framework Components .............................................................................................. 5
3.2 Examples of Using the Framework .......................................................................................................................... 11
4. Summary – Role and Application of the Framework ....................................................................................................... 15
5. Recommended Reading .............................................................................................................................................. 15
6. References ................................................................................................................................................................. 16
About this White Paper ........................................................................................................................................................ 17
About CETIS ....................................................................................................................................................................... 17
JISC CETIS Analytics Series: Vol.1 No.7. A Framework of Characteristics for Analytics
3
1. Introduction This paper, the seventh in the CETIS Analytics Series, considers one way to explore similarities, differences, strengths,
weaknesses, opportunities, etc of actual or proposed applications of analytics. It is a framework for asking questions about
the high level decisions embedded within a given application of analytics and assessing the match to real world concerns.
The Framework of Characteristics is not a technical framework.
This is not an introduction to analytics; rather it is aimed at strategists and innovators in post-compulsory education sector
who have appreciated the potential for analytics in their organisation and who are considering commissioning or procuring an
analytics service or system that is fit for their own context.
The framework is conceived for two kinds of use:
1. Exploring the underlying features and generally-implicit assumptions in existing applications of analytics. In this case,
the aim might be to better comprehend the state of the art in analytics and the relevance of analytics methods from
other industries, or to inspect candidates for procurement with greater rigour.
2. Considering how to make the transition from a desire to target an issue in a more analytical way to a high level
description of a pilot to reach the target. In this case, the framework provides a starting-point template for the
production of a design rationale in an analytics project, whether in-house or commissioned. Alternatively it might lead
to a conclusion that significant problems might arise in targeting the issue with analytics.
In both of these cases, the framework is an aid to clarify or expose assumptions and so to help its user challenge or confirm
them.
2. Characteristics, Categories and Definitions An earlier paper in the CETIS Analytics Series considered the definition of “analytics” as an overarching concept while also
suggesting that detailed definitions of subtypes of analytics are impractical and unhelpful[1]. The point being made was that
the complexity of what we might apply analytics to – the management of research, the conduct of teaching and learning and
the management of the whole institution and its support functions – calls into question the idea of being definitive. Hence,
rather than define kinds of analytics, three broad domains of application where characterised by stakeholder types and the
typical questions that analytics might be applied to.
This approach is continued in the framework, which is intended to accommodate description of grey areas and not to impose
black-or-white distinctions. Since we are often not dealing with exclusive categories but with stereotypes in a continuum, the
framework refers to characteristics, which may overlap and which are assumed to be extensible and adaptable. These are
grouped into different dimensions according to similarity of the aspect they characterise. Many of these dimensions are
about the relationship between people, people and data or things or ideas, etc. This closeness to the concerns of people
ensures that the framework is relevant to the real world to which analytics will generally be applied.
This kind of descriptive, rather than definitive, approach allows us to deal with the real-world complexity of how analytics is,
or may be, applied without: either tripping up over the different meanings people will assume from terms such as “learning
analytics” or “recommender system”; or always having to define or redefine terms as ideas combine or the concept of
analytics evolves.
JISC CETIS Analytics Series: Vol.1 No.7. A Framework of Characteristics for Analytics
4
3. The Framework of Characteristics There are many kinds of framework that have been advanced for the field of analytics. The previous sections have outlined
the intended purpose of the Framework of Characteristics (hereafter “the framework”) and the descriptive philosophy of the
approach. It may be helpful to note some of the kinds of framework that it is not:
An abstraction of the stages of analysis;
A methodology or toolkit to support data processing;
A maturity or capability model;
A framework for evaluating the ROI or other performance measures of analytics;
A taxonomy for objectives;
An operating model for the “data driven enterprise”.
The conceptualisation of the framework is similar to that developed by Greller and Drachsler [2] [3] in the context of Learning
Analytics; they indicate that they are working towards a “domain model or ontology” as opposed to a process model. Their
Generic Framework is more widely applicable than Learning Analytics and extensive relevant parts are borrowed for the
following framework. The 2012 paper [3] is a thoughtful and at times challenging handbook for the Learning Analytics
adventurer.
One clear point of divergence between this framework and the Greller & Drachsler paper is that they considered “soft
factors”, i.e. those that have cultural context, a strong subjective element, etc. Our framework considers only “hard factors” -
i.e. those that are fact-based and broadly objective – not because the soft issues are peripheral but because of the way we
expect this framework to be used. The framework provides a means to clarify hard factors before the more challenging task
of debating soft factors that emerge from the configuration of hard factors in a particular context. One conclusion of such a
debate might be that a given hard factor should be re-thought because of its unintended consequences. The section entitled
Recommended Reading refers to other papers in the CETIS Analytics Series that deal with key soft issues: professional
practice, legal matters, ethics and institutional capability.
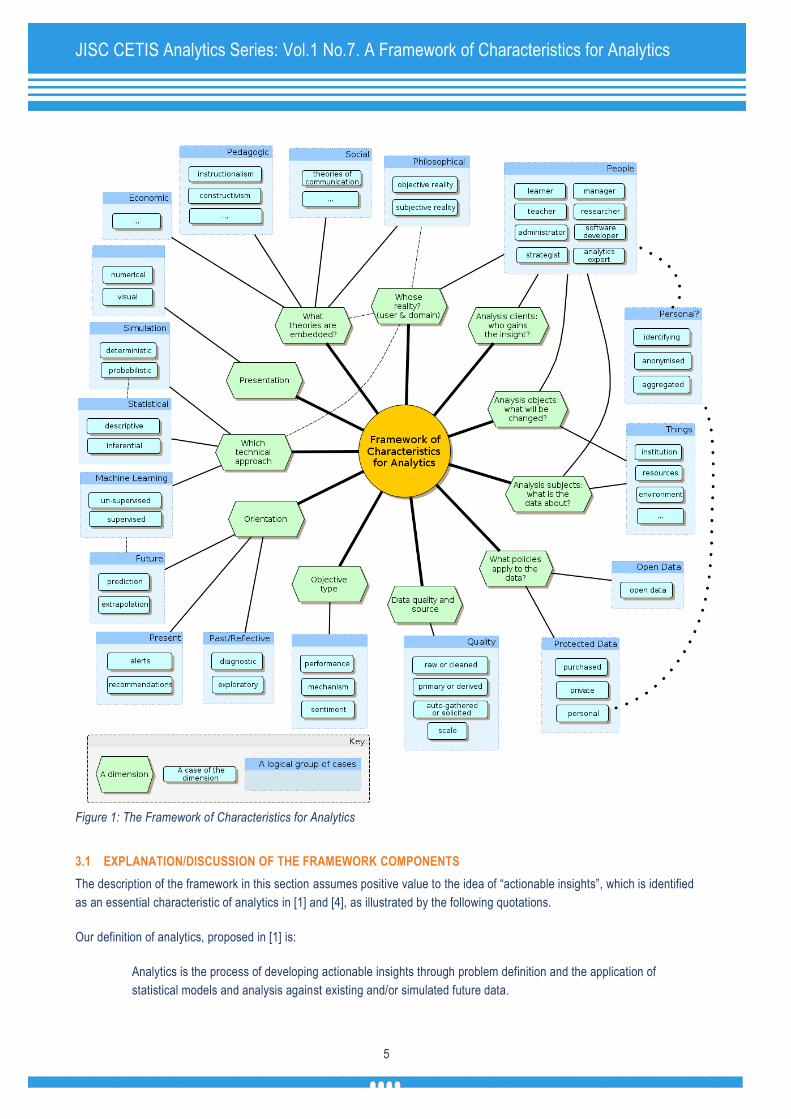
The framework is summarised in the following diagram (Figure 1). Ellipses are used to indicate obvious omissions but all
parts of the framework are intended to be open-ended and extendible according to need. The framework has been
conceived of from the perspective of post-compulsory education institutions therefore a few of the dimensions are more
attuned to the ethos typical of a post-compulsory education institution than they are to the corporate world.
JISC CETIS Analytics Series: Vol.1 No.7. A Framework of Characteristics for Analytics
5
Figure 1: The Framework of Characteristics for Analytics
3.1 EXPLANATION/DISCUSSION OF THE FRAMEWORK COMPONENTS
The description of the framework in this section assumes positive value to the idea of “actionable insights”, which is identified
as an essential characteristic of analytics in [1] and [4], as illustrated by the following quotations.
Our definition of analytics, proposed in [1] is:
Analytics is the process of developing actionable insights through problem definition and the application of
statistical models and analysis against existing and/or simulated future data.
JISC CETIS Analytics Series: Vol.1 No.7. A Framework of Characteristics for Analytics
6
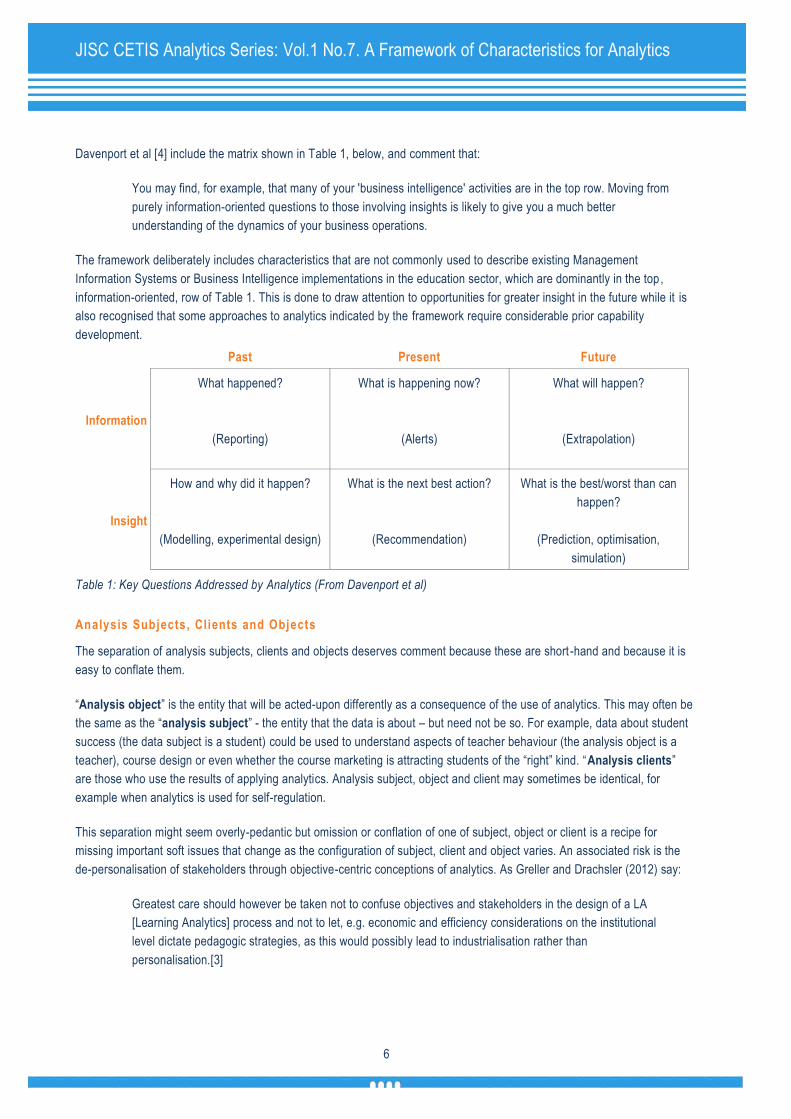
Davenport et al [4] include the matrix shown in Table 1, below, and comment that:
You may find, for example, that many of your 'business intelligence' activities are in the top row. Moving from
purely information-oriented questions to those involving insights is likely to give you a much better
understanding of the dynamics of your business operations.
The framework deliberately includes characteristics that are not commonly used to describe existing Management
Information Systems or Business Intelligence implementations in the education sector, which are dominantly in the top,
information-oriented, row of Table 1. This is done to draw attention to opportunities for greater insight in the future while it is
also recognised that some approaches to analytics indicated by the framework require considerable prior capability
development.
Past Present Future
Information
What happened?
(Reporting)
What is happening now?
(Alerts)
What will happen?
(Extrapolation)
Insight
How and why did it happen?
(Modelling, experimental design)
What is the next best action?
(Recommendation)
What is the best/worst than can
happen?
(Prediction, optimisation,
simulation)
Table 1: Key Questions Addressed by Analytics (From Davenport et al)
Analysis Subjects, Cl ients and Objects
The separation of analysis subjects, clients and objects deserves comment because these are short -hand and because it is
easy to conflate them.
“Analysis object” is the entity that will be acted-upon differently as a consequence of the use of analytics. This may often be
the same as the “analysis subject” - the entity that the data is about – but need not be so. For example, data about student
success (the data subject is a student) could be used to understand aspects of teacher behaviour (the analysis object is a
teacher), course design or even whether the course marketing is attracting students of the “right” kind. “Analysis clients”
are those who use the results of applying analytics. Analysis subject, object and client may sometimes be identical, for
example when analytics is used for self-regulation.
This separation might seem overly-pedantic but omission or conflation of one of subject, object or client is a recipe for
missing important soft issues that change as the configuration of subject, client and object varies. An associated risk is the
de-personalisation of stakeholders through objective-centric conceptions of analytics. As Greller and Drachsler (2012) say:
Greatest care should however be taken not to confuse objectives and stakeholders in the design of a LA
[Learning Analytics] process and not to let, e.g. economic and efficiency considerations on the institutional
level dictate pedagogic strategies, as this would possibly lead to industrialisation rather than
personalisation.[3]

JISC CETIS Analytics Series: Vol.1 No.7. A Framework of Characteristics for Analytics
7
For the case when the analysis subject is a person, the treatment of personally identifying information may be relevant for
legal, practical and ethical reasons. Three stereotypes are shown in the “Personal?” group in Figure 1 to capture whether the
subject identity is carried through the analytics process, is anonymised or lost due to aggregation of individual data into
group properties.
Most of the examples of people or thing that might be the subject, object or client are self-explanatory, with the possible
exception of “environment”. This is a cover-all for external factors which might include labour market statistics, demographic
data, macro-economic factors, etc. Practical use of the framework should expand “environment” to one or more specific
terms.
The dimensions in this section can be expressed in the short-form questions: what changed (subject), what do we want to
change (object) and who acts (client)?
Data Origin: Policies, Quality and So urce
These two dimensions are concerned with the data that is input to the analytics process.
The group labelled “data quality and source” is really a union of several related dimensions of the raw material of analytics,
covering data acquisition, pre-processing, and aspects such as scale of the data collected. These aspects may generally not
be in focus, except to the statistician, but they may have a critical influence on the validity or significance of the results and
hence the kind of actions that are justifiable. These factors are critical to the realisation of benefits, and to the avoidance of
positive harm, from analytics and differences between the raw material you have available and that which is available in
another industry or institution might represent a critical blocker to successful adoption. They beg questions like: do we have
enough data, is it of sufficient accuracy, are there relevant biases, etc?
The dimension labelled “policy” is largely concerned with restrictions on access and use of the data in general terms. The
most likely concern to be raised when considering this dimension is the proper handling of personal data, a topic covered by
another paper in the CETIS Analytics Series [5]. The policy dimension also draws attention to open data, i.e. data for which a
licence is given to freely use the data. An increasing volume of data collected by or about public sector bodies is being
released as open data and this may have value for benchmarking or as a source of data to address previously unanswerable
questions.
Orientat ion and Objective Type
These two dimensions are concerned with the application of analytics in general terms. The most general of these,
“orientation”, separates out analytics questions according to their focus in time: past, present and future. “Objective type”
adds nuance according to the kind of insight and draws attention to alternative objectives to performance. Objective types at
the level of business function are not in scope; these would form a different kind of framework.
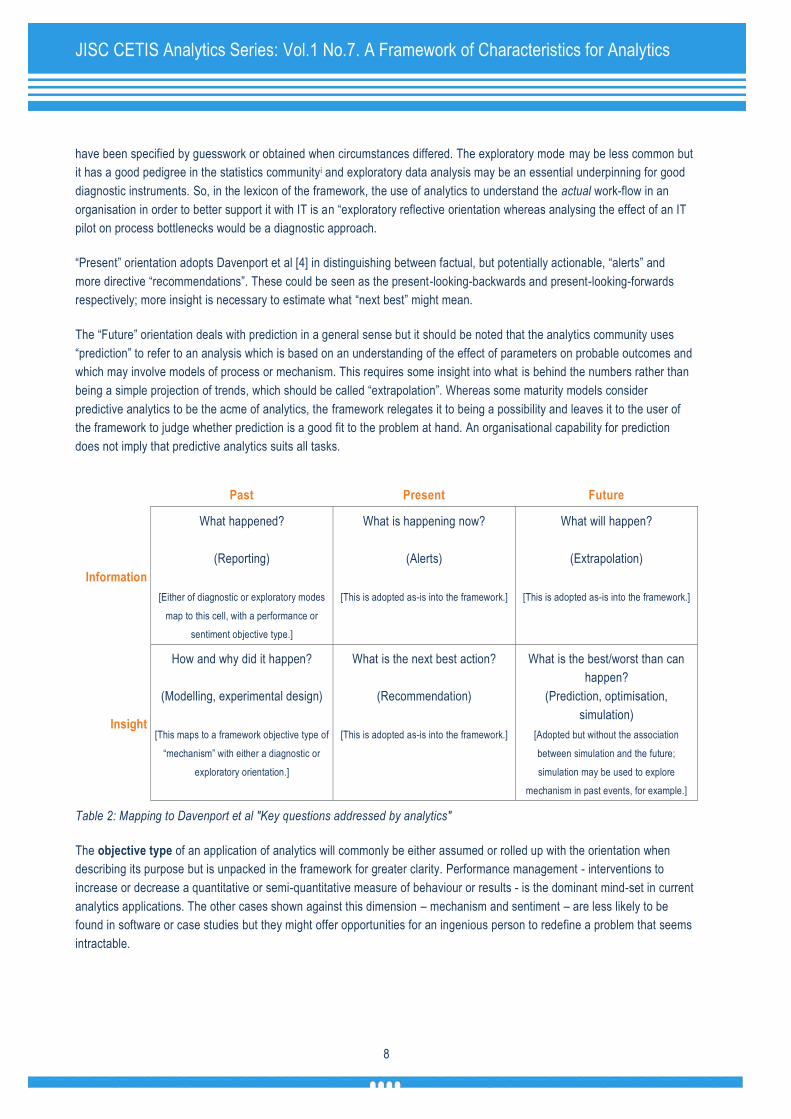
Orientation borrows from and maps on to the “Key questions addressed by analytics” matrix in the book “Analytics at Work”
by Davenport et al [4]. Table 2 shows this mapping, using brackets to annotate the original matrix.
Analytics oriented towards the past, which we have also labelled “reflective” is divided into two cases: “diagnostic” or
“exploratory”. These cases distinguish between applications where there is a supposed range of desirable properties
(“diagnostic”) and where there is no pre-supposed or imposed view of better vs worse, satisfactory or unsatisfactory, … etc.
Analytics tends to be approached in the diagnostic mode, which is pragmatic for day-to-day action-taking but an exclusively
diagnostic mode may risk neglect of some “unknown unknowns” or risk focus on misleading or sub-optimal metrics that might
JISC CETIS Analytics Series: Vol.1 No.7. A Framework of Characteristics for Analytics
8
have been specified by guesswork or obtained when circumstances differed. The exploratory mode may be less common but
it has a good pedigree in the statistics communityi and exploratory data analysis may be an essential underpinning for good
diagnostic instruments. So, in the lexicon of the framework, the use of analytics to understand the actual work-flow in an
organisation in order to better support it with IT is an “exploratory reflective orientation whereas analysing the effect of an IT
pilot on process bottlenecks would be a diagnostic approach.
“Present” orientation adopts Davenport et al [4] in distinguishing between factual, but potentially actionable, “alerts” and
more directive “recommendations”. These could be seen as the present-looking-backwards and present-looking-forwards
respectively; more insight is necessary to estimate what “next best” might mean.
The “Future” orientation deals with prediction in a general sense but it should be noted that the analytics community uses
“prediction” to refer to an analysis which is based on an understanding of the effect of parameters on probable outcomes and
which may involve models of process or mechanism. This requires some insight into what is behind the numbers rather than
being a simple projection of trends, which should be called “extrapolation”. Whereas some maturity models consider
predictive analytics to be the acme of analytics, the framework relegates it to being a possibility and leaves it to the user of
the framework to judge whether prediction is a good fit to the problem at hand. An organisational capability for prediction
does not imply that predictive analytics suits all tasks.
Past Present Future
Information
What happened?
(Reporting)
[Either of diagnostic or exploratory modes
map to this cell, with a performance or
sentiment objective type.]
What is happening now?
(Alerts)
[This is adopted as-is into the framework.]
What will happen?
(Extrapolation)
[This is adopted as-is into the framework.]
Insight
How and why did it happen?
(Modelling, experimental design)
[This maps to a framework objective type of
“mechanism” with either a diagnostic or
exploratory orientation.]
What is the next best action?
(Recommendation)
[This is adopted as-is into the framework.]
What is the best/worst than can
happen?
(Prediction, optimisation,
simulation)
[Adopted but without the association
between simulation and the future;
simulation may be used to explore
mechanism in past events, for example.]
Table 2: Mapping to Davenport et al "Key questions addressed by analytics"
The objective type of an application of analytics will commonly be either assumed or rolled up with the orientation when
describing its purpose but is unpacked in the framework for greater clarity. Performance management - interventions to
increase or decrease a quantitative or semi-quantitative measure of behaviour or results - is the dominant mind-set in current
analytics applications. The other cases shown against this dimension – mechanism and sentiment – are less likely to be
found in software or case studies but they might offer opportunities for an ingenious person to redefine a problem that seems
intractable.

JISC CETIS Analytics Series: Vol.1 No.7. A Framework of Characteristics for Analytics
9
Understanding sentiment (emotion, affect, feeling etc) is, for example, important in understanding how to pitch a product to
different consumer segments in marketing and for reputation management through the discovery of unfavourable online
reviews of products. A sentiment-related objective would also apply to analytics being applied to discover employees or
customers (students?) who might defect. This might make for a more reliable approach than focussing on performance
measures alone.
The case of the “mechanism” type is concerned with the use of analytics to reject ii theories of cause and effect. Mechanism
can become an important objective when a correlation of some kind has been discovered but where the action to take to
achieve desired results is unclear, is the subject of dispute, or where unintended consequences are thought likely. A
correlation between A and B does not mean: doing something to affect A will necessarily change B; only B is affected if
changing A does affect B; that two actions with the same effect on A would have the same effect on B even if they are
causally linked. Mechanism-focussed analytics is difficult.
Technical Approach and Presentat ion
The writer takes the position that some understanding of the different technical approaches is useful because the
practicability, validity and utility of an application of analytics does depend on the technical approach alongside the other
dimensions. On the other hand, a detailed taxonomy of statistical and machine learning would be unbalancing to the
framework and would not be particularly instructive. Such a taxonomy would be at the next level of detail and could be
tackled through a number of facets in its own right [6].
The framework groups characteristics into three dimensions according to whether the technique: a) is mainly traditional
statistics; b) falls into the newer category of machine learning; or c) involves simulation. These dimensions are arguably not
as distinct as implied by this division; statistical methods are employed in machine learning and in some simulations but
traditional statistical methods are likely to be much more frequently used in analytics without these additional techniques.
Statisticians also frequently employ simulation.
The group of characteristics labelled “Statistical” indicates two stereotypes from the tradition of statistical analysis. The
traditional methods are split according to common statistics terminology to reflect their power to convince:
Descriptive statistics is concerned with, for example, measures of central tendency such as the mean and measures
of dispersion such as standard deviation. Sums (“roll-ups”) over groups, time-periods, etc are also covered by this
group as are measures used in social network analysis such as betweenness centrality. They are of limited use in
motivating action unless there is an associated threshold or trigger value that has been determined by theory or
practice.
Inferential statistics can take several forms. Hypothesis testing is one form and involves a determination of the
probability of a general conclusion on the basis of a sample of limited size. Regression or correlation analysis is a more
sophisticated form of inferential statistics that calculates the likelihood of a relationship existing between variables on
the basis of sample data. Inferential statistics uses measures such as significance or confidence levels that are
important information to help deciding whether action is justified by the results.
Machine learning arose as a branch of artificial intelligence and is concerned with the identification and recognition of
patterns in complex data using computer algorithms. The close, but not exclusive, link between machine learning methods
and a predictive orientation is shown on the diagram. Statistics is used but machine learning is essentially a computational
rather than mathematical discipline. Machine learning methods can be separated into two:

JISC CETIS Analytics Series: Vol.1 No.7. A Framework of Characteristics for Analytics
10
Supervised machine learning involves the use of a “training set” of data where each record in the data set has
previously been assigned to a category or has a known result. If the training is successful, the software will correctly
predict the result of a new situation given its parameters. The training set must be drawn from data pertaining to the
same context as the data for which predictions will be made. Predicting the result of a sports event given athlete
histories might involve supervised machine learning.
Un-supervised machine learning involves the discovery of patterns in the data without any a-priori knowledge of
classification. The algorithms used embed assumptions about what constitutes a pattern - we would often describe
these as clusters – hence it is usually an exploratory approach. This technique can deal with many more than the 2 or
3 variables that humans can spot patterns in.
Simulation is not so well used in current analytics applications but it may have particular value in understanding the
relationship between complex systems and their component parts. Simulation may be useful for propagating “what if”
scenarios into the future when a model of cause and effect or interaction is known. This kind of simulation may involve
people responding to a computer-based model, which might be realised like a game. Simulation may also be used to help to
define models using historical data.
The “technical approach” dimension is not simply a dimension of technical interest, the realm of nerds. If the same real-world
problem is approached with different technical approaches, it is unlikely to lead a user to the same conclusions in all cases
since the meaning of the result will vary. Furthermore, the level of skill needed to interpret the results will differ.
Presentation is included as a separate dimension, allied to the technical approach. It simply captures whether numbers or
visualisations are the primary source from which insights are drawn. Many examples are unremarkable in combining both.
Embedded Theories
The inclusion of embedded theories and “whose reality” may seem rather academic but all applications of analytics
necessarily embed theory and views on what business, education, motivation, etc is. In general these aspects are not made
explicit and this is liable to lead to mismatch between what is implemented and what is effective, including cases where soft
issues lead to hard problems in adoption and use. It is not the case, however, that embedded theories are always relevant.
Referring back to Table 1, it is to be expected that analytics that is very firmly located in the “information” row is less a t risk
from theory/world-view mis-match.
The diagram shows a link between the technical approach and “whose reality” to draw attention to the likelihood that the
person who chose the model, posed the hypothesis or maybe classified the training set was influenced by their perspectives
and domain knowledge. Only some aspects of a given technical approach will be decided on purely technical knowledge.
More subtly, the analysis client may have a different mental model (reality) from the designer and may construct for
themselves an entirely different meaning for the result than was intended. The meaning inferred by the analysis client is
critically important because it guides their actions, hence the way an organisation might be transformed by embracing
analytics.
Greller and Drachsler [3] make similar points about the relationship between technical and theoretical underpinnings and the
meaning of what analytics applications emit (see for example their reference to Hildebrandt, 2010, [7] which explores this
issue in more detail). Making theories and world-views explicit parts of the framework is intended to make visible these
invisible biases.

JISC CETIS Analytics Series: Vol.1 No.7. A Framework of Characteristics for Analytics
11
3.2 EXAMPLES OF USING THE FRAMEWORK
As an example of using the framework, five accounts of analytics from the web are considered. The aim is not to come to a
value judgement but to show how a fairly superficial application of the framework exposes differences, highlights significant
factors and pinpoints what may be important missing information from the point of view of adoption.
Example 1 – Student Retention Analysis Using SAS (Course Notes)
The first example looks at the course notes for a SAS webinar on student retention analysis. These are available online at
http://support.sas.com/learn/ap/webinar/cnotes.pdf [accessed April 17th 2012].
Analysis subjects, objects
and clients
Analysis subjects: students with individual treatment in the source data but an aggregated
treatment in the results.
Analysis clients: the analysis client is not explicitly stated but appears to be a manager or
strategist.
Analysis objects: N/A (this is not specified in the course notes)
Data origin Private data, both internally-originated and acquired (SAT scores), is combined with student
questionnaire responses. The private data is drawn from high status processes and is expected
to be quite “clean”.
The scale of data is modest, being within the capabilities of standard desktop processing.
Orientation and objectives Orientation: the orientation appears to be diagnostic since positive value is associated with
increased retention but the method shown is actually exploratory since the significance of a
range of possible correlates is computed. This is a reflective orientation, although a natural
extension of the treatment would be to predict outcomes given a new cohort, in which case a
purely diagnostic mode is expected.
Objective type: this is clearly about performance.
Technical approach Both hypothesis testing and regression are described; the method is firmly statistical and of
inferential character.
Embedded theories and
reality
There is no evidence of any theory relevant to retention.
Comment As is to be expected from course notes produced by a statistics/analytics software supplier, the
emphasis is on the technical aspects. The configuration of analysis subject and client is typical
of applications of analytics to retention.
The framework would prompt anyone considering adoption of the methods described to ask and
answer the following questions for their context:
1. Does an aggregated approach to analysis subjects lead us to actionable insights?
Who would the analysis client be?
Are there ethical challenges? Or are there risks that the findings would be mis-
applied to predict the outcome for an individual.
2. Would there be demand to extend the approach to include an individualised treatment?
3. What theories of cause and effect (mechanism) would we employ when taking action?
4. Who or what would the “analysis object” be?
The kind of methods described in these course notes should be normal for an institution serious

JISC CETIS Analytics Series: Vol.1 No.7. A Framework of Characteristics for Analytics
12
about doing analytics and moving beyond reporting information and they can all be done with
cheap or free mature software.
Example 2 – Attendance and Retention at Edinburgh Telford College (IBM)
This example and the previous example address similar target areas and both involve an established technology supplier but
there are some clear differences which the framework draws out. The account used is at http://www-
01.ibm.com/software/success/cssdb.nsf/CS/STRD-8JYETN [accessed October 17h 2012].
Analysis subjects, objects
and clients
Analysis subjects: students with individual treatment in the source data.
Analysis clients: the analysis clients are both learner and tutor.
Analysis objects: the student, specifically their attendance.
Data origin Private data, originated within the college. Data quality (accuracy and completeness) is
moderate but improving accuracy and completeness of attendance data is a secondary objective
of the implementation.
The scale of data is modest, being within the capabilities of standard desktop processing.
Orientation and objectives Orientation: the orientation is diagnostic since positive value is associated with attendance and
corrective action is to be triggered by the result values. This is a “present” orientation with the
creation of alerts being central to the design.
Objective type: this is clearly about performance (attendance).
Technical approach The technical approach involves basic descriptive statistics and data visualisation (dashboard).
Embedded theories and
reality
There is no evidence of any theory relevant to attendance patterns and retention beyond the
stated association between declining attendance levels and risk of withdrawal. The assumptions
include students' wish to avoid losing their maintenance allowance.
Comment The system described in this case study is strongly in the model of traditional business
intelligence where the focus is on making data more accessible and usable. In this case this
approach clearly supports action by students and tutors the system, which uses threshold trigger
points. It does little to address deeper insights into patterns, likelihoods or correlations. The case
study notes, however, that modelling retention is a next step; their approach of getting the
basics and core information right before addressing advanced techniques is entirely defensible.
The design is notably more close to practical action than the first example and illustrates design
with users and their concerns more clearly in the foreground, which we can see through greater
clarity in the analysis object and client, and generally in the narrative.
Given the information-oriented approach described, the absence of embedded theories presents
little risk.
JISC CETIS Analytics Series: Vol.1 No.7. A Framework of Characteristics for Analytics
13
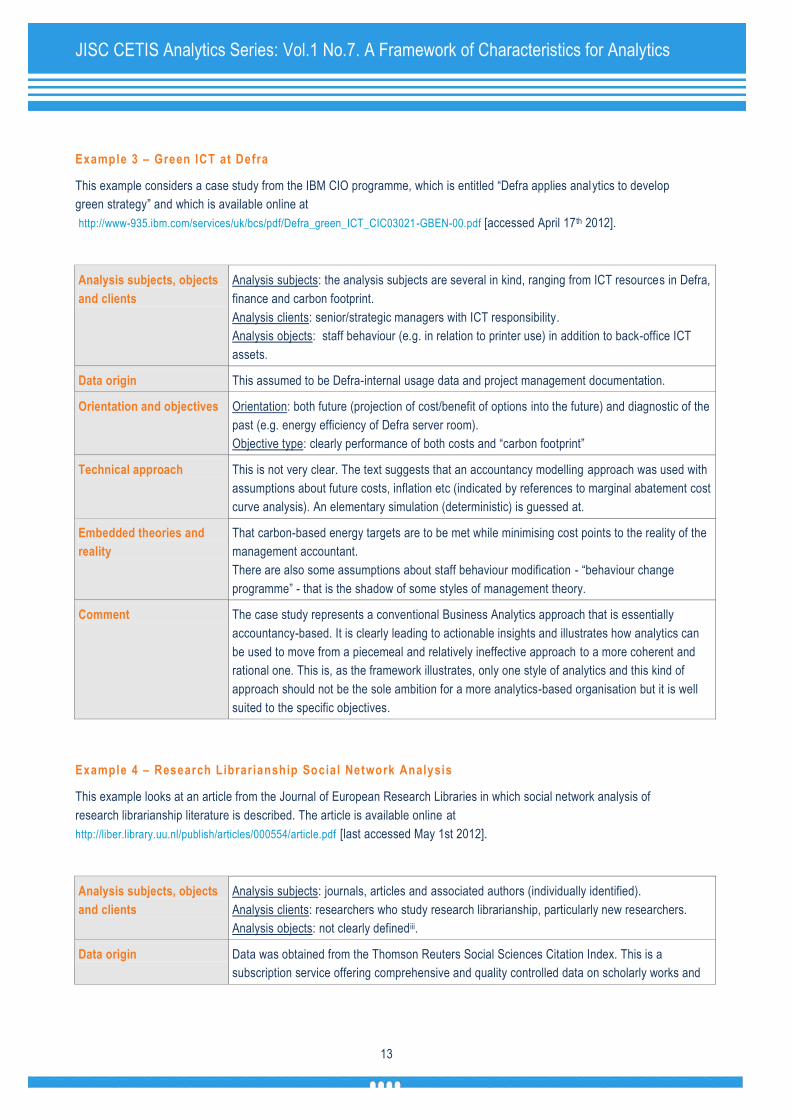
Example 3 – Green ICT at Defra
This example considers a case study from the IBM CIO programme, which is entitled “Defra applies analytics to develop
green strategy” and which is available online at
http://www-935.ibm.com/services/uk/bcs/pdf/Defra_green_ICT_CIC03021-GBEN-00.pdf [accessed April 17th 2012].
Analysis subjects, objects
and clients
Analysis subjects: the analysis subjects are several in kind, ranging from ICT resources in Defra,
finance and carbon footprint.
Analysis clients: senior/strategic managers with ICT responsibility.
Analysis objects: staff behaviour (e.g. in relation to printer use) in addition to back-office ICT
assets.
Data origin This assumed to be Defra-internal usage data and project management documentation.
Orientation and objectives Orientation: both future (projection of cost/benefit of options into the future) and diagnostic of the
past (e.g. energy efficiency of Defra server room).
Objective type: clearly performance of both costs and “carbon footprint”
Technical approach This is not very clear. The text suggests that an accountancy modelling approach was used with
assumptions about future costs, inflation etc (indicated by references to marginal abatement cost
curve analysis). An elementary simulation (deterministic) is guessed at.
Embedded theories and
reality
That carbon-based energy targets are to be met while minimising cost points to the reality of the
management accountant.
There are also some assumptions about staff behaviour modification - “behaviour change
programme” - that is the shadow of some styles of management theory.
Comment The case study represents a conventional Business Analytics approach that is essentially
accountancy-based. It is clearly leading to actionable insights and illustrates how analytics can
be used to move from a piecemeal and relatively ineffective approach to a more coherent and
rational one. This is, as the framework illustrates, only one style of analytics and this kind of
approach should not be the sole ambition for a more analytics-based organisation but it is well
suited to the specific objectives.
Example 4 – Research Librarianship Social Network Analysis
This example looks at an article from the Journal of European Research Libraries in which social network analysis of
research librarianship literature is described. The article is available online at
http://liber.library.uu.nl/publish/articles/000554/article.pdf [last accessed May 1st 2012].
Analysis subjects, objects
and clients
Analysis subjects: journals, articles and associated authors (individually identified).
Analysis clients: researchers who study research librarianship, particularly new researchers.
Analysis objects: not clearly definediii.
Data origin Data was obtained from the Thomson Reuters Social Sciences Citation Index. This is a
subscription service offering comprehensive and quality controlled data on scholarly works and

JISC CETIS Analytics Series: Vol.1 No.7. A Framework of Characteristics for Analytics
14
citations.
Orientation and objectives Orientation: descriptive
Objective type: there is no clear objective but a general aim to “gain deeper insights into the
discipline of research librarianship”
Technical approach A descriptive approach to social network analysis is used.
Embedded theories and
reality
There are references to literature describing the development of social network analysis; broad
theories of social communication and community development are clearly embedded (e.g. “The
general assumption behind this genre of studies is, that the more authors are co-cited, the
stronger will be the bond they have”).
Comment The article is typical of applications of social network analysis in being of descriptive character.
The research questions posed and the conclusions drawn are essentially informative rather than
being action-oriented. The absence of clearly identifiable analysis objects is consistent with the
informative outlook.
This example largely fails to match our definition of analytics due to the presence of only diffuse
actionable insights, even though it is a competent piece of data processing and probably of
interest to researchers.
Example 5 – SNAPP (Social Networks Adapting Pedagogical Practice)
SNAPP is a software tool designed for the visualisation of user interactions in Moodle, BlackBoard etc. As such it has a
range of uses; this example focuses on one use identified by SNAPP's creators: “provide you with a 'before and after'
snapshot of what kinds of interactions happened before and after you intervened/changed your learning activity design”. See
http://research.uow.edu.au/learningnetworks/seeing/snapp/index.html [last accessed May 1st 2012]
Analysis subjects, objects
and clients
Analysis subjects: principally learners but also teachers (personally-identifying online forum
interactions).
Analysis clients: teacher.
Analysis objects: teacher (their learning activity design).
Data origin Private data from a learning management system (virtual learning environment). SNAPP uses
raw data that is automatically generated in the course of using the online forum. Processing is at
the level of a teaching cohort so the scale of analysis subjects is likely to be small in
conventional educational settings, although the interaction count may be modest in scale.
Orientation and objectives Orientation: a diagnostic orientation is implied by SNAPP's creators, i.e. that increasing online
interaction is desirable
Objective type: performance (how effective is the learning activity design)
Technical approach A descriptive approach to social network analysis is used, with a strong bias towards visual
presentation.
Embedded theories and
reality
SNAPP's developers are overt in their software being designed to support socio-constructivist
practice.
JISC CETIS Analytics Series: Vol.1 No.7. A Framework of Characteristics for Analytics
15
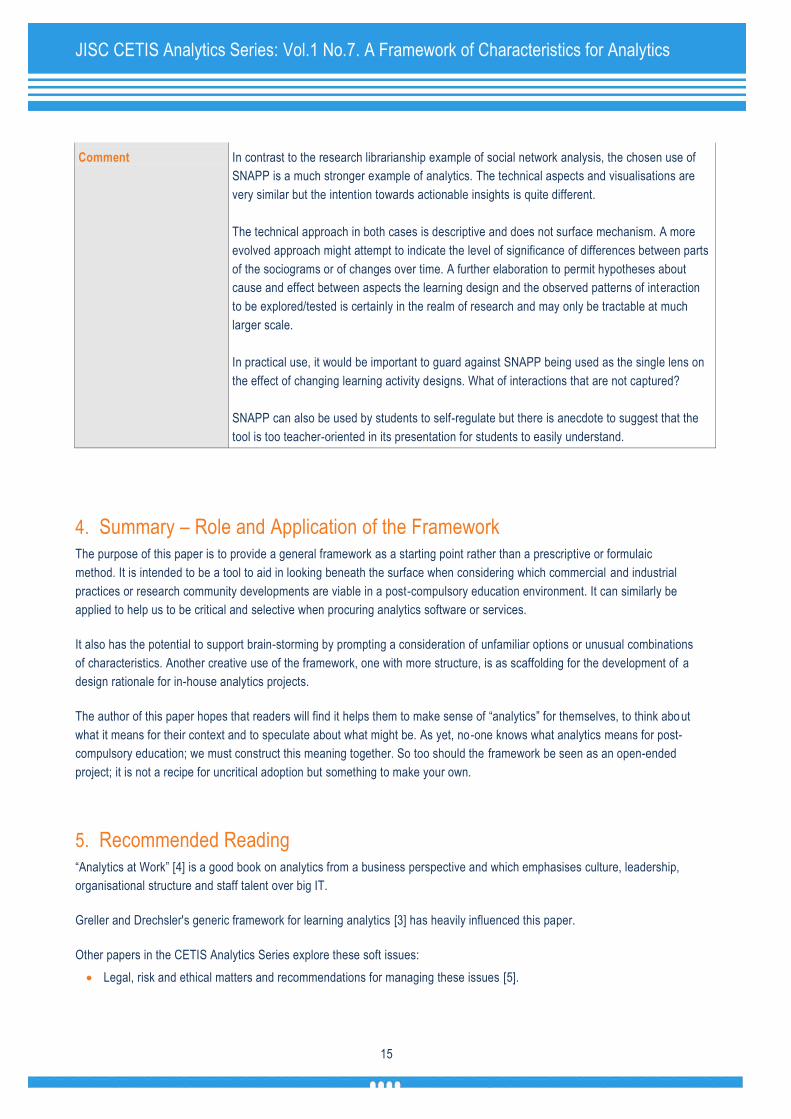
Comment In contrast to the research librarianship example of social network analysis, the chosen use of
SNAPP is a much stronger example of analytics. The technical aspects and visualisations are
very similar but the intention towards actionable insights is quite different.
The technical approach in both cases is descriptive and does not surface mechanism. A more
evolved approach might attempt to indicate the level of significance of differences between parts
of the sociograms or of changes over time. A further elaboration to permit hypotheses about
cause and effect between aspects the learning design and the observed patterns of interaction
to be explored/tested is certainly in the realm of research and may only be tractable at much
larger scale.
In practical use, it would be important to guard against SNAPP being used as the single lens on
the effect of changing learning activity designs. What of interactions that are not captured?
SNAPP can also be used by students to self-regulate but there is anecdote to suggest that the
tool is too teacher-oriented in its presentation for students to easily understand.
4. Summary – Role and Application of the Framework The purpose of this paper is to provide a general framework as a starting point rather than a prescriptive or formulaic
method. It is intended to be a tool to aid in looking beneath the surface when considering which commercial and industrial
practices or research community developments are viable in a post-compulsory education environment. It can similarly be
applied to help us to be critical and selective when procuring analytics software or services.
It also has the potential to support brain-storming by prompting a consideration of unfamiliar options or unusual combinations
of characteristics. Another creative use of the framework, one with more structure, is as scaffolding for the development of a
design rationale for in-house analytics projects.
The author of this paper hopes that readers will find it helps them to make sense of “analytics” for themselves, to think about
what it means for their context and to speculate about what might be. As yet, no-one knows what analytics means for post-
compulsory education; we must construct this meaning together. So too should the framework be seen as an open-ended
project; it is not a recipe for uncritical adoption but something to make your own.
5. Recommended Reading “Analytics at Work” [4] is a good book on analytics from a business perspective and which emphasises culture, leadership,
organisational structure and staff talent over big IT.
Greller and Drechsler's generic framework for learning analytics [3] has heavily influenced this paper.
Other papers in the CETIS Analytics Series explore these soft issues:
Legal, risk and ethical matters and recommendations for managing these issues [5].
JISC CETIS Analytics Series: Vol.1 No.7. A Framework of Characteristics for Analytics
16
The impact of analytics on teaching practice in Higher Education [8].
The capabilities – skills and literacies rather than IT - required within an educational organisation to apply analytics is
explored through case studies [9].
6. References [1] A. Cooper, “What is ‘Analytics’? Definition and Essential Characteristics,” CETIS Analytics Series, vol. 1, no. 5, 2012.
[2] W. Greller, “Reflections on the Knowledge Society,” Wolfgang Greller’s Blog, 2011. [Online]. Available:
http://wgreller.wordpress.com/2011/05/18/learning-analytics-framework/. [Accessed: 25-Sep-2012].
[3] W. Greller and H. Drachsler, “Translating Learning into Numbers: A Generic Framework for Learning Analytics,”
Educational Technology & Society, vol. 15, no. 3, pp. 42-57, 2012.
[4] T. H. Davenport, J. G. Harris, and R. Morison, Analytics at Work: Smarter Decisions, Better Results. Harvard Business
Press, 2010.
[5] D. Kay, N. Korn, and C. Oppenheim, “Legal, Risk and Ethical Aspects of Analytics in Higher Education”, CETIS Analytics
Series, vol. 1, no. 6, 2012.
[6] M. Sewell, “Machine Learning,” 2007. [Online]. Available: http://machine-learning.martinsewell.com/machine-learning.pdf.
[7] M. Hildebrandt, “The Meaning and the Mining of Legal Texts.” 2010.
[8] D. Griffiths, “The Implications of Analytics for Teaching Practice in Higher Education”, CETIS Analytics Series, vol. 1, no.
10, 2012.
[9] S. MacNeill and S. Powell, “Institutional Readiness for Analytics”, CETIS Analytics Series, vol. 1, no. 8, 2012.
iAn outline of the statistics topic of “exploratory data analysis” is to be found on Wikipedia: http://en.wikipedia.org/wiki/Exploratory_data_analysis
iiStatistical orthodoxy is that hypotheses are rejected or not-rejected; they are not accepted. A similar attitude is present in the Popperian philosophy of science in the form of the principle of falsifiability. The point is that mechanism is hypothetical and may only be contingently accepted if it is consistent with the data. iii We might imply analysis objects as being a research journal or potential collaborator but this is only hinted at by statements such as “new researchers who study research librarianship, should become aware of core journals and researchers, and the changes in research topics”.

JISC CETIS Analytics Series: Vol.1 No.7. A Framework of Characteristics for Analytics
17
About the Author Adam joined CETIS in 2006 and is currently one of the co-directors, with responsibility for CETIS's interoperability standards
and technology strategy work. He has a long-standing interest both in quantitative modelling and in the appropriation of
technology to support educational aims. He has worked on educational technology and innovation in both Further and Higher
Education Institutions in the UK and in the private sector during which time he has taught, managed learning technology
development, designed and built software, conducted R&D and analysed technology trends and their implications.
About this White Paper
Title: CETIS Analytics Series Volume 1, No 7: A Framework of Characteristics for Analytics
Author: Adam Cooper
Date: December 2012
URI: http://publications.cetis.ac.uk/2012/524
ISSN 2051-9214
Text Copyright © 2012 The University of Bolton; cover image courtesy of JISC
This work is licensed under the Creative Commons Attribution 3.0 UK Licence. For more information on the JISC CETIS publication policy see http://wiki.cetis.ac.uk/JISC_CETIS_Publication_Policy
Published by The University of Bolton
About CETIS
CETIS are globally recognised as leading experts on interoperability and technology standards in learning, education and training. We work with our clients and partners to develop policy and strategy, providing impartial and independent advice on technology and standards. CETIS are active in the development and implementation of open standards and represent our clients in national, European and global standards bodies and industry consortia, and have been instrumental in developing and promoting the adoption of technology and standards for course advertising, open education resources, assessment, and student data management, opening new markets and creating opportunities for innovation.
For more information visit our website: http://jisc.cetis.ac.uk/
This Analytics Series has been produced by CETIS for JISC: http://www.jisc.ac.uk