vocational training for disadvantaged youth in colombia...
TRANSCRIPT

1
Vocational Training for Disadvantaged Youth in Colombia:
An Assessment of Its Long Term Effects on Crime
By ORAZIO ATTANASIO, CARLOS MEDINA, COSTAS MEGHIR AND CHRISTIAN POSSO
Abstract
We evaluate the long-term impacts of a randomized Colombian job
training program on crime, among participants and their family
members. By using a large administrative data that includes the census
of all arrests in Colombia in the period 2005-2016, we find that the
program reduced the probability of committing a crime of beneficiary
participants’ family members, especially in families in extreme poverty
or with low educated household heads. The effects are stronger among
male family members of female participants, and family members that
are younger than the participant. Our results do not show any effect on
crime among participants. The evidence suggest that the most likely
channel at work would be the income effect due to higher family income
from lottery winners’ higher earnings, which allows the participants’
family members to attain higher education levels and be less likely to
work in the informal labor market. These external effects of the
program provide additional evidence of its previously documented
cost-effectiveness.
Attanasio: University College London, Department of Economics, Gower Street, London WC1E6BT, UK
([email protected]); Medina: Banco de la República, Medellín, Calle 50 N 50-21 ([email protected]); Meghir: Yale University, 37 Hillhouse Avenue, New Haven, CT 06511 ([email protected]); Posso: Banco de la República,
Medellín, Calle 50 N 50-21 ([email protected]). We are grateful to the National Police of Colombia and SIJIN for
providing us access to all criminal data of Colombia, and to the DNP for providing us access to the SISBEN datasets. All errors are the responsibility of the authors.

2
I. Introduction
In July of 2014 the news magazine The Economist claimed that the security of
citizens is the main problem of Latin America. This is due to different reasons.
Latin America is the only region in the world where homicide rates increased during
the first decade of this century. In addition, robberies have tripled over the last 25
years, and extortion grows at alarming rates. Policy makers usually fight crime
through coercion and sanctions against citizens who do not respect the law.
However, some social programs have proven to be as effective as traditional
coercion or sanctioning policies. In particular, educational programs aimed to
increase educational attainment, such as scholarships for formal education or
training for work, has been effective mechanisms for reducing crime. Multiple
papers use non-experimental methods to identify the negative causal relationship
between education and crime, both in the short and long run. Some examples in this
literature are the works of Machin et al. (2011), Meghir, Palme and Schnabel (2012)
and Hjalmarsson, Holmlund and Lindquist (2015).
Yet, there are not sufficient studies using experimental evaluations to study the
relationship between education and crime. Experimental designs allow researchers
to control for unobserved factors, such as risk aversion and patience, which affect
both human capital accumulation and crime. Likewise, the randomization and
timing of the programs allow researchers control for the possible inverse
relationship that may exist between crime and education. Despite the desirable
qualities of such designs, it is not easy to find investigations that exploit the
randomization of programs to identify the relationship between education and
crime. Some exceptions are the works of Cullen, Jacob and Levitt (2006) and
Deming (2011) who exploit the random assignment of quotas in high schools in the
districts of Chicago and Charlotte, respectively. In both cases, there is evidence that

3
students in late adolescence or early adulthood, who were lucky enough to win the
lottery, were arrested fewer times than those who failed to win the lottery.
Colombia has multiple social programs aimed to increase school attendance and
training for work.1 A program that stands out is the vocational training program for
work, Jóvenes en Acción (JeA), developed from the beginning of 2000 to the year
2005, which combined in-classroom training and on-the-job training (See FIP and
DNP, 2002, and DNP 2000a, 2000b). The fundamental feature of the program is
that it provided subsidies for the training of young individuals between the ages of
18 and 25 who were living in poverty in the seven major metropolitan areas, just
after the worst economic crisis in Colombia's modern history. This population is
not only the most vulnerable in Colombia, it is also the segment of the population
most at risk of entering criminal activities in the main urban areas, such as Medellin,
Bogota and Cali (see Medina, Posso, and Tamayo 2016, 2011).
Another unique feature of the JeA program is that in 2005 the program's subsidies
were distributed through an experimental design, where participation in the
different training courses was decided through lotteries; creating a perfect scenario
for the identification of the causal effects of the program on different outcomes (See
FIP and DNP, 2002, DNP 2000a, 2000b).
Recent literature has shown important effects of the JeA program on tertiary
education, employment and formal wages (see Attanasio, Kugler and Meghir, 2011,
for short-term effects; Attanasio, Guarin, Medina and Meghir, forthcoming and
Kugler et al. 2015, for long-term effects). Kugler et al. (2015) found that JeA also
has educational spillover effects on male participants’ family members.
The above results are consistent with the basic predictions of human capital
model, where the investments in human capital increase future opportunities to find
work as well as the productivity of individuals. Nonetheless, the channels through
1 For example, there is the PACES program. See Bettinger et al (2016).

4
which JeA may affect crime are several. First, Lochner (2004) and Lochner and
Moretti (2004) extend the basic model of human capital accumulation and show
that if increases in returns to labor are relatively higher than the returns of crime,
then the basic model would predict that such increase reduce crime. This channel
may be important for both participants and their family members. First, the direct
effect is observed on the participants since the training program increase the human
capital of the individual and through this channel the returns to labor. Second, it
also may have an indirect effect on participants’ family members through
educational spillover on them; especially in enrollment in tertiary education (see
Kugler et al, 2015).
Second, in a complementary way, Becker and Mulligan (1997) use a model of
intertemporal preference formation to show that the accumulation of human capital
has a fundamental effect on the formation of the patience of individuals and on the
valuation of the future. This makes them less likely to incur in risky situations, such
as criminal activities. This channel may be important for both participants and their
family members as well.
Third, the standard model of consumption and labor supply predicts that after an
increase in household’s income, consumption should increase while individual’s
time allocated to the labor market is reduced. Since previous results by Attanasio
et al. (forthcoming) and Kugler et al. (2015) have shown that lottery winners are
more likely to receive higher earnings in the formal sector (around 11 percent
more), we may expect a higher reduction in informal activities like crime. At the
same time, the income effect may have positive effects on the accumulation of
human capital. This channel may be more important on the participants’ family
members.
This paper investigates the causal effects of the JeA program on the likelihood of
an individual be captured by the police in the act of committing a crime or criminal

5
offense in the period 2005-2016 among participants and their family members.2 To
measure this, we use the administrative records of the Colombian National Police,
which include the census of all arrests that occurred in the period 2004-2016 for the
whole country, including the seven main cities in which the program JeA was
implemented. Just as in Attanasio et al. (forthcoming), the full cohort of individuals
who applied to the JeA program in 2005 and were part of JeA's original
experimental design is used.
In addition, data from the 2005 cohort of the JeA program is matched with the
SISBEN database; the latter is used in Colombia to target the poorest individuals
and families with the aim of providing them with social assistance.3 In 2005,
SISBEN interviewed 32 million individuals, or approximately 60% of Colombia's
poorest individuals. This data allow us to identify all participant’s family members
at the baseline.
The most similar study to our work is Schochet, Burghardt and Glazerman
(2001). This paper assesses the effects of the Job Corps education and training
program administered by the United States Department of Labor that provides free
vocational education for 16-24 year olds living in poverty. Similar to JeA,
individuals participated in a training that lasted 8 months. The authors also had an
experimental design for program evaluation. Schochet, Burghardt and Glazerman
(2001) find modest but positive effects on employment and wages. However, they
find substantial effects on arrest rates reported by the same individuals during the
year the training was implemented, while the effect fades for later years.
2 As expected, the nature of these data does not allow identifying those criminals who managed
to evade Colombian justice. Therefore, we focus exclusively on the effect of the program on the
likelihood of an individual being caught by the police in the act of committing a felony or criminal
contravention in the period 2005-2016. 3 SISBEN is the acronym for the System of Identification and Classification of Potential
Beneficiaries, which consists of 6 levels of poverty which are constructed through the SISBEN
poverty index. This index is used in Colombia mainly to focus on the subsidies provided by the
national and local government.

6
Our results do not show any effect on crime among lottery winner participants.
This may be due to the very low crime incidence among participants of the program,
as we show later. Nonetheless, we found negative effects on participants’ family
members (6.3 percent higher than the 11.8 percent crime rate among control
applicants). The effects are mainly observed between male family members that are
younger than the participant is (16.4 percent on base of 15.5 percent). In addition,
the effects are larger between male family members of female participants (6.6
percent higher than the 20.1 percent crime rate among control applicants). In
addition, the effects are larger among male family members that are younger than
the applicant (16.4 percent higher than the 15.5 percent crime rate among control
applicants). The heterogeneous effect shows that the impacts of the program are
more important in families in extreme poverty (Sisben level 1 versus higher), or in
households where the head has low level of education (less than 11 years of
education versus 11 or more). The evidence suggest that the most likely channel at
work would be the income effect due to higher family income from lottery winners’
higher earnings. To check this hypothesis we also estimate the effect of the program
on formal and informal employment. If the income effect, due to higher earnings
of lottery winners, is the main channel at work, additionally to the effects on crime
one may expect also a reduction in the employment either on the formal or informal
market. We do find a reduction on informal employment among relatives of both
male applicants and applicants that are older than them, giving some support to the
income effect hypothesis. Finally, we estimate the effects on schooling outcomes.
The paper is organized as follows: Section I describes the intervention and
presents the different sources of information; Section III shows the estimated
effects of the JeA program on the probability of being caught committing a crime
and other outcomes. Section IV presents the conclusions.

7
II. The 2005 Jovenes en Accion Programa
Jovenes en Accion is a vocational training program that supports young
Colombians in conditions of poverty and vulnerability. The program provides
Conditional Cash Transfers (CCT) that allows beneficiaries to continue their higher
education in technical and technological areas. JeA was aimed at unemployed
youths from 18 to 25 years old, who belonged to the two lowest levels of SISBEN,
a poverty index used by the Colombian government to distinguish the most
vulnerable population. The program was implemented since 2002 in the country's
seven major cities4, and by 2005 it had about 80,000 beneficiaries (See FIP and
DNP, 2002, DNP 2000a, DNP 2000b).
A detailed description of the program can be found in Attanasio et al.
(forthcoming), and Attanasio, Kugler and Meghir (2011). The JeA program aimed
to develop the skills of young people, and through this channel increase their
employment possibilities. The program consisted of training courses given by
private training institutions. In principle, each course was expected to make up
about 30 unemployed young people who met the conditions of the program.
However, in 2005, the JeA program encouraged the private training institutions to
preselect more than 30 candidates, and within the shortlisted, a lottery was applied
to select the 30 final beneficiaries (see FIP and DNP, 2002, DNP 2000a, DNP
2000b).
For 2005, the program had 114 private training institutions, which offered 441
courses with a total of 26,615 seats. The total number of preselected was 33,929
youths, who constitute the experimental population. JeA's guidelines established
that each course should include a 3-month elective phase, 360 hours duration (6
hours a day from Monday to Friday), and a three-month, 480-hour work placement
4 Bogotá, Medellín, Cali, Barranquilla, Bucaramanga, Manizales and Cartagena.

8
phase that should be carried out in legally constituted companies. Additionally,
during these 6 months the youths were directed towards the construction of a
component called "Life Project", seeking to improve self-esteem regarding life and
work. Finally, by 2005 the program included a small stipend of approximately USD
$ 2.20 per day for pupils without children under the age of seven, and around USD
$ 3.00 per day for women with children under the age of seven.
A. Random assignment of JeA participants
One of the most interesting features of the program is that a large part of the total
payment to the private training institutions was conditional on the student
completing the work placement phase at the established times (see FIP and DNP,
2001). Other additional payments were also conditional on companies hiring young
people as apprentices with a formal contract of employment. Therefore, the private
training institutions had an incentive to choose the most capable individuals.
To control the incentive generated by the program design, the private training
institutions were asked to select up to 50 percent more applicants than seats
available in each course. Once the applications were pre-selected, two-thirds of the
applicants were randomly assigned to the course they requested, while the
remaining third was assigned to a control group. This design is the one used to
identify the effects of the program. Similar to Attanasio et al. (forthcoming), this
exercise uses the complete experimental cohort of the year 2005.
B. SISBEN database
The SISBEN database collects the information necessary to calculate the
SISBEN index, which is used to identify vulnerable households in Colombia. The
SISBEN index is a weighted average of a series of housing and household variables,

9
both in the rural and urban sectors.5 In 2005, SISBEN inspected 32 million people
out of a total of 43 million, approximately 75% of Colombians.
Data from the entire universe of eligible applicants in the JeA program in 2005
were matched with the SISBEN data available in the same year. Such match
provides the information of treated individuals and controls at the baseline. 92
percent of the individuals were matched, and the probability of matching was found
to be independent of treatment, that is, about 2/3 are treated and 1/3 are controls.
The final sample with characteristics in the baseline corresponds to 31.054
applicants from the JeA program in 2005. Additionally, this data allow us to identify
all participant’s family members.
Table 1 (reproduced from Attanasio et al., forthcoming) presents the baseline
descriptive statistics of the exercise. Attanasio et al. (forthcoming) observed that
the characteristics of the baseline are well balanced for both men and women, with
the exception that the female beneficiaries of the program are slightly younger (0.16
years younger than women in the control group).
5 See more details at https://www.sisben.gov.co/

10
Table 1. Individual characteristics and treatment status
Notes: This table is a replica of table A.b of the appendix of Attanasio et al. (forthcoming). The
original note is as follows: The table reports the difference in each variable between the treatment
and control groups, controlling for site-by-course fixed effects. The p-values were estimated taking
into account that there were multiple hypotheses, using the Romano and Wolf (2005), and Romano,
Shaikh and Wolf (2008), on each of the 14 baseline variables based on the bootstrap standard errors
stratified by city, gender and treatment status. *** Significant at the 1 percent level. ** Significant
at the 5 percent level. * Significant at the 10 percent.
Control meanTreatment-control
difference (p-value)Control mean
Treatment-control
difference (p-value)Control mean
Treatment-control
difference (p-value)
Low Socieconomic Stratum 0.957 -0.001 0.96 -0.001 0.951 -0.002
(>0.5) (>0.5) (>0.5)
Living in house or apartment 0.864 0.005 0.854 0.006 0.885 0.005
(>0.5) (>0.5) (>0.5)
Living at home without threats (avalanches, flood…) 0.918 0.003 0.916 0.002 0.92 0.006
(>0.5) (>0.5) (>0.5)
Age in 2005 22.11 -0.163 22.16 -0.164 21.99 -0.16
(0.003)*** (0.019)** -0.34
Homeownership 0.474 0 0.452 0.004 0.52 -0.009
(>0.5) (>0.5) (>0.5)
Household size 5.555 -0.052 5.606 -0.082 5.451 0.022
(>0.5) (>0.5) (>0.5)
Education of the head of the household 5.622 0.066 5.636 0.087 5.594 0.014
(>0.5) (>0.5) (>0.5)
Age in 2005 of the head of the household 44.55 0.414 43.36 0.272 47 0.755
(>0.5) (>0.5) (>0.5)
Number of children under 5 years old 0.719 -0.035 0.857 -0.035 0.438 -0.035
-0.364 (>0.5) (>0.5)
Number of adults over 65 years old 0.144 0.007 0.133 0.003 0.167 0.017
(>0.5) (>0.5) (>0.5)
Sisbén Score 11 0.185 11 0.202 11.2 0.142
(>0.5) (>0.5) (>0.5)
Squared Sisbén Score 161.1 3.947 158.4 4.637 166.5 2.283
(>0.5) (>0.5) (>0.5)
Applicant is the head of the household 0.088 -0.008 0.083 -0.002 0.1 -0.022
(>0.5) (>0.5) -0.261
Applicant is the Spouse/partner of the head 0.127 -0.008 0.185 -0.011 0.007 -0.001
(>0.5) (>0.5) (>0.5)
Observations
All Women Men
31054 21649 9405

11
C. National Police Data on Arrests
The variable of interest is the probability that an individual will be caught by the
police in flagrante committing a crime.6 The administrative records of the
Direccion de Investigacion Criminal e Interpol (DIJIN) were used to identify
applicants for the 2005 JeA program who were arrested.7 The DIJIN is a special
direction of the National Police of Colombia that is in charge of the process of
judicial, criminalistics and criminological investigation, as well as the handling of
criminal information of the whole country.
The DIJIN has universal coverage of all arrests that occur in the country from
January 2004 to the present. In particular, to identify individuals who committed a
crime, we merge data from the entire universe of eligible applicants in the JeA
program in 2005 and their relatives with the data from the DIJIN for the period
January 2004 to May 2016.
Figure 1 shows the incidence of crime among applicants and family members in
2004, the year before the training program started. The incidence of crime between
participants of the program was lower than 1 percent (0.46 percent). Nonetheless,
the incidence rate among family members is almost 13 times higher, and even
higher among males. This result lead us to conclude that individuals who self-select
to participate into this training program are more likely to be the high quality
members of their households.
6 According to the Police code in effect until 2016, the offender can be captured immediately or be summoned to appear
later (see Police Code, DECREE 1355 OF 1970). 7
DIJIN refers to the original acronym of the agency, Central Direction of Judicial Police and Intelligence.

12
Figure 1. Incidence of crime among applicants and their relatives
(A) (B)
Notes: Figure 1 – Panel A shows the percent of people who have committed a crime in 2004, one
year before the JeA program started by the type of sample; and Panel B shows the same but classified
by gender.
III. Effects of the program on the probability of committing a crime
A. Estimation and inference of the effects of the JeA program
In this section we present the average effects of the JeA program using the
universe of eligible applicants in the program that were the subject of the
experiment in 2005 and all their family members. The effects estimation is based
on a linear regression model as presented in equation (1)
(1) 𝑌𝑖𝑗 = 𝛼𝐷𝑖 + 𝑋𝑖𝛽 + 𝑆𝐶𝑗 + 𝜀𝑖𝑗,
Where 𝑌𝑖𝑗 is the outcome variable of individual 𝑖 in site and course 𝑗, 𝐷𝑖 is a
variable that is 1 if the individual was a beneficiary of the program and 0 otherwise,
and 𝑋𝑖 is a vector of characteristics of individuals at the baseline. Since
randomization occurred within the population of applicants for each specific
0.0
1.0
2.0
3.0
4.0
5.0
6.0
Pr(
crim
e in
2004
)
All Applicants Family
0.0
2.0
4.0
6.0
8.0
Pr(
crim
e in
2004
)
All Applicants Family
Men Women

13
course, then site-by-course fixed effects are included. These are represented by 𝑆𝐶𝑗.
Thus, the estimator of 𝛼 is the average weight of the estimated effects of the
treatment of the different courses.
For the inference we use bootstrap methods (with 1000 replications), where
standard errors and p-values are adjusted by the Multiple Testing method proposed
by Romano and Wolf (2005) and Romano, Sheikh and Wolf (2008). Thus, each
table allows to make inferences about the hypothesis that the treatment effect is
zero for all the variables results included in the table together.8
B. Effects of Jóvenes en Acción on the likelihood of committing a crime
In this section, we describe JeA effects on the likelihood of committing a crime for
both participants and their family members. Table 2 shows the effects of the
program on all individuals, participants and their family members. We also split the
results between male and females. The panel B include all control variables, while
the panel A does not include them.
As we show above (see figure 1), participants who self-select to apply to the
JeA program are much less likely to commit crimes at the baseline, in this way it is
unlikely that the program made any difference on crime incidence among them.
Nonetheless, between participants’ family members, we observe a much higher
crime incidence at the baseline (13 times higher).
The effects of the training program are negative and significant on the sample
that include both participants and their family members, although the effects are
only significant for men. About 16 percent of male training lottery losers and their
male relatives were captured committing a crime after 2005, while male lottery
8 In this case P-values are interpreted as the level of significance that would have to be applied
for the whole family of hypotheses, if we had to accept the null hypothesis that the effect is zero.

14
winners and their relatives are 5.8 percent less likely, a difference that is statistically
significant at the 5 percent level. When we condition the sample only on
participants, we find no effects of training on crime, suggesting that most of the
effect is on participant’s family members. In particular, 11.8 percent of lottery
losers’ family members were captured committing a crime after 2005. Training
lottery winners’ family members are 6.2 percent less likely than losers’ family
members to be capture committing a crime after 2005 (significant at 1% level). For
males, the relative effect is 5.7 percent (significant at 5% level), while for females
is 7.3 percent, even though it is only significant at the 10% level.
Table 2. Effects of JeA on the Likelihood of Committing a Crime
Note: P-values are in brackets, while robust standard errors are in parentheses. All regressions
control for site-by-course fixed effects. Likewise, regressions include as control variables all
baseline variables included in Table 1, including, if the applicant lives in a low stratum, if they live
in a house or apartment, if the house is at risk, if the family owns the house, household head
education, age of head of household, number of children under 5 years of age, and persons over 65
years of age, the score of SISBEN and its square, if the participant is the head of the household, and
if the participant is the spouse of the head of the household. The dependent variable is a variable
Control Means
Coefficient on
being offered
trainning
Effect (%) Control Means
Coefficient on
being offered
trainning
Effect (%) Control Means
Coefficient on
being offered
trainning
Effect (%)
0.102 -0.007*** -6.96 0.053 -0.003 -5.91 0.161 -0.010*** -6.42
(0.303) (0.002) (0.223) (0.002) (0.367) (0.004)
43771 85909 23714 47829 20057 38080
0.053 -0.002 -3.42 0.059 0.000 -0.48 0.040 -0.005 -13.71
(0.224) (0.003) (0.236) (0.004) (0.196) (0.005)
10506 20548 7051 14598 3455 5950
0.118 -0.009*** -7.65 0.050 -0.004* -8.57 0.186 -0.011*** -6.09
(0.322) (0.002) (0.218) (0.002) (0.389) (0.004)
33265 65361 16663 33231 16602 32130
0.102 -0.006*** -5.52 0.053 -0.003 -4.91 0.161 -0.009** -5.78
(0.303) (0.002) (0.223) (0.002) (0.367) (0.004)
43771 85909 23714 47829 20057 38080
0.053 0.000 -0.18 0.059 0.001 2.49 0.040 -0.004 -9.68
(0.224) (0.003) (0.236) (0.004) (0.196) (0.005)
10506 20548 7051 14598 3455 5950
0.118 -0.007*** -6.26 0.050 -0.004* -7.32 0.186 -0.011** -5.69
(0.322) (0.002) (0.218) (0.002) (0.389) (0.004)
33265 65361 16663 33231 16602 32130
All
Applicants
Family member
PANEL A WITHOUT CONTROLS
PANEL B WITH CONTROLS
Applicants
Family member
All Women Men
All

15
equal to one if the individual committed a crime during the period of analysis (2005-2016) and zero
in any other case. *** Significant at the 1% level, ** Significant at the 5% level.
Figure 2 shows the effect of the program on both beneficiaries and the
beneficiaries’ family members relative to the mean of the controls’ family
members. The effects presented accumulate the information on arrests year by year
since 2005. Thus, for example, the variable used in the regression analysis of 2005
only includes individuals captured in that year, while for 2006 includes both
individuals arrested in 2005 as in 2006, and so on for subsequent years. The panel
A of the figure 2 shows that there is not effect on beneficiaries. Nonetheless, Panel
B shows substantial effects on beneficiaries’ family members. Although in 2005
the effect is about 14 percent, after one year the effect stabilized around 5.5 percent
for the rest of the period.
Figure 2. Effect of JeA Program on the Likelihood of the Applicants’ Family
Members Committing a Crime.
(A) (B)
Notes: Figure 2 – Panel A shows the coefficient on the likelihood of committing a crime for all
participants divided by controls’ mean, adding information of criminals by year. Panel B is the same
but for participants’ family members.
-0.2
5-0
.20
-0.1
5-0
.10
-0.0
50.0
00.0
5
Coef/
Mean
2005 2006 2007 2008 2009 2010 2011 2012 2013 2014 2015 2016year
Coef/Mean 95% Confidence Interval
-0.2
5-0
.20
-0.1
5-0
.10
-0.0
50.0
00.0
5
2005 2006 2007 2008 2009 2010 2011 2012 2013 2014 2015 2016year
Coef/Mean 95% Confidence Interval

16
Additionally, in table 3, we split the sample of applicants’ family members by
the gender of the applicant (rows), and by the gender of the family member
(columns). The effects are stronger on male family members of female applicants.
About 20 percent of male family members of female training lottery losers commit
a crime, while male family members of female lottery winners are 6.4 percent less
likely to commit a crime, a difference that is statistically significant at the 5 percent
level.
Table 3. Effects of JeA on the Likelihood of the Applicants’ Family Members
Committing a Crime, by Applicant’s Gender.
Note: P-values are in brackets, while robust standard errors are in parentheses. All regressions
control for site-by-course fixed effects. Likewise, regressions include as control variables all
baseline variables included in Table 1, including, if the applicant lives in a low stratum, if they live
in a house or apartment, if the house is at risk, if the family owns the house, household head
education, age of head of household, number of children under 5 years of age, and persons over 65
years of age, the score of SISBEN and its square, if the participant is the head of the household, and
if the participant is the spouse of the head of the household. The dependent variable is a variable
equal to one if the individual committed a crime during the period of analysis (2005-2016) and zero
in any other case. *** Significant at the 1% level, ** Significant at the 5% level.
Control Means
Coefficient on
being offered
trainning
Effect (%) Control Means
Coefficient on
being offered
trainning
Effect (%) Control Means
Coefficient on
being offered
trainning
Effect (%)
0.128 -0.010*** -7.75 0.050 -0.003 -6.91 0.201 -0.013** -6.55
(0.334) (0.003) (0.218) (0.003) (0.401) (0.005)
21753 45017 10466 22190 11287 22827
0.098 -0.007* -7.11 0.049 -0.006 -11.89 0.155 -0.007 -4.41
(0.297) (0.004) (0.216) (0.004) (0.362) (0.007)
11512 20344 6197 11041 5315 9303
0.128 -0.008*** -6.49 0.050 -0.003 -5.49 0.201 -0.013** -6.42
(0.334) (0.003) (0.218) (0.003) (0.401) (0.005)
21753 45017 10466 22190 11287 22827
0.098 -0.005 -5.34 0.049 -0.005 -10.50 0.155 -0.005 -3.19
(0.297) (0.004) (0.216) (0.004) (0.362) (0.007)
11512 20344 6197 11041 5315 9303
All Women Men
Women
Women
Men
PANEL A WITHOUT CONTROLS
PANEL B WITH CONTROLS
Men
Gender of the
applicant

17
In addition, in table 4 we divided the sample of participants’ family members
by those younger and older than the applicant (rows), and by the gender of the
family member (columns). Male family members that are younger than the
applicant are 12.6 percent less likely to commit a crime (reference mean is 15.5
percent), a difference that is statistically significant at the 1 percent level.
Table 4. Effects of JeA on the Likelihood of the Applicants’ Family Members
Committing a Crime, by applicant’s age.
Note: P-values are in brackets, while robust standard errors are in parentheses. All regressions
control for site-by-course fixed effects. Likewise, regressions include as control variables all
baseline variables included in Table 1, including, if the applicant lives in a low stratum, if they live
in a house or apartment, if the house is at risk, if the family owns the house, household head
education, age of head of household, number of children under 5 years of age, and persons over 65
years of age, the score of SISBEN and its square, if the participant is the head of the household, and
if the participant is the spouse of the head of the household. The dependent variable is a variable
equal to one if the individual committed a crime during the period of analysis (2005-2016) and zero
in any other case. *** Significant at the 1% level, ** Significant at the 5% level.
Control Means
Coefficient on
being offered
trainning
Effect (%) Control Means
Coefficient on
being offered
trainning
Effect (%) Control Means
Coefficient on
being offered
trainning
Effect (%)
0.098 -0.017*** -17.30 0.032 -0.005 -16.46 0.155 -0.025*** -16.43
(0.297) (0.004) (0.175) (0.003) (0.362) (0.006)
11938 22909 5537 10742 6401 12167
0.129 -0.005* -4.13 0.059 -0.004 -7.59 0.206 -0.004 -1.72
(0.335) (0.003) (0.235) (0.003) (0.404) (0.005)
21327 42452 11126 22489 10201 19963
0.098 -0.013*** -12.82 0.032 -0.004 -13.29 0.155 -0.019*** -12.57
(0.297) (0.004) (0.175) (0.003) (0.362) (0.006)
11938 22909 5537 10742 6401 12167
0.129 -0.004 -2.86 0.059 -0.004 -6.64 0.206 -0.003 -1.47
(0.335) (0.003) (0.235) (0.003) (0.404) (0.005)
21327 42452 11126 22489 10201 19963
All Women Men
Applicant older
than family member
Age of the applicant
Applicant older
than family member
Applicant younger
than family member
PANEL A WITHOUT CONTROLS
PANEL B WITH CONTROLS
Applicant younger
than family member

18
C. Heterogeneous Effects of the JeA program on Crime
In this section, we analyze the possible heterogeneous effects of the program. When
we split the sample between households living in extreme poverty and poverty9 (see
table 5), the effect on participant’s family members is only statistically significant
for individuals in households in extreme poverty. About eleven percent of
participant’s family members of training lottery losers in extreme poverty commit
a crime, while lottery winners’ relatives in extreme poverty are 7.9 percent less
likely to commit a crime, a difference that is statistically significant at the 1 percent
level.
Table 5. Effects of JeA on the Likelihood of Committing a Crime by Sisben Score
Note: P-values are in brackets, while robust standard errors are in parentheses. All regressions
control for site-by-course fixed effects. Likewise, regressions include as control variables all
baseline variables included in Table 1, including, if the applicant lives in a low stratum, if they live
in a house or apartment, if the house is at risk, if the family owns the house, household head
education, age of head of household, number of children under 5 years of age, and persons over 65
years of age, the score of SISBEN and its square, if the participant is the head of the household, and
9 Extreme poverty is defined as SISBEN index less or equal to 11, while poverty is defined as
SISBEN index greater than 11.
Control Means
Coefficient on
being offered
trainning
Effect (%) Control Means
Coefficient on
being offered
trainning
Effect (%)
0.100 -0.008*** -8.05 0.105 -0.003 -2.60
(0.300) (0.003) (0.306) (0.003)
22801 43475 20970 42434
0.054 -0.004 -8.12 0.052 0.004 8.43
(0.225) (0.004) (0.222) (0.005)
5407 10270 5099 10278
0.114 -0.009*** -7.90 0.122 -0.005 -4.40
(0.318) (0.003) (0.327) (0.004)
17394 33205 15871 32156
Applicants
Family member
Score <= 11 Score > 11
All

19
if the participant is the spouse of the head of the household. The dependent variable is a variable
equal to one if the individual committed a crime during the period of analysis (2005-2016) and zero
in any other case. *** Significant at the 1% level, ** Significant at the 5% level.
In addition, if we split the sample by the education of the head of the household
(see Table 6); we find that the effect is only statistically significant for family
members in households with heads holding incomplete high school studies or less.
11.8 percent of participant’s family members of training lottery losers in
households with heads holding incomplete high school studies or less commit a
crime, while lottery winners’ relatives in the same type of households are 6.8
percent less likely to commit a crime, a difference that is statistically significant at
the 1 percent level.
Table 6. Effects of JeA on the Likelihood of Committing a Crime by Household
Head Education
Note: P-values are in brackets, while robust standard errors are in parentheses. All regressions
control for site-by-course fixed effects. Likewise, regressions include as control variables all
baseline variables included in Table 1, including, if the applicant lives in a low stratum, if they live
in a house or apartment, if the house is at risk, if the family owns the house, household head
education, age of head of household, number of children under 5 years of age, and persons over 65
Control Means
Coefficient on
being offered
trainning
Effect (%) Control Means
Coefficient on
being offered
trainning
Effect (%)
0.103 -0.006*** -5.98 0.099 -0.001 -0.58
(0.304) (0.002) (0.299) (0.006)
38707 75745 5064 10164
0.053 0.000 0.36 0.051 0.002 3.15
(0.224) (0.003) (0.220) (0.008)
9001 17489 1505 3059
0.118 -0.008*** -6.81 0.119 -0.002 -1.31
(0.322) (0.002) (0.324) (0.008)
29706 58256 3559 7105
Applicants
Family member
Less than 11 year of education 11 year and over of education
All

20
years of age, the score of SISBEN and its square, if the participant is the head of the household, and
if the participant is the spouse of the head of the household. The dependent variable is a variable
equal to one if the individual committed a crime during the period of analysis (2005-2016) and zero
in any other case. *** Significant at the 1% level, ** Significant at the 5% level.
The evidence suggest that the most likely channel at work to explain the effect of
the JeA program on the likelihood of the applicants’ family members committing a
crime, would be the income effect due to higher family income from lottery
winners’ higher earnings. In order to check this hypothesis, we explore the effect
of the training program on formal and informal employment, and enrollment on
higher education. The income effect hypothesis is consistent with a negative effect
on employment and a positive effect on enrollment in higher education of
participants’ family members.
D. Effects on formal and informal employment
If the income effect, due to higher earnings of lottery winners, is the main channel
at work, additionally to the effects on crime, one might also expect a reduction in
the employment either on the formal or informal labor market. Kugler et al. (2015),
using a random subset of approximately 4000 individuals of those who participated
in the 2005 experiment (i.e. original evaluation sample), did not find any effects on
family beneficiaries’ on formal employment. We revisited those results using the
family members of the entire cohort of eligible individual applicants who were part
of the 2005 randomization. Similar to Attanasio et al. (forthcoming), we track
formal employment of family applicants’ using the national information system
used by firms to file the mandatory contributions to health, pensions and disability
insurance they pay for their employees between January 2010 until December 2010.

21
Table 7 shows the results. Similar to Kugler et al. (2015), we do not find any effect
on formal employment.
Table 7. Effects of JeA on Formal Sector Employment of Applicants’ Family
Members, 2010
Note: P-values are in brackets, while robust standard errors are in parentheses. All regressions
control for site-by-course fixed effects. Likewise, regressions include as control variables all
baseline variables included in Table 1, including, if the applicant lives in a low stratum, if they live
in a house or apartment, if the house is at risk, if the family owns the house, household head
education, age of head of household, number of children under 5 years of age, and persons over 65
years of age, the score of SISBEN and its square, if the participant is the head of the household, and
if the participant is the spouse of the head of the household. The dependent variable is a variable
Control Means
Coefficient on
being offered
trainning
Control Means
Coefficient on
being offered
trainning
Control Means
Coefficient on
being offered
trainning
0.179 0.001 0.133 0.002 0.225 0.001
(0.383) (0.003) (0.340) (0.003) (0.417) (0.004)
[0.633] [0.660] [0.817]
372012 732816 186552 373404 185460 359412
0.184 0.001 0.130 0.005 0.234 -0.003
(0.388) (0.003) (0.337) (0.004) (0.423) (0.005)
[0.746] [0.208] [0.549]
243108 504816 116844 249072 126264 255744
0.169 0.002 0.139 -0.006 0.204 0.011
(0.375) (0.005) (0.346) (0.006) (0.403) (0.008)
[0.702] [0.318] [0.152]
128904 228000 69708 124332 59196 103668
0.196 0.002 0.141 0.002 0.253 0.003
(0.397) (0.003) (0.348) (0.004) (0.435) (0.005)
[0.465] [0.683] [0.573]
267696 532884 137892 279336 129804 253548
0.136 0.002 0.111 0.000 0.157 0.003
(0.342) (0.004) (0.314) (0.006) (0.364) (0.006)
[0.603] [0.939] [0.615]
104316 199932 48660 94068 55656 105864
Male
participant
Participant is
younger
Participant is
older
All Women Men
All
Female
participant
22
equal to one if the individual worked in a formal job during 2010 and zero in any other case. ***
Significant at the 1% level, ** Significant at the 5% level.
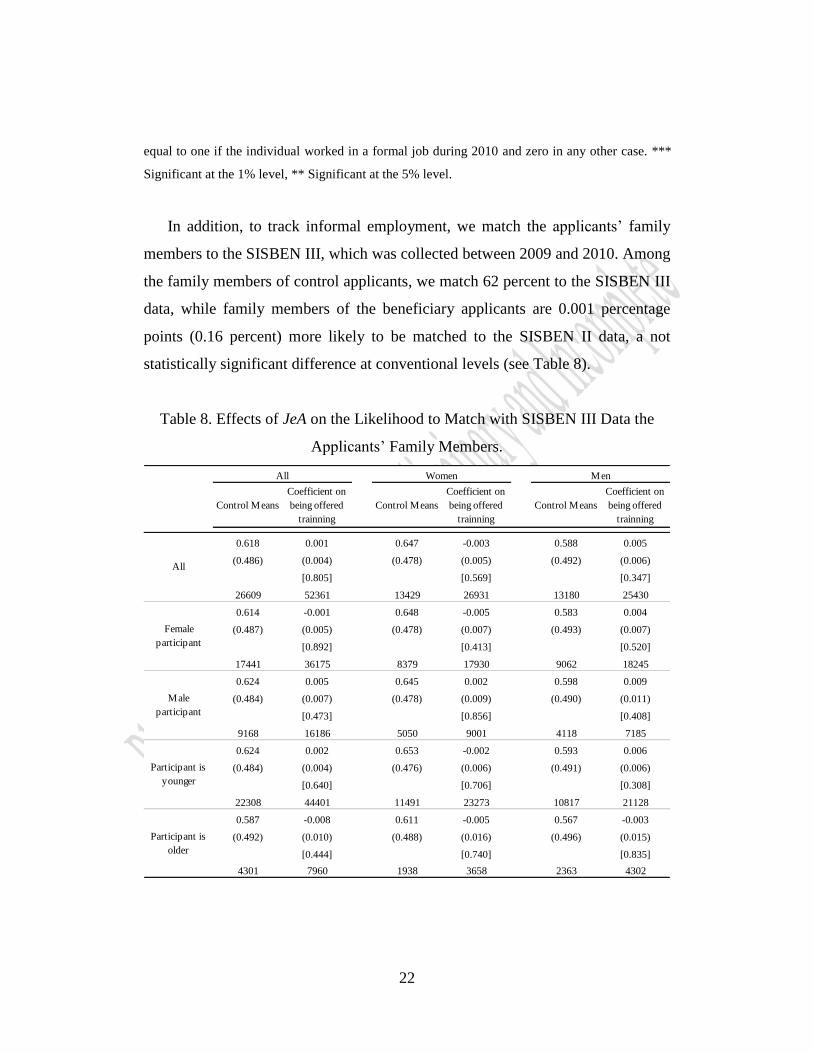
In addition, to track informal employment, we match the applicants’ family
members to the SISBEN III, which was collected between 2009 and 2010. Among
the family members of control applicants, we match 62 percent to the SISBEN III
data, while family members of the beneficiary applicants are 0.001 percentage
points (0.16 percent) more likely to be matched to the SISBEN II data, a not
statistically significant difference at conventional levels (see Table 8).
Table 8. Effects of JeA on the Likelihood to Match with SISBEN III Data the
Applicants’ Family Members.
Control Means
Coefficient on
being offered
trainning
Control Means
Coefficient on
being offered
trainning
Control Means
Coefficient on
being offered
trainning
0.618 0.001 0.647 -0.003 0.588 0.005
(0.486) (0.004) (0.478) (0.005) (0.492) (0.006)
[0.805] [0.569] [0.347]
26609 52361 13429 26931 13180 25430
0.614 -0.001 0.648 -0.005 0.583 0.004
(0.487) (0.005) (0.478) (0.007) (0.493) (0.007)
[0.892] [0.413] [0.520]
17441 36175 8379 17930 9062 18245
0.624 0.005 0.645 0.002 0.598 0.009
(0.484) (0.007) (0.478) (0.009) (0.490) (0.011)
[0.473] [0.856] [0.408]
9168 16186 5050 9001 4118 7185
0.624 0.002 0.653 -0.002 0.593 0.006
(0.484) (0.004) (0.476) (0.006) (0.491) (0.006)
[0.640] [0.706] [0.308]
22308 44401 11491 23273 10817 21128
0.587 -0.008 0.611 -0.005 0.567 -0.003
(0.492) (0.010) (0.488) (0.016) (0.496) (0.015)
[0.444] [0.740] [0.835]
4301 7960 1938 3658 2363 4302
Male
participant
Participant is
younger
Participant is
older
All Women Men
All
Female
participant

23
Note: P-values are in brackets, while robust standard errors are in parentheses. All regressions
control for site-by-course fixed effects. Likewise, regressions include as control variables all
baseline variables included in Table 1, including, if the applicant lives in a low stratum, if they live
in a house or apartment, if the house is at risk, if the family owns the house, household head
education, age of head of household, number of children under 5 years of age, and persons over 65
years of age, the score of SISBEN and its square, if the participant is the head of the household, and
if the participant is the spouse of the head of the household. The dependent variable is a variable
equal to one if the individual matched with Sisben III data in 2010 and zero in any other case. ***
Significant at the 1% level, ** Significant at the 5% level.
Table 9 shows the impacts on informal sector employment for family members
of the participants. The effects of the training program are not significant on the
sample that include all applicants’ family members. Nonetheless, we found
negative and significant effects on applicants’ family members that are younger
than the applicant, and on male applicants’ family members. Applicants’ family
members that are younger than the applicant are 6.1 percent less likely to work in
the informal market (reference mean is 23.1 percent), a difference that is
statistically significant at the 5 percent level. Similarly, family members of male
applicants are 6.2 percent less likely to work in the informal market (reference mean
is 32.4 percent), a difference that is statistically significant at the 1 percent level.
Similar to the case on crime, and not surprisingly given the low socioeconomic
strata of applicants, the income effect is reflected on informal work even though
there are no effects on formal markets. The income effect on informal work seems
to be important on family members that are younger than the applicant, and family
members of male applicants.

24
Table 9. Effects of JeA on Informal Sector Employment of Applicants’ Family
Members.
Note: P-values are in brackets, while robust standard errors are in parentheses. All regressions
control for site-by-course fixed effects. Likewise, regressions include as control variables all
baseline variables included in Table 1, including, if the applicant lives in a low stratum, if they live
in a house or apartment, if the house is at risk, if the family owns the house, household head
education, age of head of household, number of children under 5 years of age, and persons over 65
years of age, the score of SISBEN and its square, if the participant is the head of the household, and
if the participant is the spouse of the head of the household. The dependent variable is a variable
equal to one if the individual worked in a informal job during 2010 and zero in any other case. ***
Significant at the 1% level, ** Significant at the 5% level.
Control Means
Coefficient on
being offered
trainning
Control Means
Coefficient on
being offered
trainning
Control Means
Coefficient on
being offered
trainning
0.339 -0.006 0.231 -0.006 0.457 -0.006
(0.474) (0.004) (0.421) (0.005) (0.498) (0.007)
[0.144] [0.301] [0.401]
20453 43933 10638 23133 9815 20800
0.347 0.000 0.230 0.000 0.465 0.000
(0.476) (0.005) (0.421) (0.007) (0.499) (0.008)
[0.969] [0.942] [0.984]
13307 30202 6677 15471 6630 14731
0.324 -0.020*** 0.232 -0.018* 0.439 -0.020
(0.468) (0.008) (0.422) (0.010) (0.496) (0.012)
[0.007] [0.057] [0.106]
7146 13731 3961 7662 3185 6069
0.390 -0.003 0.264 -0.004 0.538 0.000
(0.488) (0.005) (0.441) (0.007) (0.499) (0.008)
[0.533] [0.541] [0.956]
13912 30306 7501 16436 6411 13870
0.231 -0.014** 0.151 -0.013 0.304 -0.013
(0.421) (0.007) (0.359) (0.009) (0.460) (0.010)
[0.038] [0.128] [0.223]
6541 13627 3137 6697 3404 6930
Male
Applicant
Applicant is
younger than
family member
Applicant is
older than
family member
All Women Men
All
Female
Applicant

25
A. Effects on Higher Education Enrollment
We also estimate the training impacts on higher education enrolment using
applicants and their family members in the entire cohort of eligible individual
applicants who were part of the 2005 randomization. We track higher education
enrolment of participants and their family members using the System for Dropout
Prevention and Analysis in Higher Education Institutions (SPADIES by its
acronym in Spanish), for the period 2006-2012.
Similar to Kugler et al. (2015), we find that both participants and their family
members increase tertiary education access (see Table 10). Applicants are 24.2
percent more likely to enroll in higher education while their family members are
10.13 percent more likely to enroll in higher education (reference mean is 7.8 and
3.6 percent respectively), a difference that is statistically significant at the 1 percent
level. The effects are similar for male and females.
Table 10. Effects of JeA on Higher Education Enrollment. Applicants and their
Family Members.
Control Means
Coefficient on
being offered
trainning
Effect (%) Control Means
Coefficient on
being offered
trainning
Effect (%) Control Means
Coefficient on
being offered
trainning
Effect (%)
0.046 0.0085*** 18.50 0.047 0.0085*** 18.09 0.045 0.0084*** 18.79
(0.210) (0.0014) (0.212) (0.0019) (0.207) (0.0021)
43771 85909 23714 47829 20057 38080
0.078 0.0215*** 27.40 0.072 0.0202*** 27.99 0.091 0.0246*** 26.96
(0.269) (0.0037) (0.259) (0.0042) (0.288) (0.0074)
10506 20548 7051 14598 3455 5950
0.036 0.0046*** 12.84 0.037 0.0037* 10.02 0.035 0.0052*** 14.95
(0.186) (0.0014) (0.188) (0.0020) (0.184) (0.0020)
33265 65361 16663 33231 16602 32130
0.046 0.0072*** 15.62 0.047 0.0073*** 15.47 0.045 0.0070*** 15.71
(0.210) (0.0014) (0.212) (0.0019) (0.207) (0.0020)
43771 85909 23714 47829 20057 38080
0.078 0.0190*** 24.20 0.072 0.0178*** 24.67 0.091 0.0218*** 23.92
(0.269) (0.0037) (0.259) (0.0042) (0.288) (0.0074)
10506 20548 7051 14598 3455 5950
0.036 0.0036*** 10.13 0.037 0.0027 7.39 0.035 0.0042** 11.89
(0.186) (0.0014) (0.188) (0.0020) (0.184) (0.0020)
33265 65361 16663 33231 16602 32130
All Women Men
All
All
Applicants
Family member
PANEL A WITHOUT CONTROLS
PANEL B WITH CONTROLS
Applicants
Family member

26
In addition, in table 11 (rows), we divided the sample of the applicants’ family
members by those younger and older than the applicant, and by the gender of the
applicant. In the columns, we present the results for all family members, and by the
gender of the family member. The effects are mainly concentrated in female family
members that are younger than the applicant. In particular, female family members
that are younger than the applicant are 27.5 percent more likely to enroll in higher
education, a difference that is statistically significant at the 5 percent level.
Table 11. Effects of JeA on Higher Education Enrollment, Applicants’ Family
Members
Control Means
Coefficient on
being offered
trainning
Control Means
Coefficient on
being offered
trainning
Control Means
Coefficient on
being offered
trainning
0.036 0.0036*** 0.037 0.0027 0.035 0.0042**
(0.186) (0.0014) (0.188) (0.0020) (0.184) (0.0020)
[0.009] [0.173] [0.035]
33265 65361 16663 33231 16602 32130
0.033 0.0031* 0.033 0.0024 0.032 0.0033
(0.178) (0.0016) (0.180) (0.0024) (0.176) (0.0023)
[0.059] [0.303] [0.149]
21753 45017 10466 22190 11287 22827
0.042 0.0048* 0.042 0.0033 0.042 0.0062
(0.200) (0.0026) (0.201) (0.0036) (0.200) (0.0039)
[0.068] [0.358] [0.106]
11512 20344 6197 11041 5315 9303
0.015 0.0029** 0.012 0.0033** 0.018 0.0025
(0.122) (0.0011) (0.111) (0.0014) (0.132) (0.0017)
[0.010] [0.020] [0.152]
22308 44408 11491 23279 10817 21129
0.078 0.0058 0.090 0.0014 0.068 0.0087*
(0.269) (0.0037) (0.287) (0.0057) (0.251) (0.0048)
[0.111] [0.812] [0.068]
10957 20953 5172 9952 5785 11001
Male
Applicant
Applicant is
younger than
family member
Applicant is
older than
family member
All Women Men
All
Female
Applicant

27
B. Effects on the Numebr of Years of Education
We use information from the Sisben III to estimate the effects of the JeA program
on the number of years of education of applicants’ family members. We find
positive and significant effect of the program on the beneficiary applicants’ female
relatives, who have 1 percent more years of education than the non beneficiary
applicants’ female relatives (Table 12). The effect is particularly significant for the
beneficiary applicants’ female relatives who are younger than the applicant, who
have 1.1 percent more years of education.
In addition, Table 13 shows that the beneficiary applicants’ family members are
also more likely to graduate from high school, an effect that is particularly
important and significant for the beneficiary applicants’ male family members who
are younger than the applicant, who are 5.7 percent more likely to graduate from
high school.
In short, we find that the program had positive and significant effects on the
education attainment of applicants’ family members: those older are more likely to
be enrolled in higher education while those younger have more years of education
and are more likely to graduate from high school.

28
Table 12. Effects of JeA on Years of Education, Applicants’ Family Members
Note: P-values are in brackets, while robust standard errors are in parentheses. All regressions
control for site-by-course fixed effects. Likewise, regressions include as control variables all
baseline variables included in Table 1, including, if the applicant lives in a low stratum, if they live
in a house or apartment, if the house is at risk, if the family owns the house, household head
education, age of head of household, number of children under 5 years of age, and persons over 65
years of age, the score of SISBEN and its square, if the participant is the head of the household, and
if the participant is the spouse of the head of the household. The dependent variable is obtained from
the SISBEN III. *** Significant at the 1% level, ** Significant at the 5% level.
Control Means
Coefficient on
being offered
trainning
Control Means
Coefficient on
being offered
trainning
Control Means
Coefficient on
being offered
trainning
7.229 0.041* 7.106 0.072** 7.363 0.004
(3.606) (0.022) (3.672) (0.030) (3.528) (0.033)
[0.064] [0.016] [0.900]
20453 43933 10638 23133 9815 20800
7.170 0.027 6.977 0.065* 7.365 -0.016
(3.622) (0.026) (3.706) (0.036) (3.525) (0.039)
[0.301] [0.070] [0.679]
13307 30202 6677 15471 6630 14731
7.339 0.069* 7.323 0.082 7.358 0.054
(3.573) (0.040) (3.604) (0.052) (3.535) (0.062)
[0.084] [0.117] [0.384]
7146 13731 3961 7662 3185 6069
6.347 0.006 6.128 0.048 6.602 -0.049
(3.586) (0.027) (3.568) (0.035) (3.590) (0.041)
[0.809] [0.179] [0.233]
13912 30306 7501 16436 6411 13870
9.106 0.102*** 9.443 0.111** 8.796 0.084
(2.851) (0.038) (2.745) (0.054) (2.911) (0.056)
[0.007] [0.042] [0.134]
6541 13627 3137 6697 3404 6930
Male
participant
Participant is
younger
Participant is
older
All Women Men
All
Female
participant

29
Table 13. Effects of JeA on High School Graduation, Applicants’ Family
Members
Note: P-values are in brackets, while robust standard errors are in parentheses. All regressions
control for site-by-course fixed effects. Likewise, regressions include as control variables all
baseline variables included in Table 1, including, if the applicant lives in a low stratum, if they live
in a house or apartment, if the house is at risk, if the family owns the house, household head
education, age of head of household, number of children under 5 years of age, and persons over 65
years of age, the score of SISBEN and its square, if the participant is the head of the household, and
if the participant is the spouse of the head of the household. The dependent variable is obtained from
the SISBEN III. *** Significant at the 1% level, ** Significant at the 5% level.
Control Means
Coefficient on
being offered
trainning
Control Means
Coefficient on
being offered
trainning
Control Means
Coefficient on
being offered
trainning
0.582 0.007** 0.562 0.008 0.601 0.007
(0.493) (0.004) (0.496) (0.005) (0.490) (0.005)
[0.048] [0.132] [0.194]
33265 65361 16663 33231 16602 32130
0.580 0.008* 0.555 0.011* 0.604 0.006
(0.494) (0.004) (0.497) (0.006) (0.489) (0.006)
[0.062] [0.086] [0.324]
21753 45017 10466 22190 11287 22827
0.585 0.005 0.574 0.002 0.597 0.008
(0.493) (0.006) (0.495) (0.009) (0.491) (0.010)
[0.456] [0.852] [0.389]
11512 20344 6197 11041 5315 9303
0.527 0.000 0.491 0.006 0.565 -0.006
(0.499) (0.004) (0.500) (0.006) (0.496) (0.006)
[0.948] [0.300] [0.342]
22308 44408 11491 23279 10817 21129
0.693 0.024*** 0.719 0.009 0.670 0.038***
(0.461) (0.006) (0.450) (0.009) (0.470) (0.009)
[0.000] [0.309] [0.000]
10957 20953 5172 9952 5785 11001
Male
participant
Participant is
younger
Participant is
older
All Women Men
All
Female
participant

30
IV. Conclusions
Jovenes en Accion is a vocational job training program, which has provided training
and experience in the workplace for young people living in poverty since the
beginning of 2000. In 2005, the JeA program distributed the program’s grants
through an experimental design where participation in the different training courses
was decided by means of lotteries, creating a perfect scenario for the identification
of the causal effects of the program in multiple outcomes. Attanasio et al. (2011)
developed the original evaluation of the program. Attanasio et al. (forthcoming)
and Kugler et al. (2015), explore its long-term effects on labor outcomes. In this
document, we evaluate its long-term impacts on crime among participants and
family members.
Although our results do not show any effect on crime among participants, mainly
due to the low crime incidence between them, we found strong negative effects on
participants’ family members. The effects are stronger among male family
members of female participants, and among male family members that are younger
than the participant. The heterogeneous effect shows that the impacts of the
program are more important in families in extreme poverty or in households where
the head has low level of education (less than 11 years of education).
We found significant effects of the program on higher education enrollment.
The effect on higher education enrollment is more important on female family
members that are older than the applicant. We also found positive and significant
effects on the number of years of education and the likelihood of graduating of high
school of applicants’ family members who are younger than them. The program
also has a negative effect on the likelihood of working in the informal sector, in
particular in family members that are younger than the applicant, and family
members of male applicants.

31
The evidence suggest that the most likely channel at work would be the income
effect due to higher family income from lottery winners’ higher earnings. The
higher income of the beneficiary applicants would allow their family members to
attain higher levels of education, moving them to work less in the informal sector
and preventing them from getting involved in illicit activities.
In addition to the positive direct and external effects found in previous
evaluations of the JeA program, this research presents evidence of additional
unintended effects of program on crime, by reducing the likelihood of applicants’
family members being arrested, increasing their likelihood of completing secondary
education, allowing them to have more years of education, and reducing the
likelihood of their working in the informal labor market, which in turn generates
additional evidence of the program’s long run social profitability.
References
Attanasio, O., Kugler, A. & Meghir, C. 2011. “Subsidizing Vocational Training
for Disadvantaged Youth in Colombia: Evidence from a Randomized Trial”
American Economic Journal: Applied Economics 3, (July): 188–220.
Attanasio, O., Guarín, A., Medina, C., & Meghir, C. (forthcoming). Vocational
Training for Disadvantaged Youth in Colombia: A Long Term Follow
Up. American Economic Journal: Applied Economics.
Becker, G. S., & Mulligan, C. B. (1997). The endogenous determination of time
preference. The Quarterly Journal of Economics, 112(3), 729-758.
Bettinger, E., Kremer, M., Kugler, M., Medina, C., Posso, C., y Saavedra, J.
(2016). Can Educational Voucher Programs Pay for Themselves?. Working
Paper.
Cullen, J. B., Jacob, B. A., & Levitt, S. (2006). The effect of school choice on
participants: Evidence from randomized lotteries. Econometrica, 74(5), 1191-

32
1230.
Deming, D. J. (2011). Better Schools, Less Crime?. The Quarterly Journal of
Economics, 126(4), 2063-2115.
DNP Departamento Nacional de Planeación. 2002. “Consultoría para la
evaluación de impacto del Subprograma Jóvenes en Acción – Capacitación
Laboral de Jóvenes Desempleados de Bajos Recursos de la Red de Apoyo Social,
1280-OCCO”, Call for Proposals.
DNP Departamento Nacional de Planeación. 2000a. “Plan Colombia, Red de
Apoyo Social: Programa Manos a la Obra. Componentes: Proyectos
Comunitarios y Vías Para la Paz” CONPES Policy Document No. 3075, March
15.
DNP Departamento Nacional de Planeación. 2000b. “Plan Colombia, Red de
Apoyo Social: Programas de Subsidios Condicionados y Capacitación Laboral
de Jóvenes Desempleados de Bajos Recursos” CONPES Policy Document No.
3081, June 28.
FIP Fondo de Inversión para la Paz, FIP, and Departamento Nacional de
Planeación, DNP. 2001. “Red de Apoyo Social, Subprograma Jóvenes en
Acción”, Operative Manual, August.
Hjalmarsson, R., Holmlund, H., & Lindquist, M. J. (2015). The Effect of
Education on Criminal Convictions and Incarceration: Causal Evidence from
Micro‐data. The Economic Journal, 125(587), 1290-1326.
Kugler, Adriana; Kugler, Maurice; Saavedra, Juan and Herrera Prada, Luis
Omar. 2015. “Long-term Direct and Spillover Effects of Job Training:
Experimental Evidence from Colombia”, NBER WP No. 21607 (October 2015).
Lochner, L. (2004). Education, work, and crime: A human capital approach.
International Economic Review, 45(3), 811-843.
Hjalmarsson, R., & Lochner, L. (2012). The impact of education on crime:
international evidence. DICE Report, 10(2), 49.

33
Lochner, L., & Moretti, E. (2004). The effect of education on crime: Evidence
from prison inmates, arrests, and self-reports. The American Economic
Review, 94(1), 155-189.
Lochner, L. (2011). Non-production benefits of education: Crime, health, and
good citizenship. NBER Working Paper No. 16722. National Bureau of
Economic Research.
Machin, S., Marie, O., & Vujić, S. (2011). The crime reducing effect of
education. The Economic Journal, 121(552), 463-484.
Machin, S., & Meghir, C. (2004). Crime and economic incentives. Journal of
Human Resources, 39(4), 958-979.
Medina, C., Posso, C. y Tamayo, J. A. (2016) “Who is Your Neighbor? The Effect
of Criminal Neighbors on Youth’s Criminality”, mimeo.
Medina, C., Posso, C. y Tamayo, J. A. (2011) Costos de la violencia urbana y
políticas públicas: algunas lecciones de Medellín. Revista Perspectivas sobre el
Desarrollo: Seguridad Ciudadana y Bienestar, CAF.
Meghir, C., Palme, M., & Schnabel, M. (2012). The Effect of Education Policy
on Crime: An Intergenerational Perspective. NBER Working Paper No. 18145.
National Bureau of Economic Research.
Romano, J.P. & Wolf, M. 2005. “Stepwise Multiple Testing as Formalized Data
Snooping” Econometrica 73, 1237–1282.
Romano, J.P.; Shaikh, A.M. & Wolf, M. 2008. “Formalized Data Snooping
Based On Generalized Error Rates” Econometric Theory, 24, 404-447.
Schochet, P. Z., Burghardt, J. & Glazerman, S. (2001). National Job Corps
Study: The Impacts of Job Corps on Participants’ Employment and Related
Outcomes. Mathematica Policy Research.