visualizing economic data using perl and html5's canvas a. sinan unur
TRANSCRIPT

Visualizing Economic Data Using Perl and HTML5's Canvas
A. Sinan Unurhttp://www.unur.com/sinan/
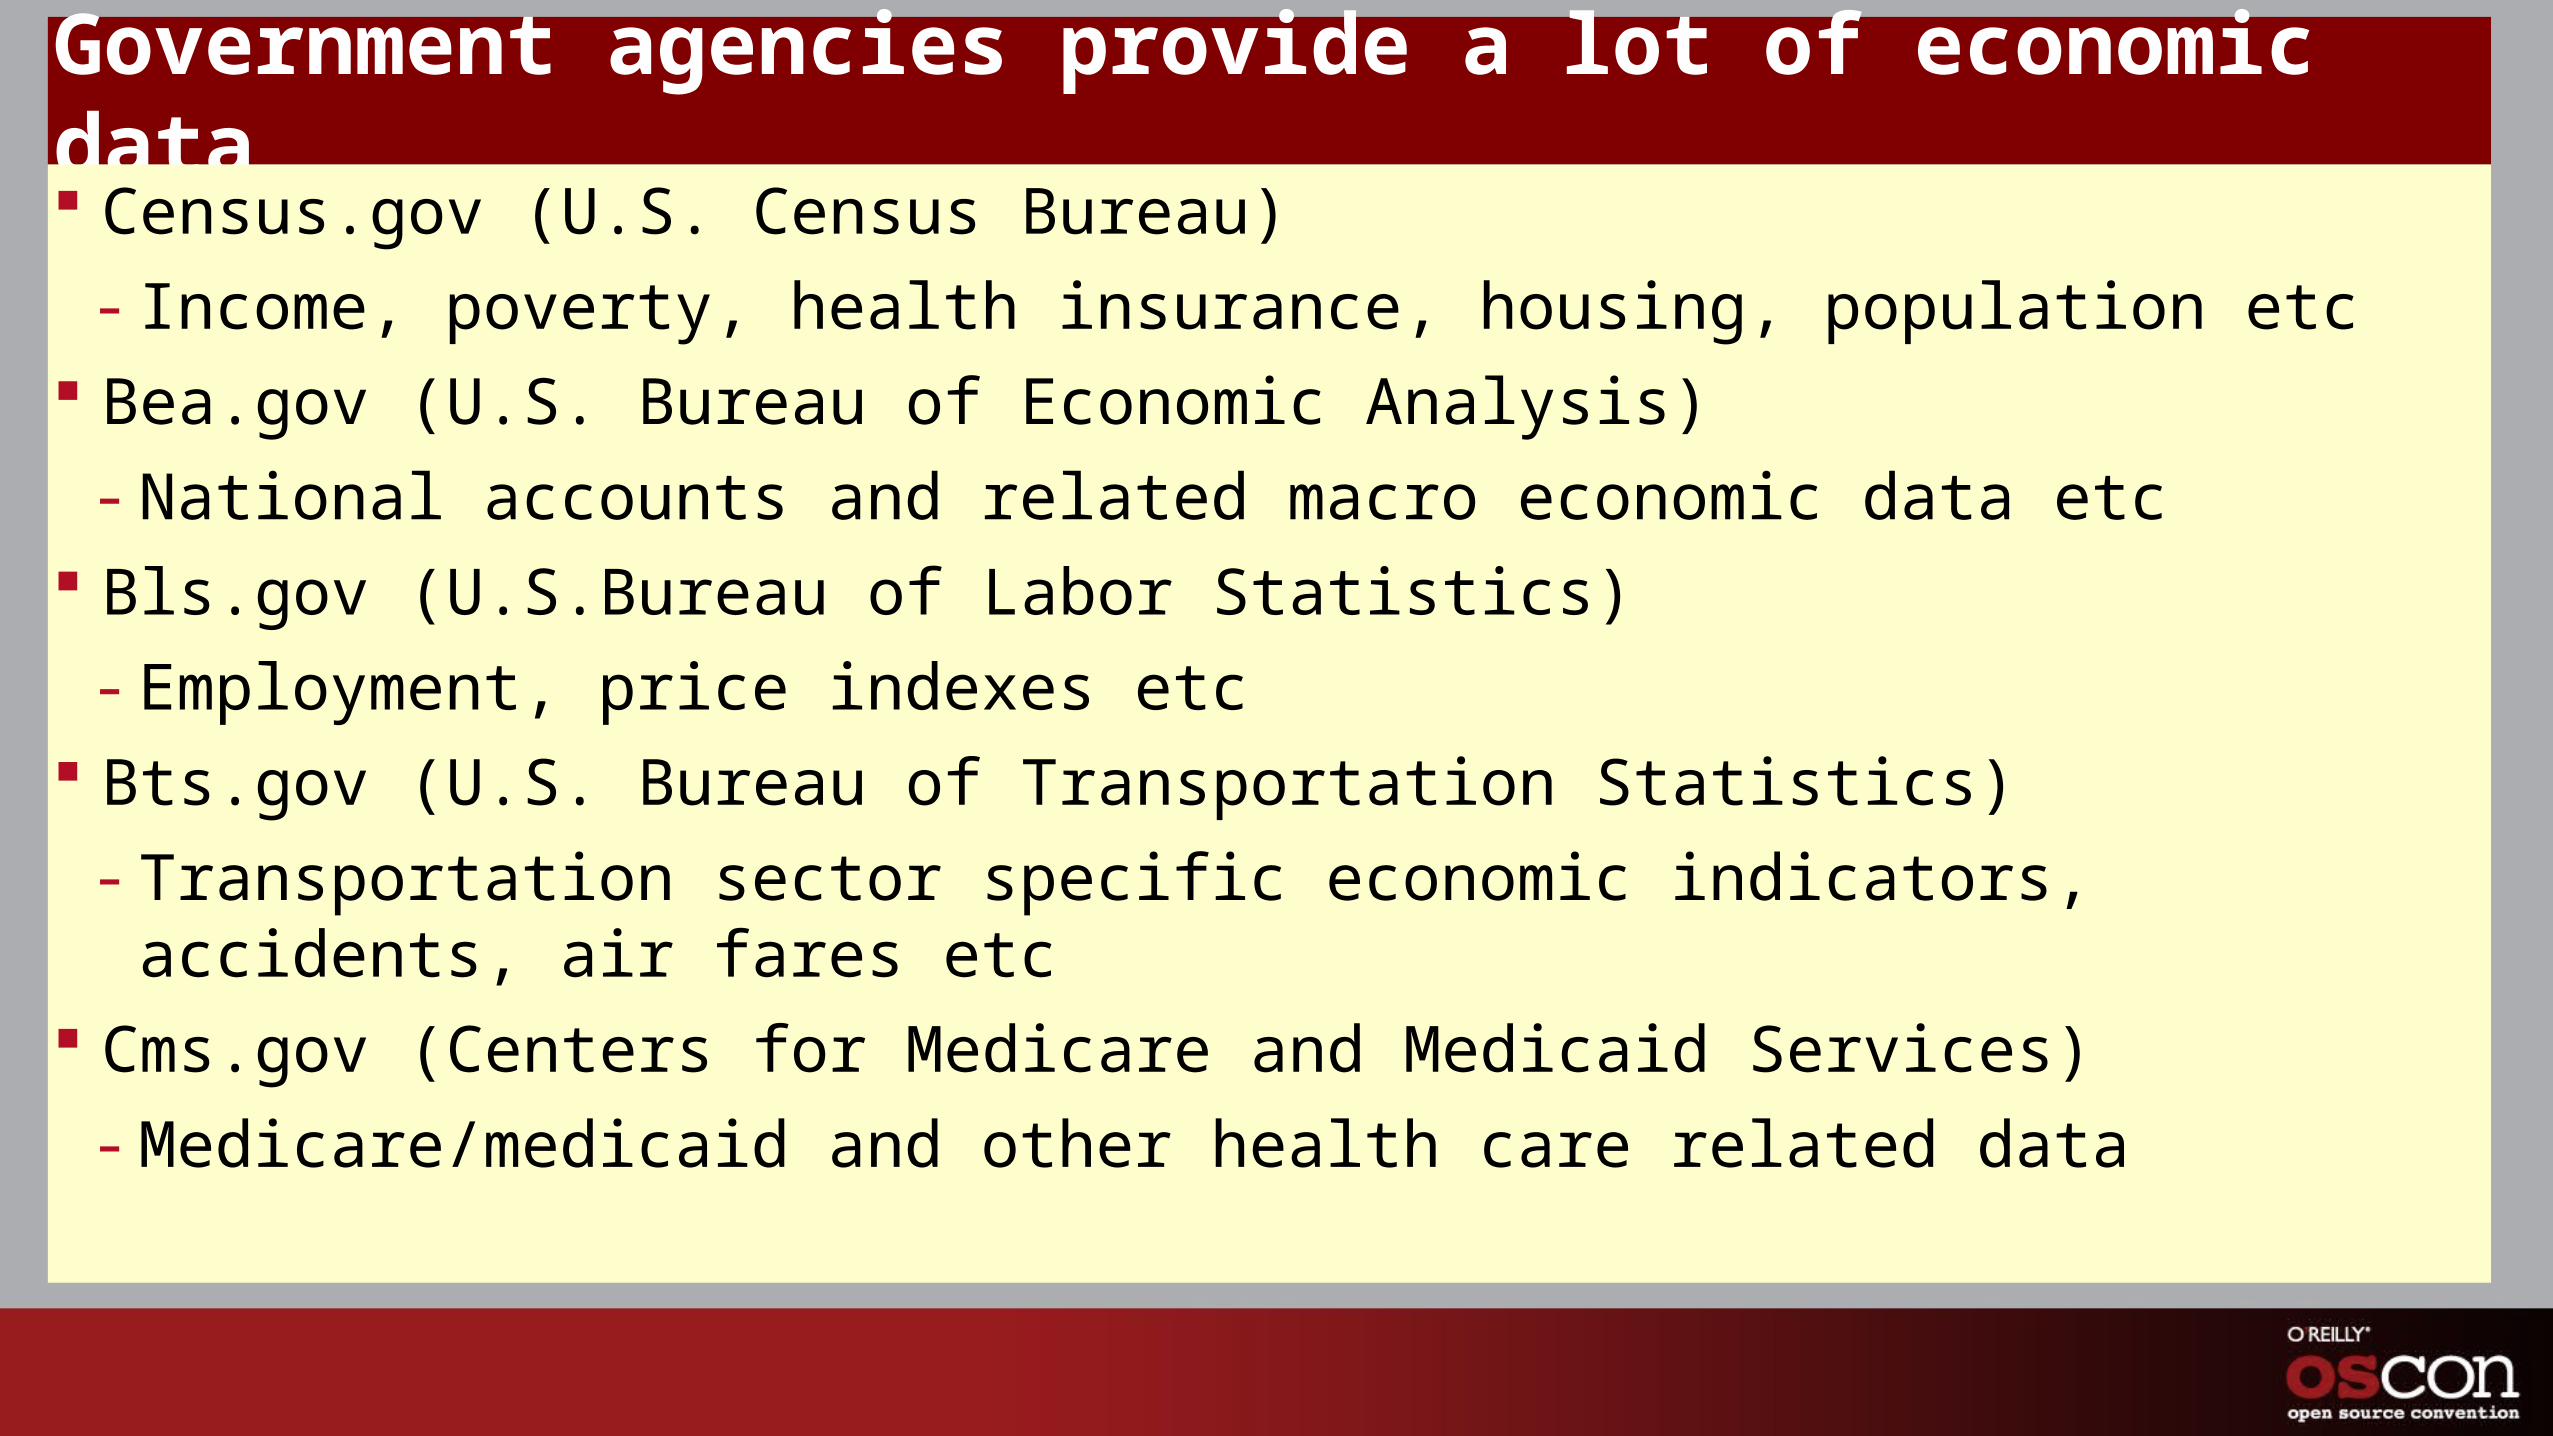
Government agencies provide a lot of economic data Census.gov (U.S. Census Bureau)
- Income, poverty, health insurance, housing, population etc Bea.gov (U.S. Bureau of Economic Analysis)
- National accounts and related macro economic data etc Bls.gov (U.S.Bureau of Labor Statistics)
- Employment, price indexes etc Bts.gov (U.S. Bureau of Transportation Statistics)
- Transportation sector specific economic indicators, accidents, air fares etc Cms.gov (Centers for Medicare and Medicaid Services)
- Medicare/medicaid and other health care related data

Utility of data provided by government agencies The detailed, raw or close to raw data provided by these agencies are invaluable to
researchers. Not easily accessible to the general public who lack the advanced statistical and
econometric tools and background to analyze them. Agencies also publish summary tables and graphs. Those are not very accessible either.

Bad apples (BTS) …
Uninformative
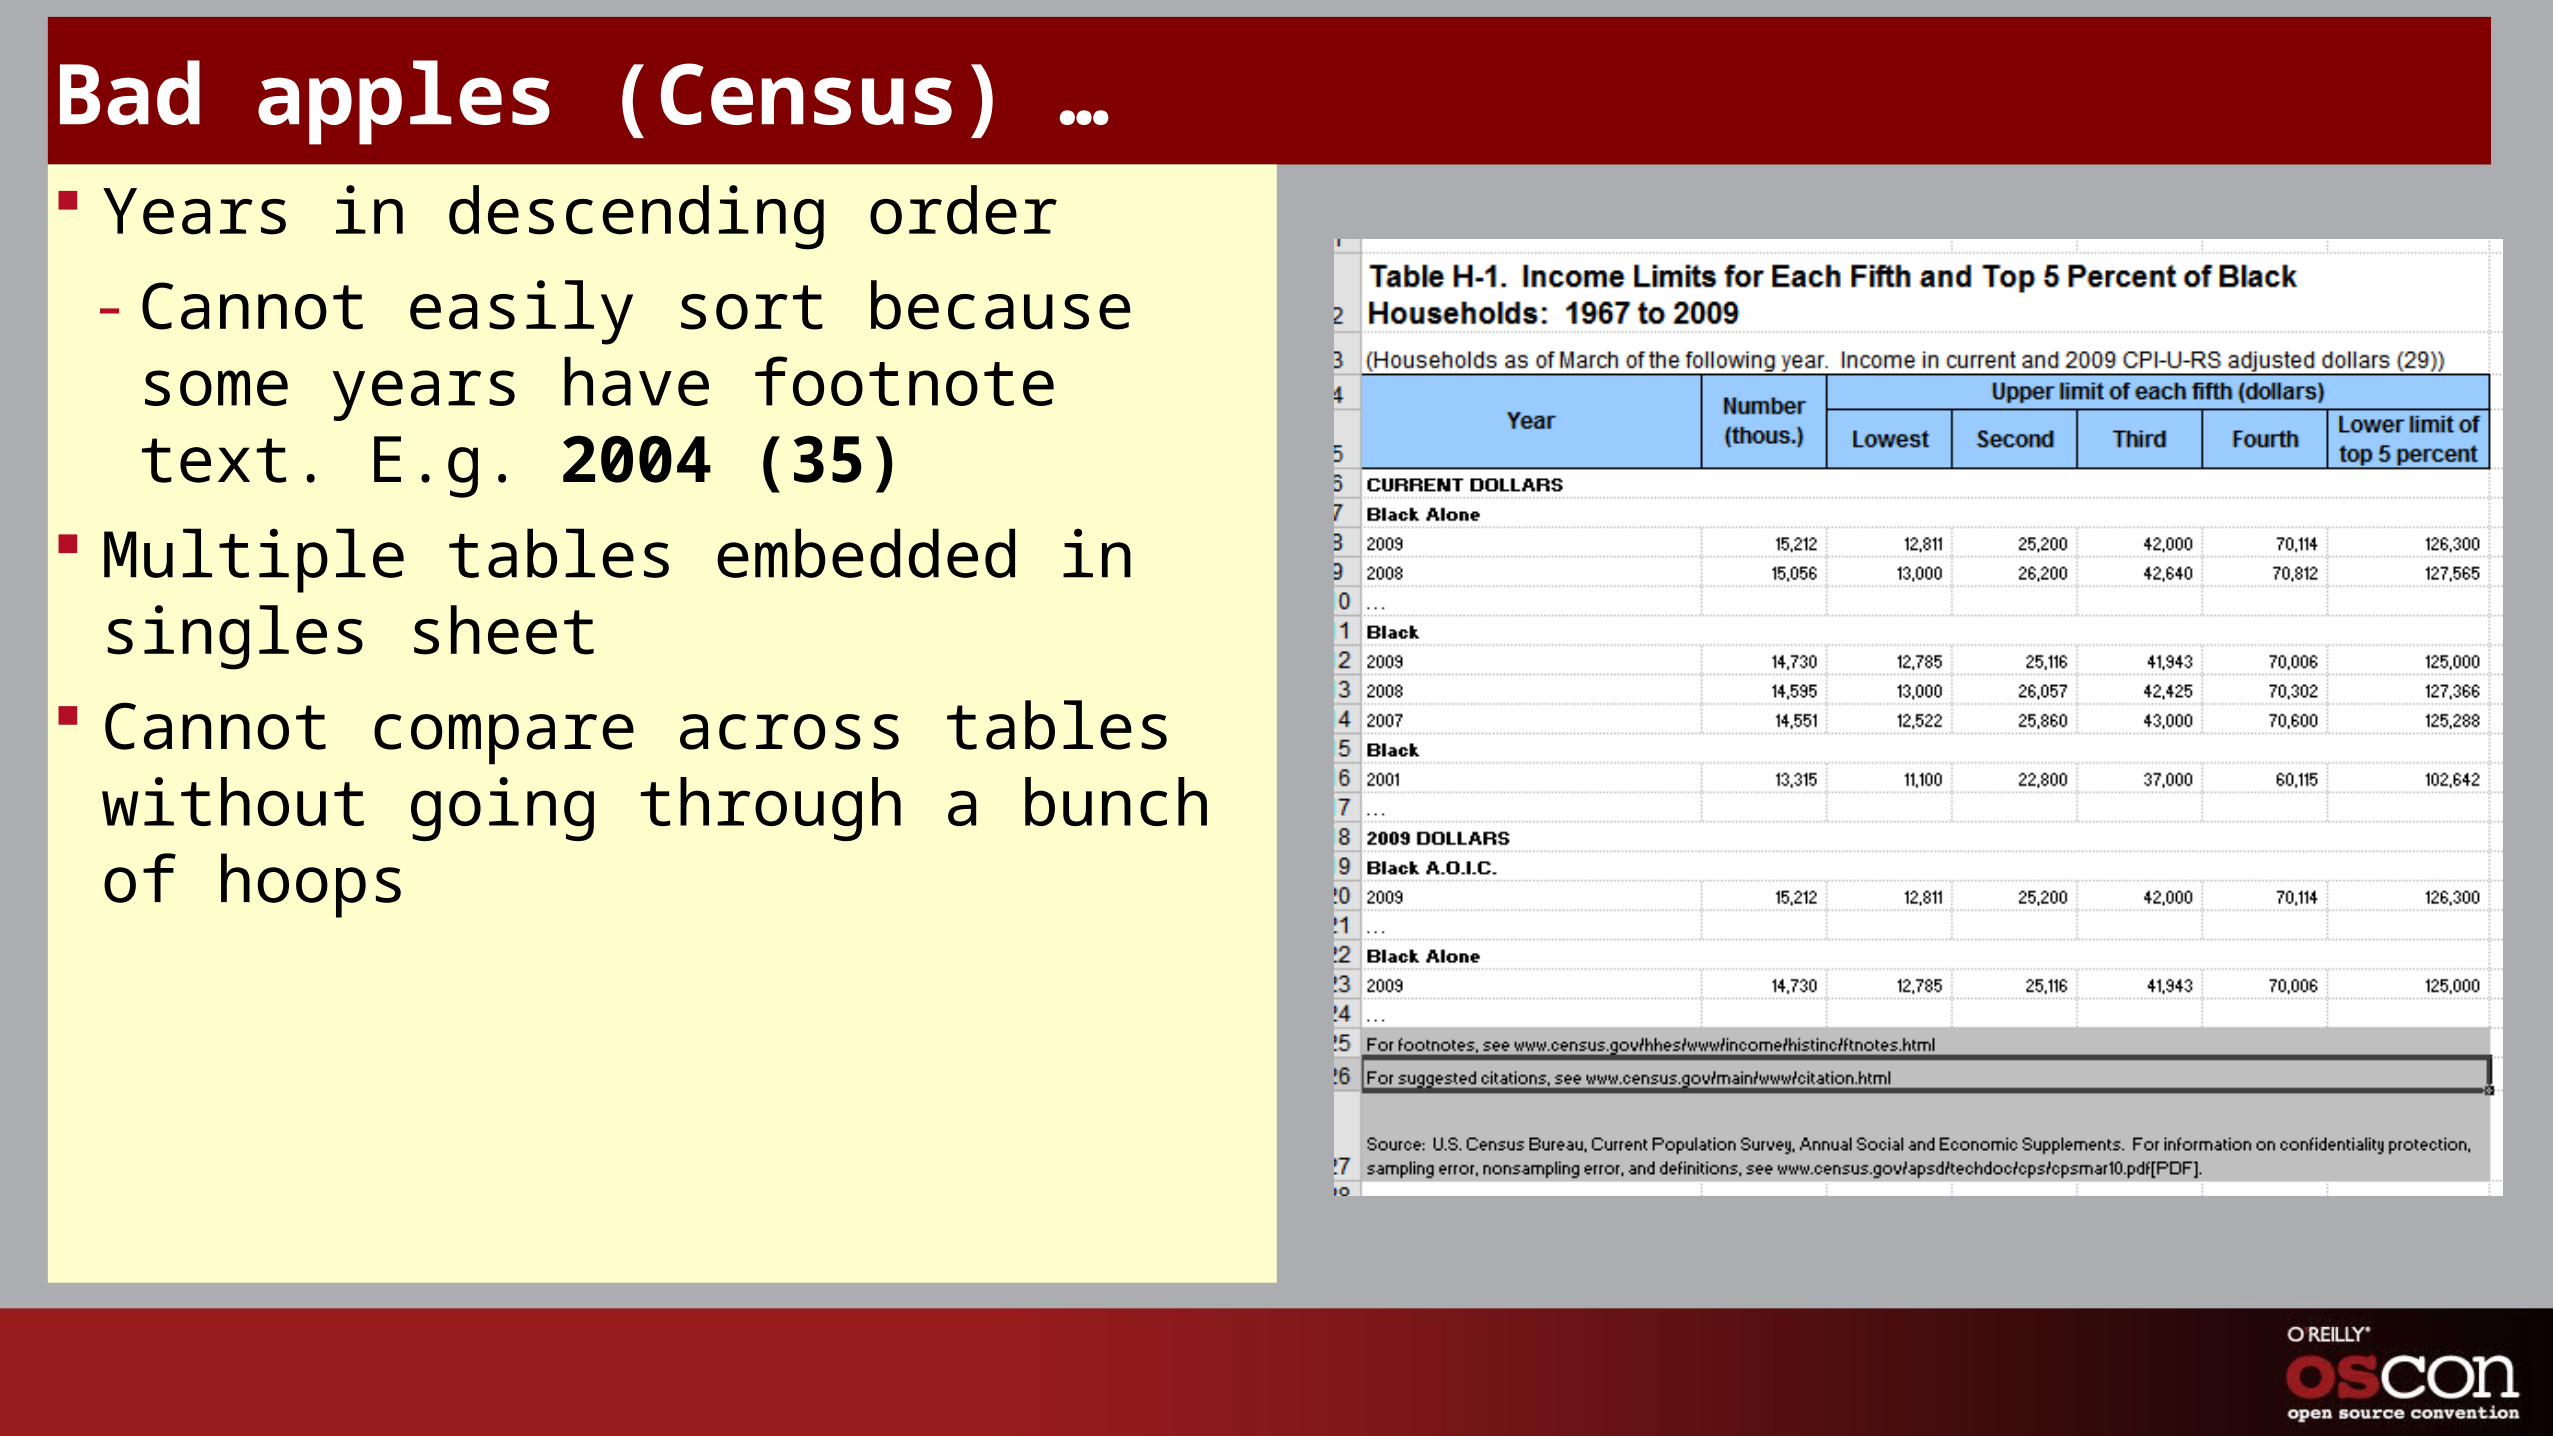
Bad apples (Census) … Years in descending order
- Cannot easily sort because some years have footnote text. E.g. 2004 (35)
Multiple tables embedded in singles sheet
Cannot compare across tables without going through a bunch of hoops

What if you want to do something with the data? Perl to the rescue
- Combine information from various tables spread over a number of files
- Put data in proper database tables
- Issue whatever queries you want
For data in Excel files, use Spreadsheet::ParseExcel For simple ad hoc databases, use SQLite in conjunction with DBI and DBD::SQLite Create accessible, structured HTML tables as output Turn HTML tables into charts using JavaScript and Canvas
Going to use some income data from the Census Bureau as a concrete example

Data source Historical income data from the Census Bureau
- http://www.census.gov/hhes/www/income/data/historical/index.html
- Households
- Quintiles of the income distribution
- Number of households in income brackets
- All pre-tax, pre-transfer

Spreadsheet::ParseExcel Reduce memory footprint and processing overhead using cell callbacks
my $parser = Spreadsheet::ParseExcel->new(
CellHandler => sub { $self->_cell_handler(@_) },
NotSetCell => 1,
);
$parser->parse($file);

Spreadsheet::ParseExcel Cell handler must detect
- Sub-tables
- Rows within sub-tables Cell handler creates record for each row, identifying main table (race, units), sub-
table etc so all data can be put into one table Parser is given a callback. Every time it has a complete record, cell handler invokes
call back with the record. Sheet contents are therefore not duplicated or even triplicated(?) in memory. Once all related data are in a database table, we can do things like compare the
second quintile of the income distribution across sub-groups etc.
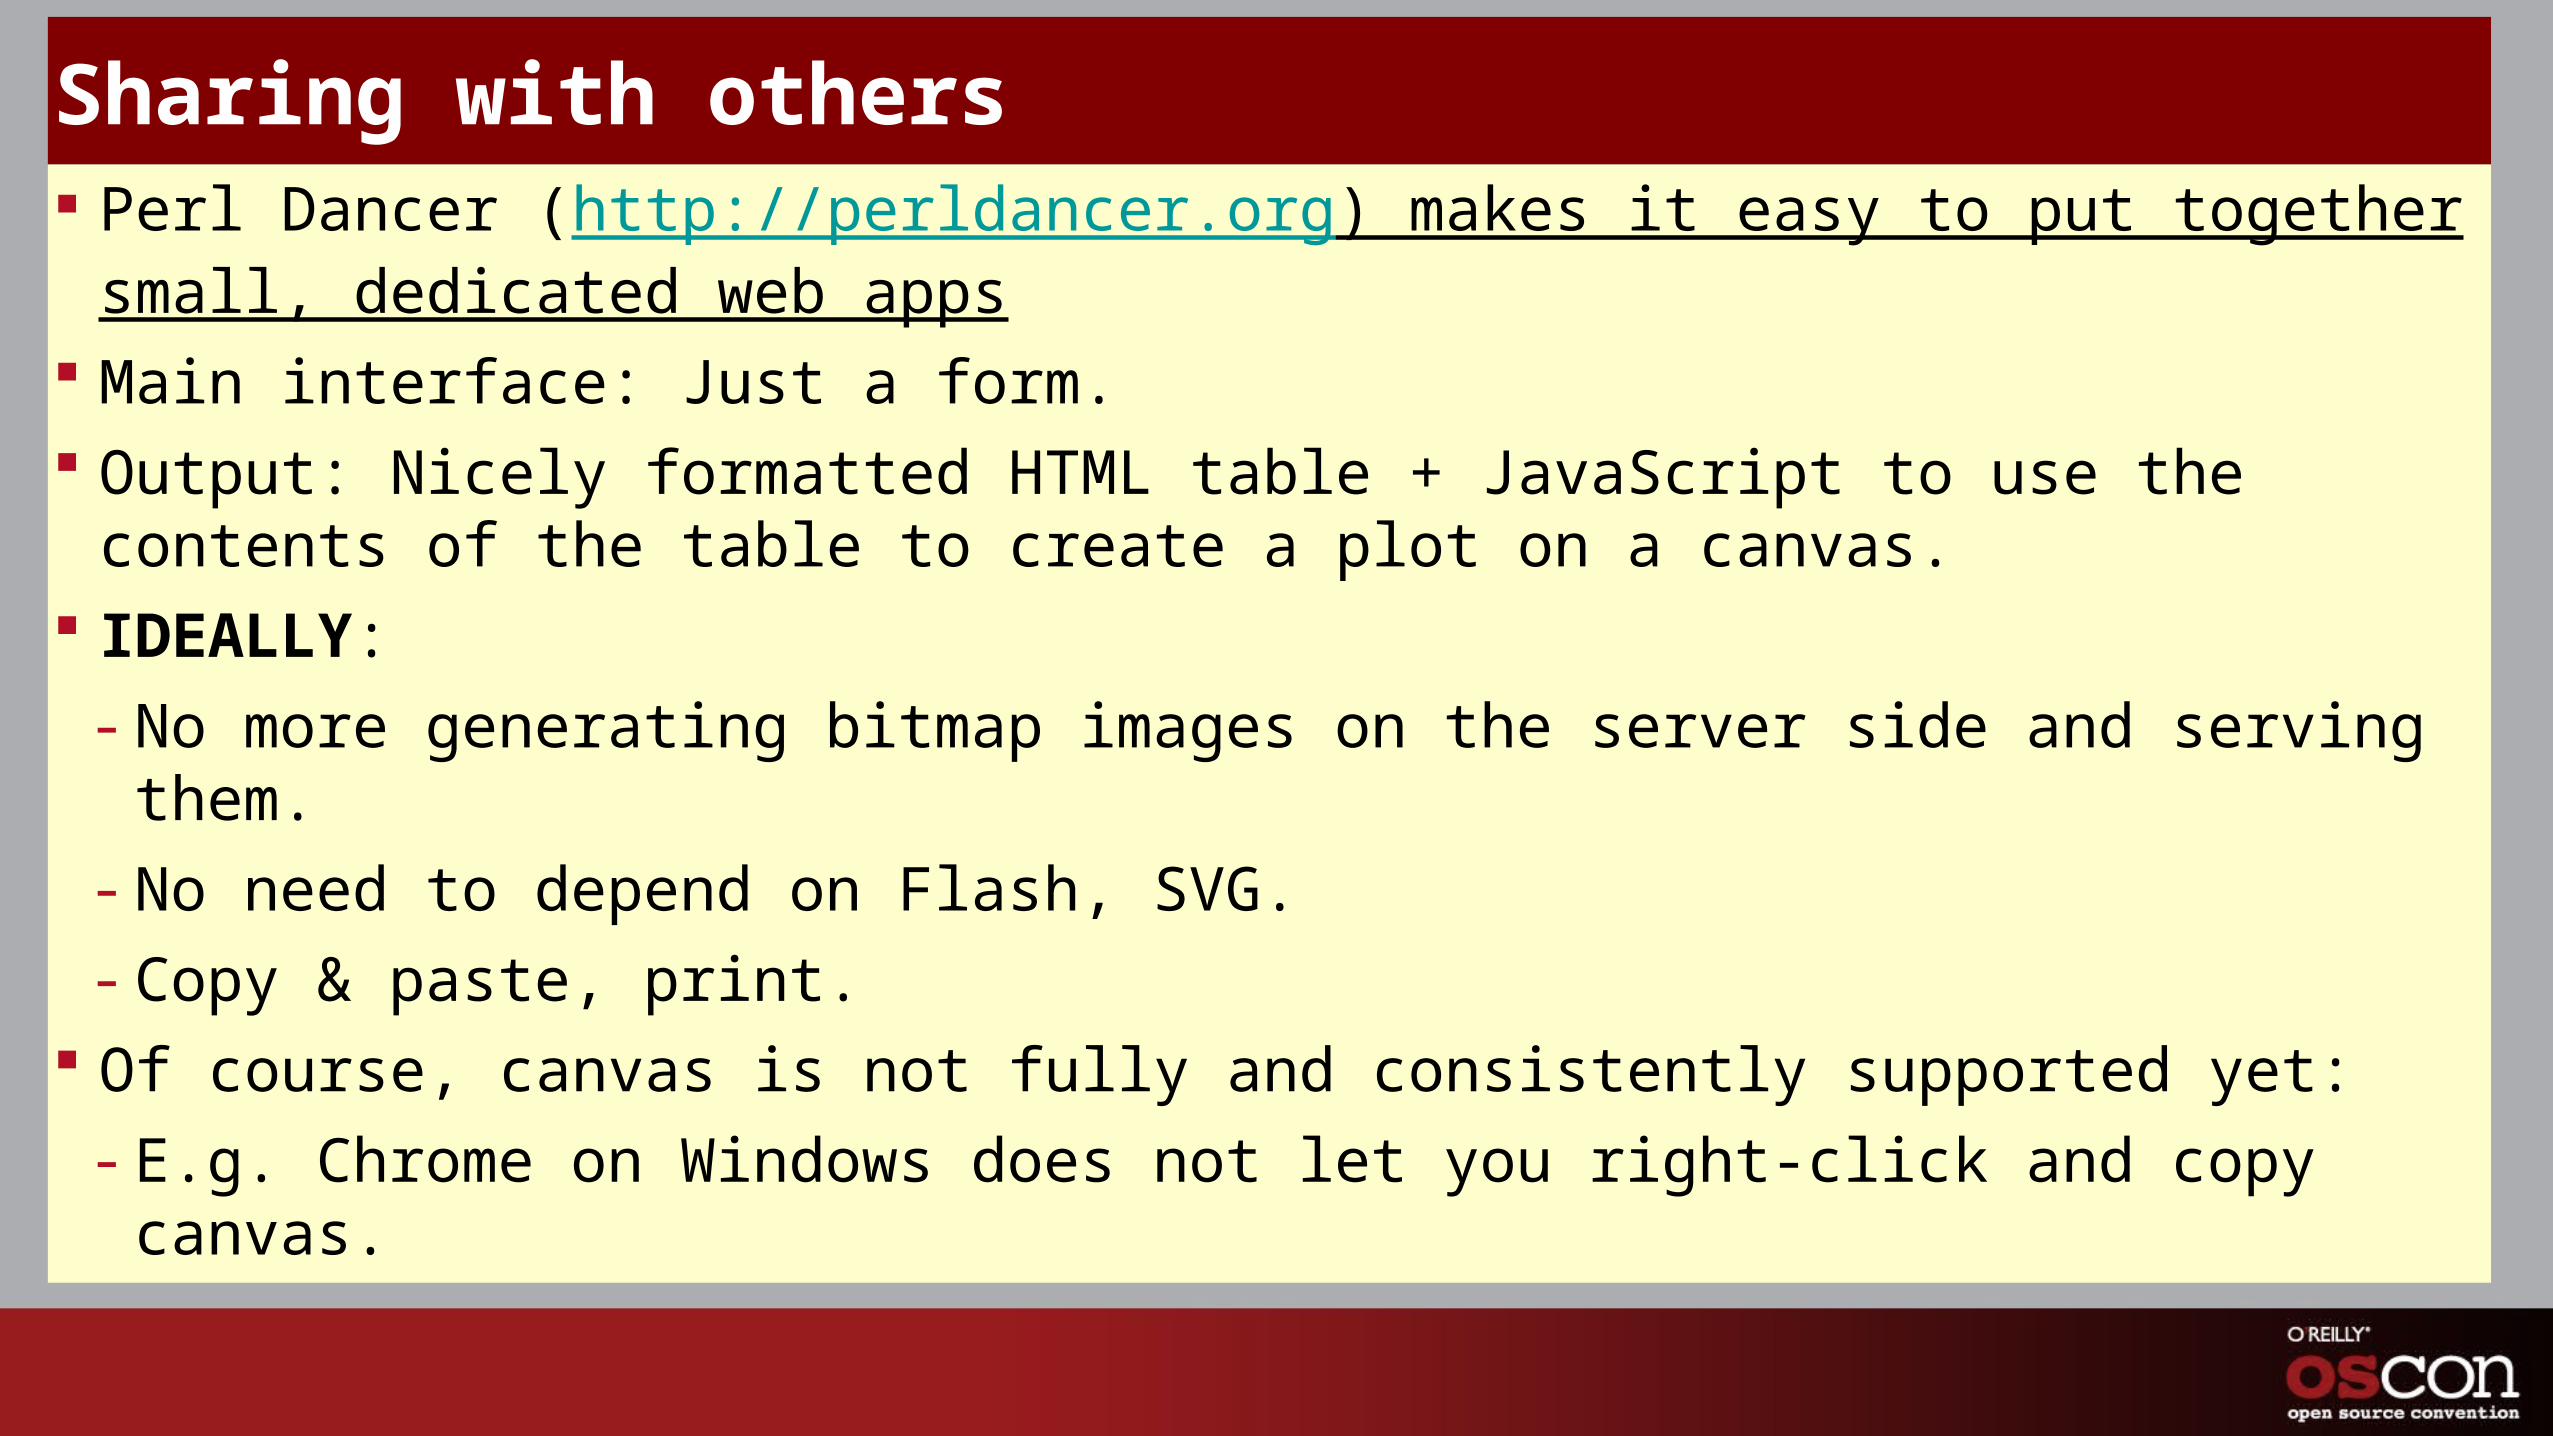
Sharing with others Perl Dancer (http://perldancer.org) makes it easy to put together small, dedicated
web apps Main interface: Just a form. Output: Nicely formatted HTML table + JavaScript to use the contents of the table to
create a plot on a canvas. IDEALLY:
- No more generating bitmap images on the server side and serving them.
- No need to depend on Flash, SVG.
- Copy & paste, print. Of course, canvas is not fully and consistently supported yet:
- E.g. Chrome on Windows does not let you right-click and copy canvas.
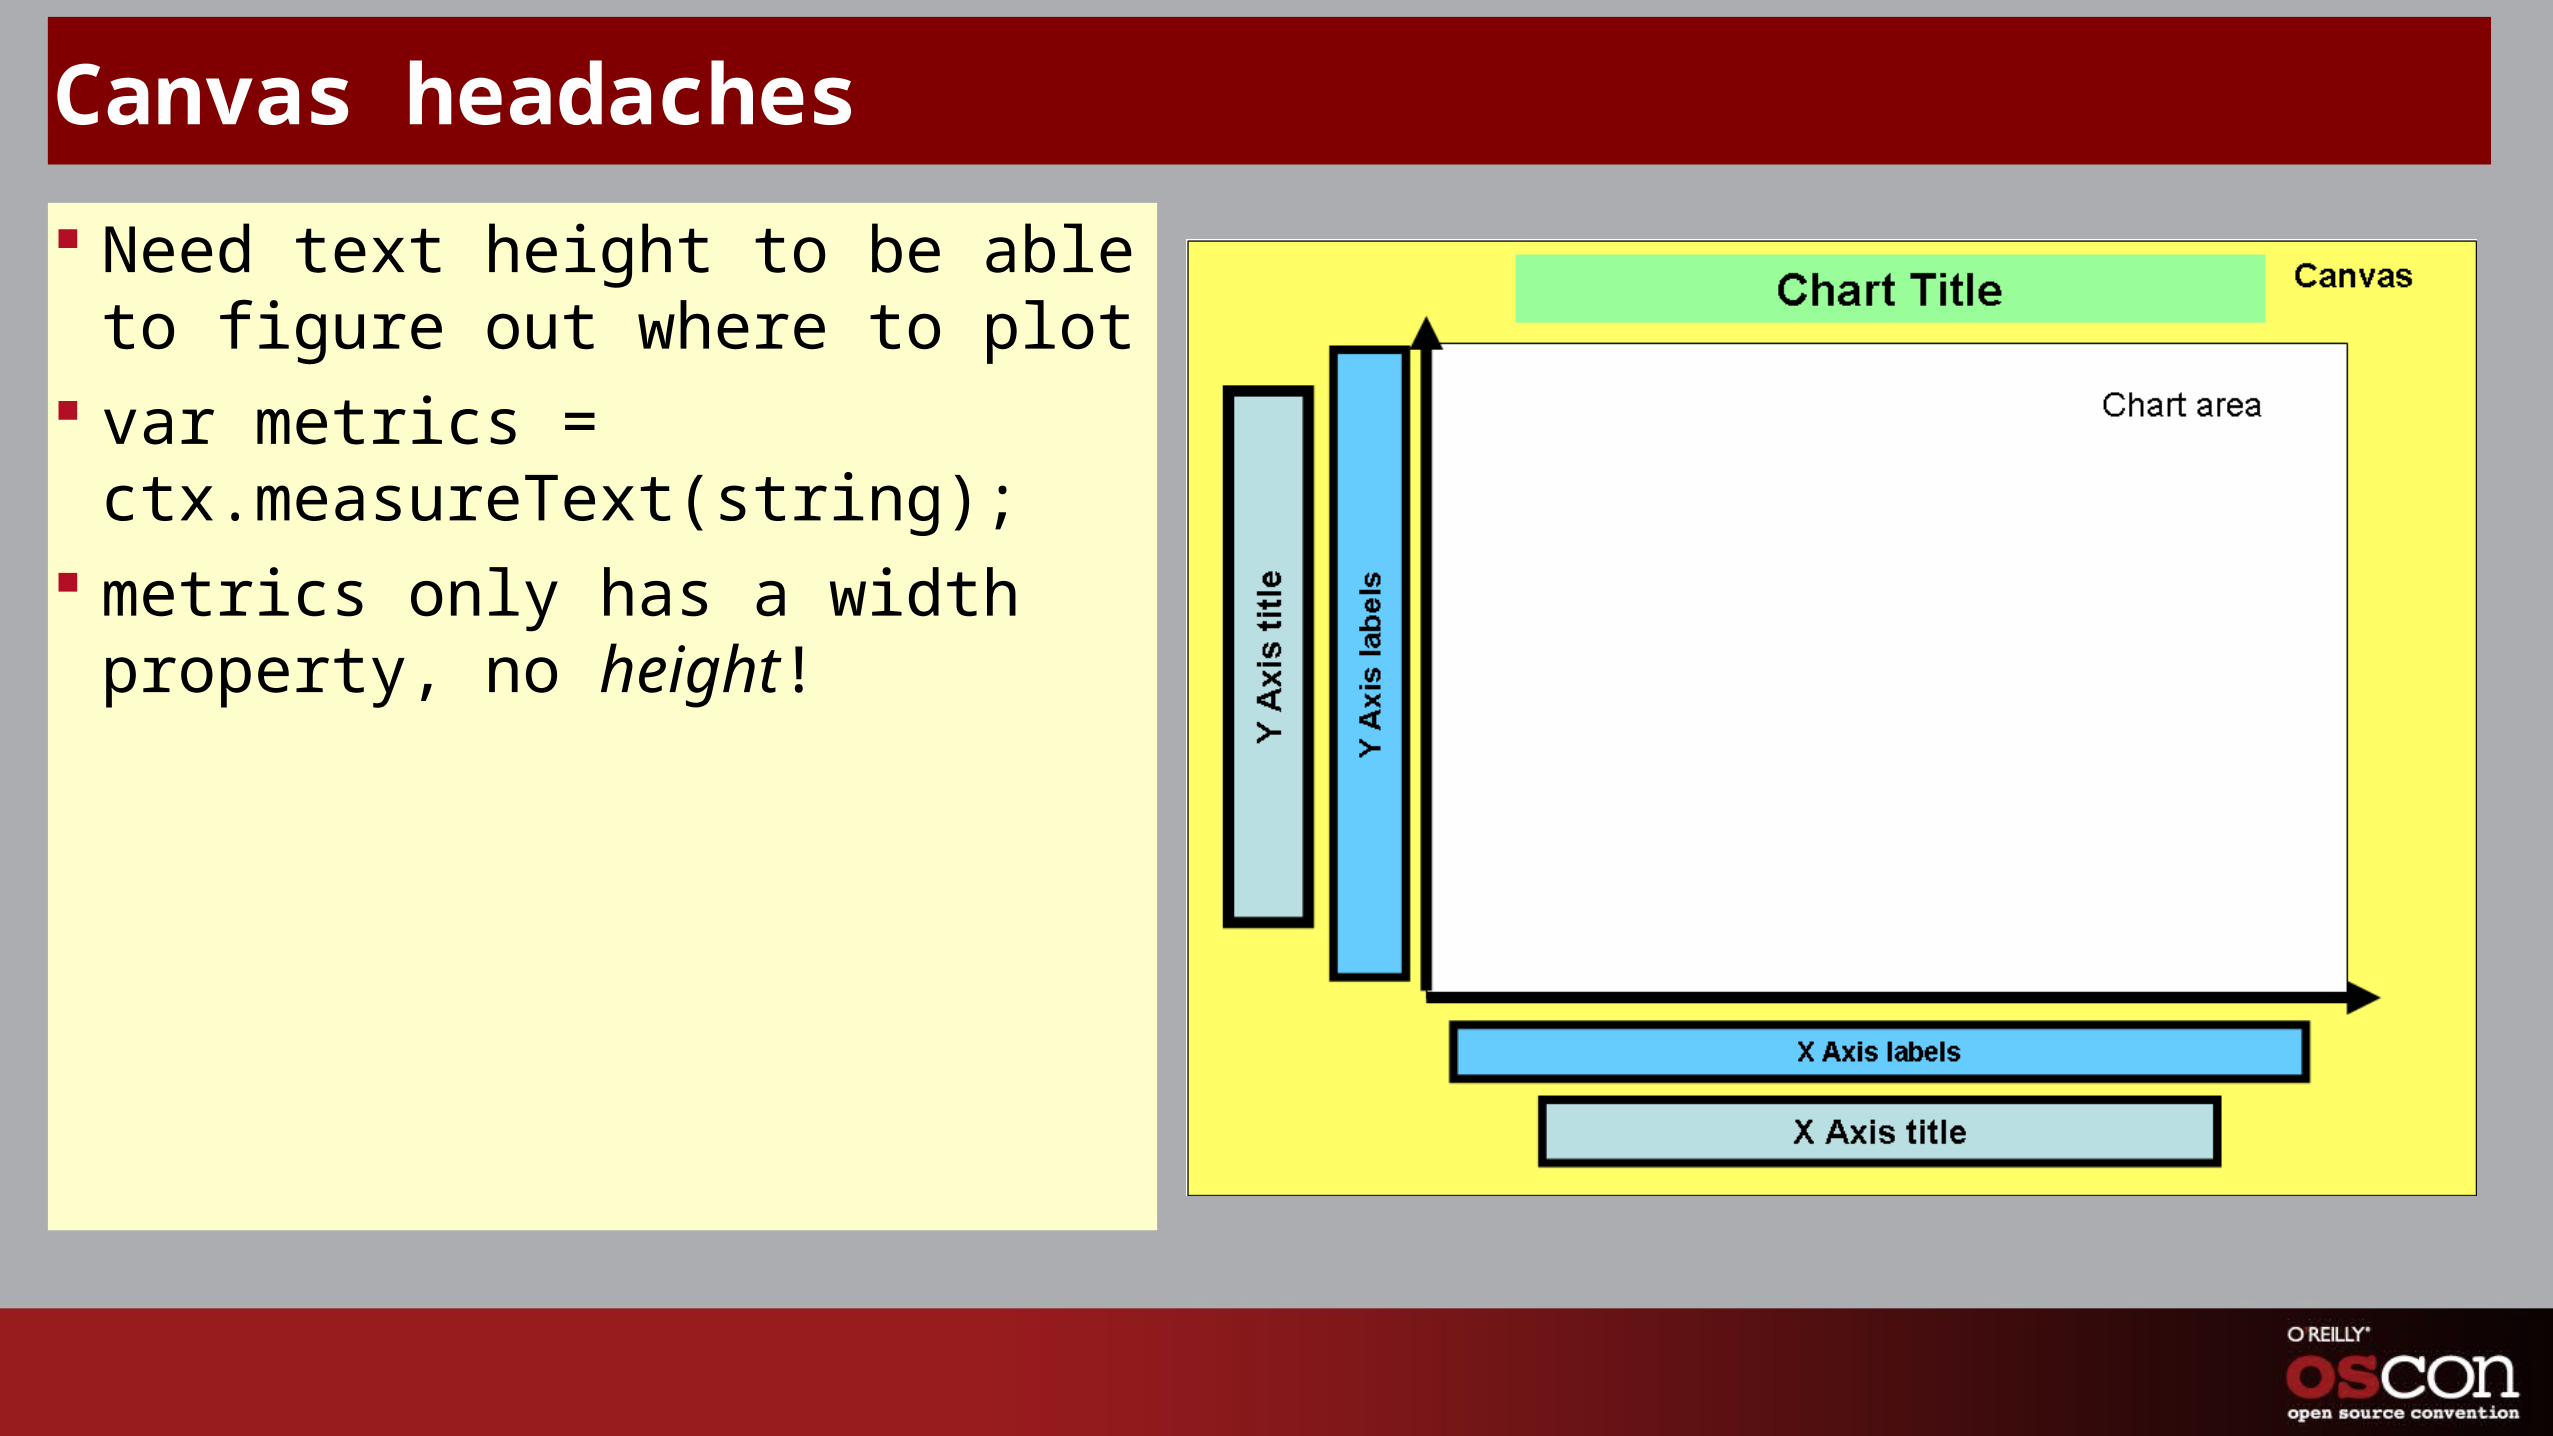
Canvas headaches
Need text height to be able to figure out where to plot
var metrics = ctx.measureText(string);
metrics only has a width property, no height!
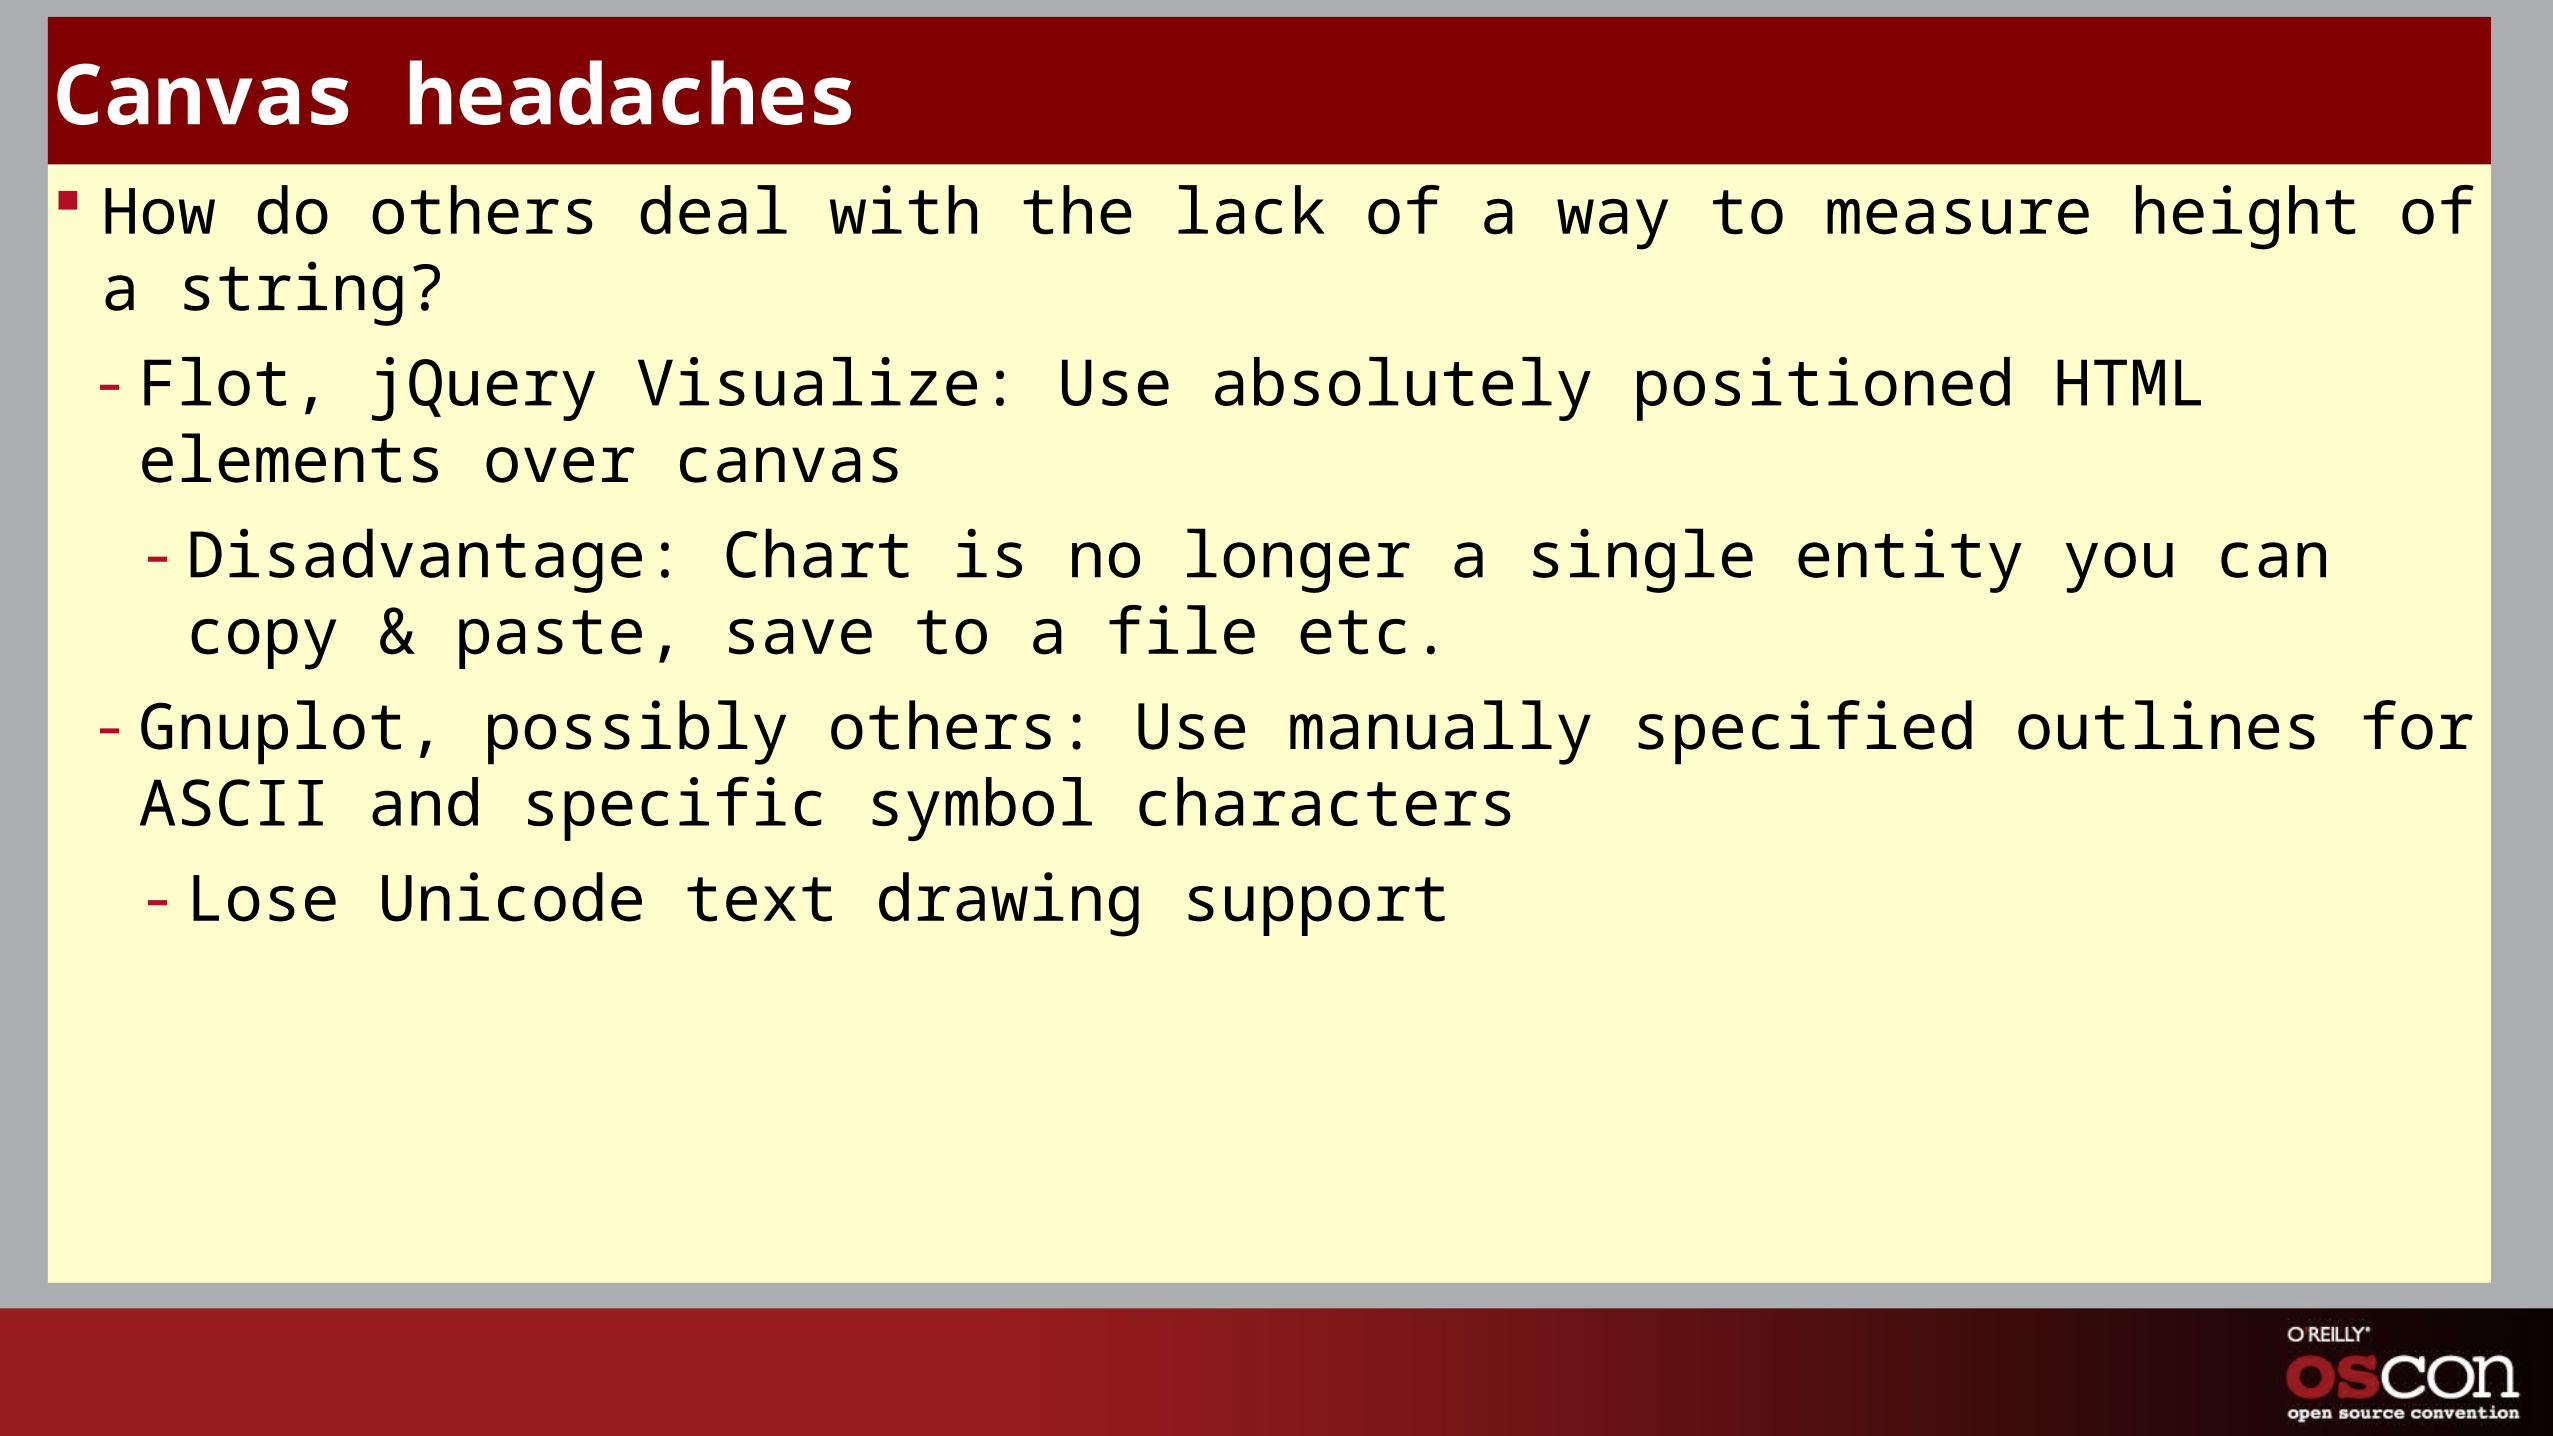
Canvas headaches How do others deal with the lack of a way to measure height of a string?
- Flot, jQuery Visualize: Use absolutely positioned HTML elements over canvas
- Disadvantage: Chart is no longer a single entity you can copy & paste, save to a file etc.
- Gnuplot, possibly others: Use manually specified outlines for ASCII and specific symbol characters
- Lose Unicode text drawing support

Canvas: Height of a string in current font Draw string, black on white background Find first scanline with a non-white pixel Find first subsequent scanline with all white pixels
- Waste memory
- Repeatedly draw on and clear canvas
- Inelegant, cumbersome
- Seems to be the only way to do it if you want arbitrary fonts, character sets, and treat chart as a single entity
Code, sample app & pretty pictures coming soon … before my presentation ;-)