visualization-based mapping of language function...
TRANSCRIPT
Visualization-Based Mapping of Language Function in the Brain
B. Modayur,* J. Prothero,* G. Ojemann,† K. Maravilla,‡ and J. Brinkley**Structural Informatics Group, Department of Biological Structure, †Department of Neurosurgery,
and ‡Department of Radiology, University of Washington, Seattle, Washington 98195
Received April 17, 1997
Cortical language maps, obtained through intraop-erative electrical stimulation studies, provide a richsource of information for research on language organi-zation. Previous studies have shown interesting corre-lations between the distribution of essential languagesites and such behavioral indicators as verbal IQ andhave provided suggestive evidence for regarding hu-man language cortex as an organization of multipledistributed systems. Noninvasive studies using ECoG,PET, and functional MR lend support to this model;however, there as yet are no studies that integratethese two forms of information. In this paper wedescribe a method for mapping the stimulation dataonto a 3-D MRI-based neuroanatomic model of theindividual patient. The mapping is done by comparingan intraoperative photograph of the exposed corticalsurface with a computer-based MR visualization of thesurface, interactively indicating corresponding stimu-lation sites, and recording 3-D MR machine coordi-nates of the indicated sites. Repeatability studies wereperformed to validate the accuracy of the mappingtechnique. Six observers—a neurosurgeon, a radiolo-gist, and four computer scientists, independentlymapped 218 stimulation sites from 12 patients. Themean distance of a mapping from the mean location ofeach site was 2.07 mm, with a standard deviation of 1.5mm, or within 5.07 mm with 95% confidence. Since thesurgical sites are accurate within approximately 1 cm,these results show that the visualization-based ap-proach is accurate within the limits of the stimulationmaps. When incorporated within the kind of informa-tion system envisioned by the Human Brain Project,this anatomically based method will not only provide akey link between noninvasive and invasive approachesto understanding language organization, but will alsoprovide the basis for studying the relationship be-tween language function and anatomical variability.r 1997 Academic Press
INTRODUCTION
Cortical language maps obtained through intraopera-tive electrical stimulation studies provide a rich source
of information for research on language organization.Through intraoperative stimulation studies, corticalsites essential for language function can be identified.Non-computer-based studies have shown interestingcorrelations between the distribution of essential lan-guage sites and such behavioral indicators as verbal IQ(Ojemann et al., 1989a). These empirical observationslead to interesting speculations about whether distribu-tion of language, or any other function, can be related tovariations in cortical anatomy and whether functioncan be predicted from anatomy alone. Further valida-tion of this apparent relationship between function andanatomy could be made possible by the integration ofstimulation data with data from other modalities suchas fMRI, PET, SPECT, and ECoG.
The stimulation data also provide suggestive evi-dence for regarding human language cortex as anorganization of multiple distributed systems (Haglundet al., 1993; Ojemann et al., 1989a; Ojemann, 1991),each involved in the processing of a distinct languagefunction, with all the different systems acting in paral-lel. The distributed model has received additionalsupport through the use of other techniques. ECoGrecordings from electrodes placed on the exposed corti-cal surface show correlation with the essential namingsites during object naming in the absence of electricalstimulation (Ojemann et al., 1989b). Optical imagingon a few patients shows changes near the essentialsites that are absent in areas without essential sites,but the activation areas are larger (Haglund et al.,1992). Use of other noninvasive techniques such asfMRI (Binder et al., 1996, 1995) and PET (Petersen etal., 1988; Demonet et al., 1992) have also lent addi-tional support to the distributed language model. PETand fMRI, however, reveal areas of activation as op-posed to areas of inhibition revealed by stimulationstudies.
Although many studies have described the integra-tion of multiple imaging modalities (Levin et al., 1989;Evans et al., 1991), only one or two hint at the integra-tion of electrical stimulation data with functional dataobtained from noninvasive sources such as fMRI andPET (Herholz et al., 1997). If surgical data can be
NEUROIMAGE 6, 245–258 (1997)ARTICLE NO. NI970301
245 1053-8119/97 $25.00Copyright r 1997 by Academic Press
All rights of reproduction in any form reserved.

integrated with noninvasive functional methods, and ifthe language areas as revealed by the two methods arefound to be highly correlated, then it may be possible toaltogether supplant intraoperative studies with themore convenient noninvasive methods.
Two approaches are possible for integrating thesetwo kinds of data: (a) 3-D locators, and (b) 3-D recon-struction followed by visual mapping. The first ap-proach involves using a 3-D locator device secured tothe patient head, which the surgeon can use to locatelanguage sites and record the 3-D location of the sites.The 3-D locator can be registered to the MR data of thepatient through the use of surface markers on thepatient head. This will enable correlation of stimula-tion data with noninvasive data obtained from sourcessuch as MR and PET. However, changes in corticalmorphology as a result of craniotomy complicate thisregistration process. In addition, the need to secure thelocator device to the patient, and the potential inconve-nience to the awake patient of such a device, makes thisapproach impractical when the locator is not otherwiseneeded during surgery.
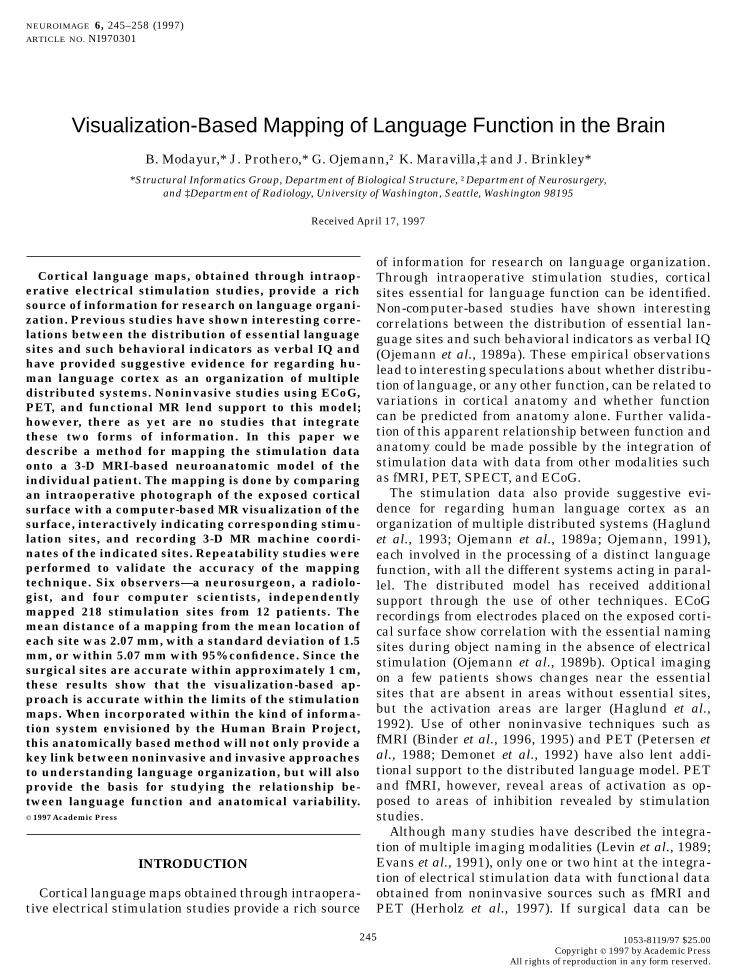
The alternate approach, which we describe in thispaper, is visual comparison between an MR-based 3-Dcortical reconstruction and an intraoperative photo-graph (Fig. 1) of the exposed cranial surface. Mappingis then done by manually indicating on the visualizedsurface the location of stimulation sites visible on thephotograph. Since visual comparison entails recogni-tion of cortical structures by the mapper (humanexpert), this technique tolerates changes in morphologythat occur during surgery.Also, since the visual compari-son approach uses only the intraoperative photographand the MR scans, it is possible to implement it withminimal change to the operation protocol and withoutinconveniencing the patient. In fact, the only change inthe protocol is the acquisition of MR data prior tosurgery.
The remainder of this paper describes our methodsfor generating the computer-based visualization andfor mapping the stimulation sites onto the 3-D model.Repeatability results are then presented which showthat this technique is accurate within the limits of thesurgical sites.
FIG. 1. Intraoperative photograph obtained after stimulation mapping. Sites that were included in the stimulation study are marked withnumbered tags.
246 MODAYUR ET AL.

METHODS
The goal of the visualization and mapping procedureis to generate the location and extent of the stimulationmapping sites with respect to a uniform, 3-D patientcoordinate system. The language sites of individualpatients can then be combined with or related to otherpatient data in terms of a Talairach, surface-based, orother deformable coordinate system.
The language mapping process is carried out in the
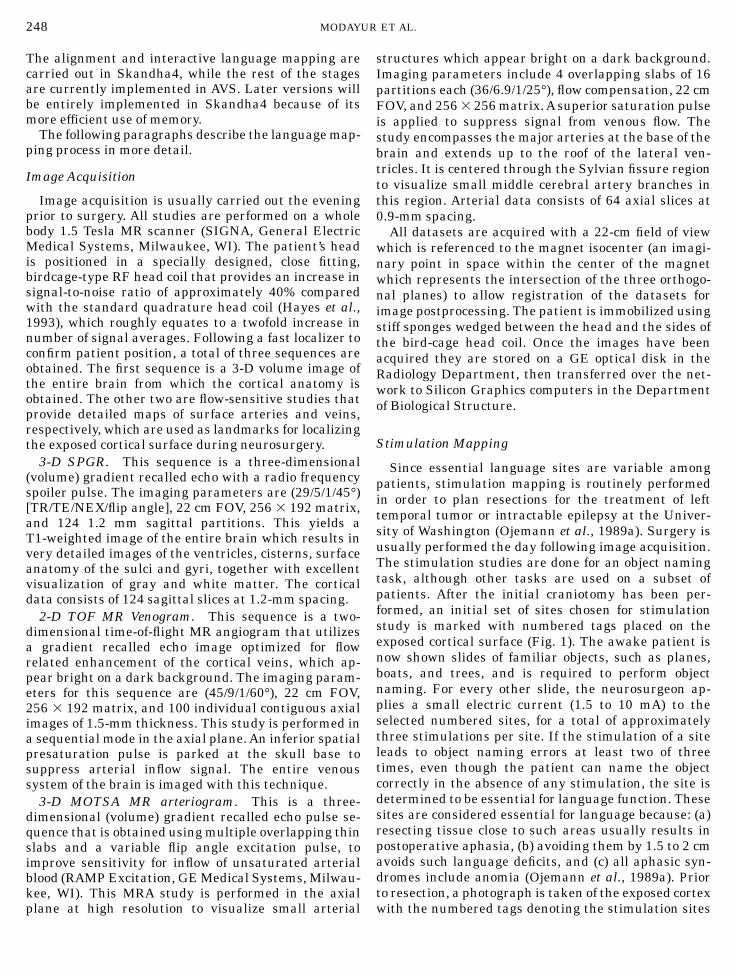
following order: (i) image acquisition, (ii) surgical stimu-lation, (iii) image enhancement, (iv) alignment, (v)cropping, (vi) cortical segmentation, (vii) surface visual-ization, and finally (viii) interactive mapping. Theoverall flow of data is shown in Fig. 2.
Our heterogeneous software environment consists ofAdvanced Visual Systems’ (AVS), a commercial datavisualization package, and Skandha4, an in-housegraphics program (Brinkley and Prothero, 1997). Boththese programs run on Silicon Graphics computers.
FIG. 2. Overall dataflow for visualization and mapping.
247VISUALIZATION-BASED MAPPING
The alignment and interactive language mapping arecarried out in Skandha4, while the rest of the stagesare currently implemented in AVS. Later versions willbe entirely implemented in Skandha4 because of itsmore efficient use of memory.
The following paragraphs describe the language map-ping process in more detail.
Image Acquisition
Image acquisition is usually carried out the eveningprior to surgery. All studies are performed on a wholebody 1.5 Tesla MR scanner (SIGNA, General ElectricMedical Systems, Milwaukee, WI). The patient’s headis positioned in a specially designed, close fitting,birdcage-type RF head coil that provides an increase insignal-to-noise ratio of approximately 40% comparedwith the standard quadrature head coil (Hayes et al.,1993), which roughly equates to a twofold increase innumber of signal averages. Following a fast localizer toconfirm patient position, a total of three sequences areobtained. The first sequence is a 3-D volume image ofthe entire brain from which the cortical anatomy isobtained. The other two are flow-sensitive studies thatprovide detailed maps of surface arteries and veins,respectively, which are used as landmarks for localizingthe exposed cortical surface during neurosurgery.
3-D SPGR. This sequence is a three-dimensional(volume) gradient recalled echo with a radio frequencyspoiler pulse. The imaging parameters are (29/5/1/45°)[TR/TE/NEX/flip angle], 22 cm FOV, 256 3 192 matrix,and 124 1.2 mm sagittal partitions. This yields aT1-weighted image of the entire brain which results invery detailed images of the ventricles, cisterns, surfaceanatomy of the sulci and gyri, together with excellentvisualization of gray and white matter. The corticaldata consists of 124 sagittal slices at 1.2-mm spacing.
2-D TOF MR Venogram. This sequence is a two-dimensional time-of-flight MR angiogram that utilizesa gradient recalled echo image optimized for flowrelated enhancement of the cortical veins, which ap-pear bright on a dark background. The imaging param-eters for this sequence are (45/9/1/60°), 22 cm FOV,256 3 192 matrix, and 100 individual contiguous axialimages of 1.5-mm thickness. This study is performed ina sequential mode in the axial plane. An inferior spatialpresaturation pulse is parked at the skull base tosuppress arterial inflow signal. The entire venoussystem of the brain is imaged with this technique.
3-D MOTSA MR arteriogram. This is a three-dimensional (volume) gradient recalled echo pulse se-quence that is obtained using multiple overlapping thinslabs and a variable flip angle excitation pulse, toimprove sensitivity for inflow of unsaturated arterialblood (RAMP Excitation, GE Medical Systems, Milwau-kee, WI). This MRA study is performed in the axialplane at high resolution to visualize small arterial
structures which appear bright on a dark background.Imaging parameters include 4 overlapping slabs of 16partitions each (36/6.9/1/25°), flow compensation, 22 cmFOV, and 256 3 256 matrix. A superior saturation pulseis applied to suppress signal from venous flow. Thestudy encompasses the major arteries at the base of thebrain and extends up to the roof of the lateral ven-tricles. It is centered through the Sylvian fissure regionto visualize small middle cerebral artery branches inthis region. Arterial data consists of 64 axial slices at0.9-mm spacing.
All datasets are acquired with a 22-cm field of viewwhich is referenced to the magnet isocenter (an imagi-nary point in space within the center of the magnetwhich represents the intersection of the three orthogo-nal planes) to allow registration of the datasets forimage postprocessing. The patient is immobilized usingstiff sponges wedged between the head and the sides ofthe bird-cage head coil. Once the images have beenacquired they are stored on a GE optical disk in theRadiology Department, then transferred over the net-work to Silicon Graphics computers in the Departmentof Biological Structure.
Stimulation Mapping
Since essential language sites are variable amongpatients, stimulation mapping is routinely performedin order to plan resections for the treatment of lefttemporal tumor or intractable epilepsy at the Univer-sity of Washington (Ojemann et al., 1989a). Surgery isusually performed the day following image acquisition.The stimulation studies are done for an object namingtask, although other tasks are used on a subset ofpatients. After the initial craniotomy has been per-formed, an initial set of sites chosen for stimulationstudy is marked with numbered tags placed on theexposed cortical surface (Fig. 1). The awake patient isnow shown slides of familiar objects, such as planes,boats, and trees, and is required to perform objectnaming. For every other slide, the neurosurgeon ap-plies a small electric current (1.5 to 10 mA) to theselected numbered sites, for a total of approximatelythree stimulations per site. If the stimulation of a siteleads to object naming errors at least two of threetimes, even though the patient can name the objectcorrectly in the absence of any stimulation, the site isdetermined to be essential for language function. Thesesites are considered essential for language because: (a)resecting tissue close to such areas usually results inpostoperative aphasia, (b) avoiding them by 1.5 to 2 cmavoids such language deficits, and (c) all aphasic syn-dromes include anomia (Ojemann et al., 1989a). Priorto resection, a photograph is taken of the exposed cortexwith the numbered tags denoting the stimulation sites
248 MODAYUR ET AL.

(Fig. 1). The photograph, together with a table record-ing which of the language sites have been found to beessential, comprise the surgical input to the mappingprocess.
Enhancement, Alignment, and Cropping
In order to generate a 3-D visualization to match thephotograph, the MR datasets are processed using rela-tively standard image processing algorithms: enhance-ment, alignment, cropping, segmentation, and surfacerendering.
Enhancement was required for the cortex (3-D SPGR)dataset on some of our earlier patients because the RFhead coil produced a gradient artifact that interferedwith segmentation. This artifact manifested itself as anintensity fall off across the volume data. The RFinhomogeneity present in these datasets can be mod-eled as a low frequency signal in contrast to the highfrequency information present in the underlyinganatomy. This intraslice intensity variation can becorrected using (a) phantom acquisition (Axel et al.,1987), or retrospectively using (b) homomorphic filter-ing (Lim and Pfefferbaum, 1989; Axel et al., 1987), or(c) interactive correction using surface fitting tech-niques (Dawant et al., 1993). We found that a simplehomomorphic filtering was sufficient to remove thegradient artifact. The intensity gradient for each imageis modeled as a multiplicative, low-frequency noisefactor. Thus, the observed signal is considered a prod-uct of the original signal with the noise factor: M 5 A 3I, where M is the observed image, A is the noise factor,and I is the signal image.
A 19-pixel-wide square kernel is used to convolve theobserved image M to produce the low frequency imageA. By taking the logarithm of the observed image M andsubtracting the log of the low-frequency image A, thelog of the original signal I can be obtained: log I 5log M 2 log A; log I is then exponentiated to get thefinal output image, in which the intensity fall offartifact has been removed.
Whether or not the inhomogeneity correction isneeded, in the next stage the three datasets are alignedin 3-D. For the purposes of this study, it is assumed thatpatient motion between the three MR studies, whichtake approximately 50 min, is negligible. This assump-tion was made because these patients are generallycooperative and highly motivated individuals. Al-though the assumption is not strictly correct, the slightmisregistration caused by patient movement betweensequences is minimal. Since blood vessels are used onlyto identify and localize cortical structures for visualmatching, it is not necessary that the alignment beexact.
Each exam series is acquired using similar imagevolume sizes (i.e., fields of view or FOV), but at adifferent orientation and spatial resolution. However,
the MR machine keeps track of the relationship of eachseries to a fixed coordinate system in the center of themagnet and records this information in the imageheaders. Thus, to align the three volume datasets weextract, from the supplied header information, the slicethickness, slice spacing, voxel size, image matrix size,and position of each image volume with respect to themagnet coordinate system. The datasets then undergoa three-step process. First, the datasets are rotated in90° increments until all three are in the same machine-space orientation. A minimum bounding box is thenestablished with a grid of cubic voxels, and finally thedata from the rotated volumes are resampled into thegrid.
The resulting datasets are of identical dimensions ina 256 3 256 3 256 voxel array, in which the i, j, and kthvoxel in each dataset corresponds to the same physicallocation in MR-machine space, assuming there is nopatient movement.
This alignment procedure is similar to that producedby the ge2mni perl script, written by Peter Neelin(Montreal Neurological Institute, 1996). Visual compari-sons were made between alignments produced by bothtechniques in order to verify the correctness of thesoftware.
The alignment procedure is followed by a croppingoperation in order to reduce the size of the volumedatasets for effective processing in AVS. This operationis necessary in AVS because of its inefficient use ofmemory. Although cropping does not affect the validityof the current results, it will not be needed when thesemethods are ported to a more efficient software environ-ment.
Cropping is done using an AVS graphical user inter-face to cut off all but a slab near the left temporalsurface, on all three aligned volumes. Cropping reducesthe size of the datasets from over 100 megabytes to lessthan 10 megabytes, while still retaining enough infor-mation for satisfactory renderings. The cropped datasetsare input to the segmentation module.
Cortical Segmentation
Segmentation of the cortex from the surroundingbackground is not necessary for strict visualization ofthe cortex through volume rendering methods. How-ever, the goal of the mapping process is to determinethe 3-D coordinates of points on the surface, therebyrequiring that the surface be extracted from the imagedata. Common approaches to cortical segmentationinclude 3-D region growing and deformable models(MacDonald et al., 1995). Since the surgical sites arenot located within deep sulci it is not necessary at thisstage to segment the detailed sulcal anatomy. There-fore, a simple 3-D region growing approach is sufficient.However, standard region growing algorithms often failfor cortical segmentation because of small connections
249VISUALIZATION-BASED MAPPING
between cortical regions and surrounding skull. Forthis reason we have developed an adaptive regiongrower, called region grow, that uses a cost function todetermine when to add voxels to a growing region(Myers and Brinkley, 1995).
The basic idea behind region grow is that voxelsbelonging to the same tissue type and adjacent to eachother will have fairly homogeneous grayscale proper-ties. The algorithm thus attempts to find these initial orseed areas by looking for voxels whose neighborhoodvariance is below a user-specified threshold. Regionsare then grown recursively from these seed voxels. Asthe regions begin to grow in size, the algorithm startsconsidering grayscale characteristics of the growingregion as well as adjacency constraints of other voxelsin the region. More formally, for a given voxel, v, whose26-adjacent neighborhood, N, contains at least onevoxel belonging to a growing region R, v will be includedin R if cost , 1, where:
cost 5 1 1
TR2(Iv 2 xR̂)2
sR2
w 1sN
2
TN(1 2 w),
where Iv 5 intensity of given voxel, v; TR 5 thresholdfor region R; TN 5 threshold for neighborhood N; xR̂ 5intensity mean of voxels in R; sR
2 5 intensity variance ofvoxels in R; sN
2 5 intensity variance of voxels inneighborhood N; and w 5 a weighting factor.
The weighting factor, w, is determined by threeuser-specified parameters: a voxel counter gmin, a sec-ond voxel counter gwindow, and a percentage Pgrey. Let nRbe the number of voxels in R, then the weight w isdefined by,
w 5 0 if nR , gmin
Pgrey 1nR 2 gmin
gwindow2 if gmin # nR # gmin 1 gwindow
Pgrey if nR . gmin 1 gwindow
This has the effect of causing regions to grow initiallybased only on local smoothness, since w 5 0, but beyondnR . gmin, to consider progressively the voxel’s greyscaleintensity relative to R up to a fixed percentage, Pgrey.That is, the cost will be high if a voxel’s intensity is toodifferent from that of R.
In addition to intensity similarity encoded in the costvalue, adjacency criteria encode general shape knowl-edge. By adjacency constraints, voxel v will definitelybe included in R if the number of adjacent voxelsbelonging to R exceeds a user-defined threshold (typi-cally 16 to 18), even if the cost is greater than 1.Conversely, v will be excluded from R if the number ofadjacent voxels belonging to R is less than the user-defined minimum (typically 2–4). While the minimum
adjacency criteria prevents the expansion of regionsalong a single line of voxels, the maximum adjacencycriteria prevents the exclusion of voxels that are other-wise surrounded by several voxels already in thegrowing region.
Region grow is applied to the anatomy (3-D SPGR)image dataset. The output is a labeled volume, wherethe label indicates the membership of a voxel in asegmented object. The segmented objects are viewedvia a movable 2-D slice plane in AVS, and the objectcorresponding to the cortical tissue is selected by theuser. The ROI mask thus derived is then postprocessedby 3-D morphological operators, to smooth the maskand to expand it so that we capture the superficial bloodvessels in the surface extraction process.
Surface Extraction
The visualization module of the brain mapper pro-duces a 3-D rendering of the cortical surface along withthe associated superficial veins and arteries. Visualiza-tion methods for volume data can be broadly classified(Elvins, 1992) into (a) surface-fitting techniques that fitgeometric primitives (usually planar) to volume dataand render the primitives using conventional surfacerendering algorithms, and (b) direct volume renderingmethods that project voxels directly onto a 2-D imagespace without using any intermediate primitives. Inearlier work the output of region grow was used tomask out the scalp in a volume rendering method(Myers and Brinkley, 1995). However, renderings gener-ated by that method were not as detailed as those wehave since obtained using surface-based approaches.Since in the long run we need the 3-D coordinates ofpoints on the surface of the brain our current approachis to develop surface-based visualization methods.
The approach we take to extracting surfaces fromvolume data is to use region grow to produce a ROImask, as in the volume visualization approach. Themask is used to exclude noncortical tissue from thevolume data before running a generic isosurface algo-rithm (Lorensen and Cline, 1987) provided by AVS,called isosurface, to produce the cortical surface. Themask is also morphologically processed to generate a3-D annular region that is applied to the arterial andvenous data so that only surface vessels are extractedby the isosurface module.
The three generated surfaces are passed to themapping program for surface visualization and interac-tive mapping.
Interactive Mapping
Language site mapping is done using the Skandha4package. The three surface models produced by AVS(one each for cortex, veins, and arteries), the correspond-
250 MODAYUR ET AL.

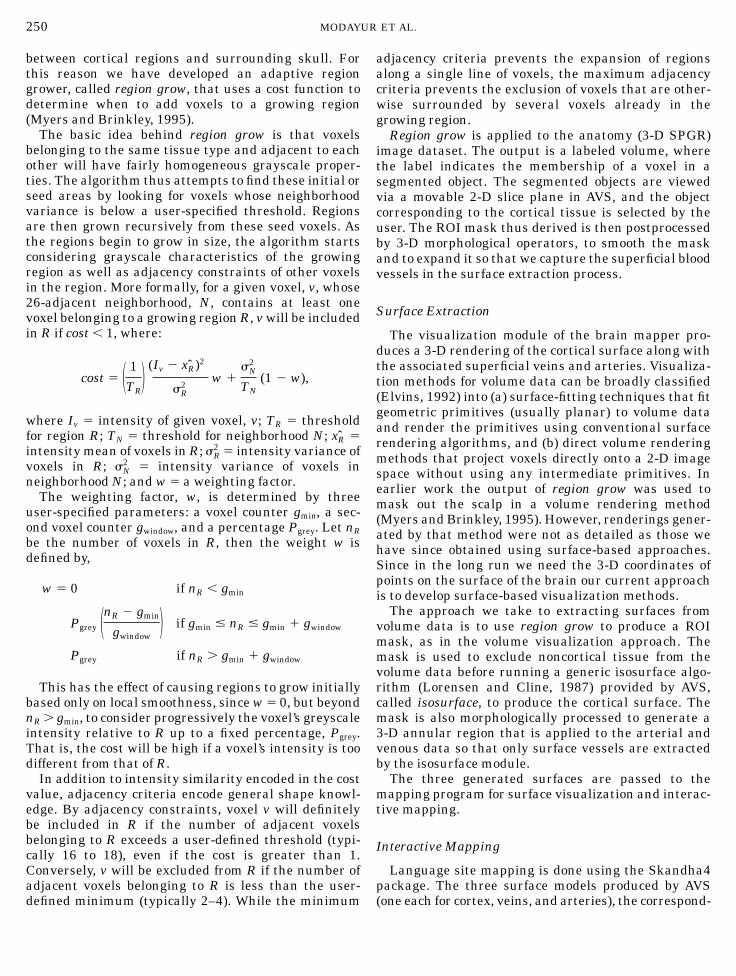
ing intraoperative photograph, and the original MRvolume data, are loaded into the language mappingmodule. Skandha4 controls are used to manipulatecolor, lighting, surface properties, and viewpoint of therendered models. The interface is shown in the screendump of Fig. 3.
The language site mapping is done interactively, bycomparing the intraoperative photograph visually withthe rendered image, dragging numbered icons from apalette, and dropping them off at the location corre-sponding to the numbered tags on the photograph.Once the site has been dropped off the computerperforms a 3-D ‘‘pick’’ operation in order to determinethe closest surface facet to the site. The vasculatureand the cortical surface features guide the user in theaccurate localization of the language sites. The two
orthogonal MR slices shown on the right of the inter-face, corresponding to the location of the mouse click onthe rendered image, can be used to relate features onthe rendered image to the original volume data.
Major cortical landmarks such as the sylvian fissure,central sulcus, and the superior, middle, and inferiortemporal gyri are clearly visible in the surface render-ing shown in Fig. 3. In addition, the major veins canalso be seen in conjunction with cortical anatomy. Thestimulation sites have been identified by a neurosur-geon using the cortical landmarks and the blood vesselsand correlating the intraoperative photograph with therendered image. Those sites found intraoperatively tobe essential for language are shown enclosed in boxes.After the mapping for a patient is complete, the stimu-lation sites and their corresponding 3-D coordinates in
FIG. 3. The interactive brain mapper. Top left of the interface shows the intraoperative photograph. The surface visualization is shown atthe bottom left. To the right are MR slices corresponding to the position of the mouse click on the rendered image. The sites, mapped by aneurosurgeon, are shown. Sites marked by small rectangles are essential for language.
251VISUALIZATION-BASED MAPPING
MR machine space (based on the surface facet that isfound in the pick operation) are stored in a Web-basedrepository that we are developing for managing multi-media brain map data (Jakobovits et al., 1996).
RESULTS
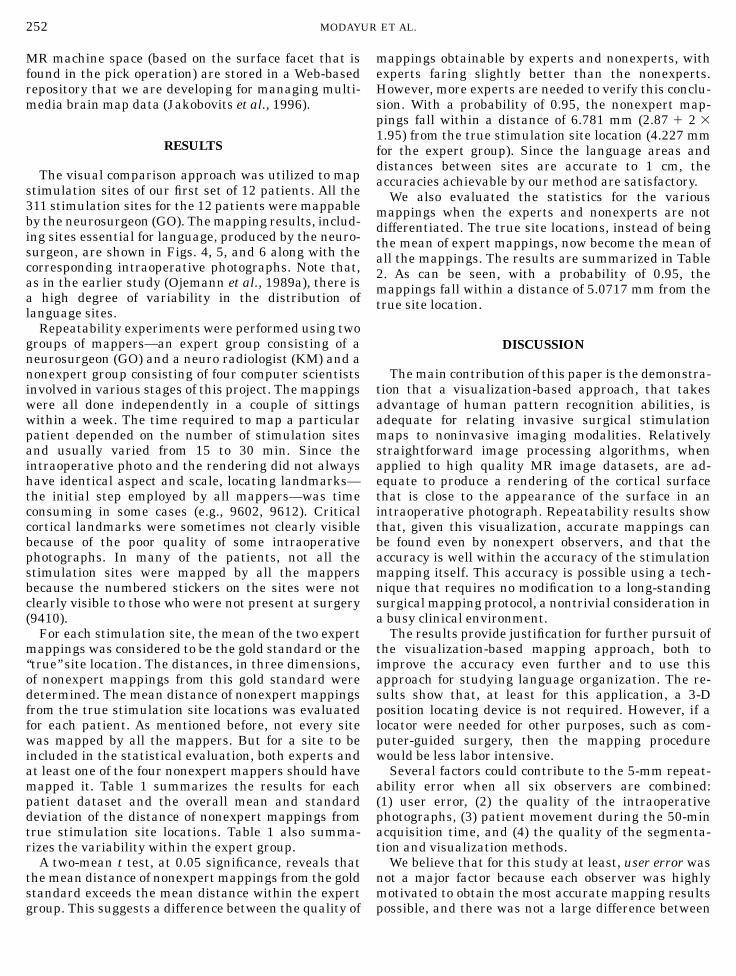
The visual comparison approach was utilized to mapstimulation sites of our first set of 12 patients. All the311 stimulation sites for the 12 patients were mappableby the neurosurgeon (GO). The mapping results, includ-ing sites essential for language, produced by the neuro-surgeon, are shown in Figs. 4, 5, and 6 along with thecorresponding intraoperative photographs. Note that,as in the earlier study (Ojemann et al., 1989a), there isa high degree of variability in the distribution oflanguage sites.
Repeatability experiments were performed using twogroups of mappers—an expert group consisting of aneurosurgeon (GO) and a neuro radiologist (KM) and anonexpert group consisting of four computer scientistsinvolved in various stages of this project. The mappingswere all done independently in a couple of sittingswithin a week. The time required to map a particularpatient depended on the number of stimulation sitesand usually varied from 15 to 30 min. Since theintraoperative photo and the rendering did not alwayshave identical aspect and scale, locating landmarks—the initial step employed by all mappers—was timeconsuming in some cases (e.g., 9602, 9612). Criticalcortical landmarks were sometimes not clearly visiblebecause of the poor quality of some intraoperativephotographs. In many of the patients, not all thestimulation sites were mapped by all the mappersbecause the numbered stickers on the sites were notclearly visible to those who were not present at surgery(9410).
For each stimulation site, the mean of the two expertmappings was considered to be the gold standard or the‘‘true’’ site location. The distances, in three dimensions,of nonexpert mappings from this gold standard weredetermined. The mean distance of nonexpert mappingsfrom the true stimulation site locations was evaluatedfor each patient. As mentioned before, not every sitewas mapped by all the mappers. But for a site to beincluded in the statistical evaluation, both experts andat least one of the four nonexpert mappers should havemapped it. Table 1 summarizes the results for eachpatient dataset and the overall mean and standarddeviation of the distance of nonexpert mappings fromtrue stimulation site locations. Table 1 also summa-rizes the variability within the expert group.
A two-mean t test, at 0.05 significance, reveals thatthe mean distance of nonexpert mappings from the goldstandard exceeds the mean distance within the expertgroup. This suggests a difference between the quality of
mappings obtainable by experts and nonexperts, withexperts faring slightly better than the nonexperts.However, more experts are needed to verify this conclu-sion. With a probability of 0.95, the nonexpert map-pings fall within a distance of 6.781 mm (2.87 1 2 31.95) from the true stimulation site location (4.227 mmfor the expert group). Since the language areas anddistances between sites are accurate to 1 cm, theaccuracies achievable by our method are satisfactory.
We also evaluated the statistics for the variousmappings when the experts and nonexperts are notdifferentiated. The true site locations, instead of beingthe mean of expert mappings, now become the mean ofall the mappings. The results are summarized in Table2. As can be seen, with a probability of 0.95, themappings fall within a distance of 5.0717 mm from thetrue site location.
DISCUSSION
The main contribution of this paper is the demonstra-tion that a visualization-based approach, that takesadvantage of human pattern recognition abilities, isadequate for relating invasive surgical stimulationmaps to noninvasive imaging modalities. Relativelystraightforward image processing algorithms, whenapplied to high quality MR image datasets, are ad-equate to produce a rendering of the cortical surfacethat is close to the appearance of the surface in anintraoperative photograph. Repeatability results showthat, given this visualization, accurate mappings canbe found even by nonexpert observers, and that theaccuracy is well within the accuracy of the stimulationmapping itself. This accuracy is possible using a tech-nique that requires no modification to a long-standingsurgical mapping protocol, a nontrivial consideration ina busy clinical environment.
The results provide justification for further pursuit ofthe visualization-based mapping approach, both toimprove the accuracy even further and to use thisapproach for studying language organization. The re-sults show that, at least for this application, a 3-Dposition locating device is not required. However, if alocator were needed for other purposes, such as com-puter-guided surgery, then the mapping procedurewould be less labor intensive.
Several factors could contribute to the 5-mm repeat-ability error when all six observers are combined:(1) user error, (2) the quality of the intraoperativephotographs, (3) patient movement during the 50-minacquisition time, and (4) the quality of the segmenta-tion and visualization methods.
We believe that for this study at least, user error wasnot a major factor because each observer was highlymotivated to obtain the most accurate mapping resultspossible, and there was not a large difference between
252 MODAYUR ET AL.
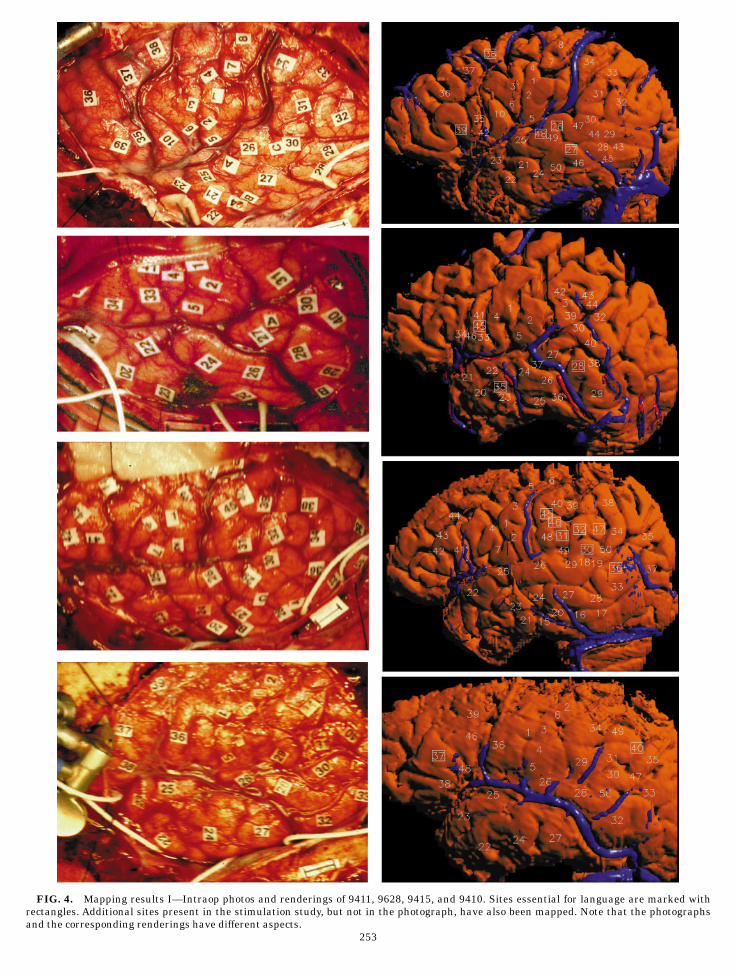
FIG. 4. Mapping results I—Intraop photos and renderings of 9411, 9628, 9415, and 9410. Sites essential for language are marked withrectangles. Additional sites present in the stimulation study, but not in the photograph, have also been mapped. Note that the photographsand the corresponding renderings have different aspects.
253
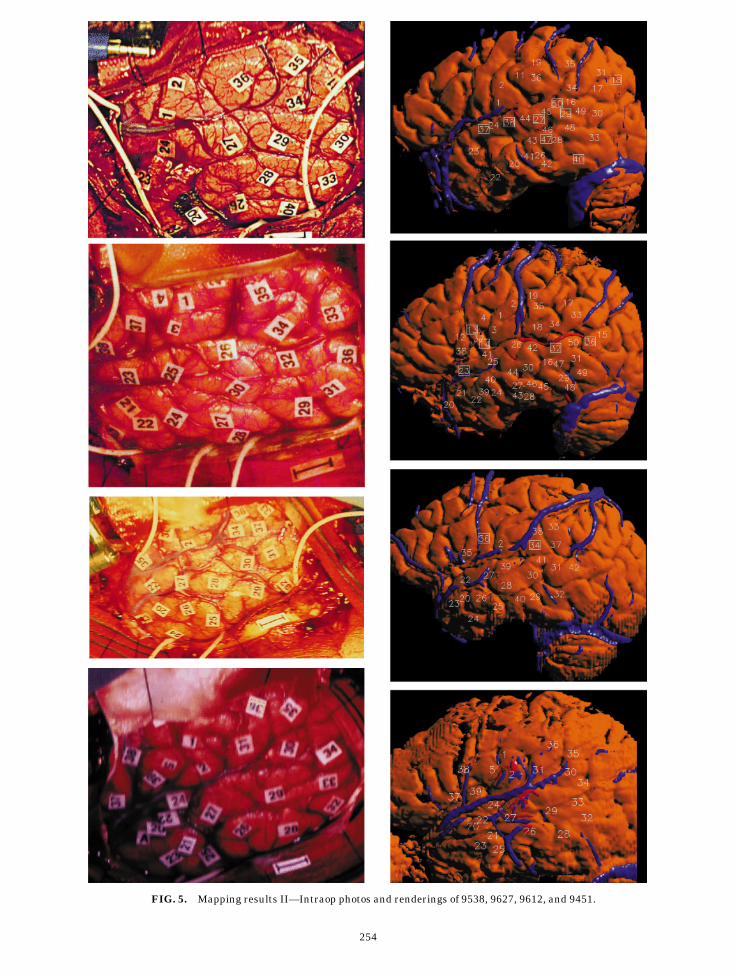
FIG. 5. Mapping results II—Intraop photos and renderings of 9538, 9627, 9612, and 9451.
254

FIG. 6. Mapping results III—Intraop photos and renderings of 9535, 9602, 9618, and 9617.
255

the experts and nonexperts. However, if this techniquewere ever to be applied on a more routine basis thenuser error could become a factor, and the use of alocating device would be more justified.
The intraoperative photographs are routinely takenas part of every surgery, using a relatively old camera. Ifthis technique becomes more commonly used then a simplereplacement of the camera with a newer digital cameracould greatly improve the quality of the photographs.
Potentially the largest source of error is patientmovement during the 50-min image acquisition time.We believe that for this study this error was not a largefactor because (1) the patients were highly motivated toremain still, (2) the patient’s head was immobilizedwith stiff sponges wedged between the head and thesides of the bird-cage head coil, and (3) the arteries andveins were used during mapping only to find the mostlikely gyrus or sulcus. Once the general area was foundthe sites were mapped by looking for correspondingsulcal patterns. In fact at least one of the observersturned off the vessel display for the detailed mapping.
Future versions of the visualization system couldtake advantage of methods that have been developedelsewhere for alignment of different image modalities.For example, the register program (Montreal Neurologi-cal Institute, 1996) requires the operator to indicatethree or more corresponding landmarks between differ-ent image datasets, after which the best-fit linear ornonlinear transform is determined such that the re-sidual error between the landmarks is minimized. Weused register on several of our datasets, but saw noappreciable difference from the original aligned data.
More recent approaches automate this process bycorrelating image intensities in the different imagedatasets (Collins et al., 1994). These techniques havethe advantage that they do not require any operatorintervention.
The other potential source of error is the quality ofthe segmentation and visualization. Although the re-gion grower and isosurface extraction routines appearto generate very good surfaces, they do not adequatelyextract the detailed sulcal anatomy, and in some casesnot all sulci and gyri are found. For this purposeongoing work using deformable models (Christensen etal., 1996; Thompson and Toga, 1996), that are aug-mented to find the cortical details, could be very useful.
Even with the current approach the repeatabilityresults show that this technique is accurate enough tobe used both for integrating different kinds of data fromthe same patient and for integrating data from mul-tiple patients. In both cases the key link is the ability tomap all forms of data to a 3-D neuroanatomical modelobtained from the MR images.
For example, many techniques have been developedto relate noninvasive imaging modalities such as PETor fMRI to MR-based anatomical images (Collins et al.,1994; Levin et al., 1989). Since the visualization-basedmapping approach allows us to relate surgical sites tothe MR-based anatomy images, these techniques canbe used to relate the surgical sites to PET and fMRIimages, among others. If, as suggested by Herholz et al.(1997), language maps obtained from noninvasivesources are highly correlated with surgical sites, then itmay be possible to altogether supplant intraoperativestudies with the more convenient noninvasive methods.
The 3-D neuroanatomical model is also the key to
TABLE 1
Repeatability Results
Patient dnonexpert /snonexpert
No. ofMappings dexpert /sexpert
No. ofMappings
9411 2.203/1.360 108 1.484/1.230 549415 3.041/2.405 124 1.787/1.439 649410 2.717/1.746 71 1.617/1.005 369535 2.588/1.430 96 1.429/1.101 485988 3.074/1.926 80 2.331/1.718 405919 2.821/1.983 84 1.645/1.168 429538 2.721/2.142 67 1.277/1.349 349602 2.709/1.799 72 1.535/0.679 369612 3.185/2.654 75 1.622/1.117 389617 3.806/2.273 48 2.509/2.042 269618 3.546/2.064 43 1.742/1.134 22
All Patients 2.870/1.955 868 1.699/1.264 440
Note. For a site to be included in the results, both the experts and atleast one nonexpert should have mapped it. The second column showsthe average distance and standard deviation of a nonexpert mappingfrom the ‘‘true’’ site location. The fourth column shows the averagedistance of the expert mappings from the ‘‘true’’ site location. In theabsence of a gold standard, the ‘‘true’’ site location is defined as themean of the expert mappings. All measurements are in mm.
TABLE 2
Overall Repeatability Results
Patient dmappings /smappings No. of Mappings
9411 1.752/1.257 1629415 2.143/1.783 1889410 2.000/1.254 1079535 1.861/1.085 1445988 2.092/1.665 1205919 2.024/1.449 1269538 1.897/1.572 1019602 2.026/1.154 1089612 2.435/1.831 1139617 2.613/2.014 749618 2.503/1.643 65
All Patients 2.077/1.497 1308
Note. The second column shows the average distance of the expertand nonexpert mappings from the ‘‘true’’ site location. If we define themean of all mappings—expert and nonexpert—to be the ‘‘true’’ sitelocation, the average distance of a mapping is 2.07 mm, with astandard deviation of 1.49 mm.
256 MODAYUR ET AL.
relating data from multiple patients. However, sinceindividual brains are highly variable with respect toeven the most common sulci and fissures, it is neces-sary to normalize the anatomical variations. Althoughthe Talairach coordinate system (Talairach and Tourn-oux, 1988) is most often used for this purpose, it is notuseful for surface mapping because of the highly vari-able gyral anatomy.
Approaches that may be more relevant for surfacemapping include a surface-based coordinate systemdeveloped by (Ojemann et al., 1989a), cortical unfolding(Sherk, 1992; Carman et al., 1995; VanEssen andMaunsell, 1980; Jouandet et al., 1989), and deformablemodels (Christensen et al., 1996; Thompson and Toga,1996). Although significant challenges remain witheach of these techniques, the need for a patient-specific3-D model is central to all of them.
The development of these and other integrationapproaches will allow us to further confirm the hypoth-esis that some but not all of the observed variability insurgical language site distribution can be correlatedwith anatomic variability. Since it has already beenshown that there is a relationship between languagesite distribution and behavioral measures such as VIQ(Ojemann et al., 1989), it may be possible to demon-strate a relationship between surface anatomy andbehavior.
Although such a demonstration will require manymore patients, the method described in this paperprovides the key to testing these kinds of hypotheses.Since many patient datasets will be needed, an addi-tional requirement is an information managementsystem that can keep track of the large amount of rawand derived image data, as well as stimulation map-ping and other clinical data. The system should alsoallow these data to be related to other language-relatedinformation available on the Internet and should pro-vide methods for visualizing the integrated results. Weare currently developing such a system as part of thenational Human Brain Project (Brinkley et al., 1996;Modayur et al., 1996).
ACKNOWLEDGMENTS
This work was sponsored by Human Brain Project GrantDC/LM02310, cofunded by the National Institute for Deafness andOther Communication Disorders, and the National Library of Medi-cine. We thank the following individuals for their help in variousaspects of this project: Ettore Lettich, Kevin Hinshaw, Rex Jakobo-vits, and Cornelius Rosse.
REFERENCES
Axel, L., Constantini, J., and Listerud, J. 1987. Intensity correction insurface-coil MR imaging. Am. J.Radiol. 148:418–420.
Binder, J., Rao, S., Hammeke, T., Frost, J., Bandettini, P., Jesmano-wicz, A., and Hyde, J. 1995. Lateralized human brain languagesystems demonstrated by task subtraction functional magneticresonance imaging. Arch. Neurol. 52:593–601.
Binder, J., Swanson, S., Hammeke, T., Morris, G., Mueller, W.,Fischer, M., Benbadis, S., Frost, J., Rao, S., and Haughton, V. 1996.Determination of language dominance using functional MRI: Acomparison with WADA test. Neurology 46:978–984.
Brinkley, J., Myers, L., Prothero, J., Heil, G., Tsuruda, J., Maravilla,K., Ojemann, G., and Rosse, C. 1996. A structural informationframework for brain mapping. In Neuroinformatics: An Overview ofthe Brain Project (S. H. Koslow and M. F. Huerta, Eds.), pp.309–334.
Brinkley, J., and Prothero, J. 1997. Slisp: A flexible software toolkitfor hybrid, embedded and distributed applications. Software Pract.Exp. 27(1):33–48.
Carman, G., Drury, H., and Van Essen, D. 1995. Computationalmethods for reconstructing and unfolding the cortex. CerebralCortex 5(6):506–517.
Christensen, G., Miller, M., and Vannier, M. 1996. Individualizingneuroanatomical atlases using a massively parallel computer.IEEE Comp. 29(1):32–38.
Collins, D. L., Neelin, P., Peters, T. M., and Evans, A. C. 1994.Automatic 3-D intersubject registration of MR volumetric data instandardized Talairach space. J. Comp. Assist. Tomogr. 2:192–205.
Dawant, B., Zijdenbos, A., and Margolin, R. 1993. Correction ofintensity variations in MR images for computer-aided tissueclassification. IEEE Trans. Med. Imaging 12:770–781.
Demonet, J., Chollet, F., and Ramsay, S. 1992. The anatomy ofphonological and semantic processing in normal subjects. Brain115:1753–1768.
Elvins, T. 1992. A survey of algorithms for volume visualization.Comput. Graph. 26(3):194–201.
Evans, A. C., Marrett, S., Torrescorzo, J., Ku, S., and Collins, L. 1991.MRI-PET correlation in three dimensions using a volume-of-interest (VOI) atlas. J. Cerebr. Blood Flow Metab. 11:A69–A78.
Haglund, M., Ojemann, G., and Hochman, D. 1992. Optical imagingof epileptiform and functional activity in human cerebral cortex.Nature 358:668–671.
Haglund, M., Berger, M., Shamseldin, M., Lettich, E., and Ojemann,G. 1993. Cortical localization of temporal lobe language sites inpatients with gliomas. Neurosurgery 34(4):567–576.
Hayes, C., Tsuruda, J., and Mathis, C. 1993. Temporal lobes: SurfaceMR coil phased-array imaging. Radiology 189(3):918–920.
Herholz, K., Thiel, A., von Stockhausen, H., Reulen, H., Kessler, J.,Ilmberger, J., and Heiss, W. 1997. Presurgical localization oflanguage-related cortex in patients with gliomas of the dominanthemisphere. Neurology 48(3)(Suppl.):A31.
Montreal Neurological Institute, 1996. http://www.mni.mcgill.ca/workshop.html.
Jakobovits, R., Modayur, B., and Brinkley, J. 1996. A Web-basedrepository manager for brain mapping data. AMIA Fall Sympo-sium Washington, DC, 309–313.
Jouandet, M., Tramo, M., Herron, D., Hermann, A., Loftus, W.,Bazell, J., and Gazzaniga, M. 1989. Brainprints: Computer-generated two-dimensional maps of the human cerebral cortex invivo. J. Cog. Neurosci. 1:88–117.
Levin, D., Hu, X., Tan, K., Galhotra, S., Pelizzari, C., Chen, G.,Beck, R., Chen, C., Cooper, M., Mullan, J., Hekmatpanah, J., andSpire, J. 1989. The Brain: Integrated three-dimensional display ofMR and PET images. Radiology 172:783–789.
Lim, K., and Pfefferbaum, A. 1989. Segmentation of MR brain imagesin to CSF spaces, white, and gray matter. J. Cat. 13(4):588–593.
Lorensen, W., and Cline, H. 1987. Marching cubes: A high resolution3-D surface construction algorithm. Comp. Graph. 21(4):163–169.
MacDonald, D., Avis, D., and Evans, A. 1995. Multiple surface
257VISUALIZATION-BASED MAPPING

identification and matching in magnetic resonance images. Visual.Biomed. Comp.
Modayur, B., Prothero, J., Rosse, C., Jakobovits, R., and Brinkley, J.1996. Visualization and mapping of neurosurgical functional braindata onto a 3-D MR-based model of the brain surface. AMIA FallSymposium Washington DC, 304–308.
Myers, L., and Brinkley, J. 1995. Visualization of brain surfacefeatures using registered partially segmented MRI scans. SPIEMed. Imaging: Image Display, 43–52.
Ojemann, G., Ojemann, J., Lettich, E., and Berger, M. 1989a. Corticallanguage localization in left, dominant hemisphere. J. Neurosurg.71:316–326.
Ojemann, G., Fried, I., and Lettich, E. 1989b. Electrocorticographic(ECOG) correlates of language. I. desynchronization in temporallanguage cortex during object naming. EEG Clin. Neurophysiol.73:453–463.
Ojemann, G. 1991. Cortical organization of language and verbalmemory based on intraoperative investigations. Progr. SensoryPhysiol. 12:193–210.
Petersen, S., Fox, P., Posner, M., Mintun, M., and Raichle, M. 1988.Positron emission tomographic studies of the cortical anatomy ofsingle-word processing. Nature 331:585–589.
Sherk, H. 1992. Flattening the cerebral cortex by computer. J.Neurosci. Methods 41(3):255–267.
Talairach, J., and Tournoux, P. 1988. Co-planar Stereotaxic Atlas ofthe Human Brain. 3-Dimensional Proportional System: An Ap-proach to Cerebral Imaging. Thieme, New York.
Thompson, P., and Toga, A. 1996. A surface-based technique forwarping three-dimensional images of the brain. IEEE Trans. Med.Imaging 15(4):402–417.
Van Essen, D., and Maunsell, J. 1980. Two-dimensional maps of thecerebral cortex. J. Comp. Neurol. 191:255–281.
258 MODAYUR ET AL.