visteon corporation investor day boulet, general manager, interiors europe and south america ......
TRANSCRIPT

Visteon Corporation Investor Day
July 27, 2011

Page 3
Investor DayWelcome / Introductions
Bill Quigley
Executive Vice Presidentand CFO
Page 3

Page 4
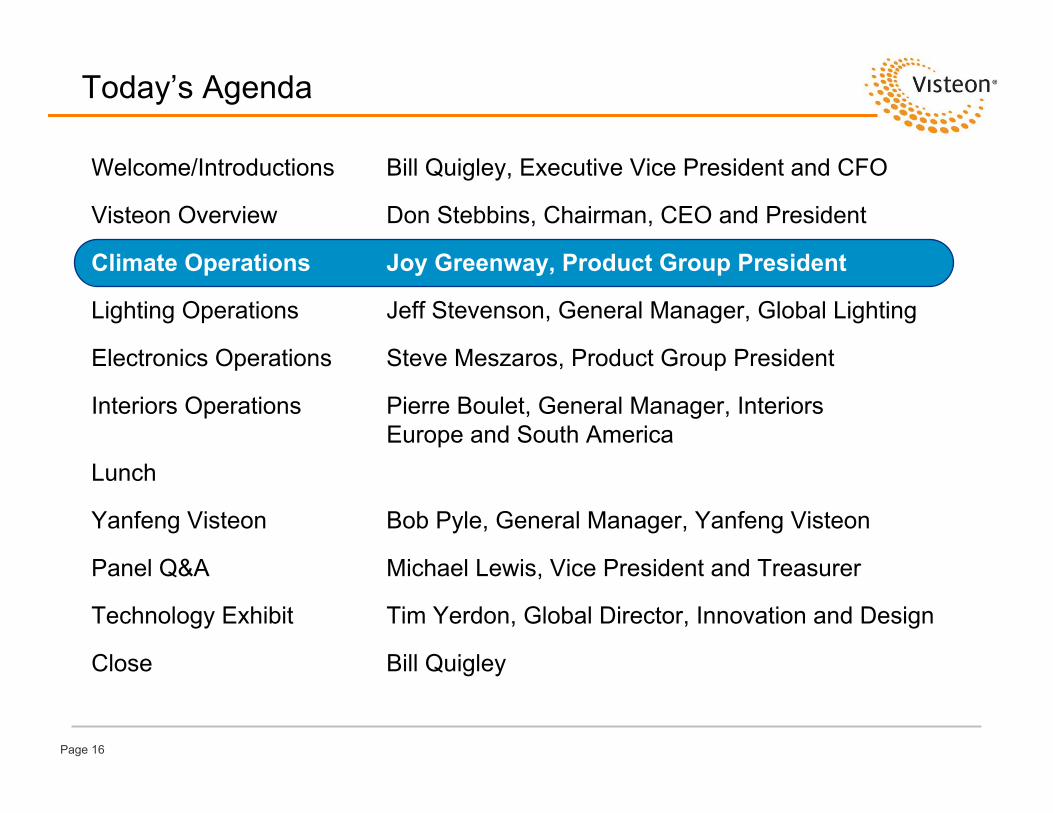
Today’s Agenda
Bill QuigleyClose
Tim Yerdon, Global Director, Innovation and DesignTechnology Exhibit
Michael Lewis, Vice President and TreasurerPanel Q&A
Bob Pyle, General Manager, Yanfeng VisteonYanfeng Visteon
Lunch
Pierre Boulet, General Manager, Interiors Europe and South America
Interiors Operations
Steve Meszaros, Product Group PresidentElectronics Operations
Jeff Stevenson, General Manager, Global LightingLighting Operations
Joy Greenway, Product Group PresidentClimate Operations
Don Stebbins, Chairman, CEO and PresidentVisteon Overview
Bill Quigley, Executive Vice President and CFOWelcome/Introductions

Page 5
Today’s Agenda
Bill QuigleyClose
Tim Yerdon, Global Director, Innovation and DesignTechnology Exhibit
Michael Lewis, Vice President and TreasurerPanel Q&A
Bob Pyle, General Manager, Yanfeng VisteonYanfeng Visteon
Lunch
Pierre Boulet, General Manager, Interiors Europe and South America
Interiors Operations
Steve Meszaros, Product Group PresidentElectronics Operations
Jeff Stevenson, General Manager, Global LightingLighting Operations
Joy Greenway, Product Group PresidentClimate Operations
Don Stebbins, Chairman, CEO and PresidentVisteon Overview
Bill Quigley, Executive Vice President and CFOWelcome/Introductions

Page 6
Investor DayVisteon Overview
Don Stebbins
Chairman, CEO and President
Page 6

Page 7 Please see important disclosures regarding “Forward Looking Information”
Visteon Overview
Leading global automotive supplier of climate, interiors, electronics and lighting products
Global manufacturing and engineering footprint with emphasis on low-cost regions
Strategically positioned to capitalize on emerging markets growth
Streamlined organization with strong balance sheet and competitive leverage
Electric Compressor
Reconfigurable Cluster
IlluminatedDoor Panel
Bi-Functional High Intensity Discharge (HID) Projector with Light Emitting Diodes (LEDs)
Page 8
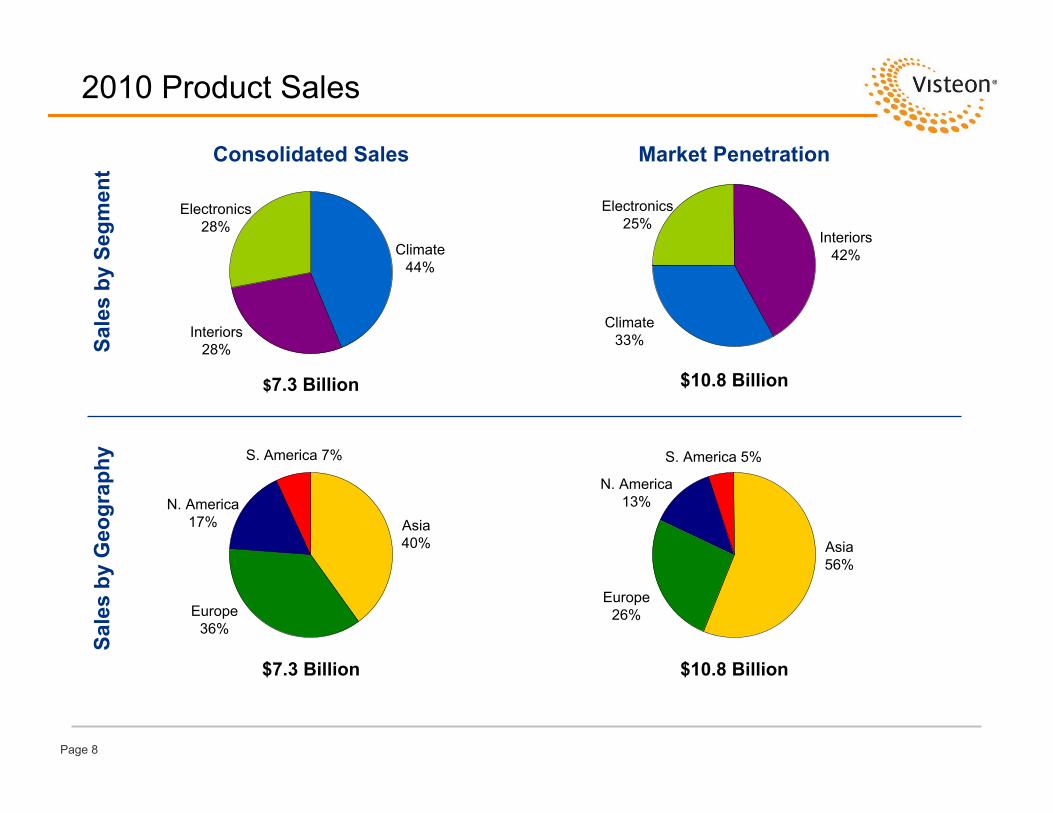
2010 Product SalesSa
les
by S
egm
ent
Climate44%
Interiors28%
Electronics28%
$7.3 Billion
Asia40%
Europe36%
N. America17%
S. America 7%
$10.8 Billion
Electronics25%
Interiors42%
Climate33%
Consolidated Sales Market Penetration
$7.3 Billion $10.8 Billion
Asia56%
Europe26%
N. America13%
S. America 5%
Sale
s by
Geo
grap
hy
Page 9
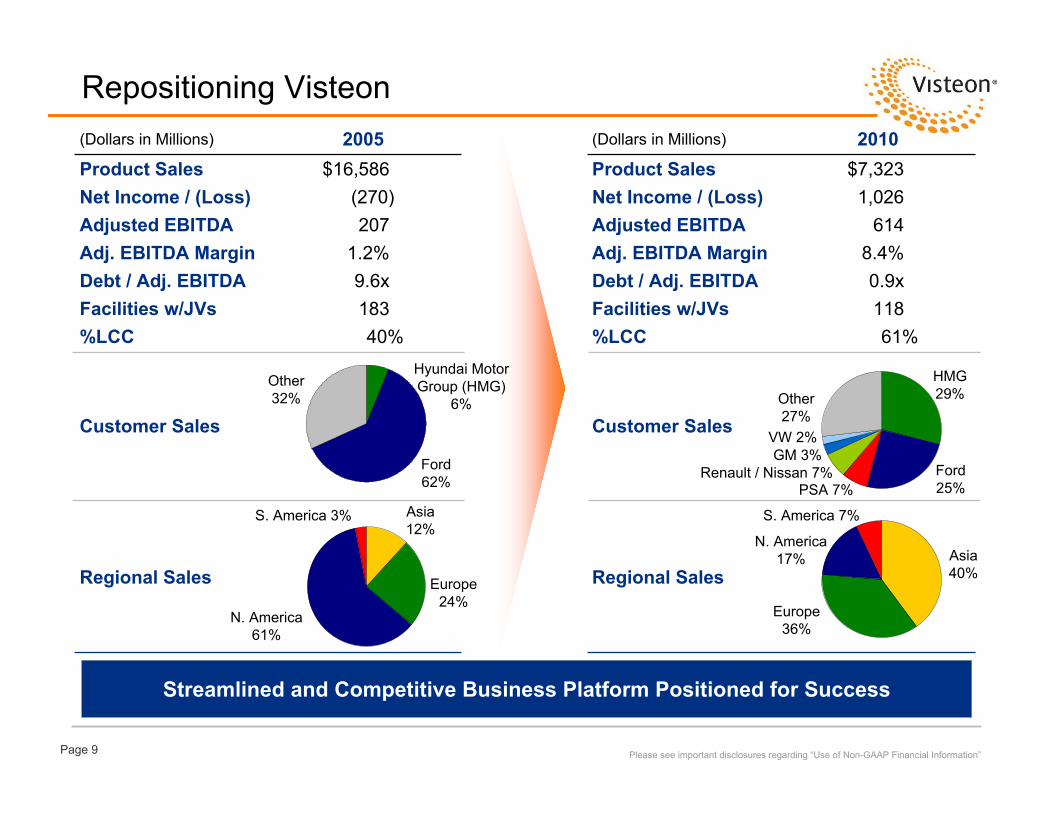
Repositioning Visteon
(270)Net Income / (Loss)207Adjusted EBITDA
40%%LCC183Facilities w/JVs
Customer Sales
9.6xDebt / Adj. EBITDA
Regional Sales
1.2%Adj. EBITDA Margin
$16,5862005
Product Sales(Dollars in Millions)
Asia12%
N. America61%
S. America 3%
Other32%
Ford62%
Streamlined and Competitive Business Platform Positioned for Success
1,026Net Income / (Loss)614Adjusted EBITDA
61%%LCC118Facilities w/JVs
Customer Sales
0.9xDebt / Adj. EBITDA
Regional Sales
8.4%
$7,3232010
Adj. EBITDA Margin
Product Sales(Dollars in Millions)
Europe24%
Asia40%
Europe36%
N. America17%
S. America 7%
Other27%
HMG29%
Ford25%
Please see important disclosures regarding “Use of Non-GAAP Financial Information”
Hyundai Motor Group (HMG)
6%
PSA 7%Renault / Nissan 7%
GM 3%VW 2%

Page 10
7% 5%
17%13%
36%
26%
40%56%
ConsolidatedSales
MarketPenetration
2010 Global Production Volumes(Units in Millions)
Well Positioned With Global Vehicle Production Levels
S. AmericaN. AmericaEuropeAsia Pacific
$7.3B $10.8B
(1) Rebased to 100% to show the percent each region contributes to total Visteon sales.
2010 Full Year2010 Actual
2920.9Europe
1711.9N. America
64.1S. America
100%71.7Total
49%34.8Asia Pacific
% TotalUnits
Visteon Sales Contribution by Region (1)
Source: IHS Automotive.
$2.0B $2.9B
Q1 2011
5% 4%
16% 11%
39%
28%
40%57%
ConsolidatedSales
MarketPenetration
Regional Contribution

Page 11
Organic Growth
$60
$360$280
$700
2011 2012 2013 2011-2013Cum.
(Dollars in Millions)Backlog (as of 12/31/2010)
Strong Product / Technology Portfolio Continues to Drive New Business Wins
Region
PSA 7%
Other 17%
Please see important disclosures regarding “Forward Looking Information”
HMG61%
Ford 15%
Asia Pacific
79%
NA / EU / SA21%
Customer
$47
$150$172
$237
$304
Q1 2010 Q2 2010 Q3 2010 Q4 2010 Q1 2011
New Business Wins Q1 2011 Results
Region
R/N 5%
Other 19% HMG
40%
Ford 36%
Asia Pacific
68%
NA / EU / SA32%
Customer

Page 12
Adjusted EBITDA Margin Growth Objective
Focused on Driving Double Digit Adjusted EBITDA Margins By 2014
Please see important disclosures regarding “Forward Looking Information” and “Use of Non-GAAP Financial Information”
2010 vs. 2014E Objective
2010 Actual
2014 Objective
Volume / Mix
8.4%
10%+
StructuralCost
Leverage
Net Cost Performance
InputCosts

Page 13
Product Portfolio Aligned with Market Trends
Consumer Experience
Fuel Efficiency and Reduced
Emissions
Manufacturing and Product Development
Scale
Visteon Advantage
ResultingAutomotive
Trends
Macro Changes
Global scale with regional adaptations
Lower cost components given commonality with multiple platforms across regions
Ability to design / develop low-cost and premium product offerings for market requirements
Lower weight components through non-conventional design / engineering
Electric compressors, controls and lithium-ion battery cooling capabilities for hybrid and electric vehicles
LED technology requiring lower power consumption and enhancing fuel efficiency
Product innovations such as compact HVAC and integrated Audio Climate Driver Information enhance driver comfort
Rapidly expanding cockpit technologies, integrating consumer electronics
Ability to customize interiors to suit consumer tastes
Please see important disclosures regarding “Forward Looking Information”
Climate Change and Regulatory Environment
Customers’Cost Competitiveness
Consumer Experience / Product Differentiation

Page 14
Climate Electronics Interiors Lighting
Technology Developments by Product Group
Fully integrated compressor, electric
motor, power inverter and oil separator to maximize
fuel economy, enable battery cooling, and
provide air conditioning to electric vehicles
Enable adoption of HEV and EV powertrains by providing passenger comfort and battery
thermal management
Mar
ket
Driv
ers
Vist
eon
Solu
tion
Vehicle manufacturers responding to consumer trends for personalization
and high levels of craftsmanship
Premium digital display instrument cluster
platform – supports complex graphic and video features and
complete personalization of the system
Visteon Light Reinforcement (VLR™) –
A lightweight door reinforcement technology
that allows airbag deployment without costly
/ heavy welded reinforcements
Address the demand for personalization via a suite
of technologies which facilitate product
differentiation and cost-effective customization
Advanced Front Lighting System (AFS) –
Improves visibility through turns and
adapts beam pattern to current driving
conditions
Improved visibility and safety through a unique system that adapts the beam pattern according to surroundings creating
more awareness
Please see important disclosures regarding “Forward Looking Information”

Page 15
Moving Forward
Invest in those product segments where we believe we can achieve market leadership and competitive differentiation to drive above market returns– For product segments and assets that do not meet these criteria, we
will seek to maximize value on a thoughtful and disciplined basis
Fortify our anchor customer positions and relationships and capitalize on customer diversification opportunities
Leverage our strong emerging market footprint and positions
Continue our aggressive approach to cost and investment to drive margin expansion and to generate meaningful free cash flow
Maintain financial flexibility to further our position and value in the market
Please see important disclosures regarding “Forward Looking Information”
Focused On Our Continued Strategy Of Optimizing Visteon’s Business Portfolio To Maximize Shareholder Value
Page 16
Today’s Agenda
Bill QuigleyClose
Tim Yerdon, Global Director, Innovation and DesignTechnology Exhibit
Michael Lewis, Vice President and TreasurerPanel Q&A
Bob Pyle, General Manager, Yanfeng VisteonYanfeng Visteon
Lunch
Pierre Boulet, General Manager, Interiors Europe and South America
Interiors Operations
Steve Meszaros, Product Group PresidentElectronics Operations
Jeff Stevenson, General Manager, Global LightingLighting Operations
Joy Greenway, Product Group PresidentClimate Operations
Don Stebbins, Chairman, CEO and PresidentVisteon Overview
Bill Quigley, Executive Vice President and CFOWelcome/Introductions

Page 18
Investor DayClimate Operations
Joy Greenway
Product Group President
Page 18

Page 19
Climate Product GroupProducts and Market PositionsHighlights / Advantages
• #2 market position overall in attractive $32 billion industry segment with few dominant players
• One of two global suppliers with full product portfolio for climate systems
• Balanced global product mix with unique strengths in key markets (#1 in Korea, #2 in US and India, #3 in China)
• Well positioned to take advantage of Asia growth
Strong Market Position, Attractive Industry Dynamics
#2 Global Market Position
2010 Product SalesSummary Financials ($M)By Customer By Vehicle Sales Region$3,600
$3,100
$2,500
$3,300
6.7%6.9%
10.2%10.1%
2007 2008 2009 2010Sales % Gross Margin (ex. OPEB / Reorg / FSA)
HVAC(#4)Compressor
(#3)
Powertrain Cooling(#4) Fluid Transport
(#1)
Source: Global Insights
HMG54%Ford
30%
Other11%
Maruti-Suzuki
2%
Mazda3%
NA18%
SA6%
EU26%
AP50%
Page 20
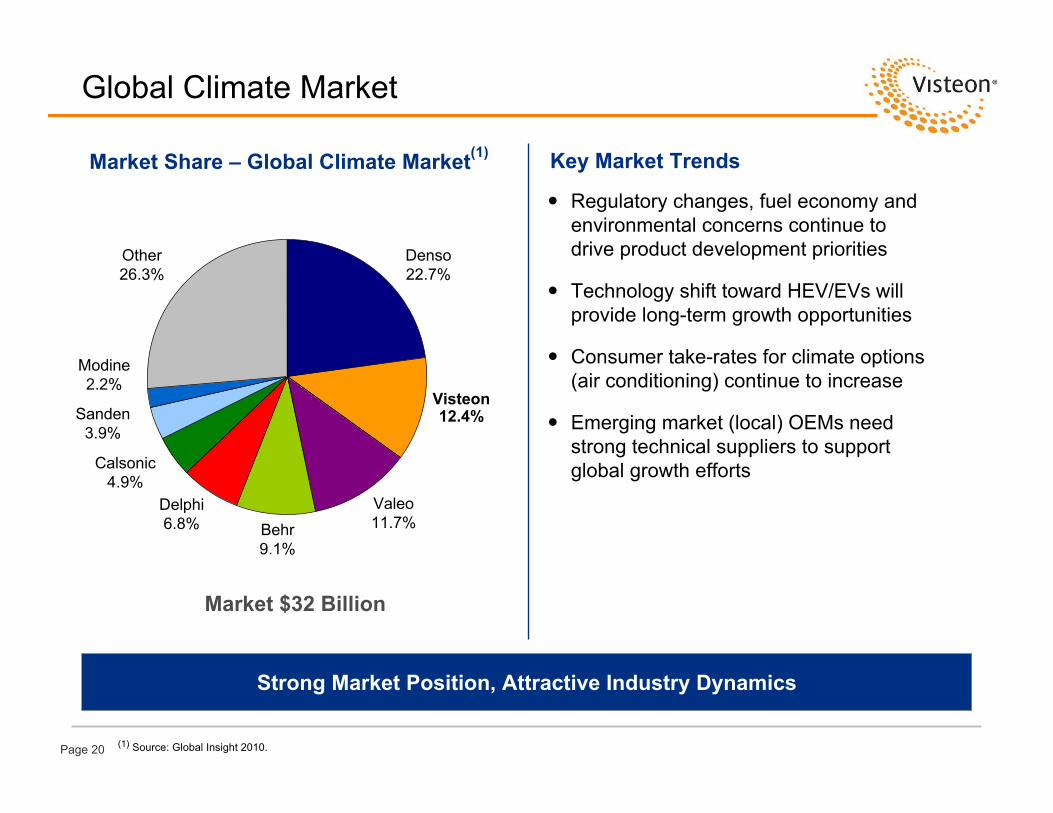
Market Share – Global Climate Market(1) Key Market Trends
(1) Source: Global Insight 2010.
Strong Market Position, Attractive Industry Dynamics
Global Climate Market
Regulatory changes, fuel economy and environmental concerns continue to drive product development priorities
Technology shift toward HEV/EVs will provide long-term growth opportunities
Consumer take-rates for climate options (air conditioning) continue to increase
Emerging market (local) OEMs need strong technical suppliers to support global growth efforts
Visteon 12.4%
Denso22.7%
Valeo11.7%
Delphi6.8% Behr
9.1%
Calsonic4.9%
Other26.3%
Modine2.2%
Sanden3.9%
Market $32 Billion

Page 21
Key Product Offerings
#2 Overall Player in the Global Climate Automotive Industry
#1$300A/C lines and hoses
Internal heat exchanger (IHX)
Metal seal fitting (MSF)
Fluid Transport
$1,200
$1,200
$400
2010 Sales ($ in Mil)(1)
#4
#4
#3
VC Market Position
Radiator, condenser
Charge air cooler
Exhaust gas recirculation (EGR)
Exhaust heat recovery (EHRS)
Compact
Center mount
Straight airflow path and flat
Battery chiller and cooler
Electric
Variable swashplate
Rotary suction swashplate
Fixed scroll
Description
Compressor
HVAC
Powertrain Cooling
Key Competitors
(1) Engine induction systems and other sales $200 Mil

Page 22
Climate Technical Centers
Global Engineering Coverage for Fast Customer Response and Quality Execution
Juarez MEXICO
Major Innovation CenterEngineering (Applications, Simultaneous)
Headcount Profile
Low Cost68%
High Cost32%
Kerpen GERMANY
DaejeonSOUTH KOREA
HiroshimaJAPAN
Van Buren Twp, MIUNITED STATES
Nový JičinCZECH REPUBLIC

Page 23
Climate Manufacturing Locations
Unparalleled Low Cost Global Manufacturing Footprint
Juarez (4 Plants)MEXICO
São PauloBRAZIL
QuilmesARGENTINA
Belleville CANADA
Shorter, ALUNITED STATES
Rio Grande
Port Elizabeth, SOUTH AFRICA
Visteon FacilitiesJV Facilities
Headcount Profile
Low Cost65%
High Cost35%
PalmelaPORTUGAL
CharlevilleFRANCE
Nový Jičin, Hluk,
RychvaldCZECH REP
SzekesfehervarHUNGARY
IlavaSLOVAKIA
GebzeTURKEY Chennai
BhiwadiINDIAPune
Hiroshima,Hofu
JAPAN
RayongTHAILAND
Daejeon,Pyeongtaek,
UlsanKOREA
DalianCHINA
Chongqing
Beijing
Nanchang
Changchun
Nanjing
JinanChengdu

Page 24
Visteon / HCC Relationship
Climate President
Global Growth Customers
Traditional HCCCustomers
Traditional VisteonCustomers
FunctionalEfficiencies
Engineering ManufacturingPurchasing
Leveraging Strengths
One Climate
Visteon / HCC Operations
70% Ownership since 198630% publicly held through the Korea Stock Exchange

Page 25
Denso26%
Visteon14%
Calsonic Kansei
6%
Delphi4%
Other34%
Behr4%
Valeo5%
Sanden4%
Doowon3%
Climate Asia Pacific Market Leadership
Asia Pacific market leader – clearly positioned as #2
17 manufacturing sites
Fully-integrated global operations
Established partnerships– Mazda/Panasonic Japan Climate System (Nanjing)– FAWER Visteon Climate Control
(Changchun, Chengdu)– Jiangling Motors (Nanchang)– Geely (Jinan) – BAIC (Beijing)– Maruti Suzuki: Climate Systems India (Bhiwadi)
2010 Asia PacificMarket Share
Source: Global Insights
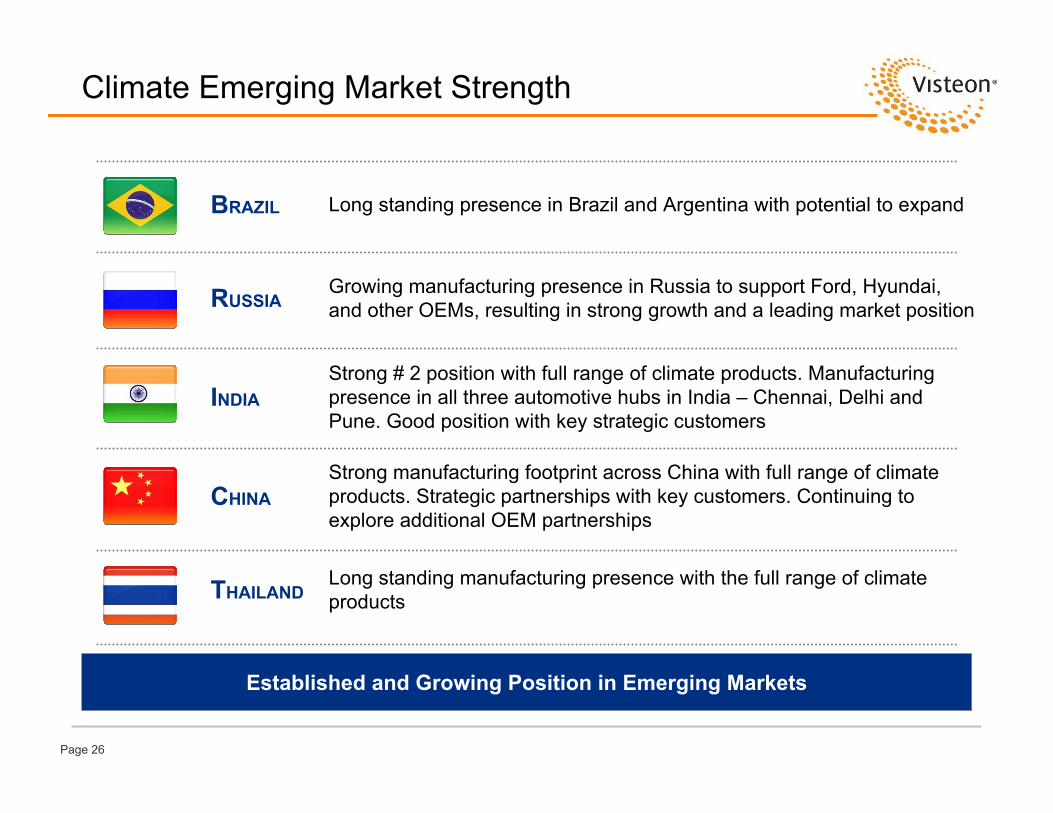
Page 26
Strong # 2 position with full range of climate products. Manufacturing presence in all three automotive hubs in India – Chennai, Delhi and Pune. Good position with key strategic customers
INDIA
Long standing manufacturing presence with the full range of climate productsTHAILAND
Strong manufacturing footprint across China with full range of climate products. Strategic partnerships with key customers. Continuing to explore additional OEM partnerships
CHINA
Growing manufacturing presence in Russia to support Ford, Hyundai, and other OEMs, resulting in strong growth and a leading market positionRUSSIA
Long standing presence in Brazil and Argentina with potential to expandBRAZIL
Climate Emerging Market Strength
Established and Growing Position in Emerging Markets
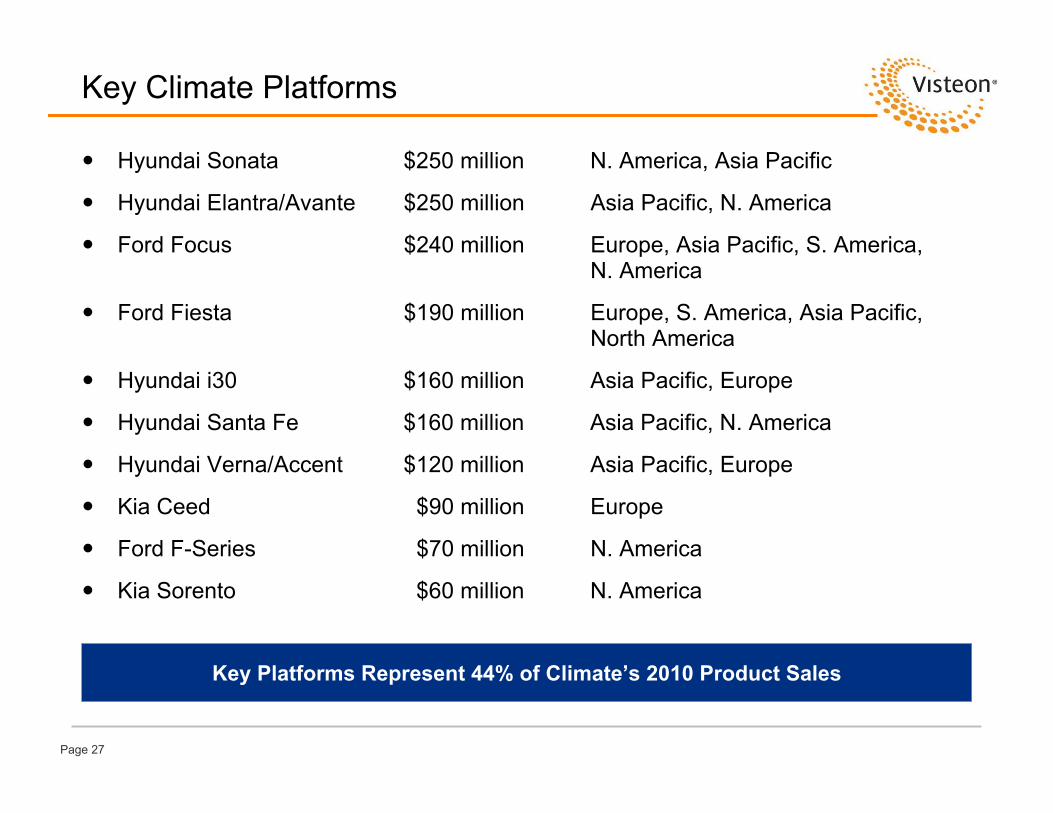
Page 27
Key Climate Platforms
Hyundai Sonata $250 million N. America, Asia Pacific
Hyundai Elantra/Avante $250 million Asia Pacific, N. America
Ford Focus $240 million Europe, Asia Pacific, S. America, N. America
Ford Fiesta $190 million Europe, S. America, Asia Pacific, North America
Hyundai i30 $160 million Asia Pacific, Europe
Hyundai Santa Fe $160 million Asia Pacific, N. America
Hyundai Verna/Accent $120 million Asia Pacific, Europe
Kia Ceed $90 million Europe
Ford F-Series $70 million N. America
Kia Sorento $60 million N. America
Key Platforms Represent 44% of Climate’s 2010 Product Sales

Page 28
Capital Expenditure and Capacity Utilization
67% 73%
90%
75%
N. America Europe Asia Pacific S. America
Capacity Utilization Remains Strong with Global Standardization and Flexibility
Capacity Utilization by Region (%)2010
Capital Expenditures ($M)
17%20Cost, Quality, Other
4%5Maintenance
79%$95Program
2010 Full Year
100%$120Total
% of TotalTotal Spend

Page 29Page 29
Technology Drivers
Fuel efficiency Components, systems Control strategies
Efficiency
Time to comfortCabin air qualityReduced Noise, Vibration and Harshness (NVH)
Consumer Experience
Global platforms and scaleGrowth market specificationsFaster development cycles
Leading Cost
Compact designLess material usage, new materials
Smaller and Lighter
Electric and hybrid vehicle systems and componentsAlternate refrigerant systems, low global warming potentialRenewable and recyclable materials, emission reduction
Green
Market Trends Driving Significant Opportunities for Advanced Technology

Page 30
Electrification Contribution to Climate Market
Contribution of Added Content to Climate Market
Market ($B)
2
1
0
2020
2.5
0.9
1.6
2015
1.7
0.6
1.1
2010
0.5
0.2
0.3
3Electric CompressorHeat Exchangers, Fluid Transport
Electrification Could Contribute $2.5B to the Climate Market by 2020
Source: BCG analysis; Edmunds; ACEA; Autonews; The Daily Yoimuiri; Global Insight

Page 31
Climate Production-Ready Technologies
2012U-Flow Exhaust Gas Recirculation (EGR)
2011Metal Seal Fitting (MSF)
2011
2011
2011
2010
Production Ready
e-Compressor*
Battery Chiller and Contact Heat Exchanger
Cold Storage Evaporator
Straight Airflow Path (SAP) HVAC
Macro Trend Addressed
Green
Efficiency
Green
Consumer Experience
Consumer Experience
Consumer Experience
Smaller Lighter
Green (HEV/EV)
Green (HEV/EV)
Green (Stop-Start)
Consumer Experience
* Governmental funding
Efficiency

Page 32
2013 2014 2015 2016 2017 2018 2020Production
Ready
V-Flow
IHX
Condenser
Evaporator
2nd Condenser
EXV
Rec
Drie
r
Com
pres
sor
HVAC
A/C and Heat Pump for HEV and EV*
Thermo Electric Distributed Heating and Cooling*
Climate Technology Pipeline
Exhaust Heat Recovery System
High Efficiency A/C System for EV*
* Governmental funding
High Voltage, Stacked Cooling Module for Fuel
Cell Vehicle*
2019
Intelligent Cabin Air Quality System*

Page 33
Innovation
Revenue From Advanced Technology
Highlights/Advantages
Efficient Advanced Technology Development Driving Innovative Solutions
Advanced Technology Commercialization
Intellectual Property
• Globally aligned, market focused advanced technology development
• Strong vehicle and system level understanding enabling component excellence
• Proven CAD tools and development process• Industry recognized thermodynamic expertise• Comprehensive development capabilities
New Technology29%
<3 Years3-5 Years
>5 Years
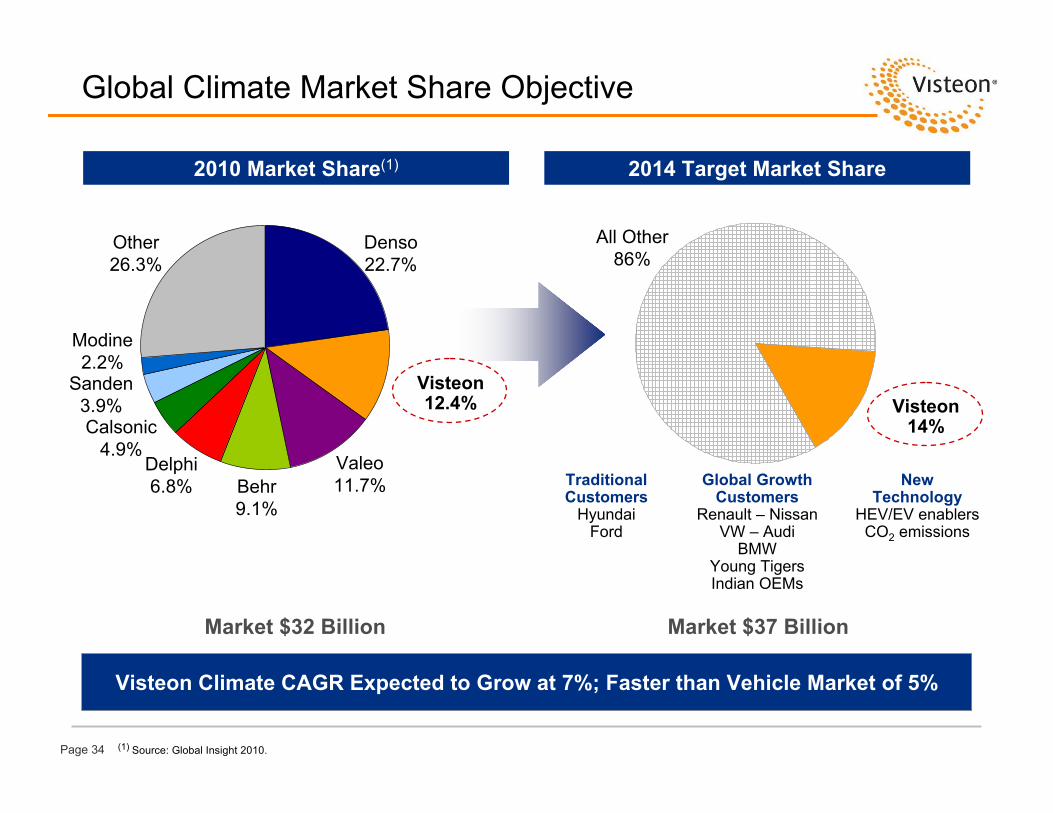
Page 34
Global Climate Market Share Objective
(1) Source: Global Insight 2010.
All Other86%
2010 Market Share(1) 2014 Target Market Share
Visteon 12.4%
Denso22.7%
Valeo11.7%
Delphi6.8% Behr
9.1%
Calsonic4.9%
Other26.3%
Modine2.2%
Sanden3.9%
Visteon Climate CAGR Expected to Grow at 7%; Faster than Vehicle Market of 5%
Traditional Customers
HyundaiFord
Global Growth Customers
Renault – NissanVW – Audi
BMWYoung TigersIndian OEMs
New Technology
HEV/EV enablersCO2 emissions
Visteon 14%
Market $32 Billion Market $37 Billion
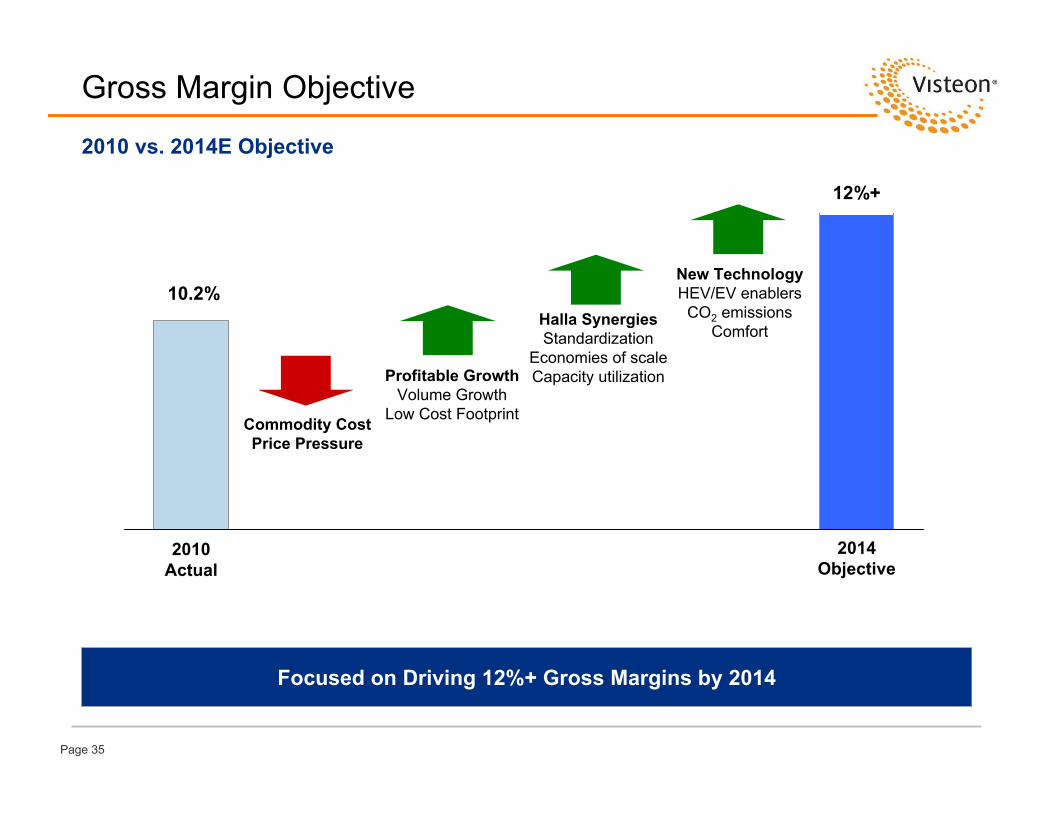
Page 35
Gross Margin Objective
2010 vs. 2014E Objective
Focused on Driving 12%+ Gross Margins by 2014
2010 Actual
2014 Objective
Profitable GrowthVolume Growth
Low Cost Footprint
10.2%
12%+
Halla SynergiesStandardization
Economies of scaleCapacity utilization
New TechnologyHEV/EV enablers
CO2 emissionsComfort
Commodity CostPrice Pressure

Page 36
Climate Summary
Key Strengths
Strong market position – #2 globally
Attractive industry dynamics – few large players
Low cost, global footprint
Strong relationship with strategic customers
Technology for electrified vehicles and new regulations

Page 37
Today’s Agenda
Bill QuigleyClose
Tim Yerdon, Global Director, Innovation and DesignTechnology Exhibit
Michael Lewis, Vice President and TreasurerPanel Q&A
Bob Pyle, General Manager, Yanfeng VisteonYanfeng Visteon
Lunch
Pierre Boulet, General Manager, Interiors Europe and South America
Interiors Operations
Steve Meszaros, Product Group PresidentElectronics Operations
Jeff Stevenson, General Manager, Global LightingLighting Operations
Joy Greenway, Product Group PresidentClimate Operations
Don Stebbins, Chairman, CEO and PresidentVisteon Overview
Bill Quigley, Executive Vice President and CFOWelcome/Introductions

Page 39
Investor DayLighting Operations
Jeff Stevenson
General Manager, Global Lighting
Page 39

Page 40
Lighting Product LineProductsHighlights
• #6 market position overall in rapidly growing $9.5 billion industry segment
• Full product portfolio for exterior lighting systems, including projector and electronics manufacturing
• Balanced global product mix with low cost engineering and manufacturing in key global markets
• Well-positioned to take advantage of Asia growth
#6 Global Market Position
Head Lamps Center High Mount Stop Lamps,Aux Lamps
Rear Lamps
#6 Global Market Position
2010 Product Line SalesSummary Financials ($M)By Customer By Region
Projectors Electronic Modules
GM31%
Ford26%
VW12%
PSA12%
Other19%
EU46%
NA35%
AP18%
SA1%
$577
$361$456
$56
$72
$96
(7%)(6%)
3%
2008 2009 2010
Consolidated Unconsolidated % Consol. Gross Margin (ex. OPEB / Reorg / FSA)

Page 41
Market Share – Global Lighting Market Key Market Trends
Source: Global Insight 2010.
Increasing Revenue Per Vehicle
Global Lighting Market
Koito 16%
Visteon6%
Valeo15%
Magneti Marelli 14%
Hella 11%
Stanley 10%
Samlip 4%
Other14%
Ichiko 4%
Magna 3%
ACH 3%
Products / TechnologiesExterior vehicle styling enhancementsContinuously evolving legislation and safety requirementsSignificant growth of LED content
CustomersGlobal expansion by Major OEMsIncreased investment on Lighting productsFootprint/Localization requirements
New MarketsMajor expansion – China, India, Brazil and Russia
Market $9.5 Billion
Page 42
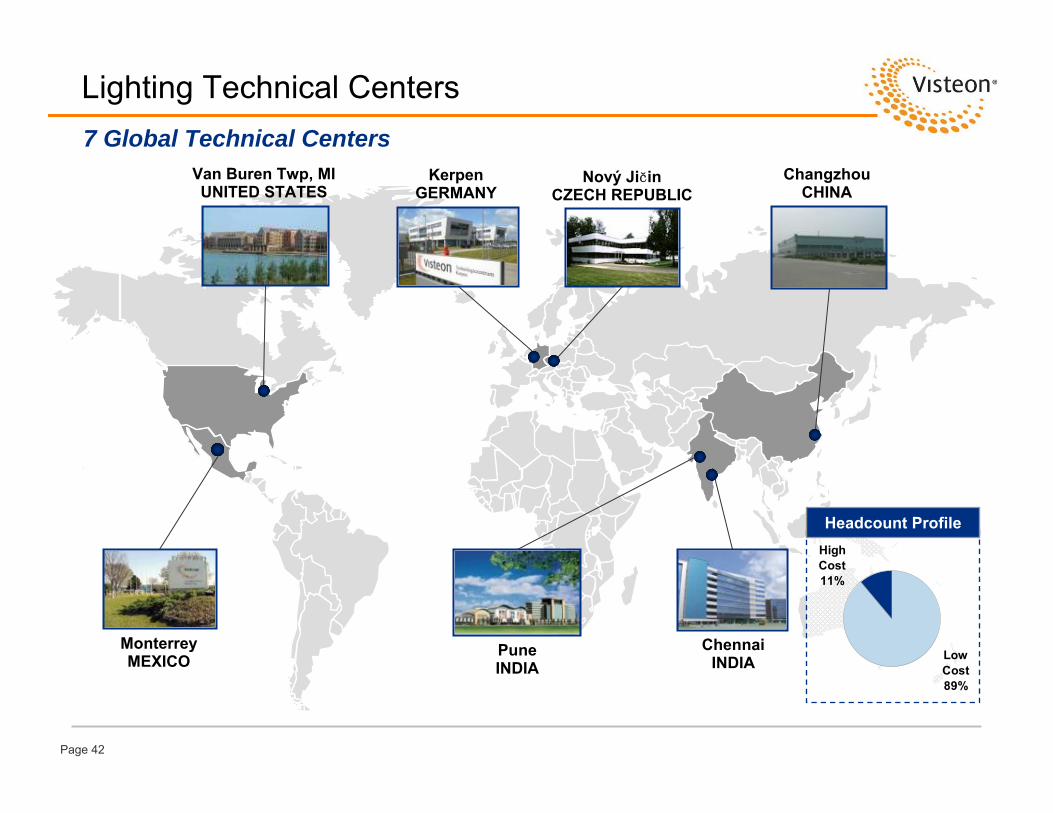
Lighting Technical Centers7 Global Technical Centers
Van Buren Twp, MIUNITED STATES
ChennaiINDIA
ChangzhouCHINA
KerpenGERMANY
Nový JičinCZECH REPUBLIC
PuneINDIA
MonterreyMEXICO
Headcount Profile
Low Cost89%
High Cost11%

Page 43
Lighting Manufacturing Locations7 Manufacturing Sites Including 2 Non-consolidated
MonterreyMEXICO Pune
INDIA
ChangzhouCHINA
(2 sites)
Nový JičinCZECH REPUBLIC
(2 sites)Rychvald
CZECH REPUBLIC
ChongqingCHINA
Future Site in 2012
Headcount Profile
Low Cost100%
High Cost0%

Page 44
Lighting Product Line Offerings
Auxiliary Lamps
Rear Position Lamps
Front Lighting Systems
$47
$159
$222
2010 Sales(1) (2)
($ in Mil)
Various high-tech, highly stylized LED-based stop lamps (CHMSL), license lamps and side markers, as well as affordable incandescent variants.
Products include single and multi-functional combination tail lamps, illuminated via LED or incandescent technologies. The lamps often incorporate light pipes, thick mold innovations, multi-color lenses, as well as planar light guides
Products include high-tech LED, High-Intensity Discharge (HID) and halogen based head lamps ranging from static positioning to full adaptive forward lighting which can include high beam, camera-based and GPS-based systems. Other products include day-time running and fog lamps.
Description
Low cost, regional lighting
companies
Key Competitors
(1) Product line revenue includes $29 million in non-lighting related sales(2) Product line revenue total is $552M (including Visteon TYC / unconsolidated)
Page 45
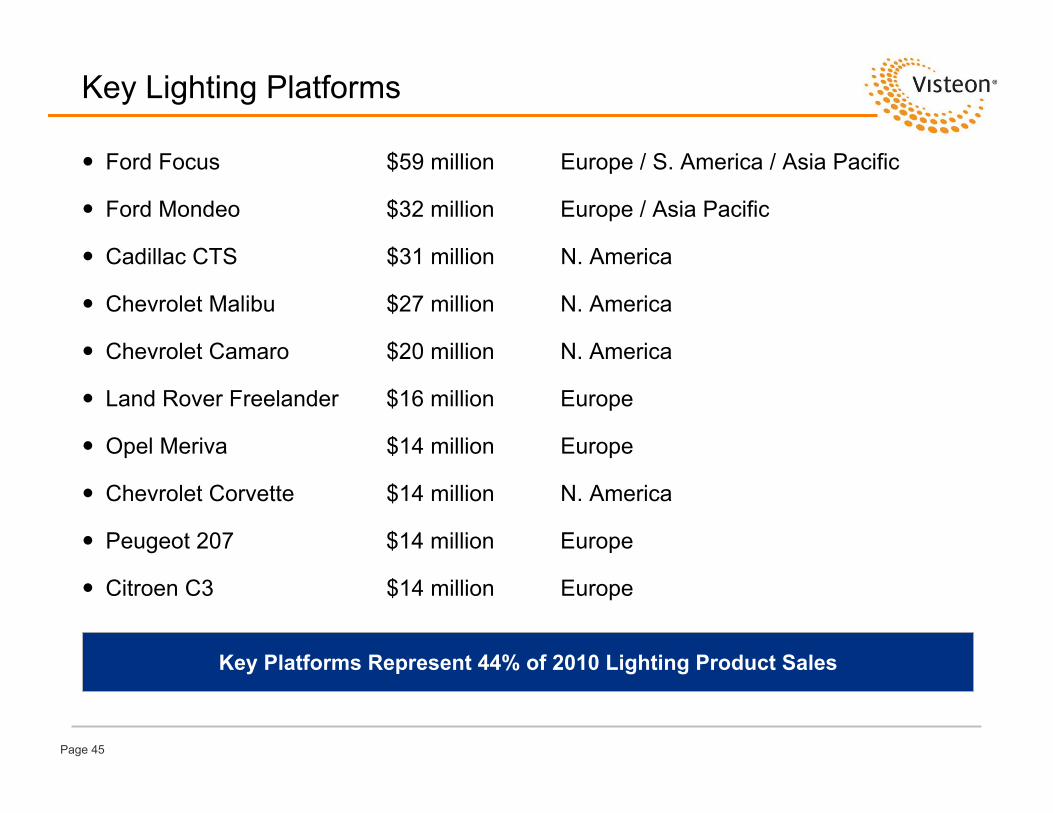
Key Lighting Platforms
Key Platforms Represent 44% of 2010 Lighting Product Sales
Ford Focus $59 million Europe / S. America / Asia Pacific
Ford Mondeo $32 million Europe / Asia Pacific
Cadillac CTS $31 million N. America
Chevrolet Malibu $27 million N. America
Chevrolet Camaro $20 million N. America
Land Rover Freelander $16 million Europe
Opel Meriva $14 million Europe
Chevrolet Corvette $14 million N. America
Peugeot 207 $14 million Europe
Citroen C3 $14 million Europe

Page 46
Lighting Value Proposition
Key Growth Opportunities• OEMs need support in major and emerging markets• Increased styling demands on lighting products from OEMs• Safety Legislation continues to challenge lighting output and control
Low CostGlobal Footprint Affordable Technology
Delivering the latest technologies, at affordable prices, serving medium to
large scale programs
100% Low cost manufacturing89% Low Cost Engineering
Advanced Technologies+ =

Page 47
2014 Target Market Share
Global Lighting Market
Source: Global Insight 2010.
Global Lighting Market2010 Market Share 2014 Target Market Share
Koito 16%
Visteon6%
Valeo15%
Magneti Marelli 14%Hella
11%
Stanley 10%
Samlip 4%
Other14%
Ichiko 4%Magna 3%
ACH 3%
Market $9.5 Billion
Visteon Lighting CAGR of 12.4% vs. Lighting Market CAGR of 6.0%
Visteon7%
All Others93%
Elements of Growth: Growing 3X faster than Market CAGR in Europe and ChinaIncreased content per vehicle
– HID/LED proliferation– higher content on mass market vehicles– increased use of electronics
Significant global wins vs. regional wins (previously)
Market $12 Billion

Page 48
Near-Term Technology Pipeline
2013LED Headlamp
2014
2010
2012
2011
Production Ready
Innovative Light Guide Rear Lamp
LED Daytime Running Lamp Signature
Adaptive Front Lighting System (AFS)
Glare Free High Beam
Macro Trend Addressed
Fuel Efficiency
Safety
Safety
Safety
Safety
Styling & Functionality
Styling & Functionality
Styling & Functionality
Styling & Functionality
Styling & Functionality
Page 49Page 49
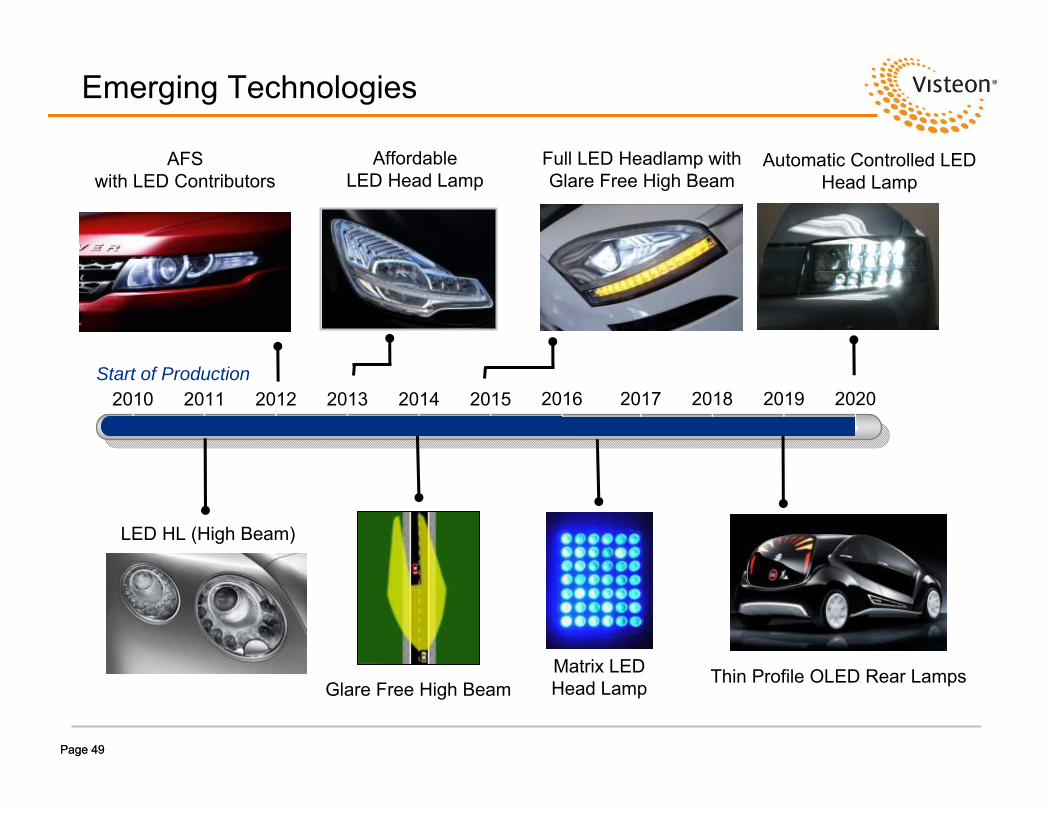
2010 2011 2012 2013 2014 2015 2016 2017 2018 2019 2020Start of Production
Glare Free High Beam
LED HL (High Beam)
AFSwith LED Contributors
Thin Profile OLED Rear Lamps
Emerging Technologies
Full LED Headlamp with Glare Free High Beam
AffordableLED Head Lamp
Matrix LEDHead Lamp
Automatic Controlled LED Head Lamp
Page 50
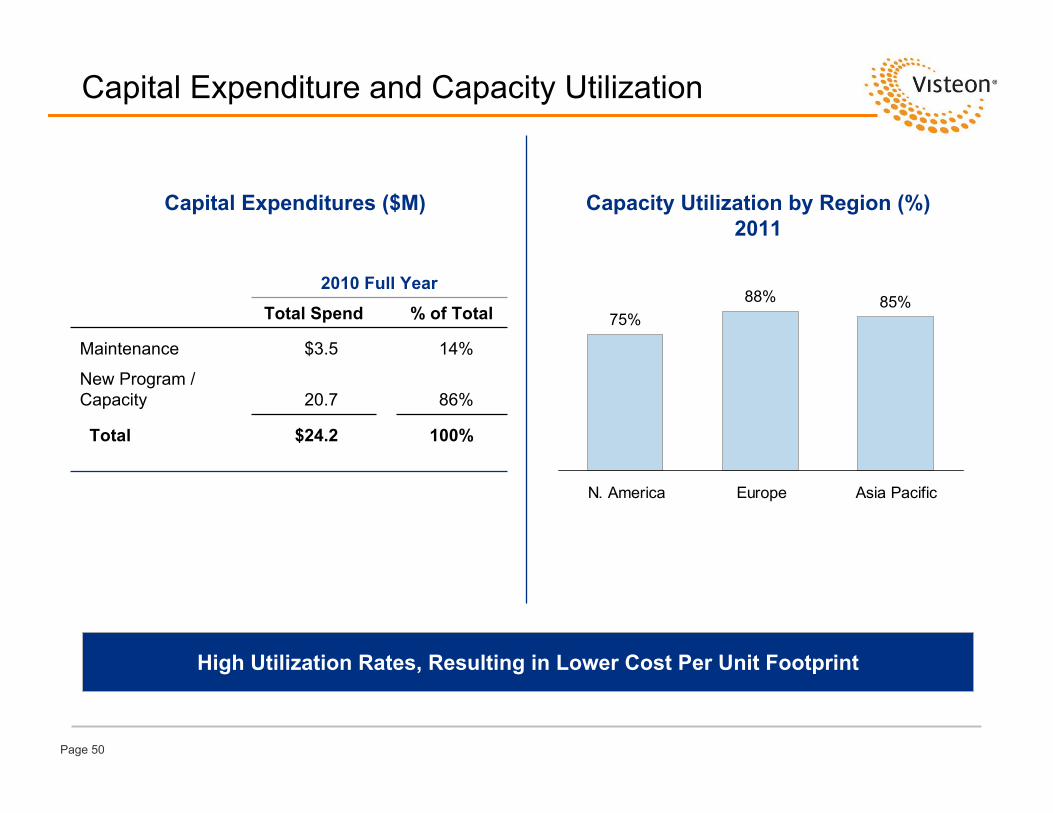
Capital Expenditure and Capacity Utilization
75%88% 85%
N. America Europe Asia Pacific
High Utilization Rates, Resulting in Lower Cost Per Unit Footprint
Capacity Utilization by Region (%)2011
Capital Expenditures ($M)
2010 Full Year
100%$24.2Total
% of TotalTotal Spend
86%20.7New Program /Capacity
14%$3.5Maintenance
Page 51
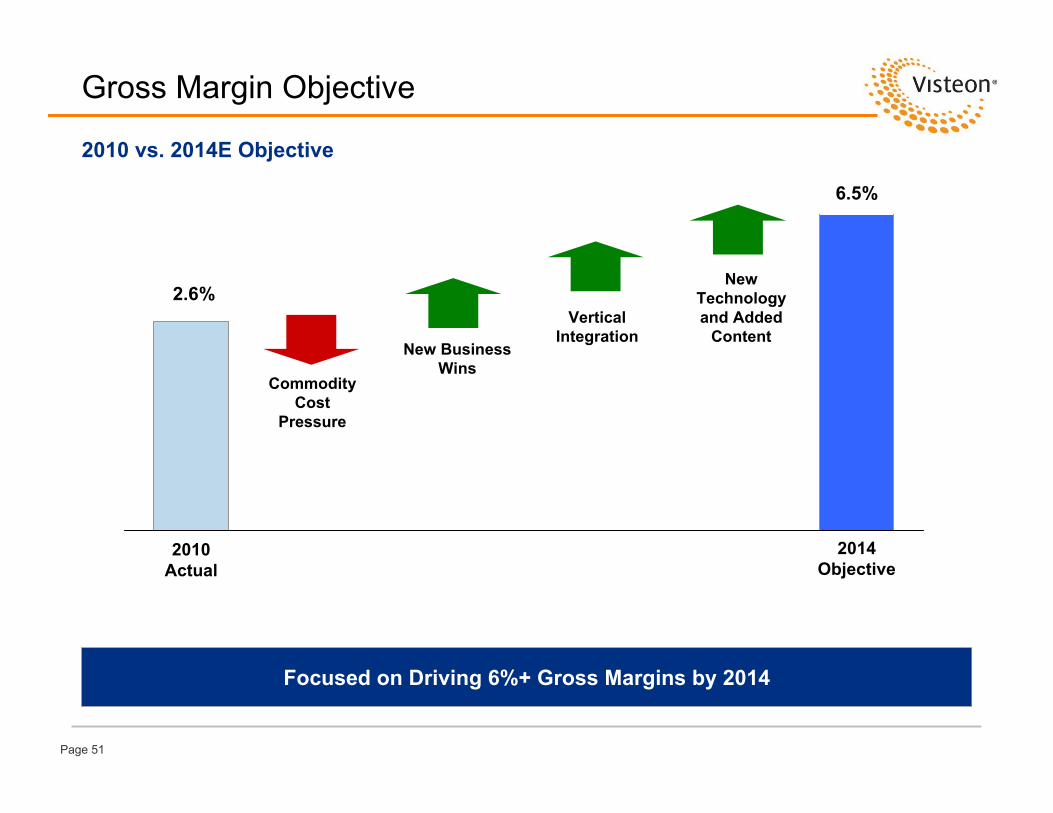
Gross Margin Objective
2010 vs. 2014E Objective
Focused on Driving 6%+ Gross Margins by 2014
2010 Actual
2014 Objective
New BusinessWins
2.6%
6.5%
Vertical Integration
New Technology and Added
Content
Commodity Cost
Pressure

Page 52
Lighting Summary
Key Strengths
Major product technology trends, strong revenue growth
Attractive global footprint
Full Product Line portfolio
Low cost product development
100% of all manufacturing in low-cost regions
Page 53
Today’s Agenda
Bill QuigleyClose
Tim Yerdon, Global Director, Innovation and DesignTechnology Exhibit
Michael Lewis, Vice President and TreasurerPanel Q&A
Bob Pyle, General Manager, Yanfeng VisteonYanfeng Visteon
Lunch
Pierre Boulet, General Manager, Interiors Europe and South America
Interiors Operations
Steve Meszaros, Product Group PresidentElectronics Operations
Jeff Stevenson, General Manager, Global LightingLighting Operations
Joy Greenway, Product Group PresidentClimate Operations
Don Stebbins, Chairman, CEO and PresidentVisteon Overview
Bill Quigley, Executive Vice President and CFOWelcome/Introductions

Page 55
Investor DayElectronics Operations
Steve Meszaros
Product Group President
Page 55

Page 56Page 56
Electronics Product GroupHighlights / Advantages
Complete coverage of mature and emerging markets with efficient, scaled operations
Integrated global capability leveraging low cost development centers
Cost-effective platform-driven approach to audio and cluster portfolio
Total Electronics Product Sales of $1.9 Billion#5 Global Market Position in a $20B Cockpit Electronics Market
2010 Product Sales ($1.9 Billion)Summary Financials ($M)By Customer By Region
EU43%
AP35%
NA18%
SA4%
$2,843
$2,140
$1,377 $1,433
$216
$217
$277 $43910.3%
8.8%
7.3%8.0%
$0
$500
$1,000
$1,500
$2,000
$2,500
$3,000
$3,500
2007 2008 2009 2010Consol Sales Non Consol Sales % Consol. Gross Margin (ex. OPEB / Reorg / FSA)
Products and Market Positions
#5 Global Market Position
Audio & Infotainment
#5(b)
Instrument Clusters & Displays
#3(a)
Vehicle Electronics
(N/A)
(a) Instrument Clusters (b) OEM Audio Head Units (c) Electronic Climate Controls
Controls#6(c)
Other25%
Renault Nissan
8%
COEM7%
JOEM7%
VW3%
Ford48%
GM2%

Page 57Page 57
Key Market Trends
Attractive Industry Dynamics with Significant Growth Potential
Global Electronics Market
* Includes unconsolidated operations
Stronger links to consumer electronics– Consumer electronics driving new
features, alternate media and commoditization
– Consumers demanding better user interfaces and connectivity as standard
Shifting OEM design & sourcing patterns– OEMs increasingly driving brand
differentiation through complex Human Machine Interface (HMI)
– Platform globalization accelerating– Features progressively more
software-defined – Increasing dissociation between hardware,
software and services
Market Share – Cockpit Electronics Market
Continental17%
Denso10%
Harman8%
Visteon*6%
Alpine7%
Panasonic5%
Delphi5%
Bosch 4%
Pioneer 4%
Other34%
Source: Strategy Analytics; IHS
Market $20 Billion

Page 58Page 58
Primary Product Offerings
#5 Overall Player in the Global Cockpit Electronics Automotive Industry
Description2010 Total
Sales ($ in Mil)
VC Market Position Key Competitors
Audio and Infotainment
Solutions for in-car audio, entertainment and information including navigation
$580 #5
Instrument Clusters and Displays
Electronic instruments and displays providing vehicle, comfort and infotainment information to the driver
$500 #3
ControlsManual and automatic control units to regulate vehicle cabin temperature
$185 #6
Vehicle Electronics
Legacy portfolio including engine controls, fuel delivery and body electronics
$420 N/A
(a) OEM Audio Head Units (b) Instrument Clusters (c) Electronic Climate Controls
(a)
(b)
(c)
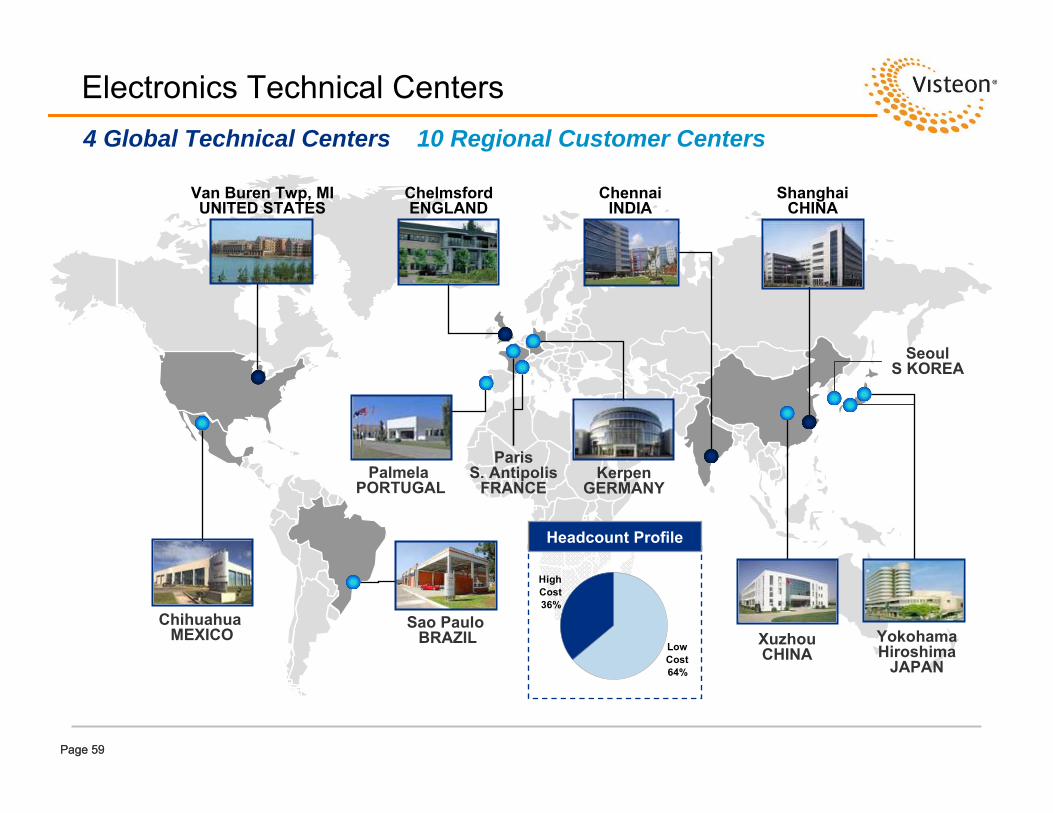
Page 59Page 59
Electronics Technical Centers4 Global Technical Centers 10 Regional Customer Centers
ChihuahuaMEXICO
Sao Paulo BRAZIL
PalmelaPORTUGAL
YokohamaHiroshima
JAPAN
KerpenGERMANY
SeoulS KOREA
ParisS. Antipolis
FRANCE
XuzhouCHINA
Van Buren Twp, MIUNITED STATES
ChelmsfordENGLAND
ChennaiINDIA
ShanghaiCHINA
Headcount Profile
Low Cost64%
High Cost36%

Page 60Page 60
Electronics Manufacturing Locations
Chihuahua (2)MEXICO
ManausBRAZIL
ChennaiINDIA
HiroshimaJAPANRayong
THAILAND
SeoulS. KOREA
VladimirRUSSIA
CadizSPAIN
ShaoxingCHINA
XuzhouCHINA
PalmelaPORTUGAL
Chongqing (2)CHINA
SzékesfehérvárHUNGARY
ShanghaiCHINA
ChangchunCHINA
18 Manufacturing Sites (including 7 unconsolidated)
JakartaINDONESIA
Headcount Profile
High Cost15%
Low Cost85%

Page 61
Electronics Emerging Market Strength
Finalized joint venture with PT Astra Otoparts in April, 2011 to supply instrument clusters to growing 2 and 4-wheeler markets. Production launch scheduled for early 2012.
INDONESIA
YFVE JV has a strong technical center and five production facilities supporting a leading market position (#1 in audio and #3 in clusters).
CHINA
Dedicated electronics plant launched in Chennai in 2009 to service high growth market with second phase plant expansion already underway. Local product development capability and global S/W operations.
INDIA
Launched Visteon Avtopribor JV in Vladimir in 2010 to meet anticipated market growth opportunity across all cockpit electronics products for global and domestic OEMs.
RUSSIA
Long-term market presence. Expanding Manaus plant manufacturing capability, product portfolio and customer base, including entry in 2-wheeler market.
BRAZIL
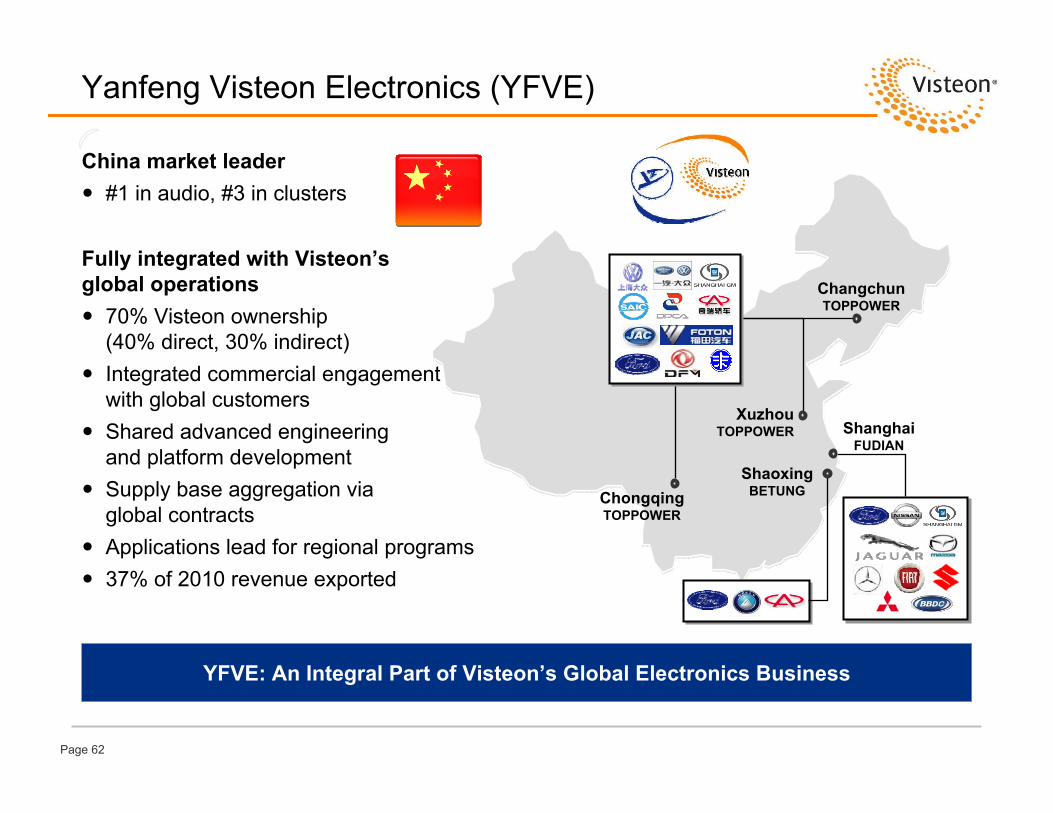
Page 62
YFVE: An Integral Part of Visteon’s Global Electronics Business
China market leader#1 in audio, #3 in clusters
Fully integrated with Visteon’s global operations
70% Visteon ownership (40% direct, 30% indirect)Integrated commercial engagement with global customersShared advanced engineering and platform development Supply base aggregation via global contractsApplications lead for regional programs37% of 2010 revenue exported
Yanfeng Visteon Electronics (YFVE)
ChongqingTOPPOWER
ChangchunTOPPOWER
Xuzhou TOPPOWER
ShaoxingBETUNG
Shanghai FUDIAN

Page 63Page 63
Key Platforms
Ford Focus, C-Max $274 million Europe, Asia Pacific, N. America
Ford Fiesta $118 million Europe, Asia Pacific, N. America, S. America
Ford Mondeo, S-Max $ 88 million Europe
Nissan Cross Car Connectivity $ 79 million N. America, Asia Pacific
Ford Transit $ 52 million Europe
Ford F-Series $ 51 million N. America
Nissan Pathfinder/Frontier $ 45 million N. America, Europe, Asia Pacific
SVW Lavida $ 27 million Asia Pacific
Ford Escape $ 26 million N. America
Mazda Axela $ 26 million Asia Pacific
Top Ten Platforms Represent 42% of Total Electronics 2010 Product Sales

Page 64
Capital Expenditure and Capacity Utilization
Capacity Utilization by Region (%)2011
Capital Expenditures ($M)Consolidated
2010 Full Year
Total Spend % of Total
New Program $9 38%
Cost Saving/Other $7 32%
Modernization $7 30%
Total $23 100%
76%62%
99%
74%
N.America Europe Asia Pacific S.America
2010 Engineering Cost ($M)
Total Spend % of 2010 Revenue
Consolidated $132 9.2%
Non-Consolidated $22 4.4%
Aggressive capacity expansion currently underway in China and India
Capacity in place to support business growth in North & South America
Major restructuring action in progress to right-size European capacity

Page 65
Electronics Portfolio Evolution
“All Products to All Customers”-- Not Feasible Long-Term --
All Electronic Products to One Customer
Customer Diversification
Product and Market Alignment
Focused on Audio/Infotainment & Driver Information Product Segments
Page 66
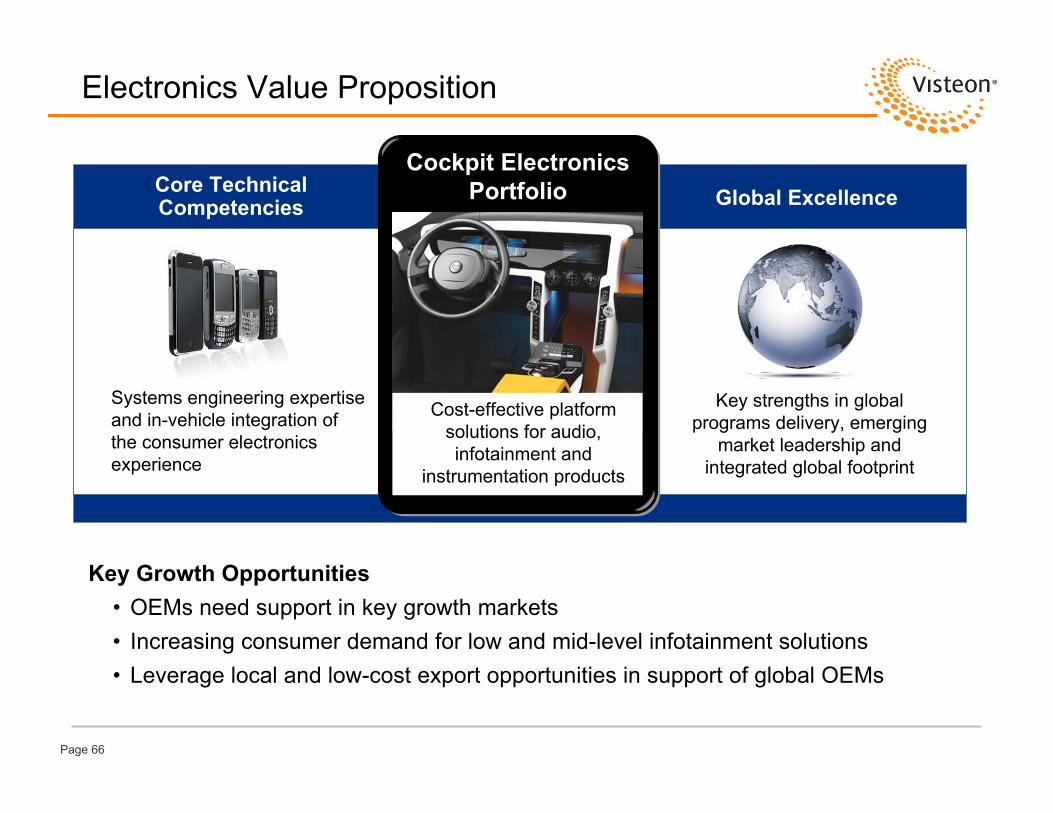
Electronics Value Proposition
Key Growth Opportunities• OEMs need support in key growth markets• Increasing consumer demand for low and mid-level infotainment solutions• Leverage local and low-cost export opportunities in support of global OEMs
Core Technical Competencies Global Excellence
Key strengths in global programs delivery, emerging
market leadership and integrated global footprint
Systems engineering expertise and in-vehicle integration of the consumer electronics experience
Cockpit Electronics Portfolio
Cockpit Electronics Portfolio
Cost-effective platform solutions for audio, infotainment and
instrumentation products

Page 67Page 67
2014 Target Market Share
Global Cockpit Electronics Market
(1) Source: Visteon Marketing analysis
Global Cockpit Electronics Market
2010 Market Share (1) 2014 Target Market Share
* Shares include unconsolidated operations
Visteon’s Cockpit Electronics CAGR Exceeds Market CAGR of 12.5%
Continental17%
Denso10%
Harman8%
Visteon*6%
Alpine7%
Panasonic 5%Delphi 5%
Bosch 4%Pioneer 4%
Other34%
Visteon*7%
All Others86%
Market $20 Billion Market $32 Billion Strong growth in fast growing Asia Pacific markets
Page 68Page 68
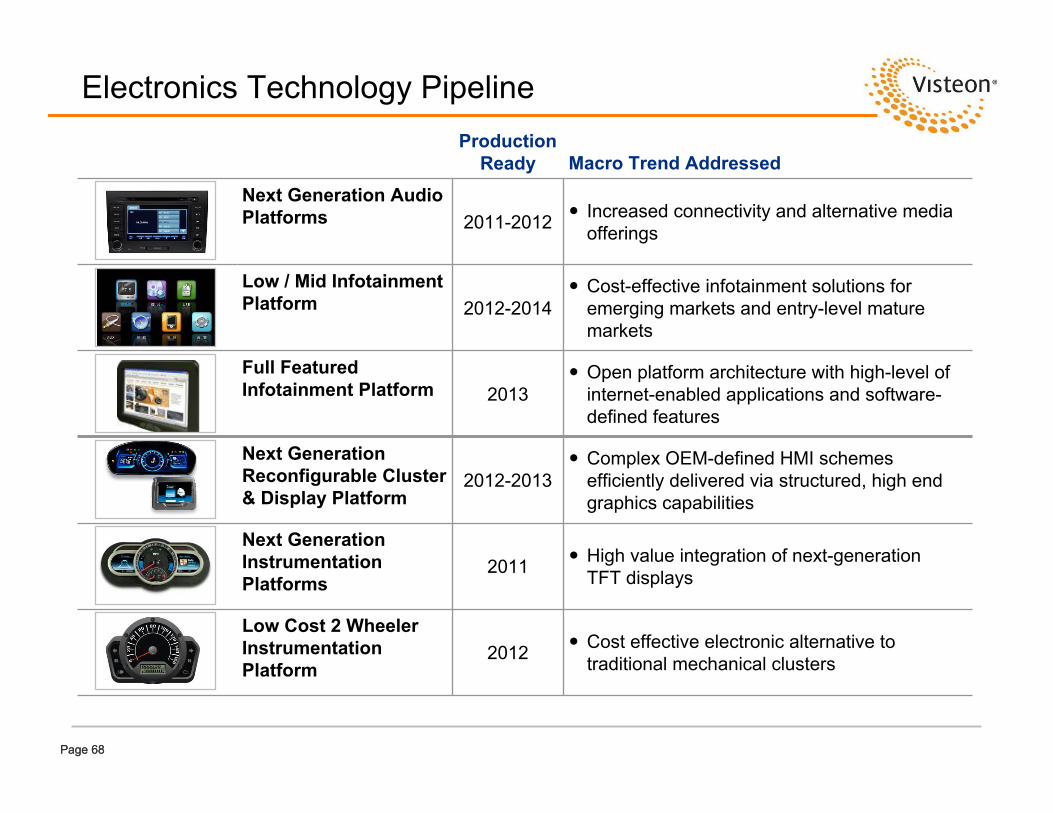
Electronics Technology Pipeline
Cost effective electronic alternative to traditional mechanical clusters2012
Low Cost 2 Wheeler Instrumentation Platform
High value integration of next-generation TFT displays2011
Next Generation Instrumentation Platforms
Complex OEM-defined HMI schemes efficiently delivered via structured, high end graphics capabilities
2012-2013Next Generation Reconfigurable Cluster & Display Platform
Production Ready Macro Trend Addressed
Next Generation Audio Platforms 2011-2012 Increased connectivity and alternative media
offerings
Low / Mid Infotainment Platform 2012-2014
Cost-effective infotainment solutions for emerging markets and entry-level mature markets
Full Featured Infotainment Platform 2013
Open platform architecture with high-level of internet-enabled applications and software-defined features

Page 69Page 69
Gross Margin Objective
2010 vs. 2014E Objective
Focused on Exceeding 10% Gross Margin by 2014
2010 Actual
2014 Objective
CockpitElectronics
Growth
8%
10%+
Net CostPerformance
Restructuring
Vehicle Electronics
Exit

Page 70
Electronics Summary
Key Strengths
Complete coverage of mature and emerging markets with efficient, scaled operations
Integrated global development capability leveraging low-cost development centers
Cost-effective platform-driven approach to product portfolio

Page 71
Today’s Agenda
Bill QuigleyClose
Tim Yerdon, Global Director, Innovation and DesignTechnology Exhibit
Michael Lewis, Vice President and TreasurerPanel Q&A
Bob Pyle, General Manager, Yanfeng VisteonYanfeng Visteon
Lunch
Pierre Boulet, General Manager, Interiors Europe and South America
Interiors Operations
Steve Meszaros, Product Group PresidentElectronics Operations
Jeff Stevenson, General Manager, Global LightingLighting Operations
Joy Greenway, Product Group PresidentClimate Operations
Don Stebbins, Chairman, CEO and PresidentVisteon Overview
Bill Quigley, Executive Vice President and CFOWelcome/Introductions

Page 73
Investor DayInteriors Operations
Pierre Boulet
General Manager, Interiors Europe and South America
Page 73

Page 74
Interiors Product Group
VW26%
COEMs9%
Ford9%
Other10%
PSA10%
Renault Nissan12%
Hyundai12%
GM12%
AP71%
EU22%
SA5%
NA2%
Products and Market PositionsHighlights / Advantages
• #2 global market position in a ~$43 billion industry segment
• Balanced global customer mix with strengths in key markets (#1 in Asia, #2 in Europe, #3 in South America)
• A leading player in BRIC markets well positioned to support industry growth
Total Interiors Product Sales of $4.8 Billion #2 Global Market Position
Instrument Panels (#2)
Door Panels (#3)
#2 Overall Global Market Position (CSM)
2010 Product Sales ($4.8 Billion)Summary Financials ($M)By Customer By Region
$3,251 $3,045
$2,113 $2,159
$1,042 $1,110
$1,427
$2,629
2.5% 0.8%
4.2%
6.0%
$0$500
$1,000$1,500$2,000$2,500$3,000$3,500$4,000$4,500
2007 2008 2009 2010Consol Sales Non Consol Sales % Consol Gross Margin (ex. OPEB / Reorg / FSA)
* Includes non-consolidated
Cockpit Assembly (#3)
Page 75
Faurecia
SAS
Visteon
YFV/DFV
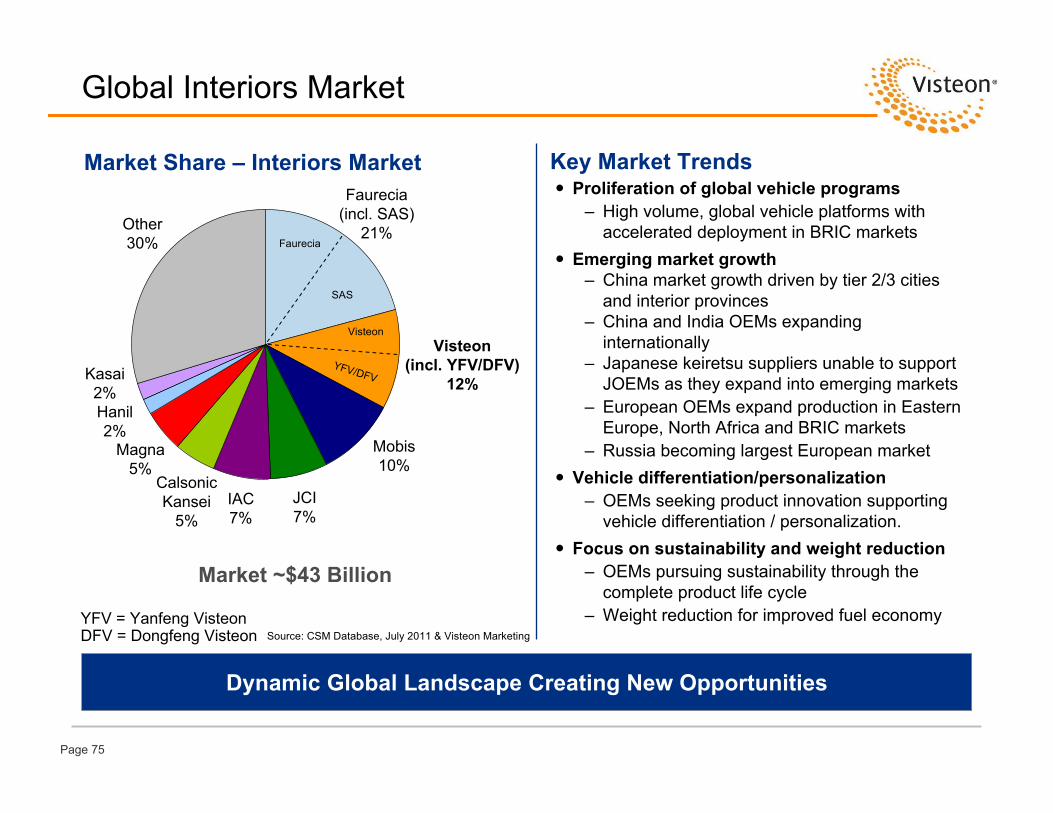
Market Share – Interiors Market Key Market Trends
Dynamic Global Landscape Creating New Opportunities
Global Interiors Market
Proliferation of global vehicle programs– High volume, global vehicle platforms with
accelerated deployment in BRIC markets Emerging market growth
– China market growth driven by tier 2/3 cities and interior provinces
– China and India OEMs expanding internationally
– Japanese keiretsu suppliers unable to support JOEMs as they expand into emerging markets
– European OEMs expand production in Eastern Europe, North Africa and BRIC markets
– Russia becoming largest European marketVehicle differentiation/personalization
– OEMs seeking product innovation supporting vehicle differentiation / personalization.
Focus on sustainability and weight reduction– OEMs pursuing sustainability through the
complete product life cycle– Weight reduction for improved fuel economy
Source: CSM Database, July 2011 & Visteon Marketing
Faurecia(incl. SAS)
21%
Visteon(incl. YFV/DFV)
12%
Mobis10%
JCI7%
IAC7%
Calsonic Kansei
5%
Magna 5%
Hanil2%
Kasai2%
Other30%
YFV = Yanfeng VisteonDFV = Dongfeng Visteon
Market ~$43 Billion

Page 76
Product Offerings
#2 Player in the Global Interiors Automotive Industry
$2.0B
$0.9B
$1.8B
2010 Sales ($ in Mil)
#3
#3
#2
VC Market Position
Full design of cockpit architecturesIntegration of electronics and HVAC systemFull assembly and JIT, in-sequence delivery
Hard and soft door panels and trims Decorative insertsAmbient lighting
Hard and soft instrument panels Plastic mechanismsSliding and fixed consoles
DescriptionInstrument Panels and Consoles
Door Panels and Interior Trim
Cockpit Assembly
Key Competitors
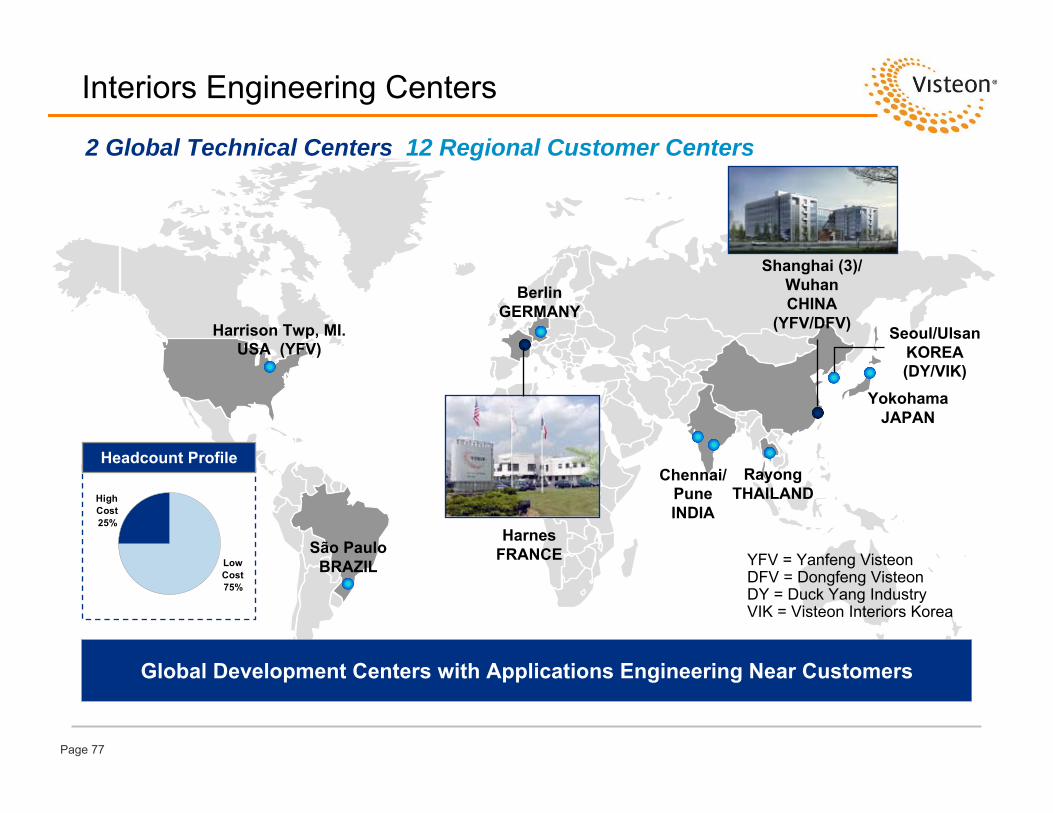
Page 77
Harrison Twp, MI. USA (YFV)
RayongTHAILAND
YokohamaJAPAN
HarnesFRANCE
BerlinGERMANY
Shanghai (3)/WuhanCHINA
(YFV/DFV) Seoul/Ulsan KOREA (DY/VIK)
Chennai/ PuneINDIA
São PauloBRAZIL
2 Global Technical Centers 12 Regional Customer Centers
Interiors Engineering Centers
Global Development Centers with Applications Engineering Near Customers
YFV = Yanfeng VisteonDFV = Dongfeng VisteonDY = Duck Yang IndustryVIK = Visteon Interiors Korea
Headcount Profile
Low Cost75%
High Cost25%

Page 78
42 Manufacturing Sites 13 JIT Assembly Sites
Interiors Manufacturing Locations
Leading Manufacturing Presence in Europe and Asia
MEXICO
US (2)(YFV)
BRAZIL (2)
ARGENTINA
INDIA (2)
UK (2)(R-Tek)
FRANCE (4) SLOVAKIA
GERMANY
SPAIN (4)
POLANDRUSSIA
BELGIUM
MOROCCO(under construction)
CROATIA(partner)
S. KOREA (5)
CHINA (21)(YFV/DFV)
THAILAND (2)
PHILIPPINES
TURKEY(partner)
Headcount Profile
Low Cost75%
High Cost25%

Page 79
Interiors Emerging Market Strength
Contract manufacturing partner identified for sourced Nissan programs. Additional growth opportunities with GM and Chinese OEMs
INDONESIA
YFV is a market leader with 23% I/P and 20% door trim share. 21 manufacturing operations with additional 10 new plants or expansions planned. Full service capability including design studio and tool shop
CHINA
Current #2 supplier of instrument panels with operations in both Chennai and Pune – market share continues to grow based on additional program wins with VW, Nissan, Renault and GM
INDIA
Launched first operation (wholly-owned) in Kaluga to support VW and Renault. Additional growth opportunities with PSA, GM and Nissan
RUSSIA
#3 market player with improving operational performance and expanding customer base including Ford, VW, GM, PSA, Honda
BRAZIL

Page 80
Working Together to Support Global Customer Growth
China market leader#1 in instrument panels, door panels and consoles
A key element of Visteon’s ability to serve global customers
50/50 Visteon/HASCO (SAIC) ownershipShared advanced engineering and platform development for global customers Aligned engagement with OEM customers in support of global program requirementsOpportunities to further exploit combined scale for mutual benefit
Yanfeng Visteon Interiors (YFV)

Page 81
Key Interiors Platforms (2010)
Including Cockpit Revenues*VW Lavida $304 M Asia Pacific
Hyundai Avante $232 M Asia Pacific
VW Polo $204 M Asia Pacific, Europe
Nissan Frontier/Navarra $184 M Europe, Asia Pacific
Skoda Octavia $172 M Asia Pacific
Ford Focus/C-Max/Kuga $168 M Europe, Asia Pacific, S. America
VW Tiguan $158 M Asia Pacific
VW B5 Passat $142 M Asia Pacific
Buick Excelle $123 M Asia Pacific
Peugeot 3008 $98 M Europe
Top 10 Vehicle Platforms Represent 37% of Total Interiors 2010 Product Sales
Not Including Cockpit Revenues*Ford Focus/C-Max/Kuga $153 M Europe,
Asia Pacific
Peugeot 3008 $98 M Europe
Buick Lacrosse $76 M Asia Pacific
Nissan Frontier/Navarra $75 M Europe, Asia Pacific
VW Polo $66 M Europe, Asia Pacific
Renault Clio $57 M Europe
Buick Excelle $54 M Asia Pacific
Buick Regal $50 M Asia Pacific
Nissan Qashqai $50 M Europe
Citroen C5 $45 M Europe
Top 10 Vehicle Platforms Represent 25% of Total Interiors 2010 Product Sales
(not incl. cockpit-related revenue)* Based on 2010 product sales
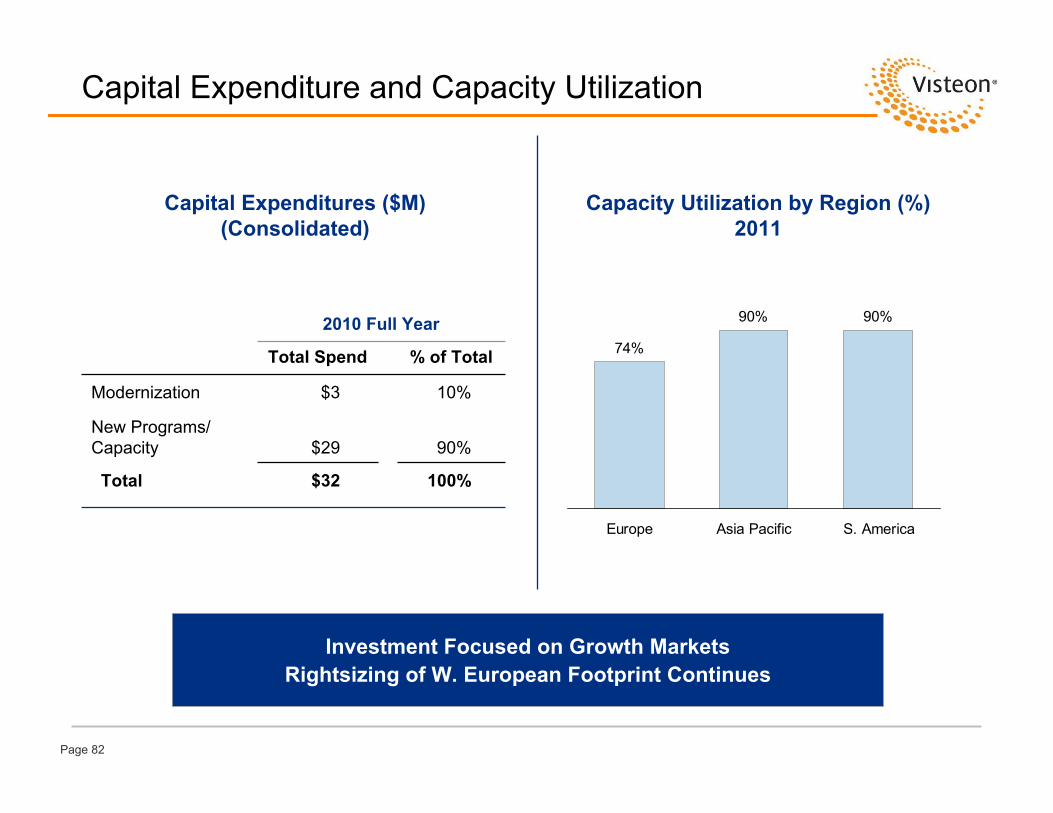
Page 82
Capital Expenditure and Capacity Utilization
Capacity Utilization by Region (%)2011
Capital Expenditures ($M)(Consolidated)
74%
90% 90%
Europe Asia Pacific S. America
2010 Full Year
100%$32Total
% of TotalTotal Spend
90%$29New Programs/Capacity
10%$3Modernization
Investment Focused on Growth MarketsRightsizing of W. European Footprint Continues

Page 83
Interiors Strategy
Leverage Visteon – Yanfeng Visteon synergies to support global OEM programs, innovation projects and purchasing savings
Improve manufacturing and engineering footprints via restructuring in HCC and continued investments in LCC to maintain leadership in BRIC markets
Increase consumer-driven innovation and vertical integration where appropriate formargin improvement and differentiation
Maintain focus on cost savings and cash management to increase shareholder value
Improve teamwork to reduce structure and optimize global performance
Instrument Panels and Consoles
Cockpit Assembly
Door Panels and Interior Trim

Page 84
Interiors Technologies
2010 2015
Styling Craftsmanship Differentiation
Personalization
“Green” Technologies Lower Weight
Recyclable
Cost Reduction Process Improvement
Alternative resinsHybrid TM Natural
Fibers & Injection VIEPP TM
Bondtek TM
VLRTM
Leatherfoam-in-place
Injected skinsThin wall injection
Airbag scoringCo-molded “A”surface
3D Decorative Stitching
BondtekInskin TM
Mood lighting
InSkin TM
Integrated Info SystemLaser
Marking
Innovation Roadmap Aligned with Customer NeedsVisteon R&D Spending at ~3% of Revenue

Page 85
Faur
ecia
SAS
Visteon
YFV/DFV
2014 Target Market Share
Visteon (incl.
YFV/DFV)13%
All Other87%
Source: CSM Database July 2011
2011 Market Share 2014 Target Market Share
Total Visteon Interiors CAGR Exceeds 5.5% Market CAGR Driven by Growth in Asia
Global Interiors Market Global Interiors Market
Market ~$43 Billion Market ~$52 Billion
Faurecia(incl. SAS)
21%
Visteon(incl.
YFV/DFV)12%
Mobis10%
JCI7%
IAC7%
Calsonic Kansei
5%
Magna 5%
Hanil2%
Kasai 2%
Other30%
YFV = Yanfeng VisteonDFV = Dongfeng Visteon
VisteonYFV/DFV

Page 86
Gross Margin Objective
2010 vs. 2014E Objective
Focused on Improving Interiors Gross Margin to Better Than 8% by 2014
2010 Actual
2014 Objective
NewPrograms
6%
8%+
Net CostPerformance
Restructuring
InputCosts

Page 87
Summary
Key Strengths
#2 market position in a ~$43 billion industry segment
Balanced global customer mix with strengths in key markets (#1 in Asia, #2 in Europe, #3 in South America)
A leading player in all BRIC markets well positioned to support industry growth
Page 88
Today’s Agenda
Bill QuigleyClose
Tim Yerdon, Global Director, Innovation and DesignTechnology Exhibit
Michael Lewis, Vice President and TreasurerPanel Q&A
Bob Pyle, General Manager, Yanfeng VisteonYanfeng Visteon
Lunch
Pierre Boulet, General Manager, Interiors Europe and South America
Interiors Operations
Steve Meszaros, Product Group PresidentElectronics Operations
Jeff Stevenson, General Manager, Global LightingLighting Operations
Joy Greenway, Product Group PresidentClimate Operations
Don Stebbins, Chairman, CEO and PresidentVisteon Overview
Bill Quigley, Executive Vice President and CFOWelcome/Introductions

Visteon Corporation Investor Day
July 27, 2011
Page 90
Today’s Agenda
Bill QuigleyClose
Tim Yerdon, Global Director, Innovation and DesignTechnology Exhibit
Michael Lewis, Vice President and TreasurerPanel Q&A
Bob Pyle, General Manager, Yanfeng VisteonYanfeng Visteon
Lunch
Pierre Boulet, General Manager, Interiors Europe and South America
Interiors Operations
Steve Meszaros, Product Group PresidentElectronics Operations
Jeff Stevenson, General Manager, Global LightingLighting Operations
Joy Greenway, Product Group PresidentClimate Operations
Don Stebbins, Chairman, CEO and PresidentVisteon Overview
Bill Quigley, Executive Vice President and CFOWelcome/Introductions
Page 91
Investor DayYanfeng Visteon
Bob Pyle
General Manager YFV
Page 91

Page 92
State-owned Assets Supervision and Administration Commission of Shanghai
Municipal Government
100%
• Functional parts• Interior and exterior
trim• Electric and
electronics • Hot worked parts• Metal forming and
tooling• New energy
服务贸易Service &
Trade
其它投资other
上海汽车SAIC Motor(78.94%)
华域汽车HASCO
(60.1%)
东华公司DongHuaCo.(75%) • Sales
• Logistics• IT• Car Rental • Financing
• Passenger car and commercial vehicle
• Core components• Financing
SAIC Organization and Structure -- Present

Page 93
State-owned Assets Supervision and Administration Commission of Shanghai
Municipal Government
100%
服务贸易Service &
Trade
其它投资other
华域汽车HASCO
(60.1%)• Sales• Logistics• IT• Car Rental • Financing
SAIC Organization and Structure -- Proposed
上 海 汽 车SAIC Motor
• SAIC Motor “pulled up” for direct ownership replacing SAIC Group
• HASCO equity now owned by SAIC Motor
• No impact to YFV or relationship with Visteon
东华公司DongHuaCo.(75%)
• Functional parts• Interior and exterior
trim• Electric and
electronics • Hot worked parts• Metal forming and
tooling• New energy
Page 94
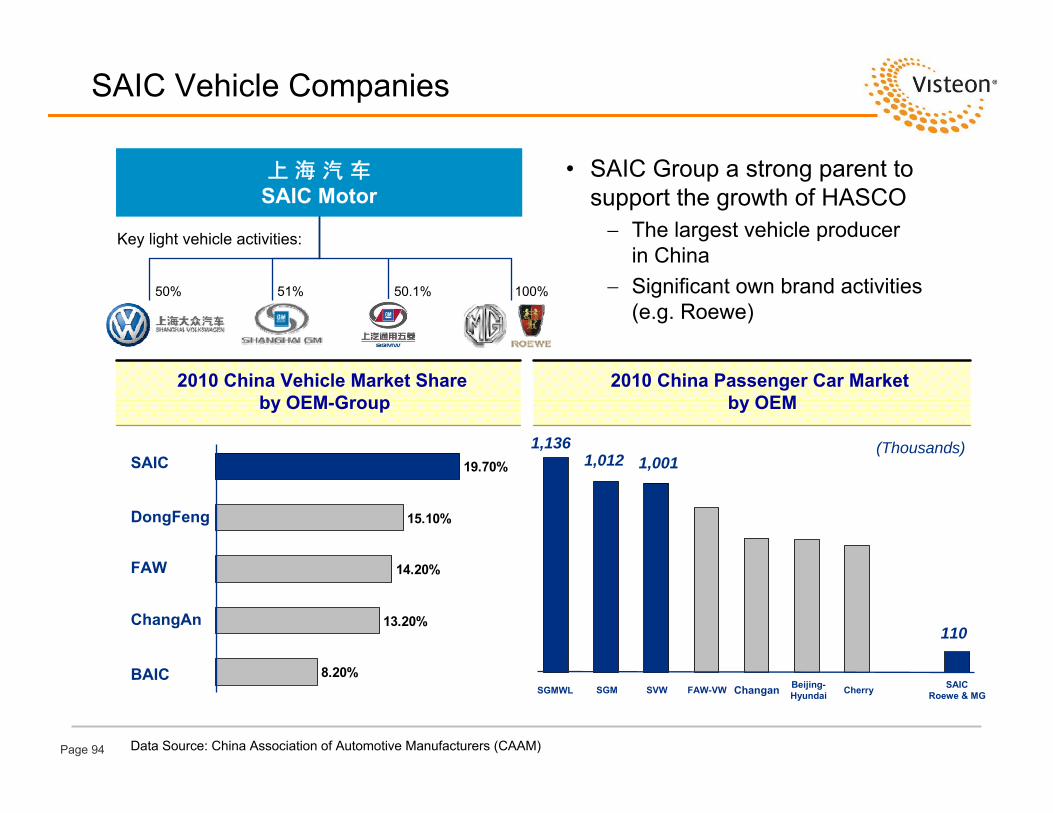
SAIC Vehicle Companies
上 海 汽 车SAIC Motor
50% 51% 100%
Key light vehicle activities:
50.1%
• SAIC Group a strong parent to support the growth of HASCO− The largest vehicle producer
in China− Significant own brand activities
(e.g. Roewe)
2010 China Vehicle Market Share by OEM-Group
8.20%
13.20%
14.20%
15.10%
19.70%SAIC
DongFeng
FAW
ChangAn
BAIC
2010 China Passenger Car Market by OEM
1,1361,012 1,001
Data Source: China Association of Automotive Manufacturers (CAAM)
SVWSGM FAW-VW Beijing-Hyundai CherrySGMWL Changan
110
SAICRoewe & MG
(Thousands)

Page 95
Yanfeng Visteon Organization
DongfengVisteon
YFV Beijing
2002
YFV Jinqiao
2006
75%
YFV Chongqing
99%
2001 2003
YFV Hefei
2007
80%80%
2007
50%
YFV Tooling
2006
60% 2002
1997
50%
50%
2004
75%40%
YFV Nanjing
YFV NJ FEM
YFV Runda
YFV is 50:50 Joint Venture between Visteon and HASCO (SAIC)
Technology Partnerships with Global Suppliers
Interior Partnerships with China OEMs
YFV Jiqiang
20102009 2010 2011
Interiors JVs
51%50% 51% 60%
DETC
50%
40%
50%
50%
YFPOExterior
YFV Electronics
YFJCI Seating
YF Key Safety

Page 96
Five Business Systems
• Cockpit
• Instrument Panels
• Door Panels
• Console
Interior System
• Driver Information
• Entertainment
• Controls
Electronics System
• Seats
• Trim Covers
• Mechanisms
• Foam Pads
Seating System
• Bumpers
• Body Trim
• Rear Closures
• Fenders
Exterior System
• Steering Wheels
• Air Bags
• Seat Belts
Safety System

Page 97
6 Major Groups Independent Enterprises
GZ ToyotaSGM DF Nissan BJ Hyundai
CA Suzuki
FAW-Car
SGMW DF HondaFAW-Toyota
FAW Tianjin
Haima DF YD KiaSAC
GZ HondaSVW DPCA CA FordFAW-VW BBAC
Dongfeng BAIC Chang’anFAWSAIC GAICGeely
VolvoJAC
CA Mazda
BAIC
Chang’an
CA PSA
GAC
GQ FIATBQ FOTON
Brilliance North BenzHawtai
BYDChery
Great Wall
Market and Sales Summary
2010 Revenueby Customer
SVW36%
SGM 26%
Export6%
Other6%
DF Nissan 4%
SAIC 5%
CAFM 4%
Chery 2%JAC 2%
Hyundai 1%Foton 1%
DYK 1%
FAW 1%
Total Revenue: $5.3 B

Page 98
2010 Revenue
Product Diversity
Seating38%
Interiors45%
Electronics8%
Exterior 5%Safety 3%
Tooling 1%
Total Revenue $5.3 Billion(Includes Tier 1 Unconsolidated Subsidiaries)

Page 99
China Market Share
#1
Seats
Instrument Panels
Door Panels
Audio
Consoles
Steering Wheels
#2Bumpers
#3
Clusters
Market-Leading Positions in Multiple Products

Page 100
Exteriors
Interiors
Seating
Electronics
Safety
Business SystemSymbol Facilities
Total
Tooling
27
10
35
6
1
1
80
Changchun
Xuzhou
ShaoxingWuhan
Shi‘yan
Guangzhou
Yancheng
Liuzhou
Shanghai
BeijingShenyang
Yantai
Yizheng
WuhuHefeiNanjing
Taizhou
Nantong
Fuzhou
Chongqing
Chengdu
Baotou
Baoding
Harrison TownshipWarren, MI USA
Extensive Footprint: 80 Facilities with ~ 24,000 Employees
YFV Global Presence

Page 101
Export Markets
Products
Customers
Interior System
Electronics System
Seating System
Safety System
0.4
0.8 0.8 0.91.2
0.9
1.71.4 1.4
3.2
2001 2002 2003 2004 2005 2006 2007 2008 2009 2010
Export SalesRMB in Billions USD $473 M
Supporting Global Customers through Superior Products and Value
Export Business

Page 102
Q-e Concept Phoenix Concept
Unique Capability to Perform Styling, Design, and Engineering of Interior/Exterior/Electronic Parts for our Customers
Design Studio

Page 103
• Full Service Supplier (from Styling to Production)
• System Integration
• World Class Testing Facilities
• Globally Integrated Technical Centers
• Safety Testing
• Acoustic and NVH Testing
• Full Design and Engineering Capability
• Advanced Application Software
• World Class Testing Facilities
• Structure Design
• CAE Verification• R&D / Product
Engineering
• Crash Simulation
• Lifecycle Testing
Interior System Seating System Electronics System Exterior System Safety System
500 Engineers
400 Engineers
300 Engineers
160 Engineers
150 Engineers
Technical Centers Provide Superior Capability and Value to Customer
Technical Center Capability
Page 104
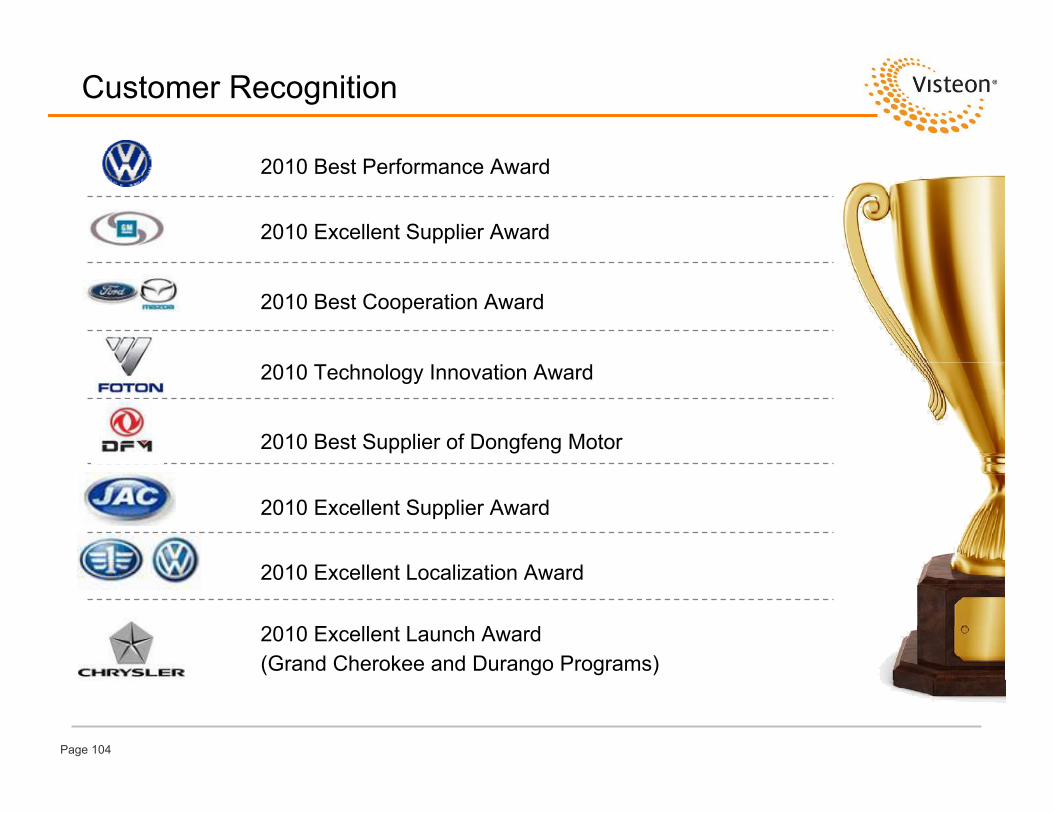
2010 Excellent Localization Award
2010 Best Performance Award
2010 Excellent Supplier Award
2010 Best Cooperation Award
2010 Technology Innovation Award
2010 Best Supplier of Dongfeng Motor
2010 Excellent Supplier Award
2010 Excellent Launch Award (Grand Cherokee and Durango Programs)
Customer Recognition

Page 105
1.6 2.2 2.64.1
7.0 7.0 7.8
10.7
13.7 13.9
19.4
31.8
1999 2000 2001 2002 2003 2004 2005 2006 2007 2008 2009 2010
RMB in Billions
30%Compound Annual
Growth Rate
USD $4.7 B
Historical Growth
Successful Partnerships and Products Fuel Strong Growth

Page 106
Strategic Initiatives
Expand customer base with local China OEMs. Continued diversification with select Chinese (and Japanese) OEMs
Support OEM’s growth plans in China and abroad via cooperation with Visteon and other partners
Explore new business segments / product offerings with a focus on “Green” technologies
Strengthen technical capability; enhance tooling and equipment as a competitive advantage
Continue focus on development of new employees and YFV culture via “Yanfeng University”
Transition to Global Supplier while Strengthening Base Market

Page 107
Global Radio – Electronics
Global GM - D2XX Program - Interiors
Global Sourcing Summary
GM Halol(CN100/N200)
VC Pune Plant
Indian JV
GM Talegaon(S2)
ProductsIPDPConsole
• Important and growing trend among OEMs• China OEMs increasingly looking to globalize;
will need key supplier partners• Trend provides both opportunities and
challenges for Visteon / YFV
GM India – Interiors
• Production planned for Russia, China, India, USA and Korea
• Design “home room”in Germany
• $80m Sales• YFV global Tier 1 • YFV to produce for
China/Russia• Visteon to produce
for ROW
Visteon/YFV new JV to capitalize on SAIC/GM relationship in India
Global Cooperation Key to Successful Relationships with OEMs
Global Cooperation Initiatives

Page 108
Q1 2010 Q1 2011 B/(W)
Net Sales $526 $720 $194
Gross Margin 88 109 21
Net Income 49 69 20
Equity Income
YFV Parent $25 $34 $9
YFV Affiliates 5 7 2
Visteon Share $30 $41 $11
Equity in Net Income of Non-Consolidated Affiliates
Visteon’s non-consolidated joint ventures’ performance significantly increased in Q1 2011 Q1 2011 equity income of $44 million $14 million Y/Y improvement - 47%
Yanfeng Visteon Automotive Trim Systems (“YFV”) and subsidiaries Q1 2011 performance totaled $41 million, an increase of $11 million compared to $30 million in Q1 2010
On a U.S. GAAP basis, YFV sales increased $194 million to $720 million, 37% increase– China industry volumes up 9% for the same period
$30
$44
Q1 2010 Q1 2011
Equity in Net Inc. of Non-Consolidated Affiliates(In USD millions)
All OtherTotal YFV
47% Growth
YFV – U.S. GAAP Financial Summary(In USD millions)
Page 109Page 109
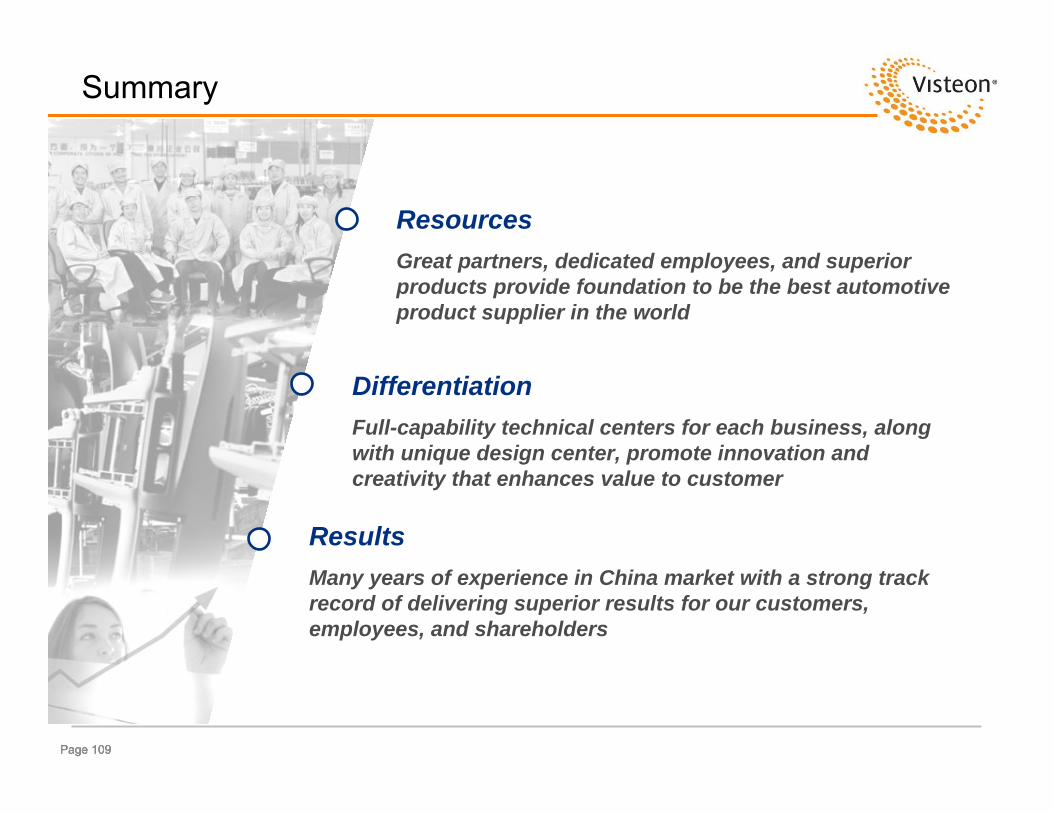
Summary
ResourcesGreat partners, dedicated employees, and superior products provide foundation to be the best automotive product supplier in the world
DifferentiationFull-capability technical centers for each business, along with unique design center, promote innovation and creativity that enhances value to customer
ResultsMany years of experience in China market with a strong track record of delivering superior results for our customers, employees, and shareholders

Page 110
Today’s Agenda
Bill QuigleyClose
Tim Yerdon, Global Director, Innovation and DesignTechnology Exhibit
Michael Lewis, Vice President and TreasurerPanel Q&A
Bob Pyle, General Manager, Yanfeng VisteonYanfeng Visteon
Lunch
Pierre Boulet, General Manager, Interiors Europe and South America
Interiors Operations
Steve Meszaros, Product Group PresidentElectronics Operations
Jeff Stevenson, General Manager, Global LightingLighting Operations
Joy Greenway, Product Group PresidentClimate Operations
Don Stebbins, Chairman, CEO and PresidentVisteon Overview
Bill Quigley, Executive Vice President and CFOWelcome/Introductions

Page 111
Investor DayPanel Q&A
Michael Lewis
Vice President and Treasurer
Director, Investor Relations
Page 111

Page 112
Bob Pallash
Global Customer Group President
Investor DayAdditional Q&A Panelists
Tim Yerdon
Global Director, Innovation and Design
Page 112

Q&A
Page 113

Page 114
Moving Forward
Invest in those product segments where we believe we can achieve market leadership and competitive differentiation to drive above market returns– For product segments and assets that do not meet these criteria, we
will seek to maximize value on a thoughtful and disciplined basis
Fortify our anchor customer positions and relationships and capitalize on customer diversification opportunities
Leverage our strong emerging market footprint and positions
Continue our aggressive approach to cost and investment to drive margin expansion and to generate meaningful free cash flow
Maintain financial flexibility to further our position and value in the market
Please see important disclosures regarding “Forward Looking Information”
Focused On Our Continued Strategy Of Optimizing Visteon’s Business Portfolio To Maximize Shareholder Value

Page 115
www.visteon.com

Page 116
Today’s Agenda
Bill QuigleyClose
Tim Yerdon, Global Director, Innovation and DesignTechnology Exhibit
Michael Lewis, Vice President and TreasurerPanel Q&A
Bob Pyle, General Manager, Yanfeng VisteonYanfeng Visteon
Lunch
Pierre Boulet, General Manager, Interiors Europe and South America
Interiors Operations
Steve Meszaros, Product Group PresidentElectronics Operations
Jeff Stevenson, General Manager, Global LightingLighting Operations
Joy Greenway, Product Group PresidentClimate Operations
Don Stebbins, Chairman, CEO and PresidentVisteon Overview
Bill Quigley, Executive Vice President and CFOWelcome/Introductions

Page 117
Investor DayTechnology Review
Tim Yerdon
Global Director, Innovation and Design
Page 117

Page 118
Innovation at Visteon
MissionPartner with our customers to co-createproducts and services that address unmet market needs
Promote our product group strengths and cross-product opportunities at an integrated vehicle level
Drive advanced technology functions that span the product groups and enhance our automotive intellect
VisionBe recognized by our customers as the innovative partner-of-choice for translating their vision into products and services

Page 119
Visteon Innovation and Design Locations

Page 120
Research, Development and Innovation
ClimateClimate AdvAdv
LightingLighting AdvAdv
InteriorsInteriors AdvAdv
ElectronicsElectronics AdvAdv
Corporate Innovation
Build up-stream relationships with OEMs Translate market and technology trends into innovative concept solutionsDevelop cross-product group technology demonstration assets (physical and virtual prototypes)Acquire, develop and execute government contracts Foster relationships with outside partners and collaborators to develop and apply new technologiesLeverage industrial design and vehicle level HMI to enhance the user experience
AutoHarvest.orgAutoHarvest.org

Page 121
Innovation Driven Concept Development
Futuring ProcessOpen InnovationCollaborationCo-Creation
Futuring ProcessOpen InnovationCollaborationCo-Creation
Validated products and technologies
Automotive Components, Modules and Systems
Future driven vision and concepts
ConceptDevelopment Process
ConceptDevelopment Process
Envision:
Innovate:
Develop:VisteonProduct Development Process
VisteonProduct Development Process
FUTURE WEB
Page 122
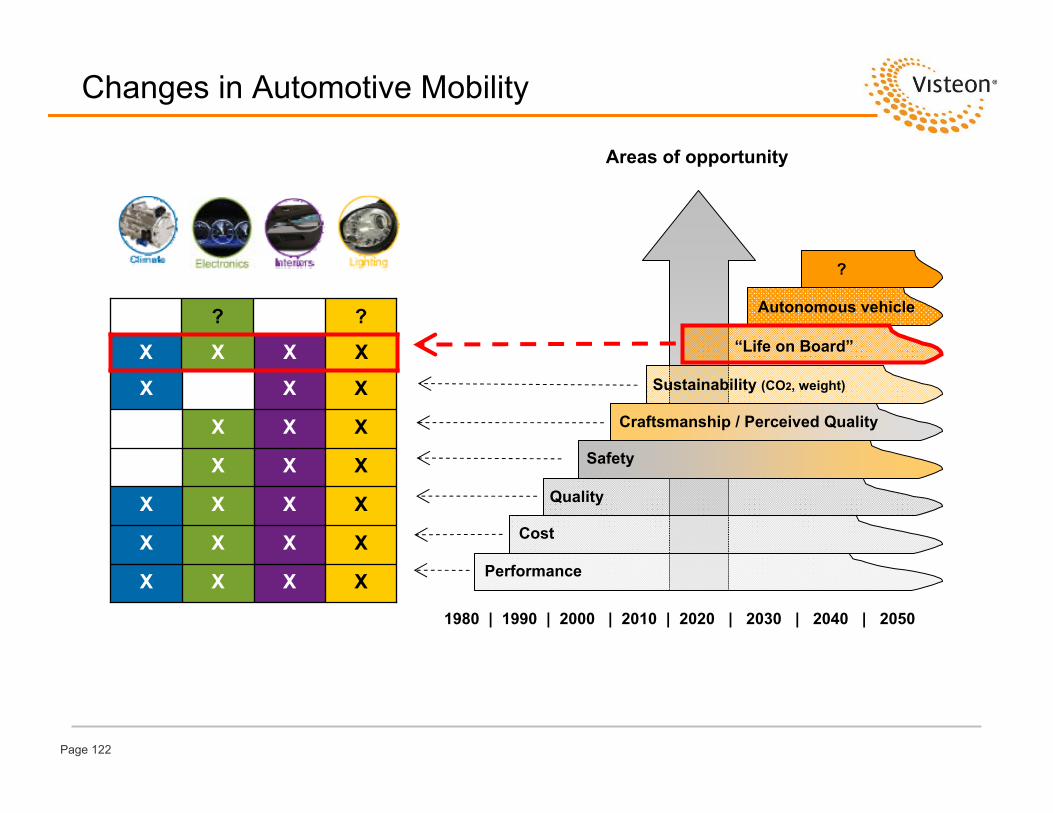
Message
XXXX
XXXX
XXXX
XXX
XXXX
XXX
??
?
1980 | 1990 | 2000 | 2010 | 2020 | 2030 | 2040 | 2050
Cost
Quality
Safety
Craftsmanship / Perceived Quality
Sustainability (CO2, weight)
Autonomous vehicle
Performance
Changes in Automotive Mobility
Areas of opportunity
XXXX “Life on Board”

Financial Disclosures
Page 125
This presentation contains "forward-looking statements" within the meaning of the Private Securities Litigation Reform Act of 1995. Forward-looking statements are not guarantees of future results and conditions but rather are subject to various factors, risks and uncertainties that could cause our actual results to differ materially from those expressed in these forward-looking statements, including, but not limited to,
Caution should be taken not to place undue reliance on our forward-looking statements, which represent our view only as of the date of this presentation, and which we assume no obligation to update. Other than those directly associated with Visteon Corporation, any design logos presented herein are trademarks of their respective names and/or companies with which they are associated.The owners are not affiliated, associated, or connected with Visteon Corporation, nor do the owners sponsor, endorse, authorize or approve of any products or services of Visteon Corporation, or have any responsibility for the information presented herein.
• our ability to satisfy future capital and liquidity requirements; including our ability to access the credit and capital markets at the times and in the amounts needed and on terms acceptable to us; our ability to comply with financial and other covenants in our credit agreements; and the continuation of acceptable supplier payment terms;
• our ability to satisfy pension and other post-employment benefit obligations; • our ability to access funds generated by foreign subsidiaries and joint ventures on a timely and cost effective basis; • conditions within the automotive industry, including (i) the automotive vehicle production volumes and schedules of our
customers, and in particular Ford's and Hyundai-Kia’s vehicle production volumes, (ii) the financial condition of our customers or suppliers and the effects of any restructuring or reorganization plans that may be undertaken by our customers or suppliers or work stoppages at our customers or suppliers, and (iii) possible disruptions in the supply of commodities to us or our customersdue to financial distress, work stoppages, natural disasters or civil unrest;
• new business wins and re-wins do not represent firm orders or firm commitments from customers, but are based on various assumptions, including the timing and duration of product launches, vehicle productions levels, customer price reductions and currency exchange rates;
• general economic conditions, including changes in interest rates and fuel prices; the timing and expenses related to internal restructurings, employee reductions, acquisitions or dispositions and the effect of pension and other post-employment benefit obligations;
• increases in raw material and energy costs and our ability to offset or recover these costs, increases in our warranty, product liability and recall costs or the outcome of legal or regulatory proceedings to which we are or may become a party; and
• those factors identified in our filings with the SEC (including our Annual Report on Form 10-K for the fiscal year ended Dec. 31, 2010).
Forward-Looking Information
Page 126
Throughout this presentation, the Company has provided information regarding certain non-GAAP financial measures. These measures include “free cash flow” and “Adjusted EBITDA.” Free cash flow represents cash flow from operating activities less capital expenditures. Adjusted EBITDA represents net income (loss) attributable to Visteon, plus net interest expense, provision for income taxes and depreciation and amortization, as further adjusted to eliminate the impact of asset impairments, gains or losses on divestitures, net restructuring expenses and other reimbursable costs, certain non-recurring employee charges and benefits, reorganization items, and other non-operating gains and losses.
Management believes that free cash flow is useful in analyzing the Company’s ability to service and repay its debt, and it uses the measure for planning and forecasting in future periods, as well as in management compensation decisions. Free cash flow is not a recognized term under accounting principles generally accepted in the United States (“GAAP”) and does not reflect cash used to service debt and does not reflect funds available for investment or other discretionary uses.
Management believes Adjusted EBITDA is useful to investors because it provides meaningful supplemental information regarding the Company’s operating results because the excluded items may vary significantly in timing or amounts and/or may obscure trends useful in evaluating and comparing the Company’s continuing operating activities. Management uses this measure for planning and forecasting in future periods. Adjusted EBITDA is not a recognized term under GAAP and does not purport to be an alternative to net earnings (losses) as an indicator of operating performance or to cash flows from operating activities as a measure of liquidity. Because not all companies use identical calculations, this presentation of Adjusted EBITDA may not be comparable to other similarly titled measures of other companies. Additionally, Adjusted EBITDA is not intended to be a measure of cash flow available for management’s discretionary use, as it does not consider certain cash requirements such as interest payments, tax payments and debt service requirements.
Use of Non-GAAP Financial Information

Page 127
Adjusted EBITDA Reconciliation
(Dollars in Millions) 2005 2010Net income / (loss) ($270) $1,026Interest expense, net 132 170Provision for income taxes 64 150Depreciation and amortization 595 280Asset impairments and other (gains) / losses (321) 24Restructuring and other related costs, net 7 33Net OPEB and other employee charges - (176)Reorganization and other related items - (893) Adjusted EBITDA $207 $614
2005, 2010

Page 128
www.visteon.com