visitor arrivals report 2014 year end
TRANSCRIPT

7/25/2019 Visitor Arrivals Report 2014 Year End
http://slidepdf.com/reader/full/visitor-arrivals-report-2014-year-end 1/17

7/25/2019 Visitor Arrivals Report 2014 Year End
http://slidepdf.com/reader/full/visitor-arrivals-report-2014-year-end 2/17
7/25/2019 Visitor Arrivals Report 2014 Year End
http://slidepdf.com/reader/full/visitor-arrivals-report-2014-year-end 3/17
1 | P a g e B e r m u d a T o u r i s m A u t h o r i t y – 2 0 1 4 V i s i t o r P r o f i l e
* Source, Bermuda Tourism Authority, Visitor arrival forms
Summary
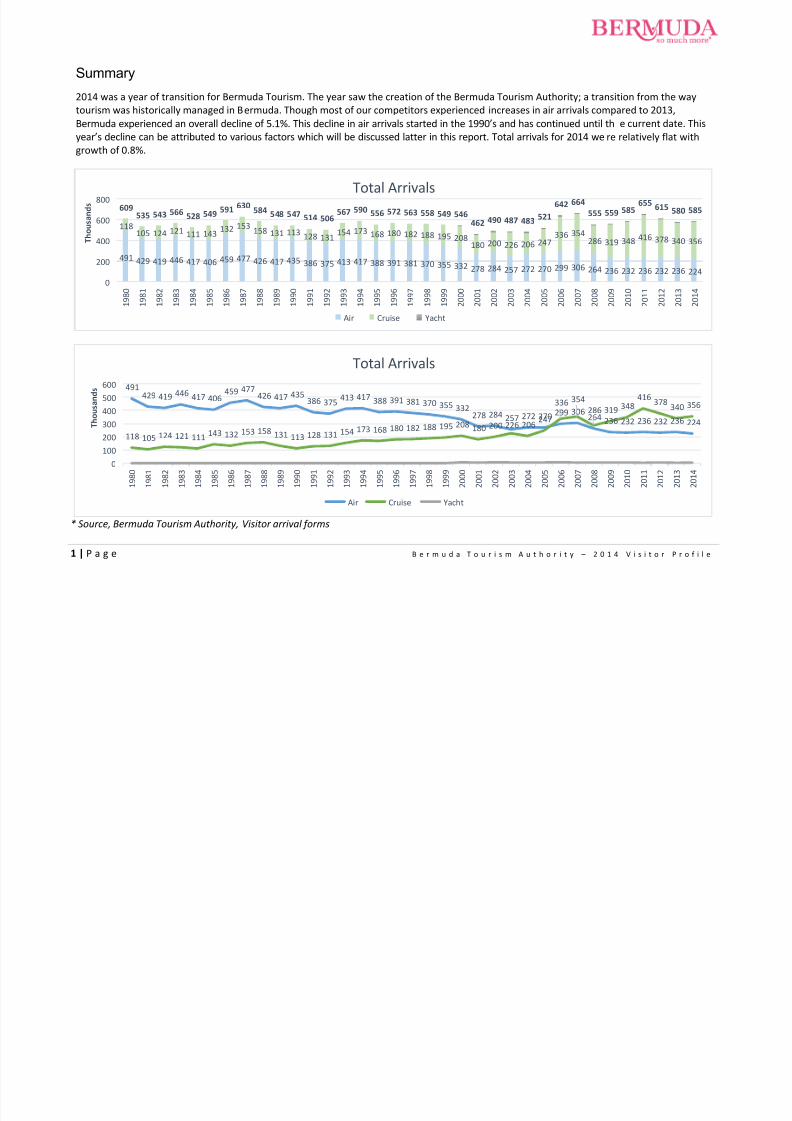
2014 was a year of transition for Bermuda Tourism. The year saw the creation of the Bermuda Tourism Authority; a transition from the way
tourism was historically managed in Bermuda. Though most of our competitors experienced increases in air arrivals compared to 2013,
Bermuda experienced an overall decline of 5.1%. This decline in air arrivals started in the 1990’s and has continued until th e current date. This
year’s decline can be attributed to various factors which will be discussed latter in this report. Total arrivals for 2014 were relatively flat withgrowth of 0.8%.
491 429 419 446 417 406 459 477 426 417 435 386 375 413 417 388 391 381 370 355 332 278 284 257 272 270 299 306 264 236 232 236 232 236 224
118105 124 121 111 143
132 153158 131 113
128 131154 173 168 180 182 188 195 208
180 200 226 206 247336 354
286 319 348 416 378 340 356
609535 543 566 528 549
591 630584 548 547 514 506
567 590 556 572 563 558 549 546462 490 487 483
521
642 664
555 559 585655
615 580 585
0
200
400
600
800
1 9 8 0
1 9 8 1
1 9 8 2
1 9 8 3
1 9 8 4
1 9 8 5
1 9 8 6
1 9 8 7
1 9 8 8
1 9 8 9
1 9 9 0
1 9 9 1
1 9 9 2
1 9 9 3
1 9 9 4
1 9 9 5
1 9 9 6
1 9 9 7
1 9 9 8
1 9 9 9
2 0 0 0
2 0 0 1
2 0 0 2
2 0 0 3
2 0 0 4
2 0 0 5
2 0 0 6
2 0 0 7
2 0 0 8
2 0 0 9
2 0 1 0
2 0 1 1
2 0 1 2
2 0 1 3
2 0 1 4
T h o u s a n d s
Total Arrivals
Air Cruise Yacht
491429 419 446 417 406
459 477426 417 435
386 375413 417 388 391 381 370 355 332
278 284 257 272 270 299 306 264 236 232 236 232 236 224
118 105 124 121 111143 132 153 158 131 113 128 131 154 173 168 180 182 188 195 208 180 200 226 206
247
336 354
286 319
348416
378340 356
0
100
200
300400
500
600
1 9 8 0
1 9 8 1
1 9 8 2
1 9 8 3
1 9 8 4
1 9 8 5
1 9 8 6
1 9 8 7
1 9 8 8
1 9 8 9
1 9 9 0
1 9 9 1
1 9 9 2
1 9 9 3
1 9 9 4
1 9 9 5
1 9 9 6
1 9 9 7
1 9 9 8
1 9 9 9
2 0 0 0
2 0 0 1
2 0 0 2
2 0 0 3
2 0 0 4
2 0 0 5
2 0 0 6
2 0 0 7
2 0 0 8
2 0 0 9
2 0 1 0
2 0 1 1
2 0 1 2
2 0 1 3
2 0 1 4
T h o u s a n d s
Total Arrivals
Air Cruise Yacht

7/25/2019 Visitor Arrivals Report 2014 Year End
http://slidepdf.com/reader/full/visitor-arrivals-report-2014-year-end 4/17
2 | P a g e B e r m u d a T o u r i s m A u t h o r i t y – 2 0 1 4 V i s i t o r P r o f i l e
Arrivals by Month for 2014
Jan Feb Mar Apr May Jun Jul Aug Sep Oct Nov Dec2014
Total
YoY %
∆
Yacht 5 37 213 326 1,210 1,831 154 24 26 104 265 85 4,280 24.6%
Cruise - - - 25,433 53,397 68,086 69,795 59,562 40,489 28,375 9,783 960 355,880 4.7%
Air 7,126 8,908 14,998 19,524 24,898 28,840 32,113 27,760 18,321 15,732 14,416 11,741 224,377 -5.1%
Total 7,131 8,945 15,424 45,283 79,505 98,757 102,062 87,346 58,836 44,211 24,464 12,786 584,489 0.8%
Air arrivals were down year over year with lower demand in the
summer and hurricanes in October contributing to a 5.1% decline. Air
arrivals have declined 16.8% over the past 10 years.
Cruise arrivals were up year over year by 4.7%. The driver behind
the increase was problems with the port in 2013, decreased total
calls to island in 2013, as well as additional arrivals in November
and December of 2014. Cruise arrivals have increased 44.0%
over the past 10 years.
Total Yacht arrivals increased year over year by 24.6%. The Biennial
Newport to Bermuda race was the drive behind this increase. Yacht
arrivals have experienced a 4.1% decline over the past 10 years.
July was the busiest month for arrivals with 102,062 visitors.
* Source, Bermuda Tourism Authority, Visitor arrival forms
-
10,000
20,000
30,000
40,000
Jan Feb Mar Apr May Jun Jul Aug Sep Oct Nov Dec
Air Arrivals
2011 2012 2013 2014
-
50,000
100,000
Jan Feb Mar Apr May Jun Jul Aug Sep Oct Nov Dec
Cruise Arrivals
2011 2012 2013 2014
-
2,000
4,000
Jan Feb Mar Apr May Jun Jul Aug Sep Oct Nov Dec
Yacht Arrivals
2011 2012 2013 2014
7/25/2019 Visitor Arrivals Report 2014 Year End
http://slidepdf.com/reader/full/visitor-arrivals-report-2014-year-end 5/17
3 | P a g e B e r m u d a T o u r i s m A u t h o r i t y – 2 0 1 4 V i s i t o r P r o f i l e
Air Arrivals Statistics
Country of Origin 2011 2012 2013 2014 YoY % ∆ % of 2014 Total
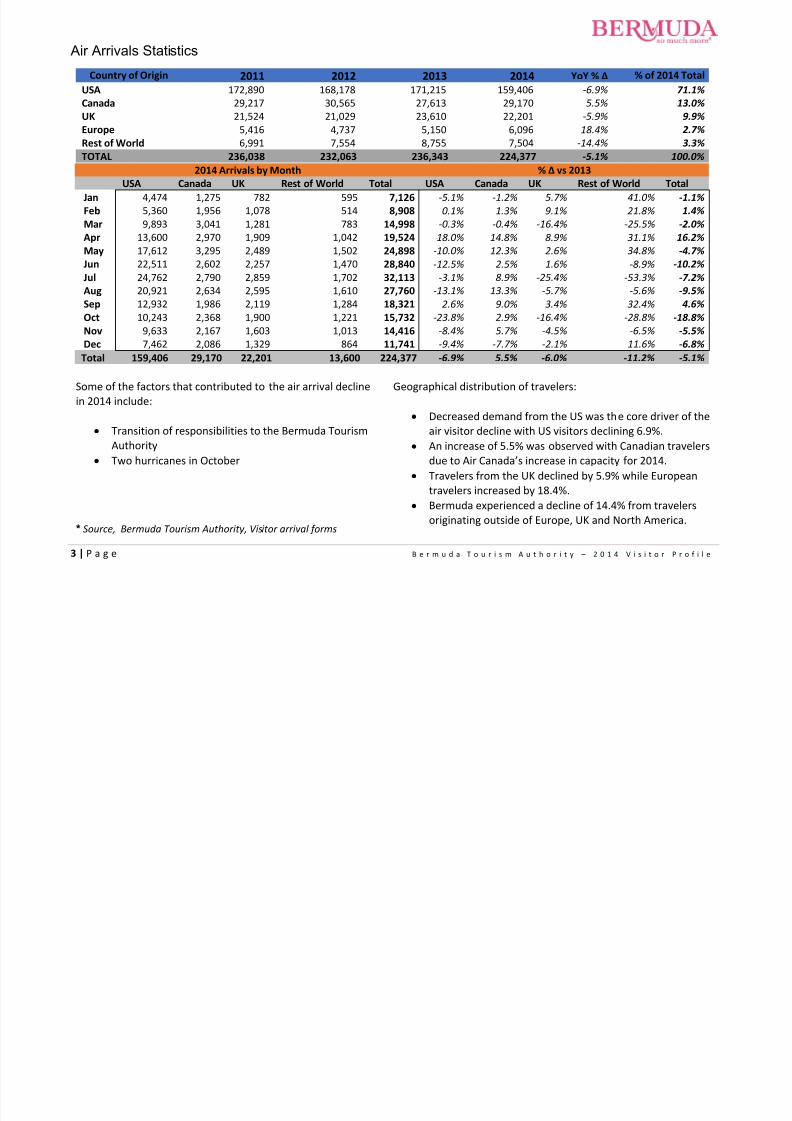
USA 172,890 168,178 171,215 159,406 -6.9% 71.1%
Canada 29,217 30,565 27,613 29,170 5.5% 13.0%
UK 21,524 21,029 23,610 22,201 -5.9% 9.9%
Europe 5,416 4,737 5,150 6,096 18.4% 2.7%
Rest of World 6,991 7,554 8,755 7,504 -14.4% 3.3%
TOTAL 236,038 232,063 236,343 224,377 -5.1% 100.0%
2014 Arrivals by Month % ∆ vs 2013
USA Canada UK Rest of World Total USA Canada UK Rest of World Total
Jan 4,474 1,275 782 595 7,126 -5.1% -1.2% 5.7% 41.0% -1.1%
Feb 5,360 1,956 1,078 514 8,908 0.1% 1.3% 9.1% 21.8% 1.4%
Mar 9,893 3,041 1,281 783 14,998 -0.3% -0.4% -16.4% -25.5% -2.0%
Apr 13,600 2,970 1,909 1,042 19,524 18.0% 14.8% 8.9% 31.1% 16.2%
May 17,612 3,295 2,489 1,502 24,898 -10.0% 12.3% 2.6% 34.8% -4.7%
Jun 22,511 2,602 2,257 1,470 28,840 -12.5% 2.5% 1.6% -8.9% -10.2%
Jul 24,762 2,790 2,859 1,702 32,113 -3.1% 8.9% -25.4% -53.3% -7.2%
Aug 20,921 2,634 2,595 1,610 27,760 -13.1% 13.3% -5.7% -5.6% -9.5%
Sep 12,932 1,986 2,119 1,284 18,321 2.6% 9.0% 3.4% 32.4% 4.6%
Oct 10,243 2,368 1,900 1,221 15,732 -23.8% 2.9% -16.4% -28.8% -18.8%
Nov 9,633 2,167 1,603 1,013 14,416 -8.4% 5.7% -4.5% -6.5% -5.5%
Dec 7,462 2,086 1,329 864 11,741 -9.4% -7.7% -2.1% 11.6% -6.8%
Total 159,406 29,170 22,201 13,600 224,377 -6.9% 5.5% -6.0% -11.2% -5.1%
Some of the factors that contributed to the air arrival decline
in 2014 include:
Transition of responsibilities to the Bermuda Tourism
Authority
Two hurricanes in October
* Source, Bermuda Tourism Authority, Visitor arrival forms
Geographical distribution of travelers:
Decreased demand from the US was the core driver of theair visitor decline with US visitors declining 6.9%.
An increase of 5.5% was observed with Canadian travelers
due to Air Canada’s increase in capacity for 2014.
Travelers from the UK declined by 5.9% while European
travelers increased by 18.4%.
Bermuda experienced a decline of 14.4% from travelers
originating outside of Europe, UK and North America.

7/25/2019 Visitor Arrivals Report 2014 Year End
http://slidepdf.com/reader/full/visitor-arrivals-report-2014-year-end 6/17
4 | P a g e B e r m u d a T o u r i s m A u t h o r i t y – 2 0 1 4 V i s i t o r P r o f i l e
Air Load Factor
Capacity (Available Seats)
2011 2012 2013 2014YoY %
∆
Jan 40,678 36,460 35,636 36,980 3.8%
Feb 37,920 35,140 32,132 32,206 0.2%
Mar 42,936 41,802 38,376 41,640 8.5%
Apr 47,020 47,253 44,548 44,036 -1.1%
May 59,231 52,627 52,018 52,058 0.1%
Jun 60,616 61,368 61,667 56,752 -8.0%
Jul 64,196 62,051 63,993 60,902 -4.8%
Aug 59,511 59,381 61,161 58,768 -3.9%
Sep 49,008 46,059 44,888 48,508 8.1%
Oct 49,556 45,635 47,324 43,988 -7.0%
Nov 39,824 38,392 43,010 41,726 -3.0%
Dec 39,392 39,064 41,334 36,676
-
11.3%
Total 589,888 565,232 566,087 554,240 -2.1%
Arriving Passengers (includes
Residents)2011 2012 2013 2014 YoY % ∆
21,349 19,723 19,482 19,601 0.6%
19,427 19,763 18,616 18,557 -0.3%
25,729 26,106 25,731 25,178 -2.1%
35,072 33,737 30,337 32,659 7.7%
40,713 37,321 38,778 37,285 -3.9%
45,072 42,288 43,846 40,377 -7.9%
47,673 46,488 47,242 45,185 -4.4%
46,942 48,407 48,094 45,806 -4.8%
32,180 31,055 30,972 31,104 0.4%
32,506 31,692 30,079 26,955 -10.4%
27,182 26,596 27,749 27,184 -2.0%
24,721 25,306 26,764 25,332 -5.4%
398,566 388,482 387,690 375,223 -3.2%
Load Factor (% of seats filled)
2011 2012 2013 2014YoY %
∆
52.5% 54.1% 54.7% 53.0% -3.0%
51.2% 56.2% 57.9% 57.6% -0.5%
59.9% 62.5% 67.0% 60.5% -9.8%
74.6% 71.4% 68.1% 74.2% 8.9%
68.7% 70.9% 74.5% 71.6% -3.9%
74.4% 68.9% 71.1% 71.1% 0.1%
74.3% 74.9% 73.8% 74.2% 0.5%
78.9% 81.5% 78.6% 77.9% -0.9%
65.7% 67.4% 69.0% 64.1% -7.1%
65.6% 69.4% 63.6% 61.3% -3.6%
68.3% 69.3% 64.5% 65.1% 1.0%
62.8% 64.8% 64.8% 69.1% 6.7%
67.6% 68.7% 68.5% 67.7% -1.1%
Total capacity (seats available) for flights to Bermuda has decreased compared to 2013 by 2.1%
Visitors accounted for 59.6% of all airline arrivals to Bermudian 2014
From 2011 through 2014 total capacity has declined by 6%
Total Arriving passengers has decreased by 3.2% compared to 2013 (includes Bermuda resident travel)
Bermuda’s load factor (percentage of seats filled) for the entire year of 2014 was 67.7%, down 1.1% from 2013 This ratio has remained relatively flat as decreases in arrival have declined in proportions with capacity
The highest load factor in the past 10 years (2009) was 74.7%, a year which saw 415,762 air arrivals
* Source, Department of Airport Operations
7/25/2019 Visitor Arrivals Report 2014 Year End
http://slidepdf.com/reader/full/visitor-arrivals-report-2014-year-end 7/17
5 | P a g e B e r m u d a T o u r i s m A u t h o r i t y – 2 0 1 4 V i s i t o r P r o f i l e
Cruise Arrivals Statistics
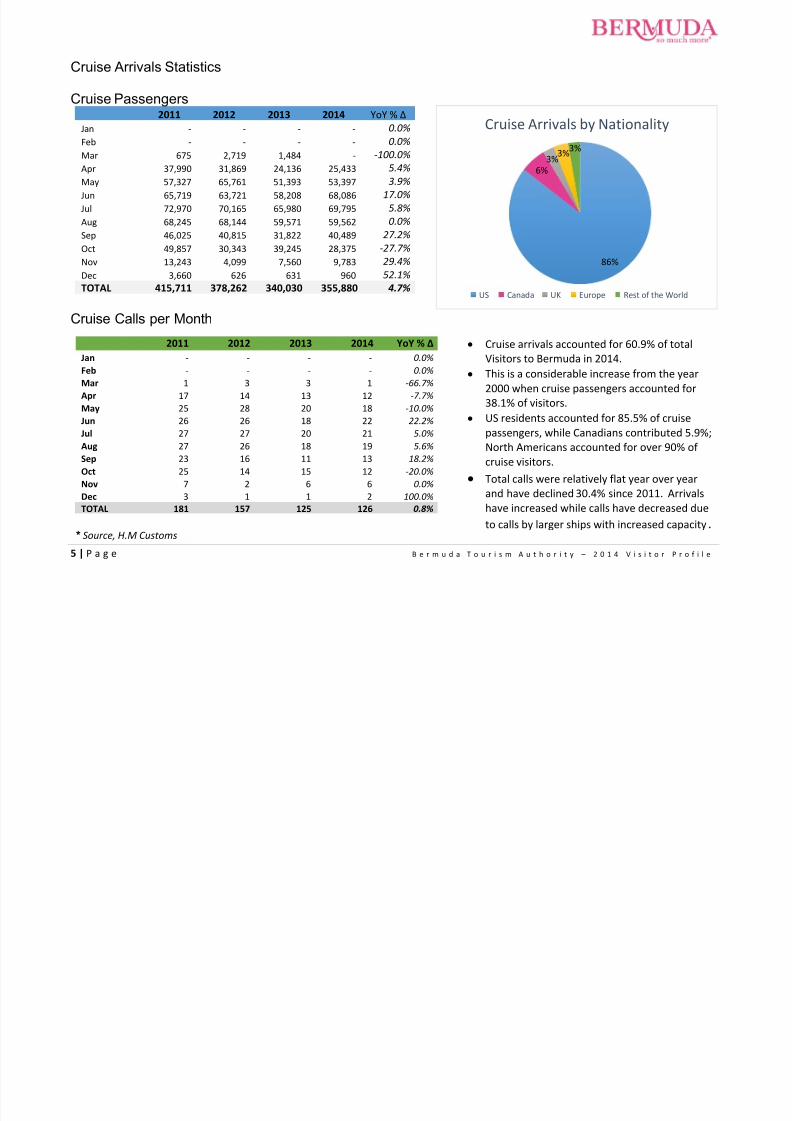
Cruise Passengers2011 2012 2013 2014 YoY % ∆
Jan - - - - 0.0%
Feb - - - - 0.0%
Mar 675 2,719 1,484 - -100.0%
Apr 37,990 31,869 24,136 25,433 5.4%
May 57,327 65,761 51,393 53,397 3.9%
Jun 65,719 63,721 58,208 68,086 17.0%
Jul 72,970 70,165 65,980 69,795 5.8%
Aug 68,245 68,144 59,571 59,562 0.0%
Sep 46,025 40,815 31,822 40,489 27.2%
Oct 49,857 30,343 39,245 28,375 -27.7%
Nov 13,243 4,099 7,560 9,783 29.4%
Dec 3,660 626 631 960 52.1%TOTAL 415,711 378,262 340,030 355,880 4.7%
Cruise Calls per Month
2011 2012 2013 2014 YoY % ∆
Jan - - - - 0.0%
Feb - - - - 0.0%
Mar 1 3 3 1 -66.7%
Apr 17 14 13 12 -7.7%
May 25 28 20 18 -10.0%
Jun 26 26 18 22 22.2%
Jul 27 27 20 21 5.0%
Aug 27 26 18 19 5.6%
Sep 23 16 11 13 18.2%
Oct 25 14 15 12 -20.0%
Nov 7 2 6 6 0.0%
Dec 3 1 1 2 100.0%
TOTAL 181 157 125 126 0.8%
* Source, H.M Customs
Cruise arrivals accounted for 60.9% of total
Visitors to Bermuda in 2014.
This is a considerable increase from the year
2000 when cruise passengers accounted for
38.1% of visitors.
US residents accounted for 85.5% of cruisepassengers, while Canadians contributed 5.9%;
North Americans accounted for over 90% of
cruise visitors.
Total calls were relatively flat year over year
and have declined 30.4% since 2011. Arrivals
have increased while calls have decreased due
to calls by larger ships with increased capacity.
86%
6%3%
3%3%
Cruise Arrivals by Nationality
US Canada UK Europe Rest of the World

7/25/2019 Visitor Arrivals Report 2014 Year End
http://slidepdf.com/reader/full/visitor-arrivals-report-2014-year-end 8/17
6 | P a g e B e r m u d a T o u r i s m A u t h o r i t y – 2 0 1 4 V i s i t o r P r o f i l e
Yacht Arrival Statistics2011 2012 2013 2014 YoY % ∆
United States 1,702 2,815 1,400 2,213 58.1%
Canada 245 316 208 251 20.7%
United Kingdom 459 440 454 346 -23.8%
Europe 769 946 1118 1032 -7.7%Rest of World 312 329 255 438 71.8%
TOTAL 3,487 4,846 3,435 4,280 24.6%
Compared to 2013, 2014 saw an increase of 24.6% in
yacht visitors driven by the Newport to Bermuda Race.
This can be seen in the 58.1% increase in yachts
originating in the US.
Yacht visits from the UK have declined by 23.8% or 108
persons; this is the lowest arrival figure in the past 3years.
Arrivals from Europe were down 7.7% however were
still higher than figures recorded in 2011 or 2012.
Travelers from the Rest of the World increased by
71.8% or 183 persons.
* Source, H.M Customs
52%
6%
8%
24%
10%
Yacht Arrivals by Nationality
United States Canada United Kingdom Europe Rest of World
0
1,000
2,000
3,000
Jan Feb Mar Apr May Jun Jul Aug Sep Oct Nov Dec
Yacht Arrivals by Month
2011 2012 2013 2014
7/25/2019 Visitor Arrivals Report 2014 Year End
http://slidepdf.com/reader/full/visitor-arrivals-report-2014-year-end 9/17
7 | P a g e B e r m u d a T o u r i s m A u t h o r i t y – 2 0 1 4 V i s i t o r P r o f i l e
Air Visitors Purpose of Visit
Purpose of Visit by Country
Vacation Friend/Relative Other Reasons Business Convention In Transit/Crew Total
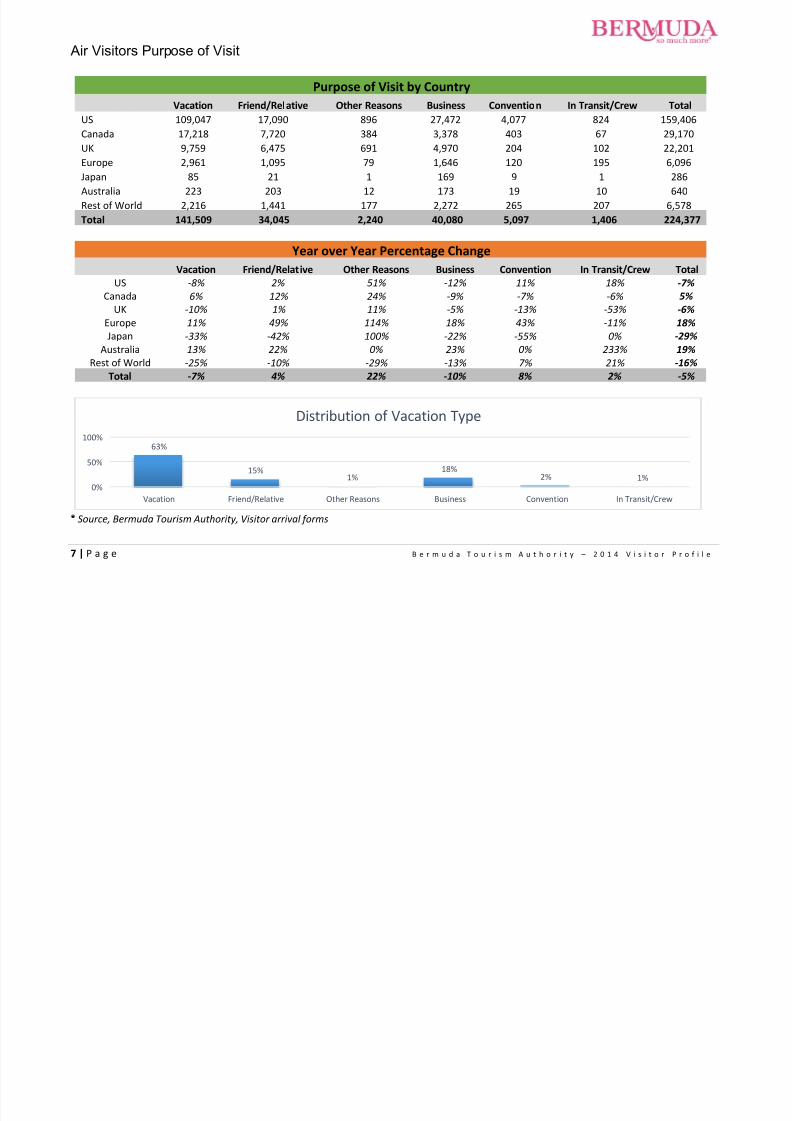
US 109,047 17,090 896 27,472 4,077 824 159,406
Canada 17,218 7,720 384 3,378 403 67 29,170 UK 9,759 6,475 691 4,970 204 102 22,201
Europe 2,961 1,095 79 1,646 120 195 6,096
Japan 85 21 1 169 9 1 286
Australia 223 203 12 173 19 10 640
Rest of World 2,216 1,441 177 2,272 265 207 6,578
Total 141,509 34,045 2,240 40,080 5,097 1,406 224,377
Year over Year Percentage Change
Vacation Friend/Relative Other Reasons Business Convention In Transit/Crew Total
US -8% 2% 51% -12% 11% 18% -7%
Canada 6% 12% 24% -9% -7% -6% 5%
UK -10% 1% 11% -5% -13% -53% -6%
Europe 11% 49% 114% 18% 43% -11% 18%
Japan -33% -42% 100% -22% -55% 0% -29%
Australia 13% 22% 0% 23% 0% 233% 19%
Rest of World -25% -10% -29% -13% 7% 21% -16%
Total -7% 4% 22% -10% 8% 2% -5%
* Source, Bermuda Tourism Authority, Visitor arrival forms
63%
15%1%
18%2% 1%
0%
50%
100%
Vacation Friend/Relative Other Reasons Business Convention In Transit/Crew
Distribution of Vacation Type
7/25/2019 Visitor Arrivals Report 2014 Year End
http://slidepdf.com/reader/full/visitor-arrivals-report-2014-year-end 10/17
8 | P a g e B e r m u d a T o u r i s m A u t h o r i t y – 2 0 1 4 V i s i t o r P r o f i l e
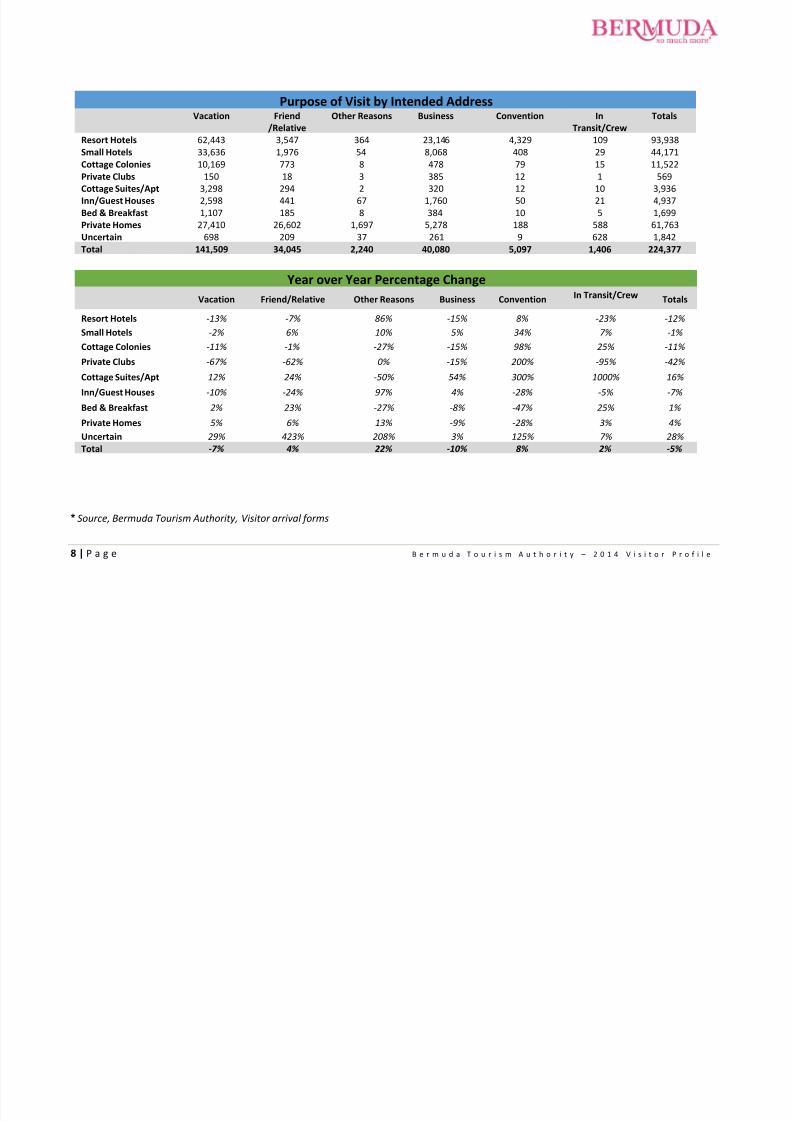
Purpose of Visit by Intended Address
Vacation Friend
/Relative
Other Reasons Business Convention In
Transit/Crew
Totals
Resort Hotels 62,443 3,547 364 23,146 4,329 109 93,938Small Hotels 33,636 1,976 54 8,068 408 29 44,171
Cottage Colonies 10,169 773 8 478 79 15 11,522
Private Clubs 150 18 3 385 12 1 569
Cottage Suites/Apt 3,298 294 2 320 12 10 3,936
Inn/Guest Houses 2,598 441 67 1,760 50 21 4,937
Bed & Breakfast 1,107 185 8 384 10 5 1,699
Private Homes 27,410 26,602 1,697 5,278 188 588 61,763
Uncertain 698 209 37 261 9 628 1,842
Total 141,509 34,045 2,240 40,080 5,097 1,406 224,377
Year over Year Percentage Change
Vacation Friend/Relative Other Reasons Business Convention In Transit/Crew Totals
Resort Hotels -13% -7% 86% -15% 8% -23% -12%
Small Hotels -2% 6% 10% 5% 34% 7% -1%
Cottage Colonies -11% -1% -27% -15% 98% 25% -11%
Private Clubs -67% -62% 0% -15% 200% -95% -42%
Cottage Suites/Apt 12% 24% -50% 54% 300% 1000% 16%
Inn/Guest Houses -10% -24% 97% 4% -28% -5% -7%
Bed & Breakfast 2% 23% -27% -8% -47% 25% 1%
Private Homes 5% 6% 13% -9% -28% 3% 4%
Uncertain 29% 423% 208% 3% 125% 7% 28%
Total -7% 4% 22% -10% 8% 2% -5%
* Source, Bermuda Tourism Authority, Visitor arrival forms

7/25/2019 Visitor Arrivals Report 2014 Year End
http://slidepdf.com/reader/full/visitor-arrivals-report-2014-year-end 11/17
9 | P a g e B e r m u d a T o u r i s m A u t h o r i t y – 2 0 1 4 V i s i t o r P r o f i l e
Hotel Statistics – Inventory
Number of Properties Room Count Bed Count
2011 2012 2013 2014 YoY % ∆
Jan 48 48 48 47 -2.1%
Feb 48 48 48 47 -2.1%
Mar 48 48 47 47 0.0%
Apr 48 48 47 44 -6.4%
May 48 48 47 44 -6.4%
Jun 49 48 47 45 -4.3%
Jul 49 48 47 45 -4.3%
Aug 49 48 47 45 -4.3%
Sep 49 48 47 45 -4.3%
Oct 49 48 47 45 -4.3%
Nov 48 48 47 45 -4.3%
Dec 48 48 47 45 -4.3%
2011 2012 2013 2014 YoY % ∆
2,604 2,533 2,532 2,538 0.2%
2,604 2,533 2,531 2,538 0.3%
2,604 2,533 2,541 2,538 -0.1%
2,596 2,533 2,541 2,407 -5.3%
2,596 2,528 2,541 2,407 -5.3%
2,604 2,528 2,541 2,415 -5.0%
2,604 2,528 2,541 2,415 -5.0%
2,604 2,528 2,541 2,415 -5.0%
2,604 2,527 2,538 2,415 -4.8%
2,604 2,532 2,538 2,415 -4.8%
2,532 2,532 2,538 2,415 -4.8%
2,533 2,532 2,538 2,415 -4.8%
2011 2012 2013 2014 YoY % ∆
5,550 5,244 5,256 5,264 0.2%
5,550 5,244 5,252 5,264 0.2%
5,550 5,244 5,270 5,264 -0.1%
5,368 5,244 5,270 5,002 -5.1%
5,384 5,234 5,270 5,002 -5.1%
5,384 5,234 5,270 5,018 -4.8%
5,384 5,234 5,270 5,018 -4.8%
5,384 5,234 5,270 5,018 -4.8%
5,384 5,232 5,264 5,018 -4.7%
5,384 5,256 5,264 5,018 -4.7%
5,240 5,256 5,264 5,018 -4.7%
5,244 5,256 5,264 5,018 -4.7%
The decline in air visitors has impacted an already fragile hotel inventory. Total beds have declined by approximately 6.0% between
2011 and 2014. Beds available have declined by 3.6% and rooms by 3.7%.
* Source, Ministry of Tourism Development & Transport

7/25/2019 Visitor Arrivals Report 2014 Year End
http://slidepdf.com/reader/full/visitor-arrivals-report-2014-year-end 12/17
10 | P a g e B e r m u d a T o u r i s m A u t h o r i t y – 2 0 1 4 V i s i t o r P r o f i l e
Hotel Statistics
This data is provided by the Bermuda Hotel Association and its members, and does not include all of the hotel inventory, as such statistics will not reconcile to the
previous table.
Room Nights Available
2011 2012 2013 2014 YoY % ∆
Jan 53,351 53,475 53,444 42,408 -20.6%
Feb 48,188 48,256 43,736 37,100 -15.2%
Mar 53,599 53,506 52,669 45,818 -13.0%
Apr 51,870 51,870 50,580 44,252 -12.5%
May 53,599 53,382 52,266 48,918 -6.4%
Jun 51,870 51,630 50,760 48,660 -4.1%
Jul 53,506 53,413 52,483 52,483 0.0%
Aug 53,568 53,413 52,049 54,243 4.2%
Sep 51,840 51,690 51,720 44,880 -13.2%
Oct 53,568 53,413 52,204 54,901 5.2%
Nov 51,840 51,690 46,230 46,830 1.3%Dec 53,599 53,413 45,632 47,151 3.3%
TOTAL 630,398 629,151 603,773 567,644 -6.0%
Room Nights Sold
2011 2012 2013 2014 YoY % ∆
Jan 13,964 14,235 15,162 14,665 -3.3%
Feb 15,420 16,003 14,000 14,591 4.2%
Mar 26,696 26,570 22,985 23,416 1.9%
Apr 30,940 30,796 26,157 27,601 5.5%
May 37,540 33,926 36,639 34,726 -5.2%Jun 43,276 40,826 42,253 38,810 -8.1%
Jul 45,684 44,991 45,064 40,673 -9.7%
Aug 43,895 43,378 40,933 37,273 -8.9%
Sep 26,684 27,935 29,003 29,280 1.0%
Oct 30,084 31,570 30,378 27,660 -8.9%
Nov 24,685 23,976 23,552 25,256 7.2%
Dec 16,277 16,150 16,641 16,442 -1.2%
TOTAL 355,145 350,356 342,767 330,393 -3.6%
* Source, Bermuda Hotel Association

7/25/2019 Visitor Arrivals Report 2014 Year End
http://slidepdf.com/reader/full/visitor-arrivals-report-2014-year-end 13/17
11 | P a g e B e r m u d a T o u r i s m A u t h o r i t y – 2 0 1 4 V i s i t o r P r o f i l e
Occupancy Rate
2011 2012 2013 2014 YoY % ∆
Jan 26% 27% 28% 35% 21.9%
Feb 32% 33% 32% 39% 22.9%
Mar 50% 50% 44% 51% 17.1%
Apr 60% 59% 52% 62% 20.6%May 70% 64% 70% 71% 1.3%
Jun 83% 79% 83% 80% -4.2%
Jul 85% 84% 86% 77% -9.7%
Aug 82% 81% 79% 69% -12.6%
Sep 51% 54% 56% 65% 16.3%
Oct 56% 59% 58% 50% -13.4%
Nov 48% 46% 51% 54% 5.9%
Dec 30% 30% 36% 35% -4.4%
TOTAL 56% 56% 57% 58% 2.5%
Total rooms available continued to decline, with the year
over year decrease totaling 6.0%
However rooms which added to the decline have been
taken off for renovations and will be added back to the
inventory once they are completed. Total rooms sold decreased year over year by
approximately 3.6%.
Occupancy improved to 57.6% year over year, however
this is the result of a lower level of inventory.
Both ADR and RevPar have increased compared to 2013
by 4.8% and 3.3% respectively.
* Source, Bermuda Hotel Association
ADR and RevPar Trending
ADR Year Average
2012 2013 2014 YoY % ∆
Average $301 $316 $327 3.3%
REVPAR Year Average
2012 2013 2014 YoY % ∆
Average $174 $180 $188 4.8%
Both Average Daily Rate and RevPAR have increased year over year. The increase in RevPAR can be attributed to falling inventory,
resulting in higher occupancy. Average daily rates have increased compared to 2014 even though overall visitor spending on
accommodation by visitors has fallen.
* Source, Bermuda Hotel Association &STR
7/25/2019 Visitor Arrivals Report 2014 Year End
http://slidepdf.com/reader/full/visitor-arrivals-report-2014-year-end 14/17
12 | P a g e B e r m u d a T o u r i s m A u t h o r i t y – 2 0 1 4 V i s i t o r P r o f i l e
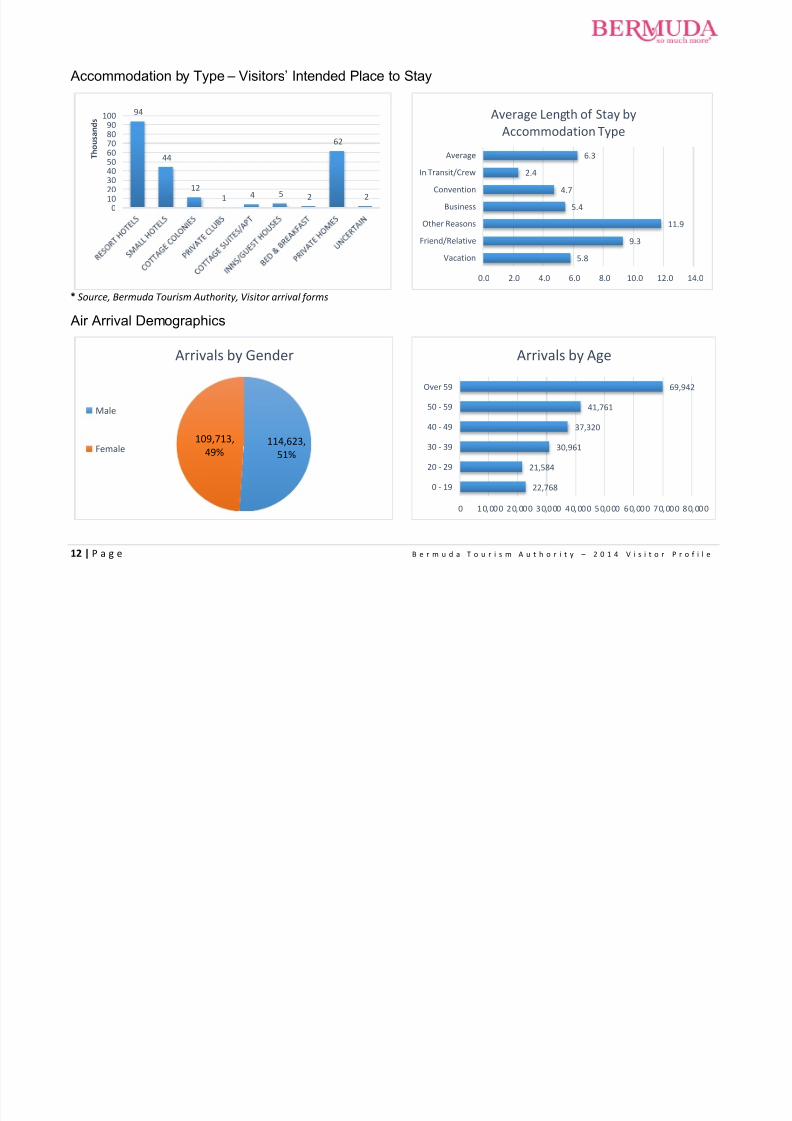
Accommodation by Type – Visitors’ Intended Place to Stay
* Source, Bermuda Tourism Authority, Visitor arrival forms
Air Arrival Demographics
94
44
121 4 5 2
62
2
0102030405060708090
100
T h o u s
a n d s
5.8
9.3
11.9
5.4
4.7
2.4
6.3
0.0 2.0 4.0 6.0 8.0 10.0 12.0 14.0
Vacation
Friend/Relative
Other Reasons
Business
Convention
In Transit/Crew
Average
Average Length of Stay by
Accommodation Type
114,623,
51%
109,713,
49%
Arrivals by Gender
Male
Female
22,768
21,584
30,961
37,320
41,761
69,942
0 10,000 20,000 30,000 40,000 50,000 60,000 70,000 80,000
0 - 19
20 - 29
30 - 39
40 - 49
50 - 59
Over 59
Arrivals by Age

7/25/2019 Visitor Arrivals Report 2014 Year End
http://slidepdf.com/reader/full/visitor-arrivals-report-2014-year-end 15/17
13 | P a g e B e r m u d a T o u r i s m A u t h o r i t y – 2 0 1 4 V i s i t o r P r o f i l e
Bermuda experienced a near equal distribution of male and female travellers. Aproximately 49.8% of travellers or 111K visitors
were over 50 years old. Approximately 19.8% of travellers were under 30. Business travellers were mostly male (77%), those in
transit were also overwhelmingly male (81%).
* Source, Bermuda Tourism Authority, Visitor arrival forms
Length of Stay
Average Length of stay in 2014 was 6.3 nights, a decrease year over year from 7.1 nights in 2013. Persons visiting friends and
family were more likely to spend a longer time on island with an average stay of 9.3 nights. Vacationers spent on average 5.8 nights
an increase of 11.5% from 2013. Business travellers stayed on average 5.4 nights while those coming for conventions stayed for 4.7
nights.
* Source, Bermuda Tourism Authority, Visitor arrival forms
12 13
1517
20
33
11 9
1620
22
37
0
10
20
30
40
0 - 19 20 - 29 30 - 39 40 - 49 50 - 59 Over 59
T h o u s a n d s
Arrivals by Gender/Age
Females Males
54% 59% 60%
23% 44% 19%
46% 41% 40%77%
56%81%
0%20%
40%
60%
80%
100%
Purpose of Visit by Gender
Female Male
65
121
275 5 1
-
50
100
150
1 - 3
Nights
4 - 7
Nights
8 - 14
Nights
15 - 21
Nights
Over 21
Nights
Uncertain
T h o u s a n d s
Average Length of Stay
5.89.3 11.9 5.4
4.7 2.46.3
0.0
5.0
10.0
15.0
Average Length of Stay by Purpose
of Visit

7/25/2019 Visitor Arrivals Report 2014 Year End
http://slidepdf.com/reader/full/visitor-arrivals-report-2014-year-end 16/17
14 | P a g e B e r m u d a T o u r i s m A u t h o r i t y – 2 0 1 4 V i s i t o r P r o f i l e
Visitor Spending – Air
Per persons spending has declined by 12% from 2011 – 2014. This decline comes in a time where many of our competitiors are
experiecing increases in arrivals and spending as the US economy recovers.
Overall spending has decreased 11.3% due to lower per person spending and lower air arrivals.
* Source, Total Research Associates, Air Visitor Exit Survey
$1,419
$1,342 $1,337
$1,249
$1,000
$1,050
$1,100
$1,150
$1,200
$1,250
$1,300
$1,350
$1,400
$1,450
2011 2012 2013 2014
Average Air Vistor Spending Per Person
$335$311 $316
$280
$240
$260
$280
$300
$320
$340
2011 2012 2013 2014
M i l l i o n s
Total Air Visitor Spending
7/25/2019 Visitor Arrivals Report 2014 Year End
http://slidepdf.com/reader/full/visitor-arrivals-report-2014-year-end 17/17
15 | P a g e B e r m u d a T o u r i s m A u t h o r i t y – 2 0 1 4 V i s i t o r P r o f i l e
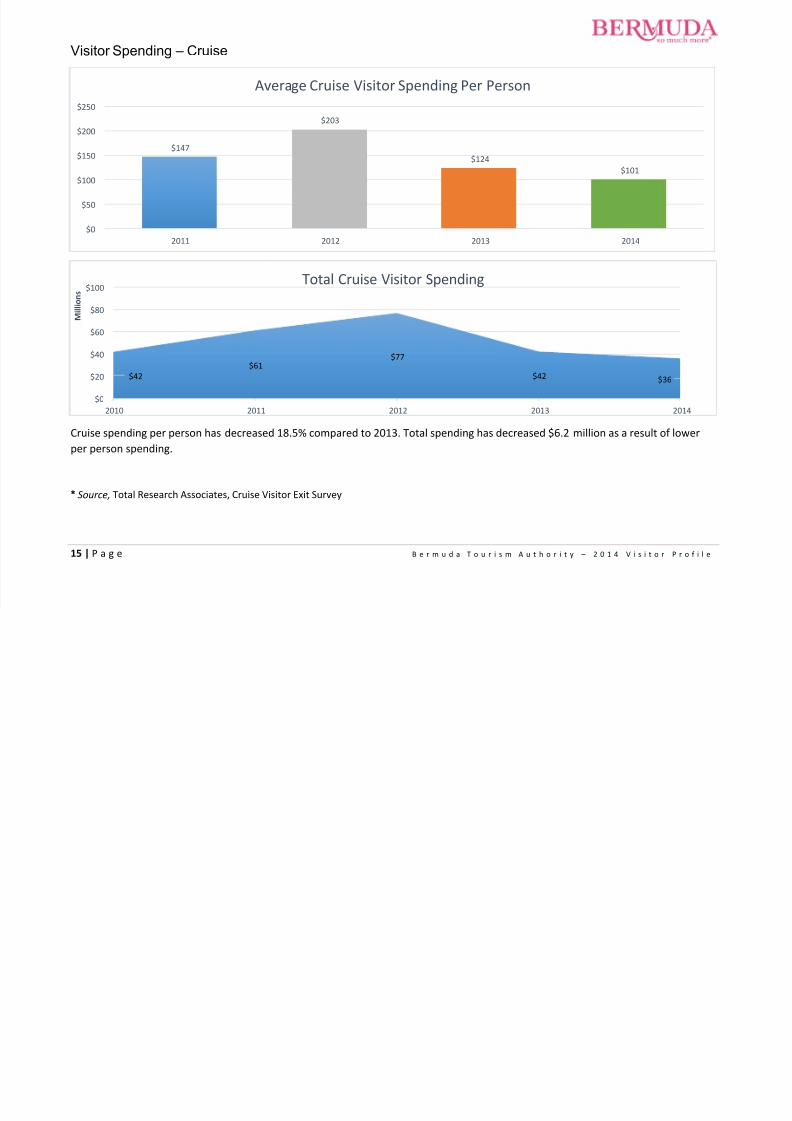
Visitor Spending – Cruise
Cruise spending per person has decreased 18.5% compared to 2013. Total spending has decreased $6.2 million as a result of lower
per person spending.
* Source, Total Research Associates, Cruise Visitor Exit Survey
$147
$203
$124
$101
$0
$50
$100
$150
$200
$250
2011 2012 2013 2014
Average Cruise Visitor Spending Per Person
$42
$61$77
$42 $36
$0
$20
$40
$60
$80
$100
2010 2011 2012 2013 2014
M i l l i o n s
Total Cruise Visitor Spending