vision guided, hyperspectral imaging for standoff trace
TRANSCRIPT
Vision Guided, Hyperspectral Imaging for Standoff
Trace Chemical Detection
This material is based upon work supported by the U.S. Department of Homeland Security, Science and
Technology Directorate under Grant Award 2013-ST-061-ED0001 and through contract # HSHQDC-16-C-
B0027. The views and conclusions contained in this document are those of the authors and should not be
interpreted as necessarily representing the official policies, either expressed or implied, of the U.S.
Department of Homeland Security.
R. Ishmam1, A. Swar1, S. Aeron1, E. Miller1
M. F. Witinski2, C. Pfluegl2, B. Pein2, R. Blanchard2, D. Vakshoori2
1Department of Electrical and Computer Engineering, Tufts University (ALERT Member) 2 Pendar Technologies, LLC (ALERT Associate)
ADSA19 - Rapid Response to an Adapting Adversary
Vision Guided, Hyperspectral Imaging
for Standoff Trace Chemical Detection
2
So What, Who Cares
What space/topic/area is being addressed?
– Detection and identification of chemical residues on luggage at the checkpoint
– As part of APEX Screening at Speed initiative
What problem have you solved?
– Identification of specific “target regions” on luggage; i.e., handles, zippers, etc.
– Detection and classification of chemicals of interest from hyperspectral data cube
How have you solved the problem?
– Modern neural architectures for region identification from camera or video data
– To date: classical statistical processing for identifying chemically anomalous regions
So what? Who cares?
– Promising approach to a very hard problem, real-time standoff trace chemical detection and
mapping, combining singularly strong hardware with state-of-the-art processing
– Strong example of academic/industrial collaboration to address significant problems
3
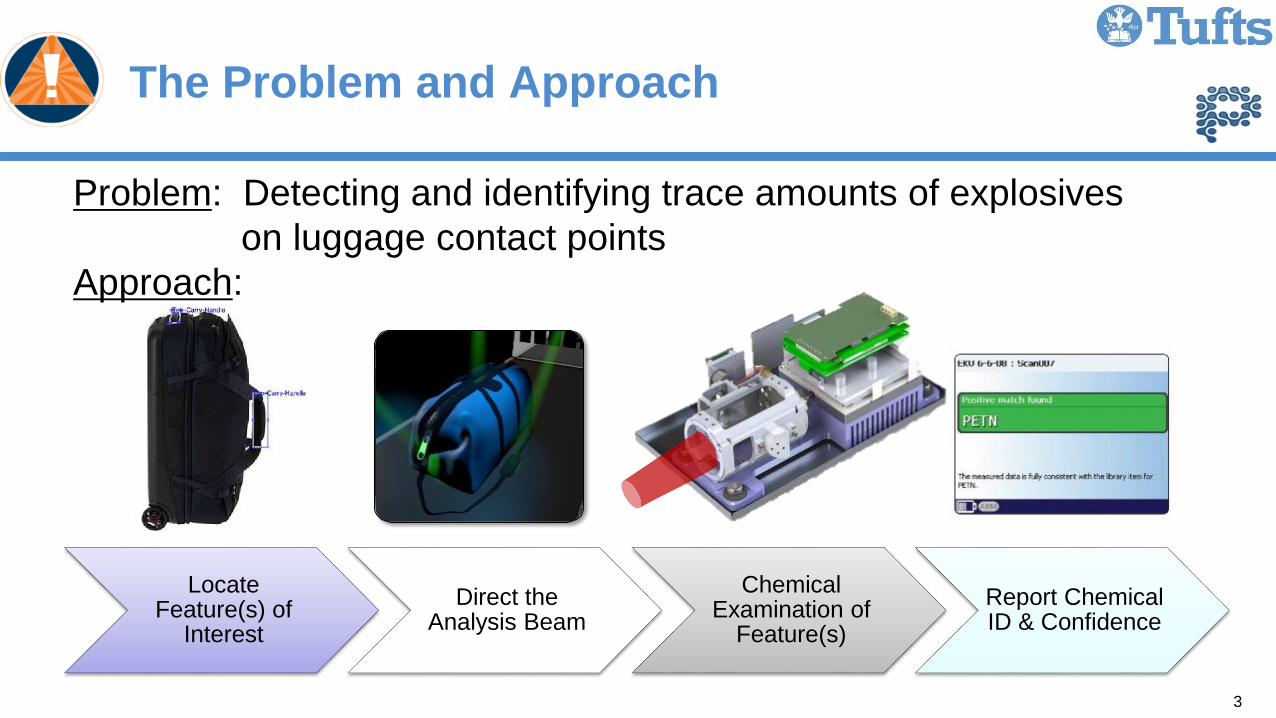
The Problem and Approach
Locate Feature(s) of
Interest
Direct the Analysis Beam
Chemical Examination of
Feature(s)
Report Chemical ID & Confidence
Problem: Detecting and identifying trace amounts of explosives
on luggage contact points
Approach:
4
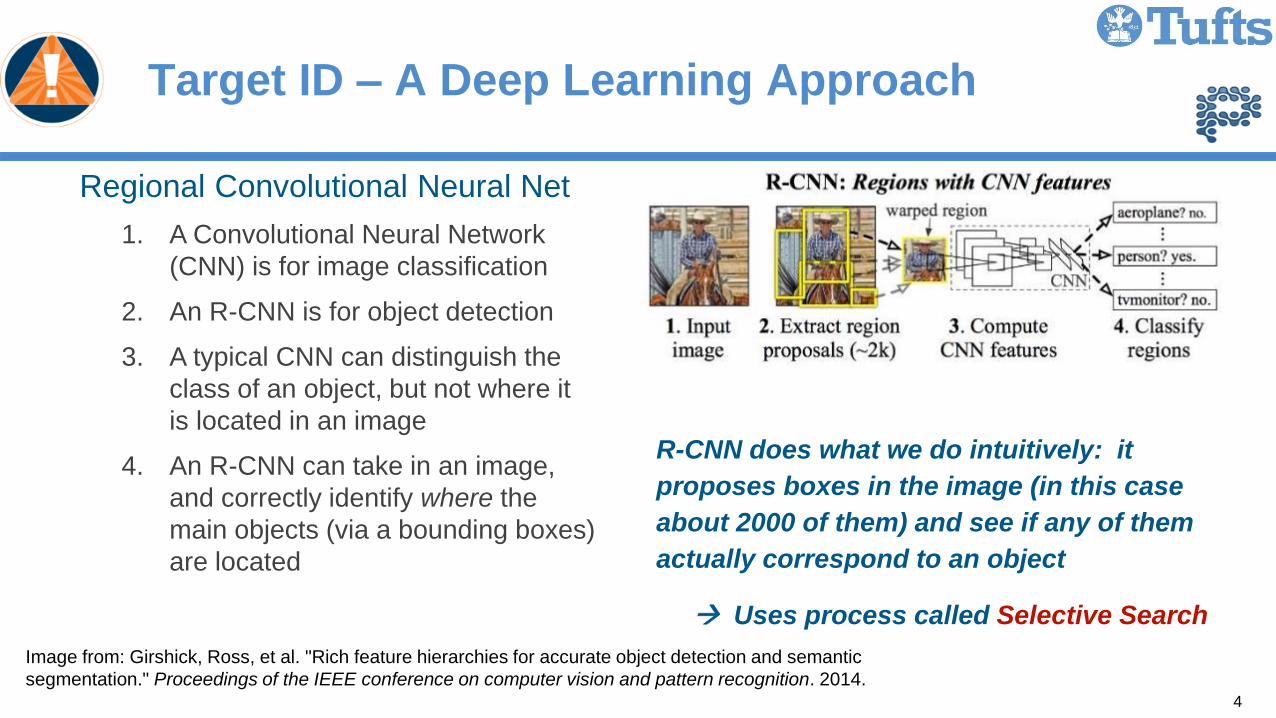
Target ID – A Deep Learning Approach
Regional Convolutional Neural Net
1. A Convolutional Neural Network
(CNN) is for image classification
2. An R-CNN is for object detection
3. A typical CNN can distinguish the
class of an object, but not where it
is located in an image
4. An R-CNN can take in an image,
and correctly identify where the
main objects (via a bounding boxes)
are located
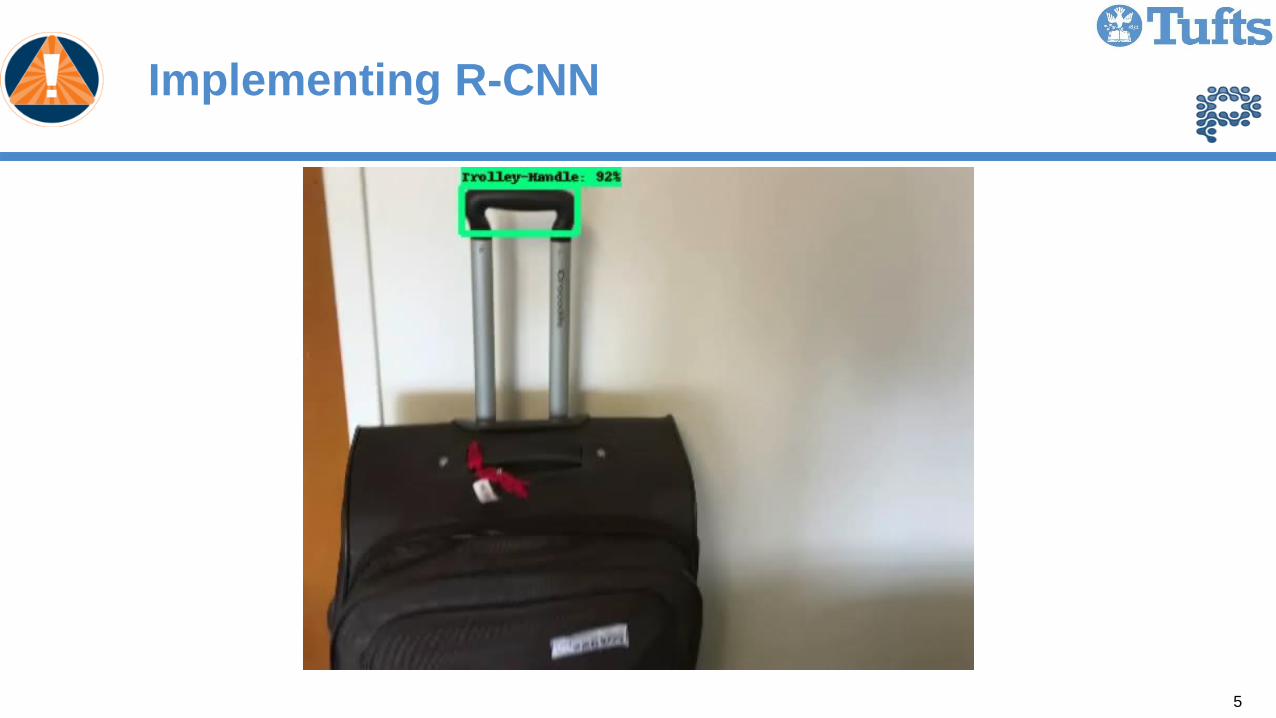
R-CNN does what we do intuitively: it
proposes boxes in the image (in this case
about 2000 of them) and see if any of them
actually correspond to an object
Uses process called Selective Search
Image from: Girshick, Ross, et al. "Rich feature hierarchies for accurate object detection and semantic
segmentation." Proceedings of the IEEE conference on computer vision and pattern recognition. 2014.
5
Implementing R-CNN
6
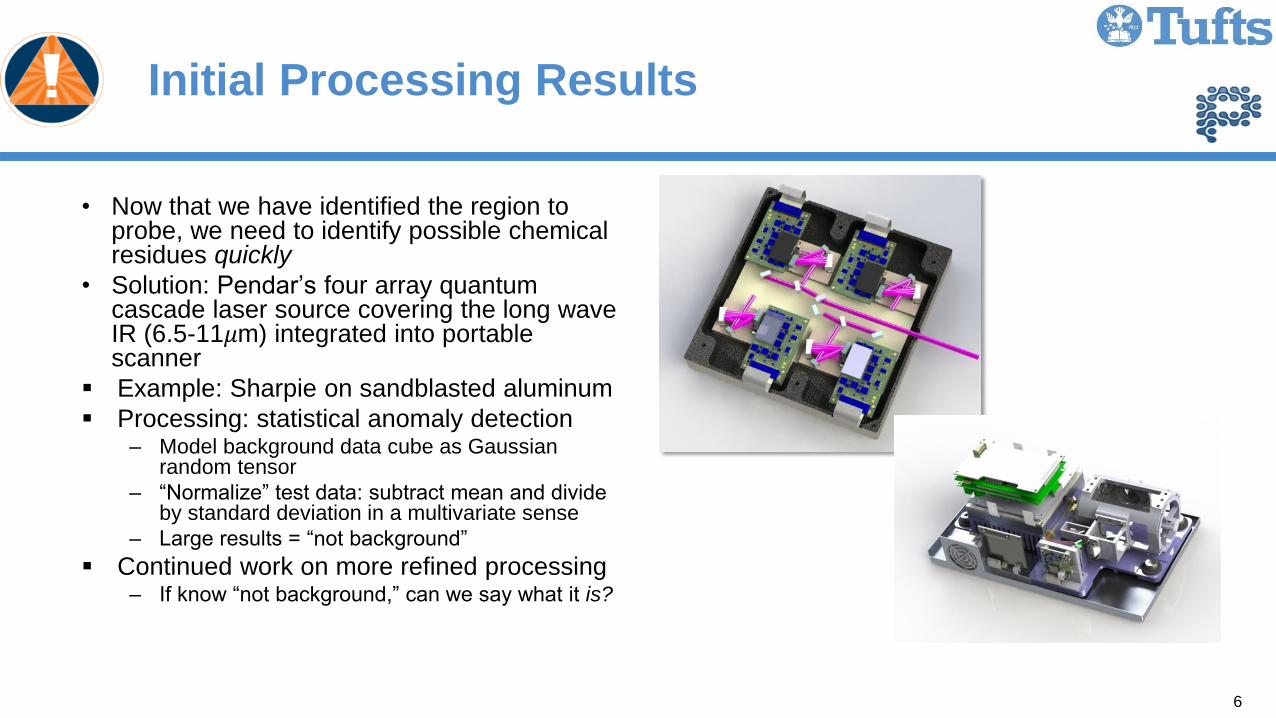
Initial Processing Results
• Now that we have identified the region to probe, we need to identify possible chemical residues quickly
• Solution: Pendar’s four array quantum cascade laser source covering the long wave IR (6.5-11𝜇m) integrated into portable scanner
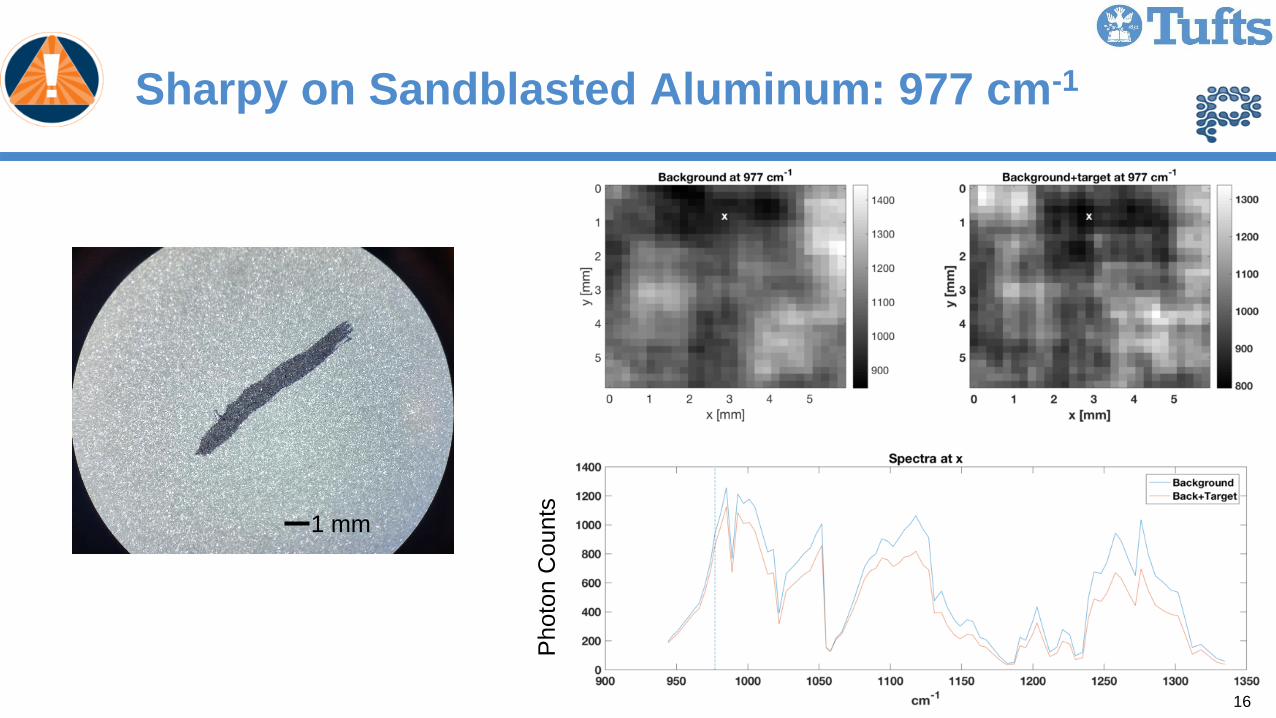
Example: Sharpie on sandblasted aluminum
Processing: statistical anomaly detection – Model background data cube as Gaussian
random tensor
– “Normalize” test data: subtract mean and divide by standard deviation in a multivariate sense
– Large results = “not background”
Continued work on more refined processing – If know “not background,” can we say what it is?
7
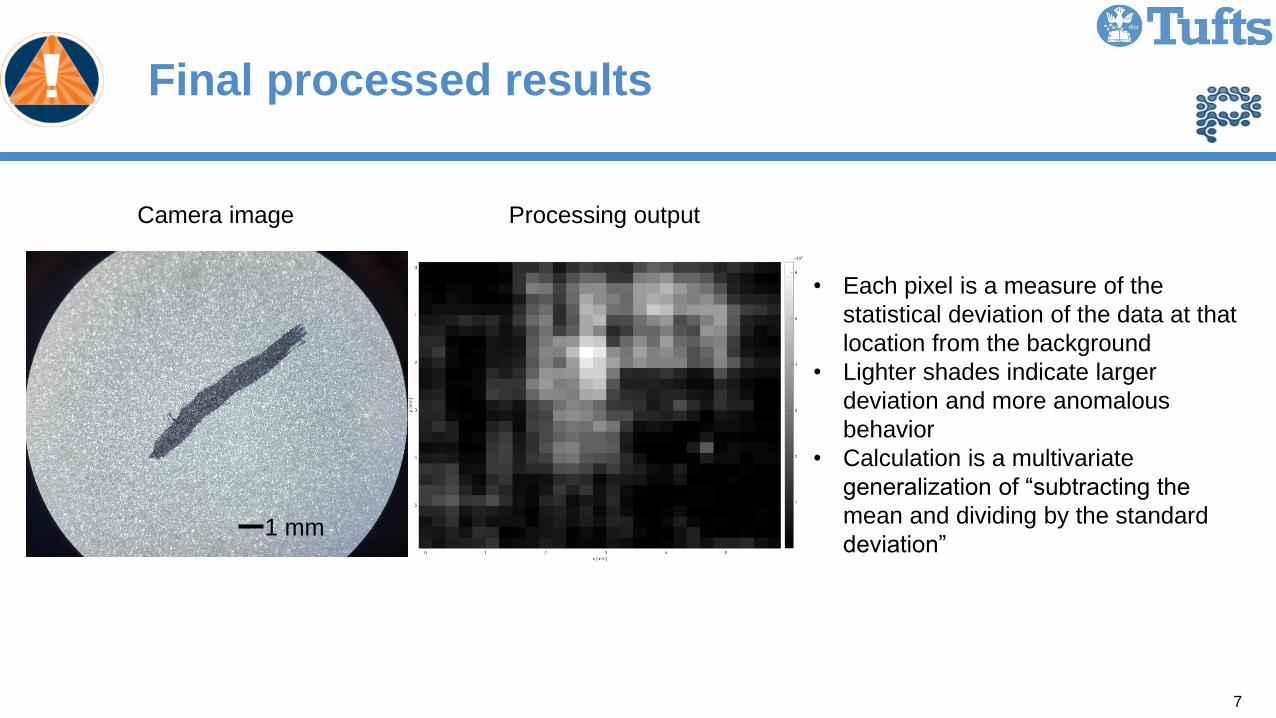
Final processed results
• Each pixel is a measure of the
statistical deviation of the data at that
location from the background
• Lighter shades indicate larger
deviation and more anomalous
behavior
• Calculation is a multivariate
generalization of “subtracting the
mean and dividing by the standard
deviation” 1 mm
Camera image Processing output
8
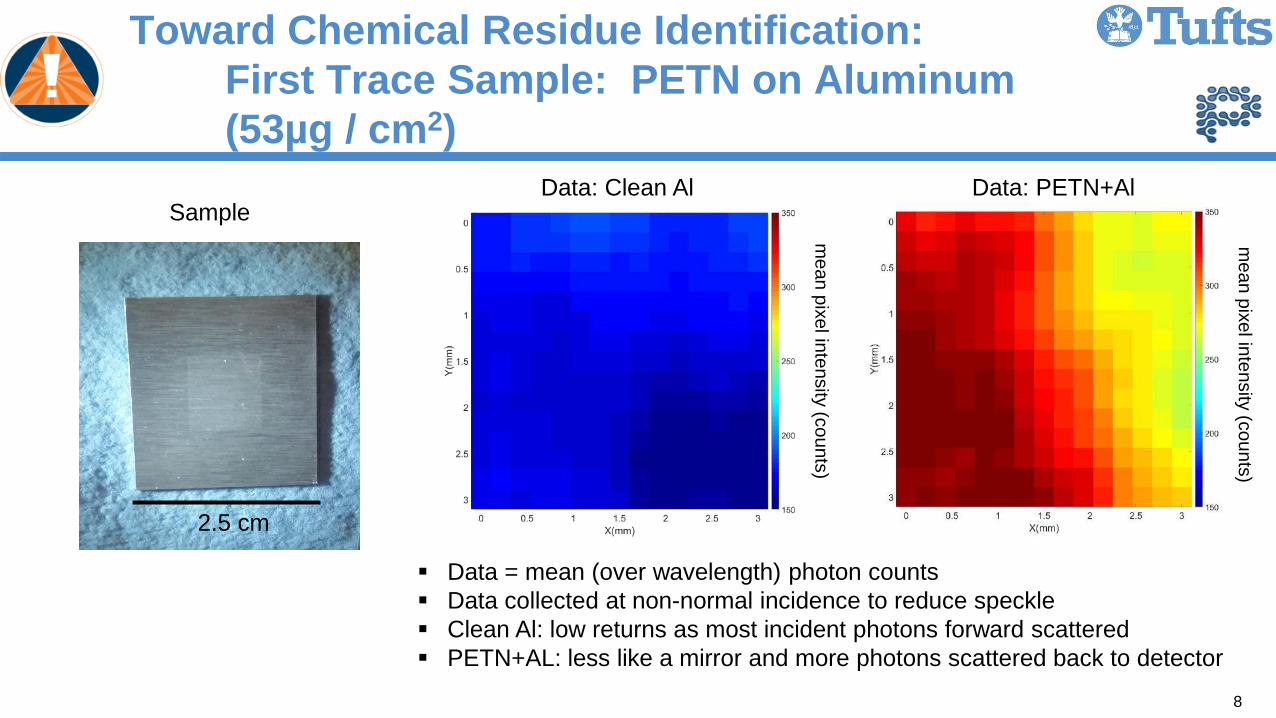
Toward Chemical Residue Identification:
First Trace Sample: PETN on Aluminum
(53µg / cm2)
Data = mean (over wavelength) photon counts
Data collected at non-normal incidence to reduce speckle
Clean Al: low returns as most incident photons forward scattered
PETN+AL: less like a mirror and more photons scattered back to detector
mean p
ixel in
tensity
(counts
)
Data: Clean Al Data: PETN+Al
me
an
pix
el in
ten
sity
(co
un
ts)
Sample
2.5 cm
9
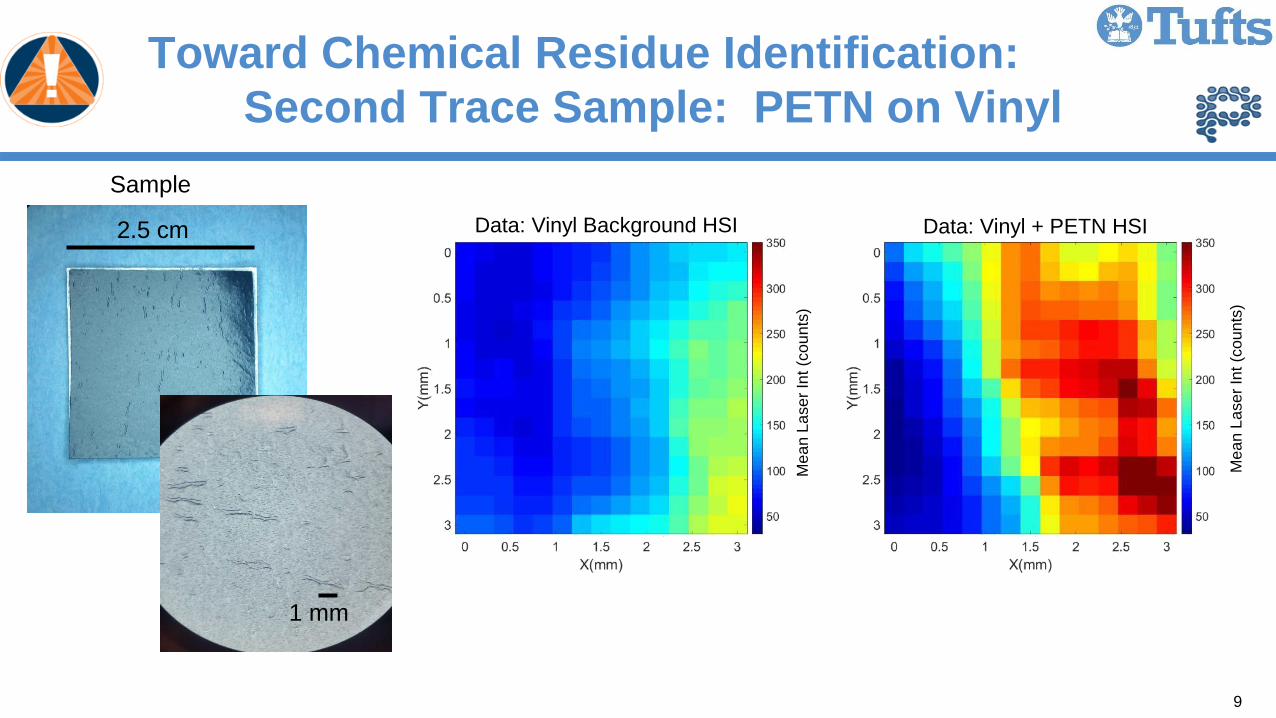
Toward Chemical Residue Identification:
Second Trace Sample: PETN on Vinyl
Me
an
La
se
r In
t (c
ou
nts
)
Me
an
La
se
r In
t (c
ou
nts
)
Data: Vinyl Background HSI Data: Vinyl + PETN HSI
Sample
2.5 cm
1 mm
10
Conclusion
Problem of interest: standoff identification of trace chemicals at the checkpoint
Challenges – Automated identification of regions of interest such as handles and zippers
– Hyperspectral sensor meeting CONOP requirements
– Signal variability caused by physics of light-substrate-target interactions
Accomplishments – Neural approach to region identification
– Quantum Cascade Laser technology, handheld-sized, battery-powered hyperspectral imager
– Initial statistical approach to identification of chemical anomalies
– Preliminary data suggesting sensitivity to chemicals of interest
Ongoing effort – Refinement of algorithms
– From anomalies to identification of specific compounds
– Test, validation, and refinement

11
BACKUP
12
The Team
Eric Miller
Mark Witinski Christian Pfluegl Daryoosh
Vakshoori Romain
Blanchard Brandt Pein
Shuchin Aeron Raiyan Ishmam Ashish Neupane

13
Implementing R-CNN
Create Database Choose
Architecture Train Network Iterate/Test
Database Creation
1.MATLAB script written to
download ~10,000 images
from Zappos.com
2.Database includes: carry-
ons, backpacks, and
suitcases
Architecture
1.Faster R-CNN architecture was used
2.R-CNN uses Selective Search to propose
possible regions of interest and a standard
CNN to classify and adjust them
3.Faster R-CNN accelerates the search
process by using a region proposal network
in conjunction with the Fast R-CNN detector

14
Implementing R-CNN
Create Database Choose
Architecture Train Network Iterate/Test
Training using Tensor Flow
tools from Google
15
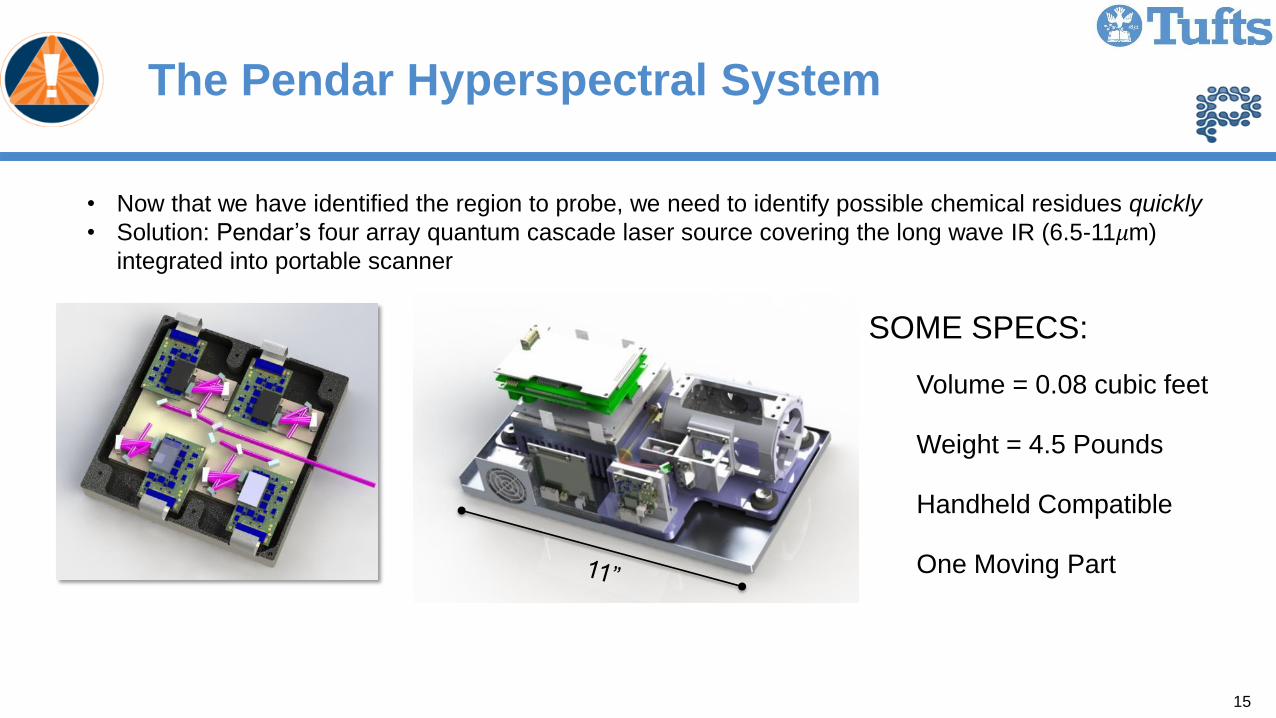
The Pendar Hyperspectral System
• Now that we have identified the region to probe, we need to identify possible chemical residues quickly
• Solution: Pendar’s four array quantum cascade laser source covering the long wave IR (6.5-11𝜇m)
integrated into portable scanner
SOME SPECS:
Volume = 0.08 cubic feet
Weight = 4.5 Pounds
Handheld Compatible
One Moving Part
16
Sharpy on Sandblasted Aluminum: 977 cm-1
Pho
ton C
ounts
1 mm
17
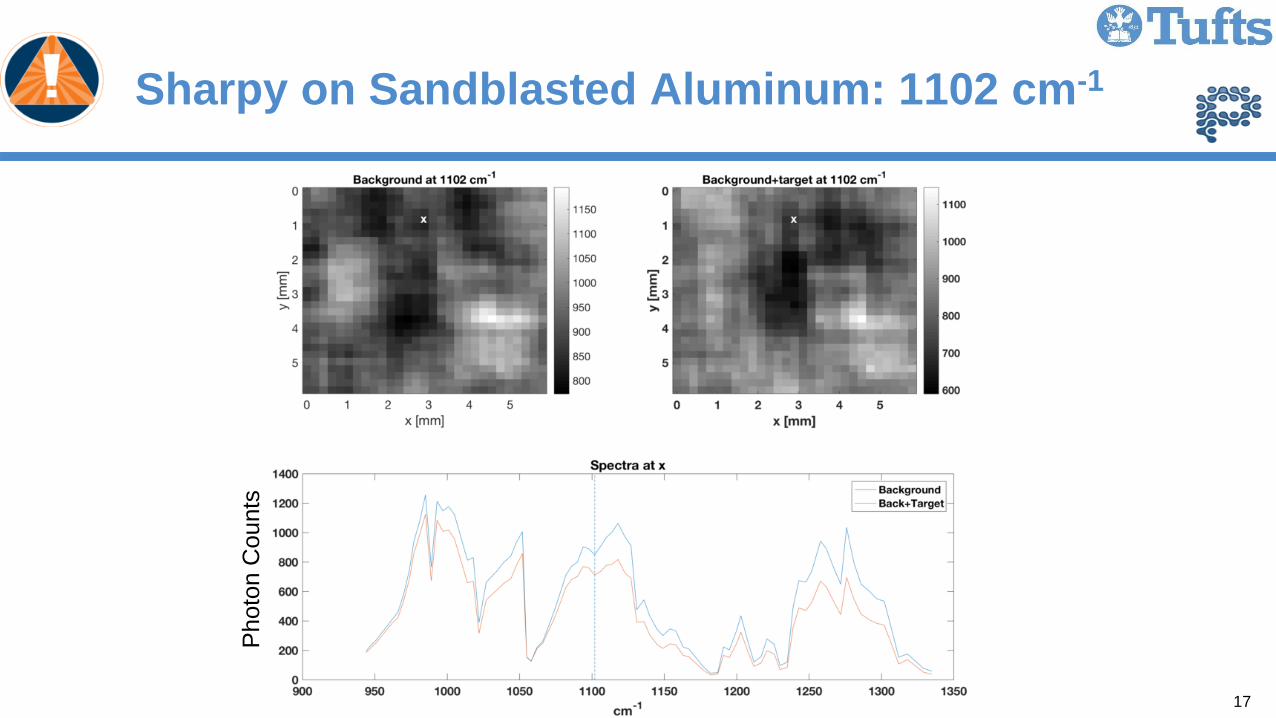
Sharpy on Sandblasted Aluminum: 1102 cm-1
Photo
n C
ounts
18
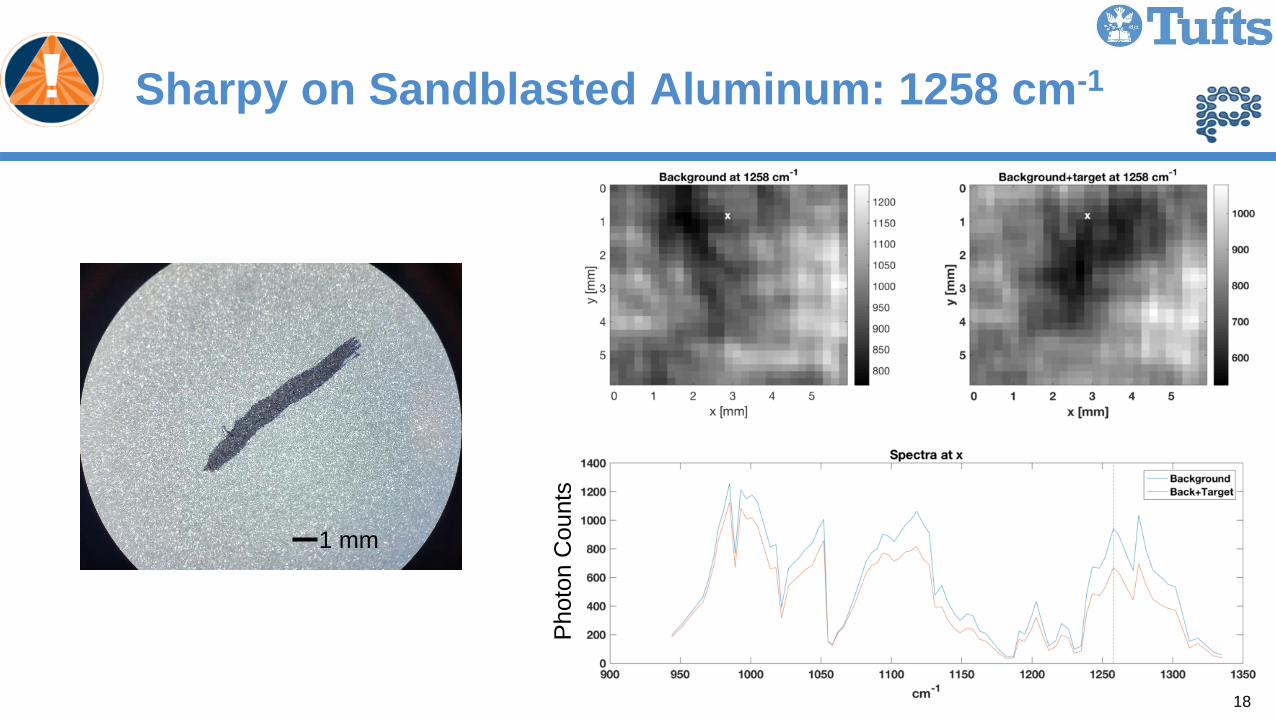
Sharpy on Sandblasted Aluminum: 1258 cm-1
Photo
n C
ounts
1 mm
19
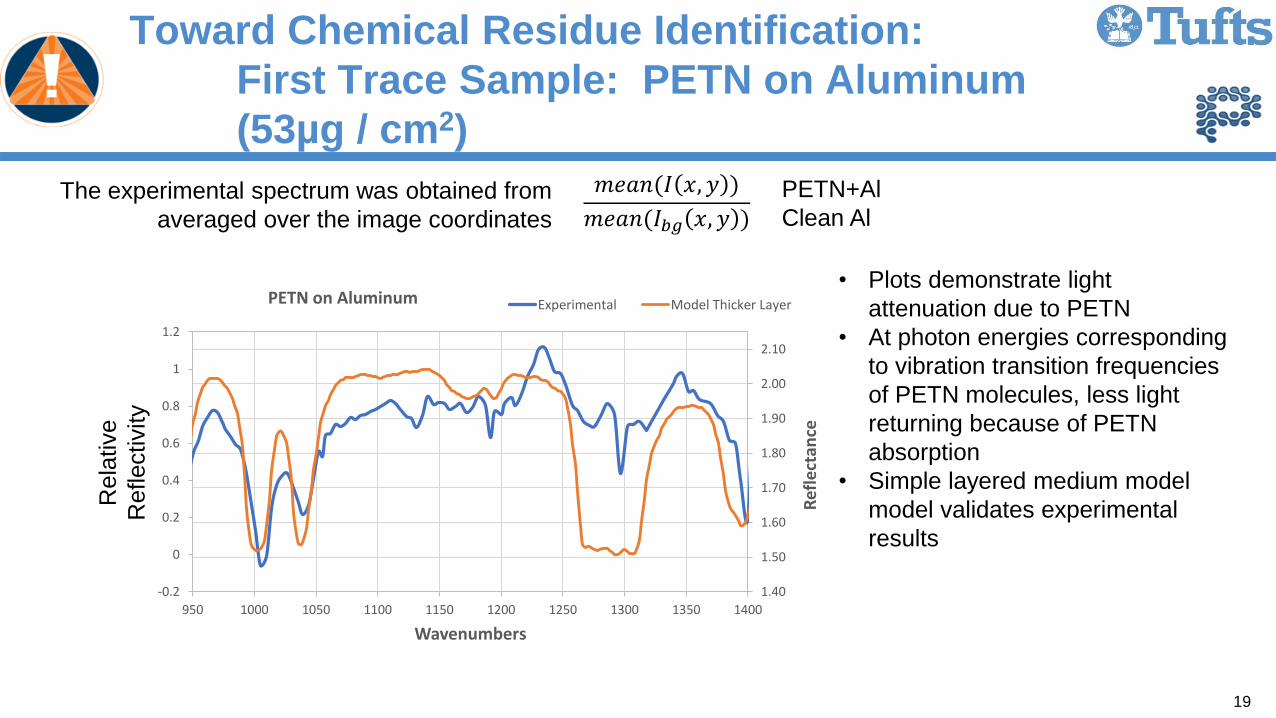
Toward Chemical Residue Identification:
First Trace Sample: PETN on Aluminum
(53µg / cm2)
The experimental spectrum was obtained from
averaged over the image coordinates
𝑚𝑒𝑎𝑛(𝐼 𝑥, 𝑦 )
𝑚𝑒𝑎𝑛(𝐼𝑏𝑔 𝑥, 𝑦 )
PETN+Al
Clean Al
-0.2
0
0.2
0.4
0.6
0.8
1
1.2
950 1000 1050 1100 1150 1200 1250 1300 1350 1400
1.40
1.50
1.60
1.70
1.80
1.90
2.00
2.10
Wavenumbers
Ref
lect
ance
PETN on Aluminum Experimental Model Thicker Layer
Rela
tive
Reflectivity
• Plots demonstrate light
attenuation due to PETN
• At photon energies corresponding
to vibration transition frequencies
of PETN molecules, less light
returning because of PETN
absorption
• Simple layered medium model
model validates experimental
results
20
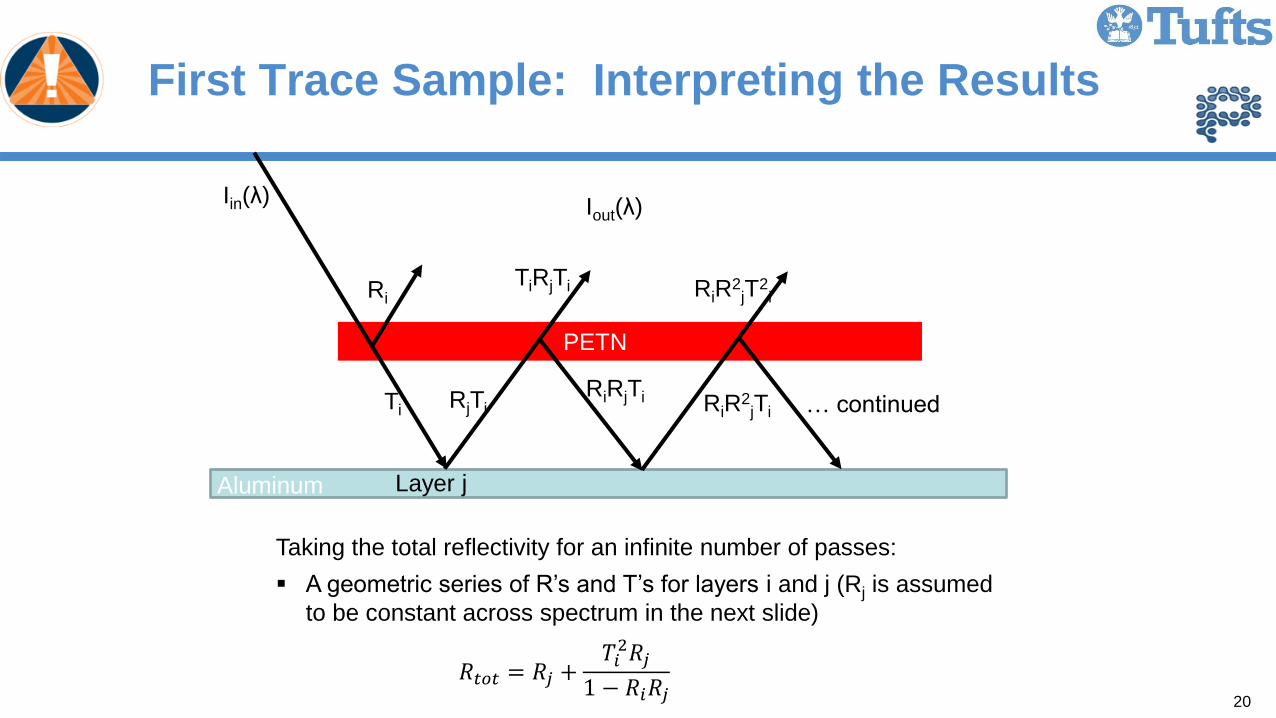
First Trace Sample: Interpreting the Results
Iin(λ) Iout(λ)
Aluminum
PETN
Layer j
Ri
Ti RjTi
TiRjTi
RiRjTi RiR2
jTi
RiR2
jT2
i
… continued
Taking the total reflectivity for an infinite number of passes:
A geometric series of R’s and T’s for layers i and j (Rj is assumed
to be constant across spectrum in the next slide)
𝑅𝑡𝑜𝑡 = 𝑅𝑗 +
𝑇𝑖2𝑅𝑗
1 − 𝑅𝑖𝑅𝑗