visibility, speed, and time headway
TRANSCRIPT

1
1
2
3
4
5
6
This is the Accepted Manuscript of the following article published by Elsevier in Transportation 7
Research Part F: Traffic Psychology and Behaviour [6. July 2019]: 8
Siebert, F. W., & Wallis, F.L. (2019). How speed and visibility influence preferred headway distances 9
in highly automated driving. Transportation Research Part F: Traffic Psychology and Behaviour, 64, 10
485-594. https://doi.org/10.1016/j.trf.2019.06.009 11
This manuscript is not the copy of record and may not exactly replicate the final, authoritative 12
version of the article. 13
This work is licensed under a Creative Commons Attribution-NonCommercial-NoDerivatives 4.0 14
International License, http://creativecommons.org/licenses/by-nc-nd/4.0/. 15
16
17
18
19
20
2
How speed and visibility influence preferred headway distances in highly automated 21
driving 22
23
Felix Wilhelm Sieberta & Fares Lian Wallisb 24
25
Corresponding Author: Felix Wilhelm Siebert 26
27
a Chair of Work, Engineering & Organizational Psychology 28
Department of Psychology and Ergonomics 29
Technische Universität Berlin 30
Marchstraße 12 31
10587 Berlin 32
Germany 33
bChair of Engineering Psychology and Applied Cognitive Research 34
Technische Universität Dresden 35
Dresden 36
Germany 37
E-mail: [email protected] 38
E-mail: [email protected] 39
40
41
42
43
44
45
46
47
48

3
Abstract 49
While the introduction of highly automated vehicles promises lower accident numbers, a main 50
requirement for wide use of these vehicles will be the acceptance by drivers. In this study a 51
crucial variable for the acceptance of highly automated vehicles, the vehicle to vehicle 52
distance expressed in time headway, was researched in a driving simulator. Research has 53
shown that time headway distances, perceived as comfortable in self-driving and assisted 54
driving with adaptive cruise control, remain constant over a range of different speeds. This 55
study aims to test these findings for highly automated driving. Since time headway is 56
perceived visually, the driving situation was varied to investigate the influence of visibility on 57
the subjective comfort of the driver in a highly automated driving situation. In a within-58
subject design, drivers followed a passenger car in clear weather conditions, the same 59
passenger car in fog which occluded parts of the traffic environment, as well as a truck that 60
occluded the lane ahead, also in clear weather condition. Subjective comfort of drivers in each 61
condition was rated with a haptic rating lever. 62
Results suggest that comfortable time headway following distances in highly automated 63
driving are not constant over different speeds, but that these distances decrease with 64
increasing speed. Reduced visibility generally led to a shift in comfortable following distances 65
towards larger headways. These results have implications for the introduction of highly 66
automated vehicles and their time headway adjustments, which will need to be adaptive to 67
speed and visibility in the road environment. 68
69
1. Introduction 70
Past research suggests that time headway is a variable held constant by individual drivers in 71
self-driving (Siebert, Oehl, & Pfister, 2014; Siebert, Oehl, Bersch, & Pfister, 2017; Van 72
Winsum & Heino, 1996), and the individual choice of time headway has been related to the 73
drivers’ awareness of risk and comfort (Lewis-Evans, De Waard, & Brookhuis, 2010). 74
However, there has been comparatively little research on the influence of longitudinal vehicle 75
to vehicle distances of highly automated vehicles on the subjective experience of drivers, with 76
a small number of studies pointing to the importance of time headway adjustments in highly 77
automated driving (Bellem, Schönenberg, Krems, & Schrauf, 2016; De Waard, Van der Hulst, 78
Hoedemaeker, & Brookhuis, 1999). Since drivers will not be able to regulate their following 79
distance in highly automated driving as freely as in self-driving, it is important to understand 80
4
how time headway distances need to be adjusted for highly automated driving, without drivers 81
feeling uncomfortable. Therefore, this study tested how results of constant time headway 82
following from self- and assisted driving translate to highly automated driving. A general 83
preference for constant time headway following in highly automated driving would imply that 84
the complete secession of control by the driver of the car does not alter the effect of preferred 85
constant time headways found in self- and assisted-driving. In turn, this would allow car 86
manufacturers to program highly automated vehicles to follow at a constant time headway 87
over a broad speed range. 88
Another goal of this study was to investigate the influence of different visibility conditions on 89
preferred following distances in highly automated driving. Since time headway is the result of 90
a visual estimation of the vehicle to vehicle distance divided by an estimation of the vehicle 91
speed, the accuracy of an individual’s time headway estimation depends on the visibility 92
condition. Effects of changing following distances under adverse visibility on car following 93
have been studied for self-driving, and we hope to extend this research to highly automated 94
driving. 95
96
1.1 Constant time headway following 97
A large number of studies have found that drivers follow other vehicles with a constant time 98
headway at different speeds, and prefer constant time headway following to non-constant 99
following when presented with a number of time headways at different speeds (Ayres, Li, 100
Schleuning, & Young, 2001; Siebert et al., 2014, 2017; Taieb-Maimon & Shinar, 2001; Van 101
Winsum & Heino, 1996). Siebert et al. (2014, 2017) researched car following preferences for 102
the use of adaptive cruise control and found stable individual time headway preferences. Most 103
preferred headways in self- and assisted-driving are found in the range of one to two seconds 104
in simulated as well as in real-life driving, although preferred time headways of individual 105
drivers differ. In all earlier studies on the relation between the subjective experience of drivers 106
and time headway, drivers either had complete control over the vehicle (Ayres et al., 2001; 107
Taieb-Maimon & Shinar, 2001; Van Winsum & Heino, 1996), or were actively controlling 108
the steering wheel in studies where an adaptive cruise control system was implemented 109
(Siebert et al., 2014, 2017). It is therefore unclear how the complete absence of active control 110
over the vehicle in highly automated driving influences the subjective experience of time 111
headways. Researchers have hypothesized that speed influences the subjective experience of 112

5
drivers in in highly automated driving differently than in self- or assisted driving, due to a 113
lack of immediate controllability of the driving situation (De Vos, Theeuwes, Hoekstra, & 114
Coëmet, 1997; Telpaz, et al., 2018). 115
116
1.2 Driving in fog and behind larger vehicles 117
Van Winsum (1999) postulates in his mathematical model of human car following that a 118
reduced visibility in the driving environment due to fog or rain should in theory lead to an 119
increase in time headway “as an increase of the safety margin to compensate for later 120
detections of decelerations of lead vehicles” (p. 209). However, researchers have found 121
conflicting results for following behavior during fog. While in some studies drivers increase 122
their time headway when visibility is reduced (Van der Hulst, Rothengatter, Meijman, 1998) 123
and their perceived risk is increased (Saffarian, Happee, De Winter, 2012), in other studies 124
drivers follow closer when the visibility is reduced due to fog (Al-Ghamdi, 2007). 125
Researchers have also found interindividual differences when driving in heavy fog (visibility 126
limit of 41 m), with some drivers reducing time headway to within the visibility range of the 127
lead vehicle, and other drivers increasing their time headway, thereby losing sight of the lead 128
vehicle (Broughton, Switzer, and Scott, 2007). 129
Apart from reduced visibility of the driving environment due to weather, forward visibility 130
can also be reduced when following large vehicles such as trucks or busses. For following 131
larger vehicles there is no clear effect on following distances compared to following normal 132
sized vehicles in self-driving. Studies have found increased time headways (Green & Yoo, 133
1999; Wasielewski, 1981), decreased time headways (Brackstone, Waterson, & McDonald, 134
2009; Sayer, Mefford, & Huang, 2000), and increasing as well as decreasing time headways 135
depending on driving speed (Duan, Li, & Salvendy, 2013). Since this study is the first to 136
compare following distances during clear and reduced visibility in highly automated driving, 137
we base our hypotheses on Van Winsum’s mathematical model of human car following 138
(1999), and assume that a decrease in visibility will necessitate and increase in time headway 139
distances. 140
141
142
143

6
1.3 Using a haptic lever for feedback on subjective experience in driving 144
Different subjective variables have been used as dependent variables when participants are 145
asked to rate their subjective experience of different time headways. Earlier studies have 146
shown that subjective variables highly correlate with each other when time headways are 147
rated (Lewis-Evans et al., 2010; Siebert et al., 2014). In this study, comfort was chosen as the 148
dependent variable because it can be described in a positive and negative valence by the 149
words comfort (German: angenehm) and discomfort (German: unangenehm). Due to 150
translation imprecision, the German terms could also be translated as pleasant and unpleasant. 151
Furthermore, a bi-directional haptic lever was used instead of single items in a likert-scale 152
format used by Lewis-Evans et al. (2010) and Siebert et al. (2014). An advantage of this 153
method is the simultaneous evaluation of the vehicle to vehicle distance, compared to a 154
retrospective rating by a subsequent questionnaire. Additionally, the lever allows the 155
participants to focus on the leading vehicle while rating the vehicle to vehicle distance since 156
the lever can be adjusted without looking at it. The type of lever used in this study has been 157
positively evaluated for linearity of ratings (Vehrs, 1986). A study by Charlton, Starkey, 158
Perrone, and Isler (2014) showed that participants are able to concurrently rate the risk of a 159
traffic situation by using a haptic risk-meter, similar in function to the lever used in this study. 160
161
1.4 Goals of this study 162
In this driving simulator study, the forward visibility of drivers in a highly automated vehicle 163
was systematically varied at different speeds. To assess the impact of different time headways 164
and reduced visibility on the subjective experience of the participants, drivers indicated their 165
subjective level of comfort by moving a bi-directional haptic lever with their right hand. 166
Participants were then presented with different vehicle to vehicle distances and the lever 167
position was recorded continuously for these different distances. 168
We expected that in highly automated driving (1) speed does influence the comfort ratings for 169
specific time headways and (2) reduced visibility reduces subjective comfort ratings for 170
distances when compared to the clear visibility condition. 171
172
173
7
2. Method 174
2.1 Participants 175
Thirty-nine participants took part in this study. Due to technical difficulties with the scaling 176
lever, 4 participants were excluded from the analysis. All results reported in this paper are 177
based on the sample of the 35 participants where no technical difficulties occurred. Of these 178
35 participants, 17 were female and 18 were male. Participants had a mean age of M = 22.46 179
years (SD = 5.84). All participants were in possession of a valid driver’s license, that they had 180
acquired an average of M = 4.96 years (SD = 5.86) before the study. On average, participants 181
estimated to drive M = 8820.57 kilometers per year (SD = 18902.6) with a minimum of 20 182
and a maximum of 100000 kilometers. The average accumulated driving experience of the 183
participants was approximately 108,000 kilometers. About one third of the participants owned 184
a car, and more than 50% of the participants used their own or another car at least once a 185
week. Thirty-four participants were right-handed, with one participants being ambidextrous. 186
Participants were recruited from the student body of the Leuphana University Lüneburg as a 187
convenient sample. For their participation, participants were given “study-subject hours” that 188
they have to acquire during their time at the university. 189
190
2.2 Experimental design 191
In this experiment, visibility was varied threefold (clear vs. truck vs. fog), speed was varied 192
threefold (50km/h vs. 100km/h vs. 150km/h), and time headway was varied tenfold (0.5 vs. 193
1.0 vs. 1.25 vs. 1.5 vs. 1.75 vs. 2.0 vs. 2.5 vs. 3.0 vs. 3.5 vs. 4.0). Two extra time headway 194
increments (1.25 and 1.75 seconds) were added to more finely represent typical time 195
headways found in earlier studies (Siebert et al., 2014, 2017). The resulting 90 experimental 196
conditions were grouped in 9 blocks, each block consisting of a randomized order of ten time 197
headways for the same visibility and speed. These 9 blocks were then randomly presented to 198
participants. All participants were presented with the 90 experimental conditions in a within-199
subject design. 200
Each experimental condition lasted 10 seconds, and each experimental block lasted about 120 201
seconds. There were short pauses of about 2-3 seconds between the conditions within each 202
block, and longer pauses of 20-30 seconds between blocks, when a new block was loaded into 203
the driving simulation software. 204

8
2.3 Driving simulator and driving environment 205
The study was conducted at the Leuphana University Lüneburg in a fixed-base driving 206
simulator cabin resembling a Volkswagen Golf 4 GTI with automatic transmission. To 207
simulate the driving environment, SCANeR Studio Driving Simulation Software version 1.4 208
from Oktal was used. The driving environment was projected onto three screens in front of 209
the simulator cabin for a total resolution of 3072x768 pixels with three video projectors. Each 210
single screen had a size of 1.4 x 1.4 meters. The outer screens were positioned at an angle of 211
120° to the center screen. The driver seat was positioned 2 meters from the center screen, 212
resulting in a horizontal field of view of approximately 110° and a vertical field of view of 213
approximately 30°. The physical and simulated eye height of the participants was 1.25m. The 214
simulated car model was a compact car, a Citroën C4. The speedometer of the simulator was 215
inactive during the experiment. Simulation data were saved with a frequency of 20 Hz. 216
Three driving environments were programmed for this study, with each environment 217
representing a road type where a speed of 50, 100, or 150km/h could be expected. The 218
50km/h driving environment resembled an inner city road with one lane in each direction. The 219
100km/h driving environment was modelled after a German rural road, with two lanes in each 220
direction, with opposing lanes divided by a solid line. The 150km/h condition was modelled 221
after a German “Autobahn”, a highway road where the advised speed is 130km/h, but 222
generally there is no enforced speed limit. In this condition there were three lanes in each 223
direction, and opposing traffic was separated by a guard railing. Each environment had only 224
minimal road curvature, no slope, and sparse oncoming traffic. There were no side-streets in 225
any of the road environments and there was no cross traffic by pedestrians. Road side 226
buildings and trees had a minimum distance of 20 meters to the side of the road. The 227
participant’s vehicle and the lead vehicle always drove in the right-most lane. 228
Screenshots of the three visibility conditions are shown in Figure 1. The lead vehicle in the 229
clear condition was a compact car, the lead vehicle in the truck condition was a truck, and the 230
lead vehicle in the fog condition was the same compact car as in the clear condition. The fog 231
in the fog condition was set to a range of 200 m, resulting in light fog with a visibility limit of 232
200 m. 233

9
234
Figure 1. Screenshots of the center projection of the three visibility and three speed conditions 235
for a time headway of 2 seconds: fog & 50km/h (left), truck & 100km/h (middle), clear & 236
150km/h (right). 237
238
2.4 Procedure 239
After participants arrived at the simulator, they filled out a short demographic questionnaire 240
and were then seated in the driver’s seat of the simulator. The experimenter then explained the 241
use of the simulator, and participants’ task in the experiment. The instruction for using the 242
rating lever was as follows (translated from German): 243
“Today you will be shown multiple driving situations in the driving simulator. During these 244
situations, you do not need to control the car, as the car drives by itself. You do not need to 245
steer, brake, or accelerate. Next to you there is a lever that can be moved in two directions, to 246
the front and to the back. You will feel a light resistance that tries to automatically move the 247
lever to a middle position. The lever position at the maximum front position represents 248
“uncomfortable” (German “unangenehm”), the middle lever position represents “neutral” 249
(German “neutral”), and the maximum back position is “comfortable” (German “angenehm”). 250
Now take the lever into your hand and familiarize yourself with it by moving it to the front 251
and the back multiple times. Now try some lever positions without looking at the lever. In the 252
following you will see multiple consecutive driving situations. Please indicate the intensity of 253
your feelings toward the distance to the lead vehicle, by adjusting the lever between 254
“comfortable”, “neutral”, and “uncomfortable” and keeping the lever in this position for the 255
whole driving situation. Please only rate the distance to the lead vehicle and not the other 256
traffic or the driving environment.” 257
A figure with the lever positions with the “comfortable”, “neutral”, and “uncomfortable” 258
position was shown to participants during the explanation of the lever positions. This part of 259
the instruction was followed by a short training in which the experimenter instructed the 260

10
participant to imagine a positive, a negative, and a neutral event and use the lever to rate his 261
or her feelings during this event. The participant was then reminded to focus their gaze on the 262
driving situations and not on the lever and the first block of driving situations was started. 263
264
2.5 Comfort rating lever 265
Participants rated their subjective experience of the vehicle to vehicle distance on a bi-266
directional haptic lever (Figure 2). The lever used in this study is an adapted version of the 267
“Vehrs-Hebel” (engl. “Vehrs-Lever”), developed by Wolfgang Vehrs (1986) for the non-268
verbal rating of stimuli. The self-centering lever-arm protrudes out of the top end of a heavy 269
base that houses the mechanics of the lever. Using an orthogonally placed handle at the top, 270
the lever can be moved within 15 cm, i.e., for 7.5cm from its middle position to each edge of 271
the box. Placed under the driving simulator cabin, the lever arm protrudes out of the middle 272
console in front of the gearstick. Tests on the use of the lever for ratings of subjective 273
experiences by Vehrs (1986) as well as a pretest by the authors of this study suggest that 274
participants are able to express their subjective experience accurately with the help of the 275
lever. The lever position is saved as a percentage value with a frequency of 20 Hz. A 276
“comfortable” lever rating, i.e., a participant pulls the lever as close toward him- or herself as 277
possible, results in a 100% value. A “neutral” lever rating, where the lever is positioned in the 278
middle, results in a 50% value. An “uncomfortable” rating where a participant pushes the 279
lever as far away as possible from him- or herself results in a 0% value (Figure 2). 280
The direction of valence of lever ratings (see 2.4) was chosen for two reasons. First, it is more 281
natural to have “uncomfortable” ratings defined as a lever push away from the body, and 282
“comfortable” ratings as a pulling movement towards the own body (Chen & Bargh, 1999; 283
Solarz, 1960). Second, since time headways for a given speed are represented as gaps between 284
the participant’s vehicle and the lead vehicle, the lever movement could in theory just copy 285
this gap between the two vehicles. In this case, the lever would present the position of the lead 286
vehicle. Defining the lever ratings in a way that prohibits this replication of the lead vehicle 287
position with the lever helps to prevent this effect. Apart from the exact lever position, the 288
median of all lever ratings is an indicator if the majority of participants rates a distance as 289
comfortable (median position > 50%) or uncomfortable (median position < 50%). 290

11
291
Figure 2. Rating lever and scaling direction. 292
293
2.6 Analysis 294
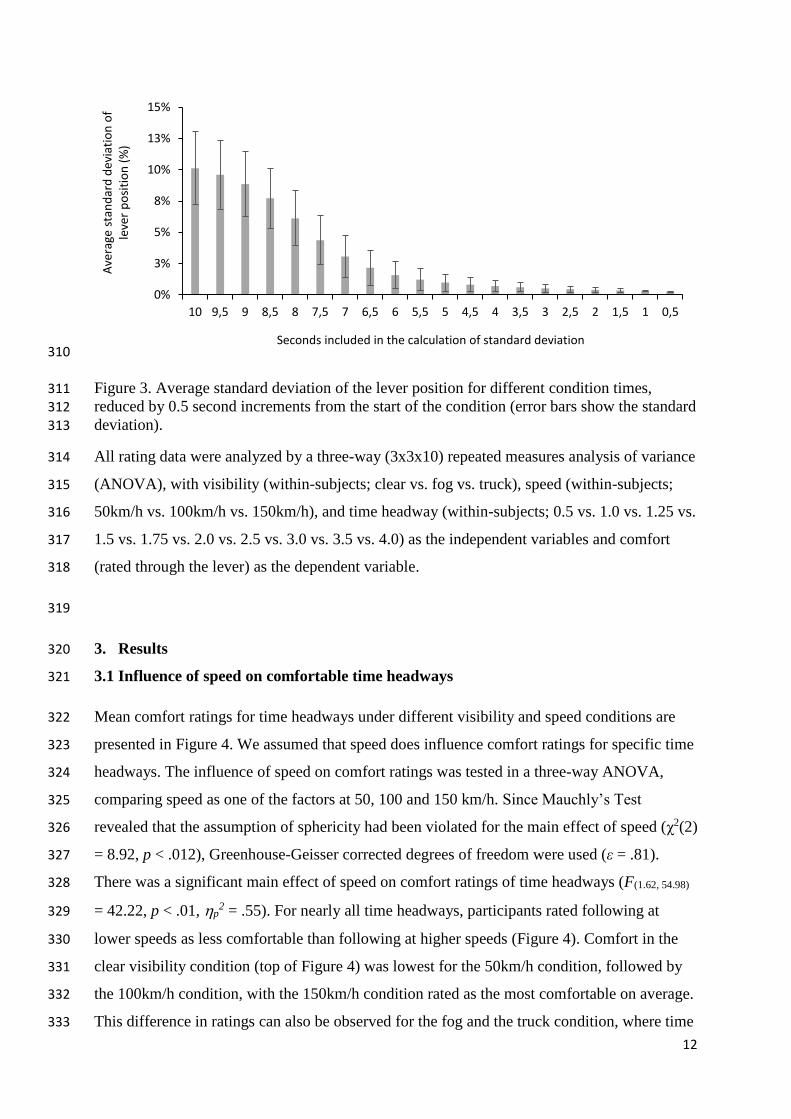
The raw data output of the lever were pre-processed before any calculations were conducted. 295
Since conditions were presented consecutively, the initial lever position of a condition was 296
influenced by the final lever position of the preceding condition. As participants were 297
instructed to maintain a lever position once the lever was at the intended position, we looked 298
at the standard deviation of the lever position, as it indicates movement of the lever. 299
The standard deviation of all ratings in this study was plotted, including each condition and 300
each participant, resulting in one average of standard deviation for 10 seconds of rating. These 301
10 seconds were consecutively shortened in 0.5 second steps starting from the beginning, until 302
there were only the last 0.5 seconds of the condition left. The resulting data (Figure 3) showed 303
that standard deviation in the lever data decreases as the first few seconds of each condition 304
are eliminated. From Figure 3 it can be assumed that the majority of participants require about 305
5 seconds to arrive at the intended lever position. Due to this, the lever data of the first five 306
seconds of each condition was not included in the calculation of the lever position. Only the 307
last 5 seconds (100 data points) of each condition are averaged and used as the comfort rating 308
for a given condition. 309
12
310
Figure 3. Average standard deviation of the lever position for different condition times, 311 reduced by 0.5 second increments from the start of the condition (error bars show the standard 312
deviation). 313
All rating data were analyzed by a three-way (3x3x10) repeated measures analysis of variance 314
(ANOVA), with visibility (within-subjects; clear vs. fog vs. truck), speed (within-subjects; 315
50km/h vs. 100km/h vs. 150km/h), and time headway (within-subjects; 0.5 vs. 1.0 vs. 1.25 vs. 316
1.5 vs. 1.75 vs. 2.0 vs. 2.5 vs. 3.0 vs. 3.5 vs. 4.0) as the independent variables and comfort 317
(rated through the lever) as the dependent variable. 318
319
3. Results 320
3.1 Influence of speed on comfortable time headways 321
Mean comfort ratings for time headways under different visibility and speed conditions are 322
presented in Figure 4. We assumed that speed does influence comfort ratings for specific time 323
headways. The influence of speed on comfort ratings was tested in a three-way ANOVA, 324
comparing speed as one of the factors at 50, 100 and 150 km/h. Since Mauchly’s Test 325
revealed that the assumption of sphericity had been violated for the main effect of speed (χ2(2) 326
= 8.92, p < .012), Greenhouse-Geisser corrected degrees of freedom were used (ε = .81). 327
There was a significant main effect of speed on comfort ratings of time headways (F(1.62, 54.98) 328
= 42.22, p < .01, p2 = .55). For nearly all time headways, participants rated following at 329
lower speeds as less comfortable than following at higher speeds (Figure 4). Comfort in the 330
clear visibility condition (top of Figure 4) was lowest for the 50km/h condition, followed by 331
the 100km/h condition, with the 150km/h condition rated as the most comfortable on average. 332
This difference in ratings can also be observed for the fog and the truck condition, where time 333
0%
3%
5%
8%
10%
13%
15%
10 9,5 9 8,5 8 7,5 7 6,5 6 5,5 5 4,5 4 3,5 3 2,5 2 1,5 1 0,5
Ave
rage
sta
nd
ard
dev
iati
on
of
leve
r p
osi
tio
n (
%)
Seconds included in the calculation of standard deviation

13
headways of lower speeds are rated as less comfortable when compared to the same time 334
headways at higher speeds. Post-hoc tests using Bonferroni correction for multiple 335
comparisons revealed significant differences between comfort ratings of all three speed 336
conditions (all p < .01). 337
338
339
340
341
Figure 4. Mean comfort ratings for different time headways at 50, 100, and 150km/h and three 342
visibility conditions (error bars show the 95% confidence interval). 343
0%
50%
100%
0,5 1 1,25 1,5 1,75 2 2,5 3 3,5 4
Mea
n c
om
fort
rat
ing
clear visibility 50km/h
100km/h
150km/h
0%
50%
100%
0,5 1 1,25 1,5 1,75 2 2,5 3 3,5 4
Mea
n c
om
fort
rat
ing
fog
0%
50%
100%
0,5 1 1,25 1,5 1,75 2 2,5 3 3,5 4
Mea
n c
om
fort
rat
ing
Time headway (s)
truck

14
3.2 Influence of visibility on comfortable time headways 344
We hypothesized that reduced visibility leads to a decrease in comfort ratings of time 345
headways when compared to clear visibility. To test the influence of visibility on comfort 346
ratings, three visibility conditions (clear vs. fog vs. truck) were compared as one factor in a 347
three-way ANOVA. There was a significant main effect of visibility on comfort ratings of 348
time headways (F(2 , 68) = 16.87, p < .01, p2 = .33). Post-hoc tests using Bonferroni correction 349
for multiple comparisons revealed that comfort in the clear visibility condition is significantly 350
higher than in the truck and the fog condition (both p < .01). There was no significant 351
difference between comfort ratings of the truck and the fog condition (p = 1.0). 352
Descriptively, participants rated shorter time headways (< 3 s) in the fog condition as more 353
comfortable than in the truck condition. However, for larger time headways (≥ 3 s) following 354
in fog was rated as less comfortable than following a truck. Furthermore, comfort ratings for 355
the clear and truck visibility conditions increase with increasing time headways, while 356
comfort ratings for the fog condition remain more constant even when time headway 357
increases. Due to this effect, large time headways are less comfortable in a foggy environment 358
than in the truck or clear visibility condition. 359
3.3 Interaction of visibility and speed 360
The ANOVA revealed a significant interaction for the influence of visibility and speed on 361
comfort ratings (F(4, 136) = 2.86, p = .026, p2 = .078). An interaction graph with a shortened y-362
axis for better visibility is plotted in Figure 5. 363
364

15
365
Figure 5. Interaction graph for mean lever ratings for all visibility and speed conditions 366
(please note the shortened y-axis). Error bars show the 95% confidence interval. 367
In Figure 5 the main effect of speed is visible, comfort generally increases with higher speeds. 368
A difference between the clear condition and reduced visibility conditions can also be 369
observed, reduced visibility leads to a decrease in comfort, when compared to the clear 370
visibility condition (all p < .01 after Bonferroni correction for multiple comparisons). 371
Between the two reduced visibility conditions however, an interaction between visibility and 372
speed can be observed descriptively. For the 100 and 150km/h condition, comfort ratings of 373
the truck and fog condition are descriptively similar and do not significantly differ (all 374
p > .05). However, the mean comfort ratings of the truck condition at 50km/h are 375
descriptively lower than ratings for the fog condition of the same speed (Figure 5). 376
Calculating a separate repeated-measure ANOVA for the 50km/h condition however does not 377
show a significant difference between the two reduced visibility conditions, as it just fails to 378
be significant at p = 0.57 after Bonferroni correction for multiple comparisons. 379
380
3.4 Comfortable vs. uncomfortable time headways 381
Through descriptively analyzing the median lever position for an individual experimental 382
condition, it is possible to determine if a majority of participants rated a given time headway 383
as comfortable or uncomfortable. Therefore, median lever ratings can be used to descriptively 384
20%
30%
40%
50%
60%
70%
0 50 100 150
Mea
n c
om
fort
rat
ing
Speed (km/h)
clear
truck
fog

16
quantify the influence of speed and visibility changes on comfort ratings of time headways. 385
Median lever positions for all conditions are presented in Table 1. 386
For example, in the clear condition at 50km/h, the majority of participants rate time headways 387
of 1.5 seconds and higher as comfortable, i.e. the median lever rating for these time headways 388
is higher than 50% indicating comfortable distances (Figure 2). For 100km/h this threshold 389
shifts to 1.25 seconds, i.e. with a speed increase of 50km/h the time headway distance can be 390
reduced by 0.25 seconds without the majority of participants perceiving the distance as 391
uncomfortable. With an additional increase of the speed to 150km/h the time headway 392
distance again can be reduced by 0.25 seconds, resulting in a following distance of 1.0 393
seconds that is still perceived as comfortable by a majority of participants. For reduced 394
visibility conditions, i.e. driving in fog or behind a truck, a similar effect of speed can be 395
found. With increasing speed, time headway following distances can be decreased without the 396
majority of participants perceiving the distances as uncomfortable (see Table 1). 397
For a reduced visibility road environment, it is necessary to increase time headway. At 398
50km/h, time headway needs to be increased by 1 second when a driver is transferring from 399
e.g. a clear visibility environment, to a foggy road environment, or the lead car changes from 400
a passenger car to a truck. At higher speeds, this shift is less pronounced but still present 401
(Table 1). Through Table 1 it is possible to exactly quantify how time headways need to be 402
changed for varying speeds and visibility. 403
404
405
406
407
408
409
410

17
Table 1. Median lever ratings for different time headways (TH), speeds, and visibility 411
conditions. 412
50km/h 100km/h 150km/h
TH clear fog truck
clear fog truck
clear fog truck
0.5 2.8% 1.9% 1.6% 9.2% 6.1% 2.4% 14.8% 12.0% 3.5%
1.0 29.4% 23.9% 17.2% 42.4% 35.1% 25.6% 51.4% 43.8% 38.2%
1.25 38.8% 34.6% 24.6% 51.5% 40.6% 34.7% 56.2% 51.7% 45.9%
1.5 51.0% 42.5% 35.5% 52.0% 44.6% 43.7% 58.6% 60.2% 51.5%
1.75 51.5% 44.6% 39.4% 56.2% 51.4% 51.5% 69.1% 60.4% 52.4%
2.0 52.2% 49.9% 44.6% 58.0% 51.5% 52.4% 66.6% 56.3% 63.4%
2.5 60.3% 52.1% 51.9% 66.1% 57.0% 52.0% 75.7% 59.5% 69.1%
3.0 65.0% 51.6% 57.1% 67.6% 59.4% 62.7% 83.7% 64.5% 74.6%
3.5 66.4% 55.8% 56.9% 75.9% 68.7% 70.9% 88.1% 56.4% 81.4%
4.0 72.5% 61.3% 65.9% 72.8% 68.3% 75.2% 97.0% 62.4% 96.4%
Comfortable ratings with median lever position > 50% in bold.
413
4. Discussion 414
In this study we examined the influence of different time headways on subjective comfort 415
when following another vehicle with different speeds under different visibility conditions in a 416
highly automated vehicle. In our first hypothesis we postulated that speed would influence the 417
subjective comfort for a given time headway. Our data supports this hypothesis, time 418
headways at lower speeds were rated as less comfortable than the same time headways at 419
higher speeds. This result stands in contrast to results of earlier studies on self- and assisted-420
driving, where the subjective experience of a given time headway was not influenced by 421
speed (Siebert et al., 2014, 2017). The assumption of equal comfort for identical time 422
headways can therefore not be extended to highly automated driving. It is important to keep in 423
mind that this study differs from earlier studies on time headway and subjective experience, in 424
18
that the simulated car in this study was highly automated. In contrast to earlier studies (see 425
Section 1.1.), participants did not have any control over the car, which could have a general 426
effect on perceived comfort levels for time headways. If there was a simple effect of control, 427
i.e. that less control (as in highly automated driving) leads to less comfort for a given time 428
headway, this effect would be constant for different speeds. This simple effect would 429
therefore not lead to the results found in this study. Our analysis of median lever ratings 430
reveals that with an increase in speed of 50km/h, time headway distances can be reduced by 431
0.25 seconds without the majority of participants perceiving the distance as uncomfortable. 432
Although the relative validity of driving simulators has been established for speed and vehicle 433
to vehicle distances (Godley, Triggs, & Fildes, 2002; Risto, & Martens, 2014), the exact time 434
headway distances found in this study might not be directly transferable to real life driving. 435
Nonetheless, our results indicate that time headways in highly automated driving will need to 436
be adaptive to speed. 437
In our second hypothesis we postulated that reduced visibility leads to a decrease in comfort 438
ratings when compared to the same distances in the clear visibility condition. In this study, 439
participants rated time headways as significantly less comfortable when visibility was reduced 440
by a truck or due to fog, supporting our hypothesis. Our analysis of median comfort ratings 441
shows that reduced visibility requires an increase in up to 1 second time headway, to maintain 442
a comfortable rating of the distance by a majority of the participants. As discussed earlier, 443
research on self-driving has not found a consistent effect of reduced visibility on car 444
following behavior. The results of this study appear to support findings of increased headway 445
following in reduced visibility conditions, and expand these findings to highly automated 446
driving. 447
While there was no significant difference of comfort ratings between the fog and the truck 448
condition, there was a significant interaction of visibility and speed. Although the effect just 449
failed to be significant in posthoc testing, following a truck was descriptively rated as less 450
comfortable than following in fog in the 50km/h condition. This descriptive effect was not 451
present in the 100 or 150km/h condition. 452
A descriptive effect of fog on comfort ratings of time headways can be observed for larger 453
time headways. While comfort increases with time headways in the truck condition, comfort 454
ratings stay more constant in the fog condition, although time headway distances are 455
increasing. This effect is most pronounced in the 150km/h condition. A possible explanation 456
for this effect is the visibility limit of 200 meters set for the fog condition in this study. 457

19
Although even in the largest time headway conditions of four seconds the lead vehicle is 458
always visible (as the largest distance of the 150km/h condition is 166.66 meters), the lead 459
vehicle is close to the edge of the visible driving environment. While this does not directly 460
influence the following car, participants might anticipate a potential loss of visibility of the 461
lead vehicle. This might be the onset of the effect of close following to keep eye-contact to 462
the lead vehicle, found by Broughton et al. (2007). The influence of the visibility range of 463
driving in fog needs to be researched further to be able to interpret the influence of this effect. 464
This study has multiple limitations. The simulation of driving in a fixed based simulator, and 465
especially the simulation of fog is different from real life driving and reduced visibility in the 466
real-life driving environment. The inconclusive results of earlier studies on the influence of 467
fog on following distances (Broughton, Switzer, and Scott, 2007; Saffarian, Happee, De 468
Winter, 2012; Van der Hulst, Rothengatter, Meijman, 1998) could in part be attributed to 469
differences in the display of fog in driving simulators. The results therefore have to be 470
confirmed in real life driving conditions. Although the truck condition was introduced to 471
restrict the forward visibility of participants, the truck model differed from vehicle models in 472
the fog and clear condition due to its larger size. Vehicle size has been found to influence 473
following behaviour (Brackstone, Waterson, & McDonald, 2009; Duan, Li, & Salvendy, 2013; 474
Green & Yoo, 1999; Sayer, Mefford, & Huang, 2000). As such, effects found in the truck 475
condition cannot be solely attributed to the obstructed forward view, but could further be 476
influenced by the larger vehicle size. Future experiments should take this into account, e.g. by 477
using a lead vehicle model of normal size with opaque windows. 478
The highly automated vehicle that was simulated in this study was considerably simplified. 479
The car drove with a constant speed of 50, 100, or 150km/h, kept the lane perfectly, and never 480
overtook another vehicle. Future studies need to simulate highly automated vehicles that are 481
closer to their real life counterparts in their behavior. The exposure to highly automated 482
driving was very limited for most participants, it can be assumed that none of them had used a 483
highly automated vehicle in the past. It seems advisable to give participants more time to 484
familiarize themselves with the behavior of the simulated car as drivers need time to develop 485
a mental model of a car’s automation (Beggiato, Pereira, Petzoldt, Krems, 2015). Apart from 486
little experience with highly automated driving, participants in this study were relatively 487
young, with a mean age of only 22.5 years, resulting in a relatively short driving experience. 488
Hence, future studies should aim to have a more representative sample. 489
20
In contrast to earlier studies on the topic of time headway and vehicle automation (Siebert et 490
al., 2014, 2017) there was no self-driving condition in this study, where the driver has 491
complete control over the vehicle. Implementing a self-driving condition in this study within 492
the experimental framework of comfort rated on a scaling lever would not have been possible, 493
since drivers need both hands to control the vehicle in self-driving, i.e. drivers cannot rate 494
their comfort through the lever while driving. Since it is unclear how comfort of time 495
headways in self- and highly automated driving relate to each other, future studies should 496
include a self-driving condition, even if it uses a different methodology for the collection of 497
comfort data. Further, despite earlier studies on the use of haptic rating devices (Charlton, 498
Starkey, Perrone, & Isler, 2014; Vehrs, 1986) for the subjective experience of study 499
participants, the novel use of a rating lever in traffic psychological experiments necessitates 500
the replication of our results with established methodological approaches. Despite these 501
limitations, this study provides a basis for the further investigation of additional variables that 502
influence following distances in highly automated driving. 503
In summary, the results of this study add to the existing literature on car following and are a 504
first step in expanding the field of research on car following from self-driving to highly 505
automated driving. Speed influenced the comfort ratings of time headways, a finding that 506
contrasts with results found in self and assisted driving. Reduced visibility led to a decrease in 507
comfort. Results indicate that time headways in highly automated driving will need to be 508
adaptively adjusted to speed and the road environment. Future studies need to investigate 509
these effects in real life driving, and investigate the influence of differences in visibility range 510
during fog in more detail. 511
512
513
514
515
516
517
518
519

21
References 520
Al-Ghamdi, A. S. (2007). Experimental evaluation of fog warning system. Accident Analysis 521
& Prevention, 39(6), 1065-1072. 522
Ayres, T. J., Li, L., Schleuning, D., & Young, D. (2001). Preferred time-headway of highway 523
drivers. In Intelligent Transportation Systems, 2001. Proceedings. 2001 IEEE (pp. 826-829). 524
IEEE. 525
Beggiato, M., Pereira, M., Petzoldt, T., & Krems, J. (2015). Learning and development of 526
trust, acceptance and the mental model of ACC. A longitudinal on-road study. Transportation 527
research part F: traffic psychology and behaviour, 35, 75-84. 528
Bellem, H., Schönenberg, T., Krems, J. F., & Schrauf, M. (2016). Objective metrics of 529
comfort: developing a driving style for highly automated vehicles. Transportation research 530
part F: traffic psychology and behaviour, 41, 45-54. 531
Brackstone, M., Waterson, B., & McDonald, M. (2009). Determinants of following headway 532
in congested traffic. Transportation Research Part F: Traffic Psychology and 533
Behaviour, 12(2), 131-142. 534
Broughton, K. L., Switzer, F., & Scott, D. (2007). Car following decisions under three 535
visibility conditions and two speeds tested with a driving simulator. Accident Analysis & 536
Prevention, 39(1), 106-116. 537
Charlton, S. G., Starkey, N. J., Perrone, J. A., & Isler, R. B. (2014). What’s the risk? A 538
comparison of actual and perceived driving risk. Transportation research part F: traffic 539
psychology and behaviour, 25, 50-64. 540
Chen, M., & Bargh, J. A. (1999). Consequences of automatic evaluation: Immediate 541
behavioral predispositions to approach or avoid the stimulus. Personality and social 542
psychology bulletin, 25(2), 215-224. 543
De Vos, A. P., Theeuwes, J., Hoekstra, W., & Coëmet, M. J. (1997). Behavioral aspects of 544
automatic vehicle guidance: Relationship between headway and driver 545
comfort. Transportation research record, 1573(1), 17-22. 546
22
De Waard, D., van der Hulst, M., Hoedemaeker, M., & Brookhuis, K. A. (1999). Driver 547
behavior in an emergency situation in the Automated Highway System. Transportation 548
human factors, 1(1), 67-82. 549
Duan, J., Li, Z., & Salvendy, G. (2013). Risk illusions in car following: Is a smaller headway 550
always perceived as more dangerous?. Safety science, 53, 25-33. 551
Godley, S. T., Triggs, T. J., & Fildes, B. N. (2002). Driving simulator validation for speed 552
research. Accident analysis & prevention, 34(5), 589-600. 553
Green, P., & Yoo, H. (1999). Driver behavior while following cars, trucks, and buses (No. 554
UMTRI-99-14). 555
Lewis-Evans, B., De Waard, D., & Brookhuis, K. A. (2010). That's close enough—A 556
threshold effect of time headway on the experience of risk, task difficulty, effort, and 557
comfort. Accident Analysis & Prevention, 42(6), 1926-1933. 558
Risto, M., & Martens, M. H. (2014). Driver headway choice: A comparison between driving 559
simulator and real-road driving. Transportation research part F: traffic psychology and 560
behaviour, 25, 1-9. 561
Saffarian, M., Happee, R., & De Winter, J. (2012). Why do drivers maintain short headways 562
in fog? A driving-simulator study evaluating feeling of risk and lateral control during 563
automated and manual car following. Ergonomics, 55(9), 971-985. 564
Sayer, J. R., Mefford, M. L., & Huang, R. (2000). The effect of lead-vehicle size on driver 565
following behavior. Ann Arbor, 1001, 48109-2150. 566
Siebert, F. W., Oehl, M., Bersch, F., & Pfister, H. R. (2017). The exact determination of 567
subjective risk and comfort thresholds in car following. Transportation research part F: 568
traffic psychology and behaviour, 46, 1-13. 569
Siebert, F. W., Oehl, M., & Pfister, H. R. (2014). The influence of time headway on 570
subjective driver states in adaptive cruise control. Transportation research part F: traffic 571
psychology and behaviour, 25, 65-73. 572
Solarz, A. K. (1960). Latency of instrumental responses as a function of compatibility with 573
the meaning of eliciting verbal signs. Journal of experimental psychology, 59(4), 239. 574

23
Taieb-Maimon, M., & Shinar, D. (2001). Minimum and comfortable driving headways: 575
Reality versus perception. Human Factors: The Journal of the Human Factors and 576
Ergonomics Society, 43(1), 159-172. 577
Telpaz, A., Baltaxe, M., Hecht, R. M., Cohen-Lazry, G., Degani, A., & Kamhi, G. (2018). An 578
Approach for Measurement of Passenger Comfort: Real-Time Classification based on In-579
Cabin and Exterior Data. In 2018 21st International Conference on Intelligent Transportation 580
Systems (ITSC) (pp. 223-229). IEEE. 581
Van der Hulst, M., Rothengatter, T., & Meijman, T. (1998). Strategic adaptations to lack of 582
preview in driving. Transportation research part F: traffic psychology and behaviour, 1(1), 583
59-75. 584
Van Winsum, W. & Heino, A. (1996). Choice of time-headway in car-following and the role 585
of time-to-collision information in braking. Ergonomics, 39(4), 579-592. 586
Van Winsum, W. (1999). The human element in car following models. Transportation 587
research part F: traffic psychology and behaviour, 2(4), 207-211. 588
Vehrs, W. (1986). Nicht-verbale Erlebnisbeschreibung. Göttingen: Hogrefe. 589
Wasielewski, P. (1981). The effect of car size on headways in freely flowing freeway traffic. 590
Transportation Science, 15(4), 364-378. 591