visco-elasticity of aramid fibres
TRANSCRIPT

Visco-elasticity of aramid fibres
C. J. Burgoyne Æ K. G. N. C. Alwis
Received: 29 December 2006 / Accepted: 30 September 2008 / Published online: 24 October 2008
� Springer Science+Business Media, LLC 2008
Abstract Tests are described to measure the creep and
relaxation response of aramid fibres with the specific aim
of determining whether the visco-elastic response is linear
or non-linear. Hitherto, creep and relaxation tests have
been carried out in different circumstances and at different
loads, which has led to disagreement about the type of
response that aramid fibres exhibit. Tests are carried out at
stresses between 10% and 80% of the short-term strength
of the fibres under controlled temperature and humidity
conditions, and it is shown that both creep and relaxation
are non-linear at stresses below 40% of the breaking load,
but both are linear at stresses above this level. This result
explains the contradictions in earlier work and also indi-
cates that there may be two different processes underway in
the visco-elasticity of aramids.
Background
Aramid fibres are being considered for use in many
structural engineering applications [1]. Many of these
applications would require the fibres to be under long-term
or permanent loads, and uncertainty about their visco-
elastic properties is one of the principal reasons why
industry is unwilling to commit to their use. The uncer-
tainty is reflected in several ways, and the present work is
part of a larger study [2] to remove that uncertainty. The
main concern is with the stress-rupture behaviour, in which
the fibres creep to failure, and with the uncertainty caused
by the need to extrapolate to structural lifetimes (typically
100 years) from tests that are carried out over a short time-
scale (frequently hours, but even in the best circumstances,
less than a year).
Detractors can also point out that the literature is not
even consistent on whether the fibres are linearly or non-
linearly visco-elastic. There have been several studies that
have not resolved the matter, which are complicated by the
fact that there are different versions of aramid fibres which
are available in different forms.
Aramid fibres are available in various grades and from
several manufacturers. Kevlar (made by Du Pont) and
Twaron (originally made by Akzo, now part of Teijin) are
very similar chemically although they may differ slightly in
their physical structure. The various grades are believed to
differ only in a heat treatment imposed during manufac-
ture. It is reasonable to suppose that a similar visco-elastic
mechanism will apply to the different grades, although the
creep rates can be expected to differ. Technora, another
aramid fibre manufactured by Teijin, and Vectran, manu-
factured by Kuraray, differ chemically so they may behave
differently. All the results presented in this paper were
obtained from a single batch of Kevlar 49 yarns.
Guimaraes and Burgoyne [3] tested parallel-lay ropes
made from Kevlar 49 yarns and concluded that aramid
fibres possess a linear visco-elastic behaviour. However,
Walton and Majumdar [4], who tested Kevlar 49 fibre and
fibre-cement composites, showed that the visco-elastic
behaviour of aramid fibres is non-linear. From stress-
relaxation tests, Ko [5], who tested Kevlar 49 yarns and,
Amaniampong [6] and Chambers [7], both of whom tested
parallel-lay ropes of Kevlar 49 yarns, claimed that the
C. J. Burgoyne (&)
Department of Engineering, University of Cambridge,
Trumpington St, Cambridge CB2 1PZ, UK
e-mail: [email protected]
K. G. N. C. Alwis
Highways and Transportation Dept, Atkins, Woodcote Grove,
Ashley Road, Epsom, Surrey KT18 5BW, UK
e-mail: [email protected]
123
J Mater Sci (2008) 43:7091–7101
DOI 10.1007/s10853-008-3032-0

visco-elastic behaviour is non-linear, but Schaefgen [8]
showed that aramids exhibit linear behaviour. Amaniam-
pong’s study [9] was largely concerned with bundle theory;
he concluded that creep-rupture results (and by extension,
creep itself) on bundles and individual fibres could be
compared if the loads were normalised by the short-term
strength of bundles of different sizes.
The most comprehensive study has been carried out by
Northolt. In early studies [10] he showed that the response to
tensile load was made up of a linear elastic response plus an
irreversible rotation of crystallites. He tested various grades
of aramid fibres made by Akzo, with static moduli ranging
from 55 GPa to 105 GPa. This work was extended and
corrected [11] in a model that assumed that the fibrils were
made up largely of zig-zag crystals whose orientation sig-
nificantly affected the modulus. This work was however
concerned only with the short-term response. Later, Northolt
and Baltussen [12, 13] extended the model to deal with visco-
elasticity. They concluded that there are two phenomena that
contribute to the visco-elastic behaviour; one is a linear
visco-elastic shear deformation, and an increased tendency
of the fibrils to align with the loading direction, which relates
to the analysis performed in the earlier model.
The work of Northolt and his collaborators was used as
the basis for the work by Chailleux and Davies [14]. They
modelled Twaron 1000 fibres as a non-linear visco-elastic
material with both viscous and frictional damping com-
ponents. It should be noted that most of their results were
obtained at stresses below 1 GPa, which is at the lower end
of the range of stresses considered here.
One of the problems with many of these studies is that
the results were often obtained as by-products of other
work. Most of the creep testing was carried out as part of
studies of stress-rupture. In order to obtain failures in rea-
sonable time, the stress levels were high, typically above
70% of the short-term strength of the fibres. In contrast,
relaxation tests were carried to determine the losses of force
that would be expected at the sort of loads to which fibres
are permanently exposed. In many rope applications there is
considerable uncertainty about the loads, so large nominal
safety factors are used. Thus, these tests have often been
performed at low loads, almost always below 50% of the
break-load of the fibres. Thus, there is almost no data that
has been obtained in similar circumstances for both creep
and relaxation at comparable stress ranges.
The lack of overlap would not necessarily be a problem
if it was certain that no change in material behaviour
occurred at different stress levels. There is, however, evi-
dence that aramid yarns stiffen at about 50% of their short-
term strength (Fig. 1 [7]). Thus, most creep test data have
been obtained at stress levels above this load, while the
stress-relaxation test data have been obtained below this
load.
The aim of the present study was thus to obtain both
creep and relaxation data at a full range of loads. Fibres
from the same batch would be clamped in the same jaws, in
the same environmental conditions and at similar load
levels. The results would then be comparable.
Linear and non-linear visco-elasticity
The behaviour of a visco-elastic material under general
loading is complex, but two states are normally identified
for laboratory testing: creep and stress-relaxation. Creep is
the change in length of a specimen over time under a
constant stress. Relaxation is the variation of stress under a
constant strain. If creep strain is plotted against applied
stress after a fixed time, and the results are linear and pass
through zero, the material is said to behave in a linearly
visco-elastic manner. Similarly, stress-relaxation is linear if
a plot of stress-reduction against initial strain after a fixed
time gives a straight line which passes through zero.
Visco-elasticity is best explained by state theory (see,
for example [15]); this assumes that there exists a unique
relationship between stress r, creep strain ec and time t for
a given material (Fig. 2):
ec ¼ / r; tð Þ ð1Þ
If the variables are separable, / may be represented as
the product of two functions:
Fig. 1 Stress–strain response for Kevlar 49 yarns reported by
Chambers [7]
7092 J Mater Sci (2008) 43:7091–7101
123

ec ¼ / tð Þf rð Þ ð2Þ
If the material is linearly visco-elastic, f(r) = r, and
Eq. 2 becomes:
ec ¼ /c tð Þ r ð3Þ
where /c tð Þ is the creep compliance and r is the stress.
Sections drawn through the surface of Fig. 2 at constant
stress level produce creep curves, while sections taken at
constant strain produce relaxation curves. An important
cross-plot is the stress-strain curve at a specific time t0,
which is referred to as the isochronous curve and can be
obtained from Eq. 3.
A linearly visco-elastic material has a linear isochronous
curve which can be used as a simple check on this property,
but such a plot is difficult to produce without a very full set
of data. As an alternative, the ratio of /c ¼ ec=r� �
vs. rshould give a straight line parallel to the r axis if the
material is linearly visco-elastic. The latter method is used
in this analysis (Fig. 3).
Materials whose strain at any state is a function of both
time and stress are defined as non-linear visco-elastic
materials. Their isochronous curves are not straight.
Visco-elasticity using creep curves
To discuss visco-elastic behaviour, it is necessary to:
• Carry out tests to obtain creep curves at different stress
levels,
• Analyse the results to obtain creep coefficient values
corresponding to different creep curves at a specified
time, t0,
• Plot /c t0ð Þ vs. r to check whether the material is
linearly visco-elastic.
Visco-elasticity using stress-relaxation curves
Isochronous curves for stress-relaxation can also be found
in an analogous way. According to the state theory, a
material is said to be linear if the following ratio is stress
independent [15]:
rr tð Þr0
¼ k tð Þ ð4Þ
where r0 the initial stress; rr the stress relaxation; k the
stress relaxation coefficient.
Amaniampong [6] showed that the stress-relaxation data
of aramid ropes with 1.5 and 3 tonne breaking loads could
be modelled with a logarithmic time function:
ri tð Þ ¼ r0i þ dilogðtÞ ð5Þ
where i = 1, 2, 3…,etc. for curves at different initial strain
conditions; r is the total stress.
Equation 5 can be rearranged to give the relaxation
coefficient k.
ki tð Þ ¼ ri tð Þ � r0i
r0i¼ di
r0ilogðtÞ ð6Þ
If k varies with initial stress the material is non-linearly
visco-elastic, whereas if it is constant then the material is
linearly visco-elastic.
Fig. 2 Generic 3-D Stress–strain–time response
Fig. 3 Interdependence of 2D stress–strain–time curves
J Mater Sci (2008) 43:7091–7101 7093
123

Chambers [7] obtained a relationship for the 100 h stress
loss as a function of the initial stress for aramid ropes with
a 60 tonne nominal breaking load (NBL):
r 100ð Þ ¼ r0i þ 1:82þ 4:03� 102r0i ð7Þ
(where his stresses were expressed as percentages of the
NBL).
This can be rearranged to give:
ki 100ð Þ ¼ r 100ð Þ � r0i
r0i¼ r0i
1:82þ 4:03� 102 ð8Þ
The stress-relaxation coefficient is stress dependent, so
aramids possess non-linear visco-elastic behaviour. This
result was confirmed by Amaniampong [6]. Schaefgen [8],
on the other hand, showed that aramid fibres possess linear
visco-elastic behaviour. The tests described below were
designed to resolve this apparent discrepancy.
Test procedures
Yarns tested
All the tests described here were carried out on 1000 fila-
ment Kevlar 49 yarns of 2426 decitex. The yarns were
supplied with a nominal 80 turns/m twist which was
believed to give the optimum strength for these fibres.
Table 1 shows the properties of the Kevlar 49 yarns used in
this experiment. Twelve yarn specimens were tested in an
Instron testing machine and the average breaking load
(ABL) found to be 445 N with a Standard Deviation
of 8.22 N. All subsequent loads will be described as a
percentage of this figure.
Environmental chamber
The tests were all carried out in an environmental room,
originally built to keep concrete specimens in controlled
conditions. The environmental equipment could raise and
lower the humidity, but only raise the temperature. It was
thus decided to keep the humidity at 65% RH while the
temperature was held at 25 �C, slightly higher than the
ambient room temperature. The room was well inside the
main laboratory building, and had thick walls, so occa-
sional higher temperatures outside did not cause
temperature excursions in the room. The original intention
had been to carry out a single set of tests lasting approxi-
mately 2 years, but problems with the environmental
equipment and data-logging equipment meant that several
series of tests had to be carried out. The results presented
here are thus for a larger number of tests of shorter dura-
tion, and for those tests which were not affected by the
equipment failures.
Creep experiment
The yarns were subjected to constant loads, applied by
dead-weights. Strains were measured over a long period by
specially made strain gauges connected to a data logger.
Several rigs were mounted on stiff frames, which were
bolted to the wall. The yarns were mounted vertically, with
the top clamp fixed and the bottom one free to slide within
guides, but loosely restrained against twist. The load was
applied by concrete weights on a threaded rod, acting via a
5:1 lever arrangement. Minor adjustments were made to the
load by adding small bags of sand and the total weight
checked by measuring the weight before the test. To avoid
shock loading on the yarn, the weight was initially sup-
ported on a small scissors-jack which could be lowered
slowly by turning a handle. The load was applied over a
period of a few seconds, but precise loading rates could not
be controlled. Figure 4 shows an overall view of the
experimental set-up.
Yarn clamps
Because a large number of long-term tests would be carried
out, it was not feasible to use standard yarn-testing jaws.
Instead, a clamping arrangement has been developed in
which the test yarn passes 7/8 turn around a bar of 20 mm
diameter, and is then clamped between plates (Fig. 5).
These clamps have been used for all the tension, creep, and
relaxation tests reported here, and also for creep-rupture
tests that are reported elsewhere [2, 16, 17]. The clamps
were designed so that they can be moved from the creep rig
to a tensile testing machine without disturbing the fibre, in
order to allow strength-retention tests to be performed.
Experience has shown that failure does not normally occur
at the jaws. Any tests where failure did not occur in the
free-length of the yarn were discarded.
An extensive set of tests has also been undertaken to
determine the jaw effect, although they are not relevant
here since the strain (in the creep tests) or force (in the
relaxation tests) were measured directly.
Table 1 Properties of Kevlar 49 yarns
Material property Values
Cross-sectional area of a yarn 0.16853 9 10-6 m2
Average breaking load 445 Na
Average length of a yarn specimen 400–500 mm
Average strain capacity (literature) 1.5–2%
Young’s modulus (literature) 120 GPa
a Average of 12 tests
7094 J Mater Sci (2008) 43:7091–7101
123

Procedures have been developed to minimise the han-
dling of the yarns between unwinding from the bobbin and
the start of the test. Such handling cannot be eliminated
entirely and must remain a source of error, but the same
procedures were used for all tests described here, so the
results should be self-consistent.
Strain gauges
It was necessary to measure the strains in each yarn and to
test many yarns at the same time to cover a range of load
conditions. A simple mechanical strain gauge was used
which could be mass produced. Each strain gauge was
made with two strips of spring steel combined together to
form a ring. Small holding clips were used to attach the
gauge to the yarn specimen with small strips of rubber at
the contact point to minimise stress concentrations. Expe-
rience has shown that these gauges are reliable and do not
cause failure to take place at the clip positions in tension
tests. Two pairs of electrical resistance strain gauges were
attached to the steel; one on the inside and one on the
outside of the ring at points remote from the clips. They
were connected together to form a full bridge circuit that
could be interrogated using a standard data logger. The
construction method meant that each gauge differed
slightly, so every gauge was calibrated using a jig. The
self-weight of the gauge is around 1 N and the spring force
at maximum extension is a fraction of a Newton. Thus, the
additional load that would be applied to a yarn specimen
could be neglected.
Data acquisition system for the creep test
A data logger was set up to measure the strain in each yarn,
together with the temperature and the humidity in the
environmental chamber. While the load was being applied
the data were recorded every second; this was later
extended to 2 min intervals, and after 1 day the interval
was extended to 20 min. If a specimen began to creep more
rapidly, indicating possible imminent failure, the data
logging interval was automatically reduced to 1 s until
failure occurred. The data were subsequently downloaded
for analysis.
Test procedure
In the first set of tests, the load was applied after the strain
gauge was fixed and initialised to zero. However, the yarn
was observed to be slack when the gauge was being fixed.
To overcome this initial slack, a small unknown load was
applied by partially releasing the scissors jack before the
strain gauge was fixed and initialised to zero. The initial
Fig. 4 Creep test rig showing sprung–steel strain gauge (top), lever
arrangement (centre), and concrete dead weight (bottom), here
supported on scissors jack before loading
Fig. 5 Typical yarn clamp used for all tests
J Mater Sci (2008) 43:7091–7101 7095
123
strains were subsequently adjusted to enable the different
test results to be compared.
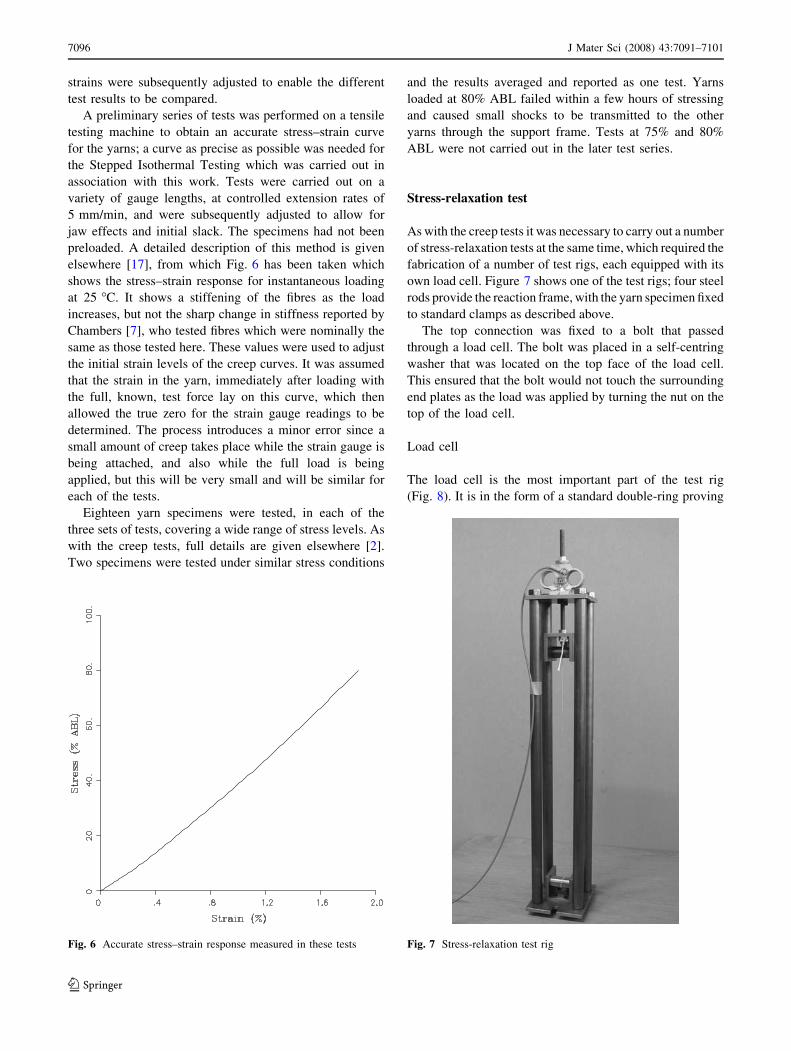
A preliminary series of tests was performed on a tensile
testing machine to obtain an accurate stress–strain curve
for the yarns; a curve as precise as possible was needed for
the Stepped Isothermal Testing which was carried out in
association with this work. Tests were carried out on a
variety of gauge lengths, at controlled extension rates of
5 mm/min, and were subsequently adjusted to allow for
jaw effects and initial slack. The specimens had not been
preloaded. A detailed description of this method is given
elsewhere [17], from which Fig. 6 has been taken which
shows the stress–strain response for instantaneous loading
at 25 �C. It shows a stiffening of the fibres as the load
increases, but not the sharp change in stiffness reported by
Chambers [7], who tested fibres which were nominally the
same as those tested here. These values were used to adjust
the initial strain levels of the creep curves. It was assumed
that the strain in the yarn, immediately after loading with
the full, known, test force lay on this curve, which then
allowed the true zero for the strain gauge readings to be
determined. The process introduces a minor error since a
small amount of creep takes place while the strain gauge is
being attached, and also while the full load is being
applied, but this will be very small and will be similar for
each of the tests.
Eighteen yarn specimens were tested, in each of the
three sets of tests, covering a wide range of stress levels. As
with the creep tests, full details are given elsewhere [2].
Two specimens were tested under similar stress conditions
and the results averaged and reported as one test. Yarns
loaded at 80% ABL failed within a few hours of stressing
and caused small shocks to be transmitted to the other
yarns through the support frame. Tests at 75% and 80%
ABL were not carried out in the later test series.
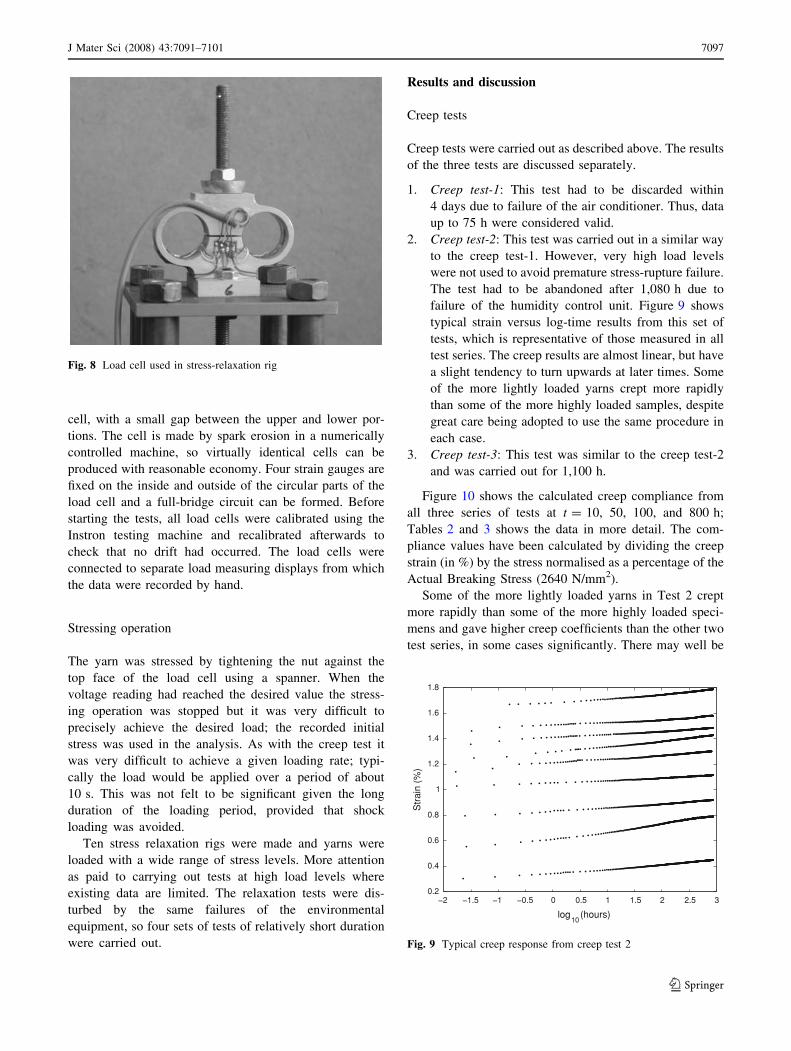
Stress-relaxation test
As with the creep tests it was necessary to carry out a number
of stress-relaxation tests at the same time, which required the
fabrication of a number of test rigs, each equipped with its
own load cell. Figure 7 shows one of the test rigs; four steel
rods provide the reaction frame, with the yarn specimen fixed
to standard clamps as described above.
The top connection was fixed to a bolt that passed
through a load cell. The bolt was placed in a self-centring
washer that was located on the top face of the load cell.
This ensured that the bolt would not touch the surrounding
end plates as the load was applied by turning the nut on the
top of the load cell.
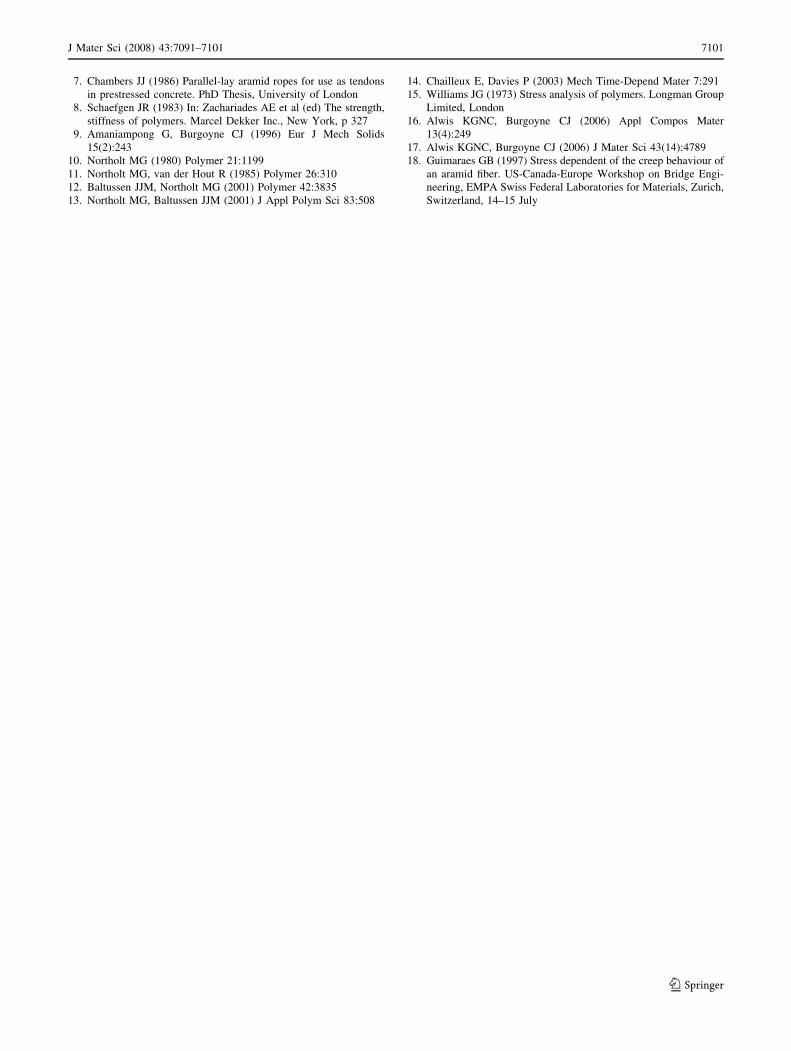
Load cell
The load cell is the most important part of the test rig
(Fig. 8). It is in the form of a standard double-ring proving
Fig. 6 Accurate stress–strain response measured in these tests Fig. 7 Stress-relaxation test rig
7096 J Mater Sci (2008) 43:7091–7101
123
cell, with a small gap between the upper and lower por-
tions. The cell is made by spark erosion in a numerically
controlled machine, so virtually identical cells can be
produced with reasonable economy. Four strain gauges are
fixed on the inside and outside of the circular parts of the
load cell and a full-bridge circuit can be formed. Before
starting the tests, all load cells were calibrated using the
Instron testing machine and recalibrated afterwards to
check that no drift had occurred. The load cells were
connected to separate load measuring displays from which
the data were recorded by hand.
Stressing operation
The yarn was stressed by tightening the nut against the
top face of the load cell using a spanner. When the
voltage reading had reached the desired value the stress-
ing operation was stopped but it was very difficult to
precisely achieve the desired load; the recorded initial
stress was used in the analysis. As with the creep test it
was very difficult to achieve a given loading rate; typi-
cally the load would be applied over a period of about
10 s. This was not felt to be significant given the long
duration of the loading period, provided that shock
loading was avoided.
Ten stress relaxation rigs were made and yarns were
loaded with a wide range of stress levels. More attention
as paid to carrying out tests at high load levels where
existing data are limited. The relaxation tests were dis-
turbed by the same failures of the environmental
equipment, so four sets of tests of relatively short duration
were carried out.
Results and discussion
Creep tests
Creep tests were carried out as described above. The results
of the three tests are discussed separately.
1. Creep test-1: This test had to be discarded within
4 days due to failure of the air conditioner. Thus, data
up to 75 h were considered valid.
2. Creep test-2: This test was carried out in a similar way
to the creep test-1. However, very high load levels
were not used to avoid premature stress-rupture failure.
The test had to be abandoned after 1,080 h due to
failure of the humidity control unit. Figure 9 shows
typical strain versus log-time results from this set of
tests, which is representative of those measured in all
test series. The creep results are almost linear, but have
a slight tendency to turn upwards at later times. Some
of the more lightly loaded yarns crept more rapidly
than some of the more highly loaded samples, despite
great care being adopted to use the same procedure in
each case.
3. Creep test-3: This test was similar to the creep test-2
and was carried out for 1,100 h.
Figure 10 shows the calculated creep compliance from
all three series of tests at t = 10, 50, 100, and 800 h;
Tables 2 and 3 shows the data in more detail. The com-
pliance values have been calculated by dividing the creep
strain (in %) by the stress normalised as a percentage of the
Actual Breaking Stress (2640 N/mm2).
Some of the more lightly loaded yarns in Test 2 crept
more rapidly than some of the more highly loaded speci-
mens and gave higher creep coefficients than the other two
test series, in some cases significantly. There may well be
Fig. 8 Load cell used in stress-relaxation rig
−2 −1.5 −1 −0.5 0 0.5 1 1.5 2 2.5 30.2
0.4
0.6
0.8
1
1.2
1.4
1.6
1.8
log10
(hours)
Str
ain
(%)
Fig. 9 Typical creep response from creep test 2
J Mater Sci (2008) 43:7091–7101 7097
123

some inherent material variability but the exact value of the
compliance relies on the skill of the tester in fixing the
yarns with the same degree of slack into the jaws, and
also depends on the exact value chosen for the initial strain,
which has to be done immediately after the loading
when the creep is taking place most rapidly. These tests
were carried out by the same person, using the same
equipment, on yarns taken from the same reel, and the
results processed in the same way.
Despite the variability, the figure clearly shows that
there is a significant change in creep coefficient at a stress
of about 40% ABL. Above this stress level there is very
little change in the creep coefficient, which implies a lin-
early visco-elastic material, while below that level the
response is non-linearly visco-elastic. It is also noticeable
that there is much more variation at low stress levels than
at high stress levels.
A similar analysis was carried out by Guimaraes [18] on
Kevlar 49 yarns. His particular concern was to measure the
creep on yarns and ropes, and to investigate the possibility
that yarns which had been preloaded, even for a short time,
suffered significantly less creep. Each specimen was tested
at constant temperature (25 ± 2.5 �C) and humidity
(75 ± 7%), for a period of 72 h, a time period sufficient to
study primary creep and the beginning of secondary creep.
Five different stress levels were considered (10, 20, 30, 40,
and 50% ABL). Six specimens were tested at each stress
level. Guimaraes plotted a creep coefficient against the
percentage of the initial stress level of the yarn, together
with data of Kevlar ropes which had been tested earlier [3]
(Fig. 11). He concluded that the creep coefficient is parallel
to the x-axis above 50% ABL, which conforms to the linear
visco-elastic behaviour of aramid. This result is in agree-
ment with the present analysis, but it must be noted that
Guimaraes’ high-stress results were obtained from long-
duration tests on parallel-lay ropes (which may be subject
to bundle effects), while his lower stress results were
obtained from short-duration tests on yarns. He found no
significant effect due to pre-loading of the yarns.
The creep coefficient plotted by Guimaraes is the creep
strain divided by the initial strain, divided again by log10(t),
where t is measured in seconds. His best fit solution for the
creep coefficient was given as:
Fig. 10 Creep compliance against initial stress for all tests
Table 2 Creep Compliance (Creep strain (%)/Stress (% ABL))
Load Level
(%ABL)
Test No. Test duration (hours)
10 50 100 800
10 2 0.00652 0.00909 0.01034 0.01432
3 0.00453 0.00539 0.00570 0.00799
20 2 0.00459 0.00641 0.00731 0.00977
3 0.00226 0.00292 0.00311 0.00441
30 2 0.00251 0.00277 0.00312 0.00427
3 0.00160 0.00206 0.00222 0.00295
40 1 0.00150 0.00150 – –
2 0.00128 0.00169 0.00196 0.00288
3 0.00098 0.00132 0.00140 0.00206
45 1 0.00050 0.00080 – –
2 0.00200 0.00227 0.00247 0.00316
3 0.00138 0.00167 0.00175 0.00214
50 1 0.00120 0.00160 – –
2 0.00120 0.00158 0.00190 0.00275
3 0.00121 0.00139 0.00147 0.00183
55 1 0.00060 0.00090 – –
2 0.00132 0.00159 0.00168 0.00218
3 0.00081 0.00098 0.00104 0.00131
60 1 0.00080 0.00110 – –
2 0.00054 0.00085 0.00103 0.00148
3 0.00048 0.00102 0.00111 0.00138
65 1 0.00060 0.00070 – –
70 1 0.00110 0.00150 – –
2 0.00122 0.00166 0.00185 0.00253
3 0.00075 0.00105 0.00117 0.00170
75 1 0.00090 0.00120 – –
80 1 0.00090 0.00090 – –
7098 J Mater Sci (2008) 43:7091–7101
123

be0
¼ 0:0041rru
� ��0:7
þ0:0106rru
� �3" #
ð9Þ
This expression allows Guimaraes’ best fit line to be
compared with the values obtained here; his predictions
(GBG) are shown for 10 h and 800 h on Fig. 10. It will
be seen that they underestimate the creep compliance
shown in the present tests, but show a similar variation
between linear response at high loads and non-linear
response at low loads.
Stress-relaxation tests
Stress-relaxation tests were carried out as described above.
The results of the four tests are presented separately.
• Test-01: This test series lasted for about 1,600 h.
Figure 12 shows the stress-relaxation curve for the test
at 50% ABL. During the time periods marked ‘a’ & ‘b’
the temperature decreased; because aramids have a
negative coefficient of thermal expansion the yarns
would have slightly increased in length, and the steel
reaction bars in the frame would have decreased in
length. Both effects lead to a reduction in stress. The
gap over time ‘c’ was due to a gap in the data-
recording. This behaviour was observed for all the other
tests carried out at the same time and the data over
those regions were discarded in the analysis. It was
assumed that no filaments were broken when the
temperature changed.
• Test-02: This test series lasted for about 1,650 h.
Figures 13 and 14 show stress versus time, and log-
time, respectively. The plots show that relaxation is
linear with log-time.
• Test-03: Test 3 lasted for 600 h but the data after 75 h
had to be discarded because of temperature variation.
• Test-04: In this test, data after 1,200 h were discarded
due to uncertainty about the relative humidity
conditions.
Table 3 Stress relaxation coefficient
Load level
%ABL
Test 1 Test 2 Test 3 Test 4 Rope data
10 – – 0.0461 0.0468 –
15 – – 0.0403 0.0398 –
20 – – 0.0336 0.0374 –
20 – – 0.0338 0.031 –
25 – – 0.0274 0.029 –
30 – – 0.0233 0.0198 –
30 – – 0.0229 –
35 – – 0.0203 0.0173 –
36.5 – – – – 0.024
40 – 0.0155 0.0177 0.0191 –
42.1 – – – – 0.0266
45 – 0.0138 0.0131 0.0159 –
50 0.010335 0.0154 – – –
51.4 – – – – 0.0174
55 0.010159 0.0122 – – –
60 0.009105 0.0115 – – –
63.6 – – – – 0.0156
64.5 – – – – 0.0173
65 0.009268 – – – –
69.2 – – – – 0.0183
70 0.009113 0.0115 – – –
70 – 0.01556 – – –
75 0.011596 0.0132 – – –
75 – 0.0104 – – –
80 0.009173 0.0117 – – –
80 – 0.0087 – – –
0 0.1 0.2 0.3 0.4 0.5 0.6 0.7 0.8 0.9 10
0.005
0.01
0.015
0.02
0.025
0.03
σ/σu
β/εο
Non-conditionedConditioned
Ropes
Fig. 11 Creep coefficient for Kevlar 49 yarns and ropes as reported
by Guimaraes [18]
0 260 330 430 675 1020 114545
45.5
46
46.5
47
47.5
48
48.5
49
49.5
50
Time (hours)
% o
f AB
L
a b c
Fig. 12 Typical stress-relaxation response showing effect of temper-
ature excursion
J Mater Sci (2008) 43:7091–7101 7099
123

Figure 15 shows the variation of the stress-relaxation
coefficient for the four tests together with aramid rope data
obtained by Amaniampong [6]. Because all the stress-
relaxation tests results were linear with log time, there is no
distinction between tests of different durations. Two dis-
tinct regions can be seen in the graph; the stress-relaxation
coefficient k varies with the initial stress for values less
than 50% ABL. In contrast, when the initial stress values
are greater than 50% ABL, no specific trend in k can be
seen; thus it can be deduced that the value of k is stress
independent, which implies the linear visco-elastic
behaviour.
It is notable that the scatter is significantly lower for the
stress-relaxation results than for the creep results shown in
Fig. 10, especially at lower stress levels, but this may be
because the relaxation coefficients have been calculated
starting 1 h after the initial imposition of the load,
following the earlier work [6, 7], whereas the creep coef-
ficients include the immediate primary creep.
Conclusion
The uncertainty of the visco-elastic behaviour of Kevlar
yarns in different stress regions has now been resolved.
Creep and stress-relaxation tests carried out over a wide
stress spectrum show that Kevlar possesses non-linear
visco-elastic behaviour when the initial stress levels are
less than about 40% ABL, but linear visco-elastic behav-
iour is apparent at stress levels above about 40% ABL.
It is not possible, from these results, to propose a
mechanism for this change in behaviour, but it should be
noted that the change appears to coincide with the change
in stiffness on the stress–strain curve.
It would be interesting to repeat these tests at different
temperatures to determine the activation energies of the
visco-elastic processes involved. If these differed above
and below the 40% ABL stress level, it would indicate that
different physical processes were involved.
References
1. Burgoyne CJ (1999) Struct Eng Int 99(4):267
2. Alwis KGNC (2003) Accelerated testing for long-term stress-
rupture behaviour of aramid fibres. PhD Thesis, University of
Cambridge
3. Guimaraes GB, Burgoyne CJ (1992) J Mater Sci 27:2473
4. Walton PL, Majumdar AJ (1983) J Mater Sci 18:2939
5. Ko FK (1980) In: Bunsell AR et al (ed) Adv Compos Mater,
vol 1. Pergamon Press, Oxford, p 719
6. Amaniampong G (1992) Variability and viscoelasticity of par-
allel-lay ropes. Thesis submitted to the University of Cambridge
0 100 1200 160030
35
40
45
50
55
60
65
70
75
80
85
Time (hours)
Str
ess
(% A
BL)
SR70−02−01
SR70−02−02
SR75−02−01 SR75−02−01
SR80−02−01
SR60−02−01
SR50−02−01
SR45−02−01
SR40−02−01
SR80−02−01
Fig. 13 Stress-relaxation response against time
0 0.5 1 1.5 2 2.5 3 3.530
35
40
45
50
55
60
65
70
75
80
Time (hours)
Str
ess
(% A
BL)
SR40−02−01
SR45−02−01
SR50−02−01
SR60−02−01
SR70−02−01
SR70−02−02
SR75−02−01 SR75−02−02
SR80−02−02
SR80−02−01
Fig. 14 Stress-relaxation response against log-time
Fig. 15 Stress relaxation coefficients for all tests
7100 J Mater Sci (2008) 43:7091–7101
123
7. Chambers JJ (1986) Parallel-lay aramid ropes for use as tendons
in prestressed concrete. PhD Thesis, University of London
8. Schaefgen JR (1983) In: Zachariades AE et al (ed) The strength,
stiffness of polymers. Marcel Dekker Inc., New York, p 327
9. Amaniampong G, Burgoyne CJ (1996) Eur J Mech Solids
15(2):243
10. Northolt MG (1980) Polymer 21:1199
11. Northolt MG, van der Hout R (1985) Polymer 26:310
12. Baltussen JJM, Northolt MG (2001) Polymer 42:3835
13. Northolt MG, Baltussen JJM (2001) J Appl Polym Sci 83:508
14. Chailleux E, Davies P (2003) Mech Time-Depend Mater 7:291
15. Williams JG (1973) Stress analysis of polymers. Longman Group
Limited, London
16. Alwis KGNC, Burgoyne CJ (2006) Appl Compos Mater
13(4):249
17. Alwis KGNC, Burgoyne CJ (2006) J Mater Sci 43(14):4789
18. Guimaraes GB (1997) Stress dependent of the creep behaviour of
an aramid fiber. US-Canada-Europe Workshop on Bridge Engi-
neering, EMPA Swiss Federal Laboratories for Materials, Zurich,
Switzerland, 14–15 July
J Mater Sci (2008) 43:7091–7101 7101
123