· web viewtable a6: child’s age now 161 table a7: child’s age when diagnosed 161...
TRANSCRIPT

Evaluation of the Helping Children with Autism Package (FaHCSIA components)
Technical report
FaHCSIA
27 January 2012

Technical report Evaluation of the Helping Children with Autism Package
Acknowledgments
This work was completed with the assistance of Jennifer Reynolds, Sandra Vecchi, Carolyn Wilkes, Carly Perkins, Kent Penny and Ian Byron in the Mental Health and Autism Branch of the Department of Families, Housing, Community Services and Indigenous Affairs.
We would also like to thank the many key informants. We thank them for their time and insights and trust that their views are adequately represented in this report.
ARTD Consultancy Team
Jade Maloney, Wendy Hodge, Chris Milne, Emily Verstege, Janet Kidson, Florent Gomez-Bonnet, Fiona Christian, Kerry Hart, Marita Merlene, Ofir Thaler
ARTD Pty Ltd ABN 75 003 701 764 Tel 02 9373 9900 Fax 02 9373 9998
Level 4, 352 Kent St Sydney PO Box 1167 Queen Victoria Building NSW 1230 Australia

Contents
Executive summary iHelping Children with Autism Package iFinal evaluation iKey findings iRecommendations iii
1. Package provides access to early intervention, education and support1
1.1 Package aims to enhance the service system 11.2 Package provides a range of components 1
2. What the evaluation involved 52.1 Three-phase evaluation 52.2 Final evaluation—assessing impact 5
PART A: Outcomes for children and families 14
3. Positive outcomes for children 153.1 Improvements for children in core areas 153.2 Some differences between reported improvements for children by
family type 18
4. Positive outcomes for parents/ carers 214.1 Improvements for parents/ carers 214.2 Some differences in reported parent/ carer outcomes by family type
22
PART B: Awareness and registration 24
5. Pathways into the Package established but could be enhanced 255.1 Package promoted, but some need more information 255.2 Diagnosticians and allied health professionals the main source of
referrals to Advisor Services 295.3 Diagnosticians and Advisor Services refer families directly to Panel
providers30
6. Registrations now more in line with expectations but some children remain under-represented 326.1 The Package has achieved good reach 326.2 Obtaining a timely diagnosis a potential barrier to registration 336.3 Some improvements but some children remain under-represented
36
PART C: EARLY INTERVENTION 50

7. Most registered children are able to access a service but inequities remain 517.1 Most children have accessed a service(s) 517.2 Service access continues to vary by family type 58
8. The payment model 738.1 Funding is making services more affordable but some think it’s not
enough 738.2 Some would like more flexibility in how the funding can be spent 808.3 Mixed views on sustainability of the payment model 828.4 The resources policy—some issues 858.5 Outer Regional and Remote and Access Support Payment 89
9. Ensuring quality and best practice 919.1 Concerns about quality 919.2 Evidence-based interventions for autism 959.3 Concerns about some aspects of best practice, particularly
multidisciplinary intervention 96
PART D: Education and support 110
10. Autism Advisor Service 11110.1 Good reach to children with autism 11110.2 Service models have evolved with some differences 11110.3 Overall satisfaction levels are high, but many would like more support
11410.4 Many families would like Advisors to provide additional supports;
others also recognise this need 11610.5 Some current challenges in meeting demand and resource implications
if Advisor role is to be expanded 118
11. Early Days workshops 11911.1 Issues with reach and barriers to attending 11911.2 Positive outcomes for those attending 12411.3 Some room for improvement 124
12. Raising Children Network website: Children with Autism pages 12612.1 The website could be better promoted to increase use 12612.2 The site has been useful for families accessing it 12812.3 A need to increase the reach of this small but important component
130
13. PlayConnect playgroups 13113.1 Target met, with groups in all states and territories 13113.2 Participating families are mostly positive 13213.3 Some concerns about sustainability 134
PART E: The Package as a service model 135

14. The Package is making a positive contribution to the service system136
14.1 Supporting families to access services 13614.2 Contribution to outcomes 137
15. The components: a good combination that could be better integrated138
15.1 Good combination of components 13815.2 Increased synergies between components would facilitate smoother
pathways for families 13815.3 Management: a need to strengthen communications 142
16. The model’s fit with best practice and emerging policy trends 14416.1 The Package is consistent with the trend towards individualised
funding 14416.2 Service based on diagnosis 14416.3 Balancing family choice and need for support14516.4 Fit with best practice principles 14916.5 Concerns about age limits and services for children 7 years and over
150
17. Fit with the existing service system 15317.1 Perceived impact on the diagnostic sector 15317.2 Fit with state-based services 15417.3 Fit with other funding options 159
Appendix 1: Survey respondent characteristics 160Family survey respondents 160Advisor Services 163Panel providers 164Diagnosticians 166
Appendix 2: Detailed chapter data 168Chapter 5 168Chapter 7 170Chapter 8 171Chapter 9 173Chapter 10 174Chapter 16 175
Tables
Table 2.1: Data collection methods and sources 7
Table 3.1: Child outcomes reported by families (2009–11) 15
Table 3.2: Child outcomes reported by Panel providers (2010–11) 16
Table 4.1: Parent/ carer outcomes reported by families (2009–11) 21
Table 5.1: Sources of referrals to Advisor Services (1 March to 30 June 2011) 30
Table 6.1: Diagnosticians’ views on capacity 34
Table 6.2: Average wait time for initial appointment with diagnostic service 35
Table 6.3: Registered clients by state compared with 0–6 years population 37
Table 6.4: Registered clients by location (ARIA+) compared with 0–6 years population38
Table 6.5: CALD children registered by state (July 2008–November 2011), compared to 0–6 years population 41
Table 6.6: Indigenous children registered by state (July 2008–November 2011), compared to 0–6 years population 45
Table 6.7: Income of family survey respondents compared to Australian households 48
Table 7.1: Clients that have made at least one claim for services by financial year registered 51
Table 7.2: Average number of claims per client, by financial year registered 52
Table 7.3: Average wait time between registration and first claim by financial year registered (for clients that have made a claim) 56
Table 7.4: Diagnosticians’ views on their role advising families 56
Table 7.5: Registered clients that have made at least one claim for services by state, cumulative by year59
Table 7.6: Patterns of claims by state (July 2008–November 2011) 60
Table 7.8: Registered clients (July 2008–November 2011), compared with Panel providers by state 60
Table 7.9: Patterns of claims by location (July 2008–November 2011)63
Table 7.10: Registered clients (July 2008–November 2011), compared with Panel providers by location 63

Table 7.11: Patterns of claims by CALD status (July 2008–November 2011) 68
Table 7.12: Patterns of claims by Indigenous status (July 2008–November 2011) 70
Table 8.1: Total amount of funding families have claimed by financial year registered74
Table 8.2: Amount family survey respondents pay on supports for their child/ren in addition to HCWA funding each year 75
Table 8.3: Resources claims by location 89
Table 8.4: Distribution of Access Support Payments (July 2008–November 2011) 89
Table 9.1: Number of service types claimed 99
Table 9.2: Types of services family survey respondents were accessing or had accessed for their child 99
Table 9.3: Claims by service type 100
Table 10.1: Advisor Services 112
Table 10.2: Families’ views on additional supports Advisors should provide 117
Table 11.1: Reasons for not attending a workshop 120
Table 11.2: Impact of the Early Days workshops on families attending 124
Table 12.1: Reasons for not using the Children with Autism pages 127
Table 12.2: Families’ views of the Children with Autism pages129
Table 13.1: Families’ views of PlayConnect 133
Table 15.1: Advisors’ linkages with other services 139
Table 15.2: Providers’ views on management 142
Table 15.3: Advisors’ views on management 142
Table 16.1: Who should provide case coordination support? 148
Table 17.1: Impact on autism diagnoses, diagnosticians’ views 154
Table 17.2: Advisor linkages with state-based services 155
Table A1: Diagnosis, Child 1 160
Table A2: Diagnosis, Child 2 160
Table A3: Diagnosis, Child 3 160
Table A4: Diagnosis, Child 4 161

Table A5: Diagnosis, Child 5 161
Table A6: Child’s age now 161
Table A7: Child’s age when diagnosed 161
Table A8: Child’s age when registered 162
Table A9: State located162
Table A10: Region located 162
Table A11: Language mainly spoken at home 162
Table A12: English proficiency 163
Table A13: Does child identify as Indigenous 163
Table A14: Family gross weekly income 163
Table A15: Position in organisation 163
Table A16: Year began with the Autism Advisor Service 164
Table A17: Panel provider type 164
Table A18: Position in organisation 164
Table A19: Profession (for clinicians only) 164
Table A20: State located 165
Table A21: Northern Territory outreach 165
Table A22: Area service covers 165
Table A23: Type of early intervention provided 165
Table A24: Year joined the Panel 166
Table A25: Main areas of practice 166
Table A26: State located 166
Table A27: Region located 167
Table A28: Client groups that access your practice 167
Table 5.2: Sources of information about the Package 168
Table 5.3: Sources of information about local Panel providers 168
Table 5.4: Paediatricians’ and psychiatrists’ understanding and referral processes 169
Table 5.5: Diagnosticians’ understanding and referral processes over time* 169

Table 7.13: Families’ views on access to early intervention (2009–11) 170
Table 7.14: Advisors’ views on access to early intervention (2009–11) 170
Table 7.15: Panel providers’ views on access to early intervention (2009–11)170
Table 8.11: Diagnosticians’ views on the payment model (2009–2011) 172
Table 9.8: Families’ views on quality and best practice (2009–11) 173
Table 9.9: Advisors’ views on quality and best practice (2009–11) 173
Table 9.10: Providers’ views on quality and best practice (2009–11) 173
Table 9.11: Providers’ views on family engagement 173
Table 10.3: Families’ views on Advisor Services 174
Table 10.4: Advisors’ views on Advisor Services 174
Table 10.5: Advisors’ views on need for additional supports 175
Table 10.6: Panel providers’ views on Advisor Services 175
Table 10.7: Providers’ views on need for follow up 175
Table 10.8: Diagnosticians’ views on the Advisor Services 175
Table 16.2: Advisors’ views on need for case coordination 175
Table 16.3: Providers’ views on need for case coordination 176
Table 16.4: Providers’ views on range of services delivered under the Package 176
Table 16.5: Diagnosticians’ views on need for case coordination 176
Table 16.6: Diagnosticians’ views on range of services delivered under the Package 176

Figures
Figure 6.1: Client registrations July 1 2008–November 3 2011 32
Figure 6.2: Registered clients that speak a language other than English at home compared with 0–6 years population 39
Figure 6.3: Registered clients that Identify as Indigenous compared with 0–6 years population 43
Figure 7.1: Registered clients that have made at least one claim for services by location (ARIA+), cumulative by year 61
Figure 7.2: Registered clients that have made at least one claim for services by CALD status, cumulative by year 67
Figure 7.3: Registered clients that have made at least one claim for services by Indigenous status, cumulative by year 69
Figure 8.1: Average amount charged* per claim (in constant 2008 AUD), by type of early intervention service 78
Figure 12.1: Page views of Children with Autism landing page126

Executive summary
Helping Children with Autism Package
In 2008, the Australian Government committed $190 million over four years to deliver the Helping Children with Autism (HCWA) Package. The Package aims to improve access to best practice early intervention, education and support for families of children diagnosed with autism. State and territory governments remain the primary providers of early intervention services for children with a disability; the Package is intended to complement these services.
The Package is delivered jointly through the Department of Families, Housing, Community Services and Indigenous Affairs (FaHCSIA), the Department of Education, Employment and Workplace Relations (DEEWR) and the Department of Health and Ageing (DoHA). The DoHA component provides Medicare rebates for diagnosis and intervention. The DEEWR component provides workshops for parents/ carers of school-age children and professional development for school staff.
The FaHCSIA component of the Package is centred on a new market-based and individualised approach to funding early intervention services. Eligible children receive an allocation of up to $12,000 that can be used to purchase services from providers that deliver eligible services and are members of the Early Intervention Service Provider Panel (the Panel). Families are made aware of autism and available services through a range of education and support services.
Final evaluation
ARTD Consultants evaluated the FaHCSIA components of the Package in three phases (initial, mid-term and final evaluation) over two-and-a-half years (July 2009–December 2011). The main purpose of the final evaluation was to assess the Package’s impact on access to services and to inform future directions. This report presents the findings from the final phase and uses data collected across the three phases to draw conclusions.
Key findings
Beginning as a new initiative in 2008, the FaHCSIA component of the HCWA Package has been successfully developed over three-and-a-half years, and has now reached a mature stage of implementation. It has been largely effective in reaching the target population, increased access to approved early intervention services, and produced positive outcomes for children and families, but there remains uncertainty about the extent to which services are in line with some best practice principles for children with autism.
i

The Package introduced a major change to the system and many refinements to the model were suggested to improve pathways to services for families.
The Package has achieved good reach into the population of children with autism. Between July 2008 and November 2011 almost 17,000 children have registered for the Package; of these, 12,702 are currently eligible. This is equivalent to 0.7% of Australian children 0–6 years—a figure roughly in line with estimated prevalence rates for autism in children. But children from outer regional and remote areas and those from culturally and linguistically diverse (CALD) backgrounds remain under-represented among registered clients, assuming autism prevalence rates are the same across different locations and family types. Indigenous registrations have increased steadily over the three-and-a-half years to date, but stakeholders remain concerned about the barriers these families can face in registering their children.
Most children registered (90%) have been able to make a claim(s) for services, and the average number of claims per child has increased over the years of operation to date as families have had more time to access services and as the number of providers on the Panel has grown. Evidence suggests at least some of these families would not have been able to access services without the early intervention funding, and others would not have been able to access services as frequently. But a lower proportion of registered children from regional and remote areas1 (including the Northern Territory) and those from Indigenous families have accessed services. This suggests a need to explore different service models to meet the needs of some of these families.
While the Panel is a means to ensuring children receive quality services and stakeholders generally believe most providers offer quality services, they did raise concerns about some providers’ practice, indicating a quality monitoring process is needed. The Panel model is also intended to ensure children receive a multidisciplinary service as is best practice for children with autism, but evidence suggests the current model is insufficient to ensure this occurs, and new mechanisms should be explored to facilitate multidisciplinary practice.
The education and support components (Autism Advisor Services, Early Days workshops, the Children with Autism pages of the Raising Children Network website, PlayConnect Playgroups) have played an important role in supporting families to understand autism and intervention types and make decisions about which services to access for their child. Many of the families surveyed that had used these components reported positive outcomes associated with them. But some enhancements would ensure families receive the support they need to make effective decisions about services.
The Package model recognises that families of children with autism have different needs at various stages of their journey, providing a combination of intervention and support components as well as education to assist in meeting these needs. But there could be
1 Client data uses the Accessibility/Remoteness Index of Australia+ (ARIA+) to define location. Classifications are major cities, inner regional, outer regional, remote and very remote.
ii

greater synergies between Package components and with the existing service system to ensure effective pathways for families.
Overall, the available evidence is that the Package has had a positive impact on children and families, with families reporting children have improved social and communication skills and behaviour and are better prepared to transition to school. But, reflecting the differences in their ability to access Package services, there are some differences between reported outcomes by family type. Families from regional and remote areas (including the Northern Territory), Indigenous families and families from CALD backgrounds that have lower English proficiency were less likely to report positive outcomes for their children.
Recommendations
Awareness and registration
Information and referral pathways
Establish more systematic and regular communications with diagnosticians and general practitioners through the professional colleges.
Registrations
Consider options to facilitate access for families in remote and particular regional areas that lack local diagnostic services.
Develop translated, culturally appropriate and plain English information resources at a Package level to facilitate access for CALD and Indigenous families. These could be made available through Autism Advisor Services and on the RCN and FaHCSIA websites.
Continue to support Advisor Services to develop relationships with CALD and Indigenous community organisations to facilitate access; lessons and strategies should be shared at a national level.
Develop options to ensure culturally appropriate service delivery and build trusting relationships between the Package and Indigenous communities, for example, establishing a national Indigenous Advisor position with the capacity to support and guide Advisor Services on work with Indigenous communities.
If families agree, Advisor Services should record family income for registered clients, so FaHCSIA can monitor the degree of access for low income families.
Early intervention
Service access
Monitor Package claims data, including wait times, as Better Start service delivery increases.
Liaise with Health Workforce Australia about options for developing allied health workforce capacity.
iii

Consider how the education and support components can be strengthened to help parents develop effective decision-making processes.
Consider alternative delivery models in regional and remote areas. These may include tele-health approaches, funding providers for outreach, up-skilling local providers, enabling clients to group together to get services to travel to their region by providing data on demand.
Allow relevant non-Panel professionals to approve resources for families in remote and regional areas that lack a local Panel provider. Professionals might include state services, those registered with relevant professional bodies, and education support staff.
Consider options to support Indigenous service access including consulting with Indigenous organisations about potential models, including delivery through Indigenous organisations, and supporting partnerships between existing providers and Indigenous organisations.
The payment model
Explore options to reduce administrative requirements for Panel providers and options to regulate administration fees or make providers display administrative charges on the Panel provider list on the FaHCSIA website.
Provide more information about the resources policy for Panel providers. Better inform families about the requirements for approval of resources through
various Package information sources (e.g. Advisor Services and the Raising Children Network website).
Consider indexation of the funding over time to ensure it can buy a commensurate amount of services.
Ensuring quality and best practice
Establish a quality monitoring process. The first step should be to advertise the current complaints mechanism to ensure families are aware of how they can make complaints. This should include examples of practices requiring investigation.
Review the Operational Guidelines to ensure they adequately cover family-centred practice and include assessment of family-centred practice as part of the quality monitoring process.
Establish a consistent policy on how coordination can be charged to families and have providers display these charges on the FaHCSIA website.
Explore alternative mechanisms for facilitating collaborative, multidisciplinary and trans-disciplinary practice. Options include developing information sharing systems, requiring case meetings, or facilitating networking. In considering options, the Package should draw on lessons from the practices in other multidisciplinary programs, for example, Chronic Disease Management, Better Access to Mental Health.
Educate families about the benefits of multidisciplinary practice through existing education and support mechanisms.
iv

Education and support
Autism Advisors
1. In consultation with Autism Advisor Services, consider options to expand the Advisor role to provide additional appointments/ support, the appropriate timing for these appointments, and the resource implications of
‒ a scheduled follow-up appointment/ contact‒ an exit interview/ support with transition (for example, information on other
available services).
Early Days workshops
Establish a way to provide information to families not able to attend a workshop. Have the Early Days Consortium of Autism Specialist Providers establish and
maintain links with the DEEWR-funded Positive Partnerships providers to share strategies for working with Indigenous, CALD and regional communities and ensure the two programs do not duplicate information resources. The Consortium should also connect with other relevant projects, including the Talking up Autism Project to draw on learning for working with Indigenous communities.
Monitor delivery under the new model to ensure strategies are working to achieve increased reach and efficiencies.
Raising Children Network: Children with Autism pages
Ensure the Children with Autism pages provide up-to-date service information, including links to all relevant state-based services for children with autism.
Have the Children with Autism pages include a one-page system diagram that includes all Package components and state-based services.
PlayConnect playgroups
Consult with Playgroup Australia to identify an appropriate and feasible model for ensuring the sustainability of individual playgroups.
The Package as a service model
In considering changes to the Package model, consider first what is available in the existing service system, including the variations across states and territories.
Within funding constraints, and in consultation with relevant stakeholders, consider options for providing case coordination assistance for families that require it.
Establish a mechanism/s for cross-Package communication, sharing of resources and opportunities to form relationships. Communicate directly with all Panel provider organisations.
Establish communication links between FaHCSIA and relevant state and territory government departments at National Office level unless State Offices have existing connections with these departments in relation to autism. This should include a
v

process for informing state and territory government departments about cases in which Package clients have been denied access to state-based services.
Monitor and report client data internally on an annual basis, and share trends and milestones with stakeholders through newsletters.
Monitor registration rates against estimated autism prevalence rates.
vi

1. Package provides access to early intervention, education and support
The Australian Government introduced the Helping Children with Autism (HCWA) Package in 2008 to improve access to best practice early intervention, education and support for families of children diagnosed with autism.
1.1 Package aims to enhance the service system
The Package aims to improve access to best practice early intervention, education and support for families of children diagnosed with autism. It is intended to complement existing state and territory government services, and should be recognised as contributing to an existing and continuing system of support.
1.2 Package provides a range of components
The Package is delivered jointly through the Department of Families, Housing, Community Services and Indigenous Affairs (FaHCSIA), the Department of Education, Employment and Workplace Relations (DEEWR) and the Department of Health and Ageing (DoHA). FaHCSIA is responsible for the major share of components targeting children aged 0–7 years, which are intended to help parents in the crucial period post-diagnosis.
Package components
FaHCSIA‒ Funding (up to $12,000) for children aged 0–6 years who are diagnosed with
autism to access early intervention services from a Panel of approved providers before their 7th birthday
‒ Autism Advisor Service in each state and territory to help families and carers of children aged 0–6 years who are diagnosed with autism
‒ Early Days workshops to provide information and support to families of children aged 0–6 years with autism or autism-like symptoms
‒ Children with Autism pages of the Raising Children Network (RCN) website to provide information, online resources and other interactive functions for parents, carers and professionals
‒ 150 PlayConnect playgroups across Australia for children aged 0–6 years with autism or autism-like symptoms, their families and siblings
‒ 6 Autism Specific Early Learning and Care Centres (ASELCCs) DoHA
‒ Medicare rebates for diagnosis and treatment planning for children aged under 13 years
‒ Medicare rebates for 20 sessions of intervention for children aged under 15 years
1

DEEWR ‒ Workshops and information online for parents and carers of school-aged children
with autism‒ Professional development for teachers and other school staff to support school
students with autism to achieve better educational outcomes
1.2.1 Early Intervention
The FaHCSIA components introduced a new approach to funding early intervention services to address the limited service access for children with autism, in an area where the Commonwealth was not previously directly involved. The Package’s market-based and individualised approach was a significant innovation in funding for early intervention services and involved setting up a new delivery system.
Eligible children2 receive an allocation of up to $12,000 that can be used to make claims for services until their seventh birthday. 3 Families are able to select services from an Early Intervention Service Provider Panel (the Panel) of allied health professionals. Families can claim a maximum of $6,000 per financial year; up to $2,100 (35%) of which can be spent on resources approved by a Panel provider.
Families that live in a location defined as Outer Regional, Remote or Very Remote according to the Accessibility/ Remoteness Index of Australia (ARIA+) are automatically eligible for the Outer Regional, Remote and Access Support Payment ($2,000). This is a direct payment intended to help families access services; it does not have to be spent with Panel providers. In 2009, families with multiple factors impeding their access to early intervention services were also able to claim this Payment. Advisor Services initially assessed eligibility for these Payments but FaHCSIA is now responsible for approving cases for special consideration (as of November 2010).
The Panel model is intended to ensure that children receive best practice intervention. To join, providers must deliver interventions with an evidence base for children with autism and follow best practice principles. To ensure multidisciplinary service delivery, when the Package was introduced, providers were required to be part of a multidisciplinary organisation or form a consortium. In late 2009, sole providers were allowed to join the Panel to increase capacity, but sole providers are also expected to work collaboratively and are encouraged to work with existing consortia.
2 To be eligible, a child must have a formal diagnosis of autism under the DSM IV before their sixth birthday. An acceptable diagnosis is one of the following as listed in the Diagnostic and Statistical Manual of Mental Health Disorders (DSM) IV under Pervasive Developmental Disorders; Autistic Disorder, Asperger’s Disorder/ Syndrome, Rett’s Disorder, Childhood Disintegrative Disorder, Pervasive Developmental Disorder Not Otherwise Specified (PDD-NOS). 3 Because families were initially only able to make claims for services until their child turned six there was a transition period for children who turned six between October 2008 and October 2009, allowing families to claim until 18 October 2010.
2

Because the Package is intended to complement state-based services, it is expected that eligible children will receive both state-funded and HCWA-funded services, with practitioners from the two streams collaborating.
1.2.2 Education and Support
Autism Advisor Services
State and territory autism associations deliver the Autism Advisor Services4, which are designed to ensure families of children with autism (aged 0–6 years) receive appropriate information and are linked to services and supports.
Advisors use criteria determined by FaHCSIA to assess eligibility and register children for the early intervention funding ($12,000) and inform families about available local Panel providers and state-funded services. As the key point of contact for the Package, Advisors also inform families about other Package components, including the other FaHCSIA-funded education and support initiatives, the Medicare rebates and the Positive Partnerships Workshops for parents and carers of school-aged children.
Early Days workshops
In all states and territories, Early Days workshops are free for parents and carers of children aged 0–6 years diagnosed with autism or who have autism-like symptoms. The workshops offer parents and carers the chance to
learn about autism and what it means for their child and family learn practical strategies that can make a difference to their child's development learn how to choose between therapies and get the most out of services meet with other parents and share ideas and experiences.
Between July 2008 and July 2011, the Parenting Research Centre (PRC) developed the content for, and managed the delivery of, the Early Days workshops. All workshops were delivered by Early Days providers: selected organisations that provide early childhood intervention services to children with developmental delays or disabilities, including autism. Workshops were offered face-to-face and by telephone; a self-paced online version of the workshop was also developed.
In July 2011, the Early Days Consortium of Autism Specialist Providers (made up of state and territory autism associations) took over the delivery of the workshops. An Early Days National Coordinator, based in Autism Queensland, was appointed in August 2011. The new model is focused on ensuring that families get timely access to workshops through a streamlined registration process.
4 The Northern Territory Advisor Service is under the auspice of Autism SA.
3

Raising Children Network Website: Children with Autism pages
The Package funds the Children with Autism pages of the RCN website to provide information, online resources and interactive functions to support parents, carers and professionals. It also has information to help families understand the evidence base for therapies and a Services Pathfinder to help them locate local services.
PlayConnect Playgroups
Playgroup Australia, in partnership with state and territory playgroup associations, received $4.5 million over four years to implement 150 autism-specific playgroups around Australia.
PlayConnect Playgroups are designed to give families the opportunity to learn through play in an environment that recognises and caters for the developmental needs of children with autism in a safe, supportive and friendly environment. The groups are accessible to children with autism and autism-like symptoms aged 0–6 years and their siblings. While children with autism often play alone, it is thought that involving them in facilitated play will help develop their social skills and support their entry into mainstream settings. The playgroups are also to provide an informal support for parents/ carers and increase their capacity to manage their child’s behaviour and engage in the community.
Each group is funded to receive support from a development worker for two years, after which they are intended to transition to self-management.
4

5

2. What the evaluation involved
2.1 Three-phase evaluation
ARTD evaluated the FaHCSIA-funded components of the Package in three phases over two-and-a half years (July 2009–December 2011). The overall purpose of the evaluation was to assess the extent to which the program objectives were achieved, identify possible improvements, and inform decisions about future directions and/or expansion.
The initial evaluation (Phase 1) report was finalised in February 2010, and the mid-term evaluation (Phase 2) report was finalised in April 2011. The final evaluation (Phase 3) was finalised in January 2012. ARTD produced a technical report (this report) for internal use and a summary report for release to stakeholders. The final reports present the findings from the final phase and uses data collected across the three phases to draw conclusions.
2.2 Final evaluation—assessing impact
The main purpose of the final evaluation was to assess the Package’s impact on access to services and to inform future directions. The final evaluation also addresses some questions on the efficiency, effectiveness and appropriateness of the Package to further explore the issues identified in the initial and mid-term evaluations.
2.2.1 Focus: early intervention and Advisor Service components
The final evaluation focused on the early intervention and Autism Advisor Service components. To a lesser extent the evaluation also covered the Early Days workshops and the Children with Autism pages of the RCN website. The final evaluation did not collect new data about the PlayConnect Playgroups except through interviews with Playgroup Australia and FaHCSIA State and Territory Office (STO) managers; instead, the report draws on data from the 2010 evaluation of PlayConnect.
The evaluation did not cover the ASELCCs which are being evaluated separately. The DEEWR component of the Package has also been separately evaluated.5
2.2.2 Mixed-method approach
The final evaluation used a mixed-method approach, analysing existing administrative data and collecting new data. Methods were chosen to provide a high-level indication of 5 Allen Consulting Group, 2010, Evaluation of Positive Partnerships — the DEEWR component of the Helping Children with Autism Package, report to the Department of Education, Employment and Workplace Relations, November 2010 http://www.deewr.gov.au/Schooling/Programs/Documents/PositivePartnerships.pdf
6

development over the life of the Package (through survey data), to focus in depth on the issues identified in the initial and mid-term evaluations (through site visits and stakeholder interviews), and to assess the Package’s impact (through administrative data, surveys, and stakeholder interviews).
7

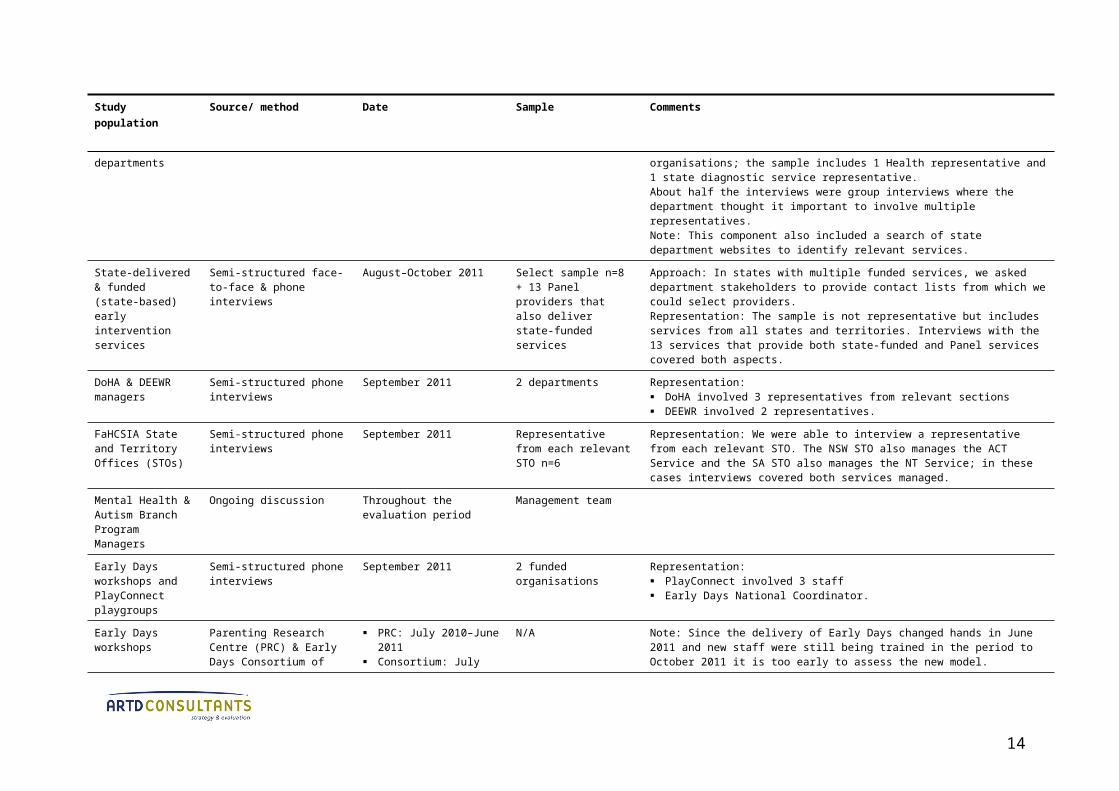
Table 2.1: Data collection methods and sources
Study population Source/ method Date Sample Comments
Registered clients Analysis of unit record client data (FOFMS)
July 1 2008–November 3 2011 Population
n=16,967
Registered clients Online survey Paper survey
Online: 18/8/11–16/9/11 Paper: 25/8/2011–
4/10/2011
Population Online:10,706 Paper: 2,503
Response rate: Online: 35% (n=3,778, excludes 3 failed to send) Paper: 27% (n=659, excludes 19 failed to send) Combined: 34% (n=4,437).Follow up: Online: 2 reminders, survey period extended by 1 week Paper: reminders not possible, survey period extended by 1 week.Representation: Proportion of respondents from each state and territory is broadly in line with
proportion of clients from each state and territory Families from regional and remote areas are slightly over-represented (42% of
respondents vs 29% of Package clients, but some of the difference may be because the survey did not use ARIA+ categories)
CALD families are under-represented (7% of respondents vs 11% of registered clients)
Proportion of Indigenous respondents is in line with proportion of registered clients (3.2% respondents vs 3.5% registered clients).
Follow-up registered clients
Semi-structured phone & face-to-face interviews
August–September 2011 Half of the original stratified random sample (from 2009) still relevant to contactn=13
Response rate: 2 families we intended to contact could not be contacted; we were able to interview 2 other families from the original sample instead.Representation: The sample includes families from all states and territories and from metropolitan, regional and remote areas.
CALD registered clients
Semi-structured phone & face-to-face interviews
August–September 2011 Opportunistic sample n=11
Approach: We asked NSW, ACT, WA & SA Advisors to approach clients that might be willing to participate. SA was unable to identify clients within the evaluation timeframe. ACT & WA Advisors approached clients for permission. Because of their high client load, NSW Advisors were unable to approach families directly; instead we sent a letter to families then called to ask if they were willing to participate.Representation: The sample is not representative but includes families from three states (WA n=1, ACT n=3, NSW n=7) and families from a range of nationalities: Assyrian, Bengali, Korean, Vietnamese, Thai, Pakistani, Sri Lankan, Ethiopian,
8
Study population Source/ method Date Sample Comments
Indonesian, Russian and Portuguese. Of the 11 families, 4 were born overseas.
Indigenous registered clients
Semi-structured phone & face-to-face interviews
September 2011 Opportunistic sample n=10
Approach: We asked NSW, ACT, WA & SA Advisors to approach clients that might be willing to participate. SA & WA were unable to identify clients within the evaluation timeframe. ACT has a very small number of Indigenous clients that would be easily identifiable so we did not approach these families. Because of their high client load, NSW Advisors were unable to approach families directly; instead we sent a letter to families then called to ask if they were willing to participate.Representation: The sample is not representative. All interviewees are from NSW—Sydney (n=6) and regional areas (n=4).
CALD and Indigenous stakeholders
Unstructured phone interviews
September 2011 Opportunistic sample n=4 Approach: We identified stakeholders opportunistically.Representation: The sample is not representative. Data from these stakeholders is intended to supplement information from client interviews. The data from Indigenous stakeholders supplements data from interviews with Indigenous organisations and organisations delivering services to Indigenous clients undertaken in 2010 (n=11).
Autism Advisor Service staff and managers
Online survey Advisors: 27/7– 26/8/2011
Team leaders & Association CEOs: 10/8–7/9/2011
All Autism Advisor Service staff and managers n=57
Response rate: 61% (n=35). Low response rate is likely due to evaluation fatigue as Advisors were also surveyed for the Prior and Roberts review (2011).Because we were also able to draw on data from focus groups and Advisor Service reports, we are confident we were able to capture the views of these stakeholders.Follow up: 2 reminders sent (for both), survey period extended by 1 week
Autism Advisors Focus groups Discussion at Advisor
forum
20/5/2011 All Advisors attending the forum n=32
Focus groups: Advisors were divided into 3 groups (Group 1: SA, NT, ACT, Tas, WA; Group 2: Qld, NSW; Group 3: Vic). Forum: The evaluation also draws on discussions held throughout the 2-day forum.
Autism Advisor Services
Autism Advisor Service four-monthly reports
November 2010–June 2011 Last 2 reports for each Service
Representation: We obtained all reports except for the March 2011–June 2011 report from the Tasmanian Service.
Panel providers Online survey 5/8/2011–2/9/2011 Population n=488 Response rate: 59% (n=252 + 24 drafts, excludes 20 failed email addresses and 2 who requested to be removed).Follow up: 2 reminders sent, survey period extended by 1 week.Representation: We are unable to assess the representativeness of the respondent sample because the contact list for Panel providers does not include all consortia members, but there were respondents from all states and territories, representing all provider types.
Early Intervention Service Providers
Semi-structured face-to-face & phone interviews
August–October2011 Select sample n=65 organisations + group interview with
Representation: The interview sample chosen to cover all states and territories, metropolitan, regional and remote areas AND different provider models: 8 sole providers, 41 consortium leads and partners (from 15 consortia) and 16 multi-
9

Study population Source/ method Date Sample Comments
representatives of 5 organisations
disciplinary organisations (13 of which also provide state-funded services).
Diagnosticians (paediatricians and psychiatrists)
Online survey Royal Australian College of Physicians (RACP): 29/7/2011-19/8/2011
Autism Advisor Services (AAS) (NSW, NT, ACT) paediatrician contacts: 29/7/2011-19/8/11
Royal Australian and New Zealand College of Psychiatrists (RANZCP): 5/8/2011-26/8/2011
Not representative Response: n=99 (1 parent and 1 diagnostician who did not provide answers were excluded).Representation: It was not possible to obtain a representative sample of diagnosticians. The RACP
distributed the survey to paediatricians through their weekly e-newsletter Pot-pourri. The RANZCP distributed the survey to members of the Faculty of Child and Adolescent Psychiatry. The final sample included 62 paediatricians and 37 psychiatrists.
NSW, NT, ACT Advisor Services also distributed the survey to their contacts. Other Advisor Services were unable to distribute the survey because their paediatrician contact lists were fax or post only.
Follow up RACP sent 2 reminders Advisor Services and RANZCP sent 1 reminder.
Professional colleges/ associations
Semi-structured phone interviews
July–September 2011 N=5 colleges/ associations
Representation: Speech Pathology Australia Occupational Therapy Australia Australian Psychological Society Royal Australian College of Physicians, Division of Paediatric and Child Health Royal Australian College of General Practitioners.The interview with Speech Therapy Australia involved more than one representative.
State government Human Services (Disability) and Education departments
Semi-structured phone interviews
July–October 2011 Representatives from relevant department/s in each state
Response: We interviewed representatives of Education and Human Services (Disability) services in all states where relevant, except for a Human Services (Disability) representative from Victoria (whom we were unable to contact). We interviewed representatives from 18 departments/ organisations; the sample includes 1 Health representative and 1 state diagnostic service representative.About half the interviews were group interviews where the department thought it important to involve multiple representatives.Note: This component also included a search of state department websites to identify relevant services.
State-delivered & funded (state-based) early intervention services
Semi-structured face-to-face & phone interviews
August–October 2011 Select sample n=8 + 13 Panel providers that also deliver state-funded services
Approach: In states with multiple funded services, we asked department stakeholders to provide contact lists from which we could select providers.Representation: The sample is not representative but includes services from all states and territories. Interviews with the 13 services that provide both state-funded and Panel services covered both aspects.
DoHA & DEEWR managers
Semi-structured phone interviews
September 2011 2 departments Representation: DoHA involved 3 representatives from relevant sections DEEWR involved 2 representatives.
10

Study population Source/ method Date Sample Comments
FaHCSIA State and Territory Offices (STOs)
Semi-structured phone interviews
September 2011 Representative from each relevant STO n=6
Representation: We were able to interview a representative from each relevant STO. The NSW STO also manages the ACT Service and the SA STO also manages the NT Service; in these cases interviews covered both services managed.
Mental Health & Autism Branch Program Managers
Ongoing discussion Throughout the evaluation period
Management team
Early Days workshops and PlayConnect playgroups
Semi-structured phone interviews
September 2011 2 funded organisations Representation: PlayConnect involved 3 staff Early Days National Coordinator.
Early Days workshops
Parenting Research Centre (PRC) & Early Days Consortium of Autism Specialist Providers data
PRC: July 2010–June 2011 Consortium: July 2011–
September 2011
N/A Note: Since the delivery of Early Days changed hands in June 2011 and new staff were still being trained in the period to October 2011 it is too early to assess the new model.
RCN website, Children with Autism pages
RCN report January-June 2011 N/A Note: RCN report includes qualitative data as well as web statistics.
Other Package components and relevant research
Scan of other reports Throughout the evaluation period
N/A Positive Partnerships evaluation 2010 Prior and Roberts et al, 2011, A Review Of The Research To Identify The Most
Effective Models Of Practice In Early Intervention For Children With Autism Spectrum Disorders, report to FaHCSIA
Prior, J. and Roberts, M., 2006, A Review of the Research to Identify the Most Effective Models of Practice in Early Intervention for Children with Autism Spectrum Disorders, report for DoHA, July 2006
Asia Pacific Autism Conference (APAC) 2011 presentations
Opportunistic (full range of stakeholders)
Semi-structured interviews & emails from relevant stakeholders that contacted the evaluation team
August–September 2011 N/A Families: 9 via email; 3 through phone interviews Early childhood intervention representatives (state-based and state-funded
services): focus group
11

2.2.3 Confidence in the findings
The evaluation methods were implemented largely as planned and provided comprehensive data for the evaluation. While there were limitations to some individual methods, the methods were triangulated in that they addressed the same questions from different stakeholders’ perspectives, and the findings from the different methods were largely consistent. As a result we are confident that the findings provide the evidence for a sound assessment. At the same time, the final evaluation uncovered some emerging issues about which there are competing claims and which would require further assessment to draw conclusions.
The evaluation has also collected survey data on some questions across the three phases but, because of the differences in sampling strategies, comparisons between the 2009 and the 2010 and 2011 surveys should be considered as indicative only.
Interviews with CALD and Indigenous registered families and stakeholders
Given the small sample size and approach to identifying interviewees, data collected through interviews with CALD and Indigenous families and stakeholders is not representative of all CALD or Indigenous families’ experiences. In particular, the CALD families we spoke to were fairly proficient in English—it’s likely that families with lower English proficiency have had different experiences. Interview data is used to identify issues and support data collected through the family survey and from other stakeholders, as well as patterns identified in client data.
Family survey
Only 35% of families with children registered responded to the survey so the extent to which the findings can be extrapolated to the broader population is uncertain. Families of all types6 were represented among respondents, but CALD families were under-represented and regional families over-represented; the latter may in part relate to different location categorisations used by the survey and in client data.
The overall responses, however, are in line with findings from previous years, with higher levels of agreement for some items for which improvements would be expected over time. Also, the differences identified between family types in the survey were reflected in data collected through other sources.
Comparisons between families in regional and remote areas and those in major cities combine data from regional and remote families because of the small number of families in remote areas; but, in some cases, differences were larger between remote families and those in major cities.6 ‘Family type’ refers to demographic categories used in the survey or in the FOFMS data: location, Indigenous status, CALD status and income band.
12

Comparative data: The 2010 and 2011 surveys used a different sampling strategy to the 2009 survey. The 2010 and 2011 surveys included families of all registered clients (though the 2010 survey could not be sent to all families that did not have a registered email address) while in 2009, we selected a stratified sample of 2,000 families to survey.
Panel provider survey
Of the Panel providers contacted, 59% responded to the survey, but the extent to which the sample can be considered representative and the findings extrapolated to the broader population is unclear because the contact list for the survey did not include all consortium partners.
The overall responses, however, are in line with findings from previous years, as are the differences in level or agreement between Panel provider types. Also, the differences between Panel provider types reflect those identified through other data sources.
Comparative data: The 2009, 2010 and 2011 surveys used different sampling strategies. The 2011 survey used the provider list which was missing contact details for some consortia partners; the 2010 survey was sent to all providers with an email address registered with the FaHCSIA Online Funding Management System (FOFMS); in 2009, only lead agencies and multidisciplinary organisations were targeted.
Autism Advisor survey
Comparative data: The respondent sample for the questions on management of the Package differs between the 2009 and 2010 and 2011 surveys. In 2010 and 2011 only managers and team leaders/ coordinators answered management questions, but in the 2009 survey all respondents answered these questions.
Diagnostician survey
Because there is no comprehensive list of diagnosticians available, we used an opt-in survey, meaning it was likely completed by those with a specific viewpoint or interest. As such, the results cannot be considered representative.
Comparative data: The 2009 and 2011 surveys are not directly comparable because the 2011 survey targeted psychiatrists and the 2009 survey did not.
Outcomes data
The evaluation did not include the direct measurement of children’s social, behavioural and emotional outcomes. The evaluation relies on the perceptions of families about the changes they have seen in their child/ren and the perceptions of Panel providers about
13

the changes they have seen in the children accessing their services using Package funding.
14

PART A: Outcomes for children and families
15

3. Positive outcomes for children
The Package aims to improve access to best practice early intervention, education and support, with the assumption that this will contribute to improved outcomes for children with autism before they begin school.
3.1 Improvements for children in core areas
While the evaluation has focused on access rather than outcomes for children and families, the available evidence—from both families and Panel providers—indicates that the Package is also contributing to improved outcomes.
Of course, the outcomes achieved are not attributable to the Package alone because children often access other private and state-based services in addition to those paid for with the early intervention funding, but parents/ carers often associated their child/ren’s outcomes with services accessed through the Package.
Throughout the evaluation, most families surveyed agreed that since accessing the Package their child/ren had improved communication and social skills, behaviour and were better prepared to transition to school. Similarly, the families we followed-up throughout the evaluation were generally positive about the outcomes for their child/ren, but several noted their child had ongoing issues.
The HCWA funding has allowed us to access speech therapy, occupational therapy and psychology appointments. We could not afford these vital services if we did not have access to the HCWA funding. Our son is responding well to these therapies and in only a couple of months (we) have noticed an improvement in speech and behaviour. [Family survey respondent]
Overall [my child] is a better little person. He has learned a lot and will continue to thrive in this world. [Family survey respondent]
Table 3.1: Child outcomes reported by families (2009–11)
% agree*
Since accessing the HCWA Package… 2009 2010 2011
...my child/ children have improved their communication skills. 83% 86% 89%
...my child/ children have improved their social skills. 80% 80% 84%
...my child/ children have improved behaviour. – 78% 80%
...my child/ children is/ was better prepared to transition to school. – 76% 78%Source: Family surveys 2009, 2010, 2011*Throughout % agree refers to total ‘agree’ and ‘tend to agree’ responses.
16

The generally positive family self-reports are supported by Panel providers—most surveyed agreed all or most registered children they’d seen have improved in these core areas. In interviews, most Panel providers also described positive outcomes for most clients accessing early intervention funding.
Fantastic opportunity for children to be prepared for and therefore successfully commence school with best outcome for child, family and school. Visionary. [Panel provider survey respondent]
Table 3.2: Child outcomes reported by Panel providers (2010–11)
% ‘all ‘or ‘most’ agree
Child outcomes 2009 2010 2011
Based on pre- and post-assessment, how many children have improved their communication skills?
– 90% 96%
Based on pre- and post-assessment, how many of the children have improved their social skills?
– 86% 83%
Based on pre- and post-assessment, how many of the children have improved behaviour?
– 88% 89%
How many of the children have been better equipped to make a successful transition to school?
– 89% 87%
Source: Panel provider surveys 2010 and 2011
But, a few Panel providers we spoke to noted that outcomes vary between children, reflecting that autism is a spectrum. A representative from one of the professional colleges/ associations and one from a state department claimed higher functioning children benefit most because progress is slower for lower functioning children and they may not make the same significant gains in the first two years of intervention.
An emerging concern among a very small proportion of stakeholders in the final evaluation was sustainability of outcomes. A very small proportion of family survey respondents, a few Panel providers and a representative of one of the professional associations/ colleges mentioned concerns about the sustainability of outcomes beyond the funding period, particularly if families are unable to continue with services. One state department representative emphasised the need for the Package to build parent capacity to achieve sustainable outcomes. While 25% of the children registered since July 1 2008 have now transitioned, some have only done so recently, so it is too early to make an assessment of sustainability of outcomes achieved.
3.1.1 School transitions—mixed experiences
The children of families we followed-up throughout the evaluation transitioned to different school environments—some to special schools, some to mainstream public schools, others to non-government schools and one to a special class in a mainstream school. Those with children that had not yet transitioned had different plans about
17

where their child would be going to school: mainstream public, autism-specific and dual enrolment between a non-government and special school.
Some parents reported their children had transitioned well into their new environment. Others had issues settling back in between holidays or days at school (because they weren’t attending full time). Most receive the support of an aide/ support officer. Some have found staff supportive, but others have had difficulties (as did one family that contacted us during the final evaluation).
Box 3.1 Smooth transition to mainstream school
Cathy and Michael live in South Australia with their son, Steven, who is five years old. Steven was diagnosed with autism just before he turned two.
Steven started school this year in a special class in a mainstream school. A representative from the state education department visited Steven a few times while he was in kindergarten last year. The kindergarten gradually lengthened his kindy day towards the end of the year to help Steven adjust to a full school day. The professionals supporting Steven met at the end of the year to talk about his transition to school, his development including the things he was good at (e.g. reading and writing) and his attitude and behaviour. Cathy and Michael were at the meeting, which included a state education department representative, Steven’s Panel provider, the state-based early intervention service, Steven’s carer from day care, the director of the kindergarten and the special education teacher from the primary school that Steven was to attend. Before Steven started school he visited three times to familiarise himself with the environment.
Cathy was pretty happy with the transition process and didn’t find it stressful when she dropped Steven off on his first day. Steven wants to learn, and school is going really well. A representative from the state education department regularly visits the school to see how Steven is coping.
Box 3.2 Difficult transition, but things are okay now
Tom attended early intervention pre-primary for three days per week, and spent the other two days in mainstream. His mother, Jill, says this didn’t work. There were discipline issues and the mainstream teacher, who did not have any training or experience in autism, was not skilled in handling Tom. The mainstream school implemented a psychiatric test on Tom, which Jill believes was invalid. The school psychologist answered the questions on Jill’s behalf (while she sat at the other side of the desk), and he answered incorrectly, for example, he ticked ‘cannot say the alphabet’ when Tom could do this. Jill felt very manipulated and insignificant and was unhappy with the process. Because Tom got a low score on the test, he was eligible to go to an education support centre which offers early intervention for children with disabilities.
Tom is now in Year 2 at the centre, which Jill says is pretty good overall. There are two or three assistants for the class and they concentrate on life skills. The children have high needs, which teaches Tom tolerance. Tom has progressed. The centre has helped him to get through stages, such
18
as toilet training, and there are now no problems with behaviour.
Tom attends Multi-Sports, which includes mainstream and special needs children, but Jill says that there are not enough after-school activities that are all inclusive because the children are often not wanted by the coach and by the other parents. ‘Having more programs like this would be a good use of funding. It helps with coordination, dealing with rules, dealing with injuries, being cooperative with peers.’
Box 3.3 Choosing home-schooling to increase therapy intensity
Debbi and her husband Peter live in regional Queensland with their children, two of whom (Anna and Hamish), were diagnosed with autism at age three. Shortly after their formal diagnosis – and for a little more than 18 months in total – Anna and Hamish started participating in an Early Childhood Development Program (ECDP) program. When they were three and a half years old, they enrolled in an autism-specific centre-based program for 2.5 days a week. But the centre-based autism specific program was expensive and the children’s progress was slow.
In late 2010, Peter and Debbi decided to home-school their children using the Son Rise program. Peter went to America to learn how to implement the program and the family built a classroom under their house. Anna and Hamish began intensive home-schooling in October 2010, and in February 2011 they also started doing two half-days in a mainstream Prep class.
It’s really hard for the family to meet the children’s schooling requirements. Their progress on the Son Rise program was initially good, but has now plateaued. Debbi and Peter find it hard to fit home-schooling in among other family activities. Peter has his own business and can make time for the children’s schooling during the day, but he needs to work late at night to catch up, which is stressful. The family would like Anna and Hamish to go to Prep more often, but the school is unwilling to take the children for longer unless their progress improves. Debbi says she and her family are ‘in a rut’. They have paid for the therapist has been involved with the Son Rise program for nearly two decades to come from America to consult with them in their home about Anna and Hamish’s schooling and are hoping that their children can make more progress next year.
3.2 Some differences between reported improvements for children by family type7
Reflecting the differences in access to Package services by family type, the 2011 family survey data shows some differences between reported outcomes for children.
3.2.1 Children from different states and territories
Possibly because they have less access to local Panel providers, a lower proportion of family survey respondents from the Northern Territory reported improvements in their 7 ‘Family type’ refers to demographic categories used in the survey or in the FOFMS data: location, Indigenous status, CALD status and income band.
19

children’s social and emotional skills or in their preparedness for the transition to school (15% fewer agreed their child had improved in these aspects than respondents from other states).
3.2.2 Children from regional and remote areas
A slightly lower proportion of family survey respondents from regional and remote areas reported improved outcomes for their children (5–8% fewer agreed with outcomes items than respondents from capital cities).8 This is likely associated with the lack of Panel providers in remote and some regional areas, meaning fewer children are accessing services to benefit from.
3.2.3 Children from CALD backgrounds
Family survey respondents from CALD backgrounds, overall, were about as positive about their children’s improvements as English-speaking families.9 But fewer of those with lower levels of English proficiency reported improved outcomes for their children (7–11% fewer agreed with outcomes items than CALD families with higher English proficiency). This reflects qualitative data suggesting families with lower levels of English proficiency face difficulties navigating the system and accessing services.
The CALD families we spoke to—who mostly had higher levels of English proficiency—generally described a range of positive improvements for their children including better eye contact, being more sociable, talking more or using visuals and behaving better.
3.2.4 Indigenous children
A lower proportion of Indigenous family survey respondents reported improvements in their children’s outcomes, except in communication skills (8–10% fewer agreed with other outcomes items than those that did not identify as Indigenous).10 These differences may be due to additional barriers Indigenous families face in accessing services, including the need for more assistance to navigate the system and for culturally appropriate services.
Indigenous families we spoke to were accessing either Panel providers, state-based services or a combination of both; they generally noted some improvements for their child. Some had children that had transitioned to school and had difficult experiences. A couple said their children had been kicked out of some schools or preschools; and a couple said that teachers were inexperienced.
8 Differences evident for regional and remote families in both the 2010 and 2011 family surveys.9 The pattern for CALD families overall holds in both the 2010 and 2011 family surveys.10 Differences for Indigenous families were not evident in the 2010 family survey, which only had a small number of respondents that identified as Indigenous.
20

3.2.5 Children from low income families
A lower proportion of families with low gross weekly incomes (<$600) reported improvements for their children possibly because these families are less able to top up the intervention their child receives through services they pay for privately.
21

4. Positive outcomes for parents/ carers
The Package’s education and support components are intended to help families better understand autism and link them to services and supports.
4.1 Improvements for parents/ carers
Available evidence indicates the Package is having a positive impact on most parents and carers.
Throughout the evaluation, most families surveyed reported that since accessing the Package they better understand autism and available services and feel better equipped to support their child. When asked, many also reported they were undertaking more therapy activities in the home as part of their child’s treatment plan. Some families surveyed described positive outcomes for families, for example, reduced stress (including financial), feeling supported and better understanding their child. Some of those we spoke to described similar benefits.
The HCWA package has made what could have been a very scary, daunting time in our lives, so much more of a smoother process. [Family survey respondent]
Makes our life so much easier and better quality of life [Family survey respondent]
Been less relationship stress between my husband and myself as we have not had to find as much money for therapies for our children. [Family survey respondent]
By having access to these professionals and helping my son, we are able to connect again, instead of him always being in his own world and on his own agenda. [Family survey respondent]
Table 4.1: Parent/ carer outcomes reported by families (2009–11)
% agree
Since accessing the HCWA Package 2009 2010 2011
...I am better informed about autism and how I can get help for my child/children.
79% 73% 78%
...I feel better equipped to support my child/children with autism. – 82% 84%
... I am undertaking more activities/therapy in the home as part of my child’s/children’s treatment/service plan
– 76% –
Source: Family surveys 2009, 2010, 2011
22

Panel providers interviewed also described benefits for families, including better understanding and less financial stress. A representative from one of the professional associations/ colleges described the Package as positive for parents’ mental health because it allows them to see their children progressing and affirms they’re doing the best they can for their child.
Despite positive outcomes overall, some families are reportedly stressed by making decisions about services or by their inability to access services and supports locally. Reflecting this sentiment, one family with limited local providers and who had had a negative experience with one provider said the Package had almost been more trouble than it was worth.
4.2 Some differences in reported parent/ carer outcomes by family type
As for child outcomes, there are some differences in reported outcomes for parents and carers by family type.
4.2.1 Families from different states and territories
A lower proportion of families from the Northern Territory reported being better informed about autism and how they can get help for their child (compared to other states, 15% fewer agreed with this item). This likely relates to the limited supply of local Panel providers—new members have joined more recently.
A lower proportion of families from the ACT report feeling better equipped to support their child (compared to other states, 11% fewer agreed with this item). This may be related to the fact that these families, like those from the Northern Territory, had made fewer claims for services for their child than those in other states or it may be because they began with a higher level of understanding about autism.
4.2.2 Families from regional and remote areas
A slightly lower proportion of family survey respondents in regional and remote areas reported improvements for parents/ carers (compared to capital cities, 4–5% fewer agreed with these items); the difference was greater between families in remote areas and those in capital cities.11
4.2.3 Families from CALD backgrounds
A higher proportion of families from CALD backgrounds surveyed reported improved understanding of autism and how they can get help for their child. This may be because
11 This pattern for regional and remote families, evident in the 2011 family survey, was not evident in 2010.
23

they began with a lower level of understanding of autism than other families, as qualitative data suggests some cultures may have lower awareness of autism. When asked what things would have been like without the Package, a couple families from CALD backgrounds we interviewed said they might not have had the knowledge of the different therapies or access to information. The differences in reported outcomes may also be related to the additional assistance Advisor Services reported providing families from CALD backgrounds.
4.2.4 Indigenous families
A fairly similar proportion of Indigenous family survey respondents reported improvements in parent/ carer outcomes as other families.12 But qualitative data from some Indigenous families we spoke are at odds with this—some said they need more support to navigate the service system.
Of the Indigenous families we spoke to some said they were coping better since having access to the Package and supports for their child. But one said the benefits had been limited because their child (who was diagnosed late) had very limited access to services; another said it was too difficult to manage because of the way the funding is set up.
4.2.5 Low income families
A slightly lower proportion of low income family survey respondents reported they felt better equipped to support their child (6% fewer agreed with this item than those on medium or high incomes).13
12 This pattern for Indigenous families was evident in the 2010 and 2011 family surveys.13 This pattern was evident in the 2011 family survey but not in 2010.
24

PART B: Awareness and registration
25

5. Pathways into the Package established but could be enhanced
Families can enter the system at many points; they might see a paediatrician or general practitioner, seek services from a private practitioner for a specific issue, or begin with a state-based early intervention service (sometimes for other issues). This means a range of stakeholders must be informed about the Package, or able to access information as they need it, to ensure effective referrals are possible. Families also need to be able to find information directly because some turn to the Internet when they first notice something might be different about their child.
5.1 Package promoted, but some need more information
Continued high rates of registration for the Package suggest reasonably effective information and referral pathways have been established, but some diagnosticians and other stakeholders, particularly diagnosing psychiatrists, could be better informed.
5.1.1 Information available and promoted through various activities, but there could be greater synergies between these
Information on the Package is available on the FaHCSIA, DoHA and DEEWR websites, as well as the Children with Autism pages of RCN. While the FaHCSIA website refers and provides links to DEEWR and DOHA components, DEEWR14 refers only to the FaHCSIA website and DoHA15 appears to refer to neither. RCN refers to all components but does not appear to have an overview page listing all in one place. While a few stakeholders suggested one overarching website would be useful, all websites should at least list all components and refer to other websites for further information, so stakeholders obtain the information they need from each entry point to the Package.
As the main entry point to the Package, Advisor Services have undertaken various promotional activities, which have evolved as they’ve developed more resources and established wider networks. Services are now undertaking appropriate activities, including distributing newsletters, targeting the range of stakeholder groups. National teleconferences could be used as an opportunity to share resources and learnings, particularly about working with CALD and Indigenous communities, and reduce duplication of effort.
14 http://www.deewr.gov.au/Schooling/Programs/Pages/helpingChildrenwithAutism.aspx accessed 28/11/201115 http://www.health.gov.au/internet/main/publishing.nsf/Content/autism-children accessed 28/11/2011
26

Promotional activities
Paediatricians: Many Advisor Services have developed paediatrician contact lists to contact and inform these stakeholders about Package registration requirements. Some lists may also include diagnosing psychiatrists. In some states, some diagnosticians refer directly to Advisor Services. Once established, connections with paediatricians need to be maintained, particularly in places like the Northern Territory where staff turnover is high.
General practitioners: Some Advisor Services are distributing information to GPs; the NSW Service has been in contact with GP networks.
State services: Some Advisor Services reported using state government service forums to promote the Package.
Service providers: Some Advisor Services are promoting the Package through service providers families may come into contact with.
CALD organisations: Over time, Advisor Services have increased their connections with CALD organisations, for example, the Queensland Service made links with a Vietnamese support group, the Western Australian Service established a link with the Ethnic Disability Advocacy Centre, and the Tasmanian Service has linked with Multicultural Resource Centres (MRCs). The Victorian Service has changed its original model (a CALD and Indigenous links position); they now have a group that meets fortnightly, providing greater continuity through staff leave or turnover.
Indigenous organisations: Advisor Services have increasingly focused on links with Indigenous communities over time, for example, the ACT Service connected with Indigenous preschools and organisations; the NSW Service consulted with the Aboriginal Early Childhood Advisory Group and distributed information kits to preschools with a high proportion of Indigenous children.
Schools/ preschools/ early childhood education: Some Advisor Services have connected with these stakeholders; schools can also find out about the Package through the DEEWR-funded Positive Partnerships.
Other promotional outlets: Playgroups, health services, community services, councils, hospitals, Carers associations, parent groups, autism association and information sessions. The Victorian Service developed a short DVD and more recently promoted the Package through Facebook and Twitter.
DoHA funded online training modules for professionals developed through the professional colleges/ associations. While they initially promoted the Package through sessions for diagnosticians and by providing information through the professional colleges/ associations, the website is now the main mechanism for promotion.
5.1.2 Diagnosticians surveyed generally want more information about the Package
Diagnosticians have a key role in ensuring families with children with autism are connected with the Package. Among those surveyed, a higher proportion of paediatricians were well-informed about the Package and used Advisors as a source of information than psychiatrists. This may relate to Advisor Services links with
27

paediatricians: they have established paediatrician contact lists and 80% of Advisors surveyed agreed they have regular contact with referring paediatricians. While diagnostician survey data suggest better linkages are needed with diagnosing psychiatrists in particular, many paediatricians felt ill-informed about Package components, suggesting stronger links are needed with all diagnosticians at the Package level (see Appendix 2 for data tables). Caution should be taken in extrapolating these findings to the broader population because the sample is not representative, but some other stakeholders also suggested diagnosticians could be better informed.
Diagnosticians surveyed were more likely to nominate word of mouth as a source of information about the Package (61%) than any other source; and a small proportion of psychiatrists indicated they had not seen any material about the Package before receiving the survey. Overall, word of mouth was also the most common source of information about local Panel providers (51%) (see Appendix 2 for data tables).
Enhancing communications with diagnosticians
One of the main suggestions diagnosticians had for improving the Package was increasing communications (with their profession and other stakeholders). They suggested a wide range of ways to improve communication with their profession, most commonly through emails or newsletters, better links with Advisors (e.g. meetings, visits, information about service options and Advisors liaising between referrers and service providers) and regional/ local area networks or local coordinator positions. Other (slightly less common) suggestions included communication through professional bodies, distributing Panel provider lists and updates, centralising information on one website, information seminars/ workshops (through the colleges, online, in the evening or as dinner sessions) and providing information specific to diagnosticians. Other suggestions related to confusion about Medicare items.
A representative from the Royal Australian College of Physicians, Division of Paediatric and Child Health, suggested that while paediatricians’ understanding of the Package had increased over time, it would be useful to establish lines of communication between FaHCSIA and the Division, which could then distribute information to members. One FaHCSIA State and Territory Office (STO) we spoke to said connections should be made with diagnosticians at multiple levels of the Package for most effect.
A few diagnosticians mentioned they’d like handouts for parents (including explanations of what the different types of therapists do); they could potentially use fact sheets on the Children with Autism pages of the RCN website if made aware of these.
5.1.3 General practitioners could have more information
General practitioners (GPs) also need to be aware of the Package to make effective referrals.
28

The Royal Australian College of General Practitioners (RACGP) has developed training modules on autism for GPs (that refer to the Package) and there are plans to include a module on autism in the updated curriculum for Australian General Practice. The RACGP representative we spoke to, however, suggested GPs could still use more information on autism, as did a GP presenting at the Asia Pacific Autism Conference (APAC) in 2011.16 Reflecting this, one Indigenous family we spoke to said GPs dismissing parents’ concerns could be a barrier to diagnosis; a second said GPs need to be more aware of autism. GP awareness was also a minor issue raised in the diagnostician survey.
Enhancing communications with GPs
GPs have different information needs to paediatricians; they need to be aware of the signs of autism, able to make appropriate referrals and able to inform parents about different types of intervention. But, given the volume of information they must deal with, it’s important to recognise that GPs need access to information easily and as needed.
Suggested potential avenues for communication with GPs include:
via the RACGP (including the RACGP’s weekly newsletter and RACGP general publications)
communications to regional GP training providers online education.
Autism Advisors could also inform families about the online GP training so they can inform their GPs.
Printed resources for parents would also be a useful resource for GPs.17 The Queensland Advisor Service has developed brochures for paediatricians to give to families that might also be useful for GPs; GPs could also be advised of the fact sheets available on the Children with Autism pages of the RCN website.
5.1.4 State-based services generally aware
State-based services need some knowledge of the Package so they can refer families that have not heard about it. Some are also Panel providers and thus well-informed about the Package. The eight state-based services we spoke with that were not also providing Panel services (some of which are directly delivered) had varying levels of understanding of the Package. One suggested having an Autism Advisor visit to explain the Package to staff would be useful now it is more established. Another said there is already enough readily available information about the Package. One would have liked information flyers for families.
16 Best, J., 2011, Do GPs have knowledge gaps in Autism, and can this be addressed?, Asia Pacific Autism Conference 2011, Perth Western Australia17 Advice from the RACGP representative.
29

5.2 Diagnosticians and allied health professionals the main source of referrals to Advisor Services
Over three-quarters of diagnosticians surveyed (78%) agreed they regularly inform families about Advisor Services. But, psychiatrists surveyed were far less likely than paediatricians to do this, reflecting a lower level of awareness about the Package (see Appendix 2 for data tables).
Advisor Service referral data (March–June 2011) shows medical practitioners as the main source of referrals overall, though the pattern varied between states given their different service systems. For example, in South Australia the Autism Association is the main referral source as it has a role in providing autism diagnoses (table 5.1). Overall, allied health professionals were also a significant source of referrals to the Package.
The state-based services we spoke to said they generally inform families about the Package or direct them to appropriate sources if the family is not already aware of the funding—they show up as a referral source for a small percentage of families.
Table 5.1: Sources of referrals to Advisor Services (1 March to 30 June 2011)
Referral source SA NSW* NT Qld Vic^ WA ACT Total#
Medical Practitioner—Psychiatrist, Paediatrician, GP 25% 45% 100% 89% 47% 8% 14% 50%
Allied health professionals and/or multidisciplinary team—Psychologist, speech therapist, Occupational Therapist 34% 43% 0% 0% 29% 31% 18% 28%
State or Territory Autism Association 22% 6% 0% 1% 7% 7% 18% 7%
Other autism/ disability organisation 10% 3% 0% 3% 2% 20% 0% 4%
Friend/ relative/ other parent 4% <1% 0% 1% 6% 1% 5% 3%
State or territory government service 1% 2% 0% 0% 2% 17% 32% 3%
FaHCSIA website and/or HCWA components—RCN website, Early Days Workshops, PlayConnect 2% 1% 0% 3% 4% 0% 9% 2%
Childcare/ preschool/ education 1% 0% 0% 0% 3% 2% 0% 1%
Internet 0% 0% 0% 2% 0% 7% 0% 1%
Other 0% 0% 0% 0% <1% 7% 5% 1%
Media 1% 0% 0% 0% <1% 0% 0% <1%
Total 100% 100% 100% 100% 100% 100% 100% 100%Source: Advisor Service reports (1 March to 30 June 2011) * For NSW referral sources unknown for 619 clients for the period^ For Victoria some have multiple sources recorded as 568 clients registered# Excludes Tasmania as no report provided
Families might miss out or be delayed in accessing the Package if diagnosticians or other professionals are unaware of it. Only a very small proportion of families involved in the evaluation noted that they stumbled across the Package or information by chance; they suggested a need to enhance information and referral pathways.
30

Families with a private sector diagnosis are less likely to be informed about state-based and Package services according to a representative of one of the state departments. One family contacted during the final evaluation said their diagnosing psychiatrist did not inform them about the Package; they eventually heard about it from their paediatrician who provided no information besides the number for the Autism Advisor Service, which turned out to be incorrect.
Health care professionals need to be made more aware of the system and funding. I was made aware of assistance after we had been to the psychologist and number of times [sic], the paediatrician and occupational therapist. It was not until my child started speech therapy that we were made aware of assistance. By which stage I had already exhausted my finances. [Family survey respondent]
5.3 Diagnosticians and Advisor Services refer families directly to Panel providers
Two-thirds (67%) of diagnosticians surveyed agreed they regularly refer children to local Panel providers. Again, psychiatrists surveyed were far less likely than paediatricians to make these linkages (see Appendix 2 for data tables).
Paediatricians were one of the common sources of referrals for Panel providers interviewed. Other referral sources included Advisors, the consortium lead (though some noted they receive no, or very few, referrals from their lead agency), word of mouth or state-based services.
While paediatricians were generally a strong referral source, several Panel providers we spoke to said paediatricians need to be better informed about the Package. Some claimed there are some paediatricians not referring or making inaccurate referrals because they lack understanding.
[Paediatricians and psychiatrists] need to provide parents with information about getting in touch with the Autism Advisors. We are seeing people coming through our door who meet the criteria for HCWA but who don’t know anything about it because the paediatrician or the psychiatrist hasn’t said anything about it when the diagnosis is given. [Panel provider interviewee]
I think there needs to be better information for GPs and paediatricians about the Package…I got a referral from a paediatrician the other day for a 13-year-old boy and the paediatrician had told them about HCWA when clearly they were not eligible. [Panel provider interviewee]
31

6. Registrations now more in line with expectations but some children remain under-represented
The Package aims to ensure all children with autism and their families from around Australia can benefit from increased access to support and services. To access early intervention services children must have a formal diagnosis of autism and register for the Package before their sixth birthday.
6.1 The Package has achieved good reach
Between July 1 2008 and November 3 2011, 16,967 children were registered for the Package. Of these 12, 702 are still under seven years—equivalent to 0.7 % of Australian 0–6 years.18
Figure 6.1: Client registrations July 1 2008–November 3 2011
Registered clients by year from July 1 2008 to November 3 2011 are:2008-2009: 4,3462009-2010: 5,360 2010-2011: 5,3692011-2012*: 5,676
18 This figure is calculated based on 2006 Census population data of 0–6 year olds, N=1,780, 545.
32

Cumulative registered clients from July 1 2008 to November 3 2011 are:2008-2009: 4,3462009-2010: 9,7062010-2011: 15,0752011-2012*: 20,751
Source: FOFMS data July 1 2008–November 3 2011*To estimate the number of registered clients for 2011–2012 we extrapolated based on the figures available for the first four months.
Stakeholders are concerned the Package is leading to an increase in autism diagnoses and, in some cases, misdiagnosis. Yet registration numbers are in line with autism prevalence rates cited by Prior and Roberts (though that figure is based on children aged 0–8 years, so the comparison is indicative only). The Medical Research Council of the United Kingdom (2001) found that autism spectrum disorders affect approximately 60 per 10,000 (or 0.6 %) children under eight years old and recent international research suggests an average prevalence of 1 in every 175 children (Insel, 2006)19. Registrations are below the prevalence rate of 1 in 100 cited as the ‘best estimate’ of prevalence in recent studies referred to in the context of developing an autism strategy for Scotland. 20
While 1,000 more clients were registered in 2009–10 than in 2008–09, this plateaued in 2010–11. This suggests that the substantial growth between the first two years of operation was not part of a longer term trend. Rather, it was linked to the eligibility age expanding to a child’s seventh birthday and better established referral pathways.
Because eligibility is based on a formal diagnosis of autism, there is a need to consider how the Diagnostic and Statistical Manual of Mental Disorders V (DSM V), when introduced will affect autism diagnoses and eligibility for the Package.
6.2 Obtaining a timely diagnosis a potential barrier to registration
Besides issues with referral pathways outlined in the previous chapter, the evaluation identified some barriers to registration associated with the eligibility requirements.
Diagnostic sector capacity
The capacity of the diagnostic sector may also be a barrier. Throughout the evaluation a range of stakeholders—including diagnosticians, Autism Advisors21 Panel providers22,
19 Prior, J. and Roberts, M., 2006, A Review of the Research to Identify the Most Effective Models of Practice in Early Intervention for Children with Autism Spectrum Disorders, report for DoHA, July 200620 Mental health of children and young people in Great Britain, 2004 (Green et al, 2005) Office of National Statistics cited in Scottish Government, 2010, Towards an Autism Strategy for Scotland, http://www.scotland.gov.uk/Publications/2010/09/07141141/2 21 Only 21% of Advisors surveyed in 2010 agreed there were sufficient diagnosticians in their state.22 Only 35% of Panel providers surveyed in 2010 agreed there were sufficient diagnosticians with expertise in autism in their local area,
33

and some families—have raised concerns about the capacity of the diagnostic workforce. While a slightly higher proportion of diagnosticians surveyed in 2011 agreed there were sufficient diagnosticians in their local area than did so in 2011, this may be related to the different survey samples rather than a growth in capacity. In any case, less than one-third agreed (32%) (table 6.1).
Table 6.1: Diagnosticians’ views on capacity
2009 2011
There are sufficient diagnosticians working in my local area to give children a timely diagnosis of autism 16% 32%
There is a need for more training in diagnosing autism – 96%Source: 2011 and 2009 Diagnostician surveys.
While the DoHA Medicare items for assessment and planning are intended to overcome long waitlists for public sector diagnostic services—and they had helped some families we spoke to over the course of the evaluation—anecdotally, some private sector waitlists are also long. Among diagnosticians surveyed (public and private), waiting times for initial appointments varied from less than four weeks to over six months (table 6.2). Access to services, particularly public but also private, and to allied health professionals to provide supporting assessments was the most common barrier diagnosticians identified to obtaining a diagnosis. Several noted an increase in referrals for diagnosis as one of the unexpected consequences of the Package. Waiting times can also be compounded by the need for a paediatrician to trigger referrals to other professionals.
Table 6.2: Average wait time for initial appointment with diagnostic service
Time* No. % diagnosticians
Less than 4 weeks 18 20%
Between 1 and 2 months 25 28%
Between 2 and 3 months 17 19%
Between 3 and 6 months 23 26%
Over 6 months 7 8%
Total** 90 100%***
Median (number of weeks) 8Source: 2011 Diagnostician survey.*Where respondents provided a time range, the average was used.**9 blank responses.*** Does not sum to 100 due to rounding.
Diagnosticians also commonly raised cost as a barrier to diagnosis—while the Medicare items cover private diagnostic assessments, some survey respondents said some families would have difficulty paying the gap. Reflecting this issue, a representative from one professional college/ association suggested it would have been more effective to
34
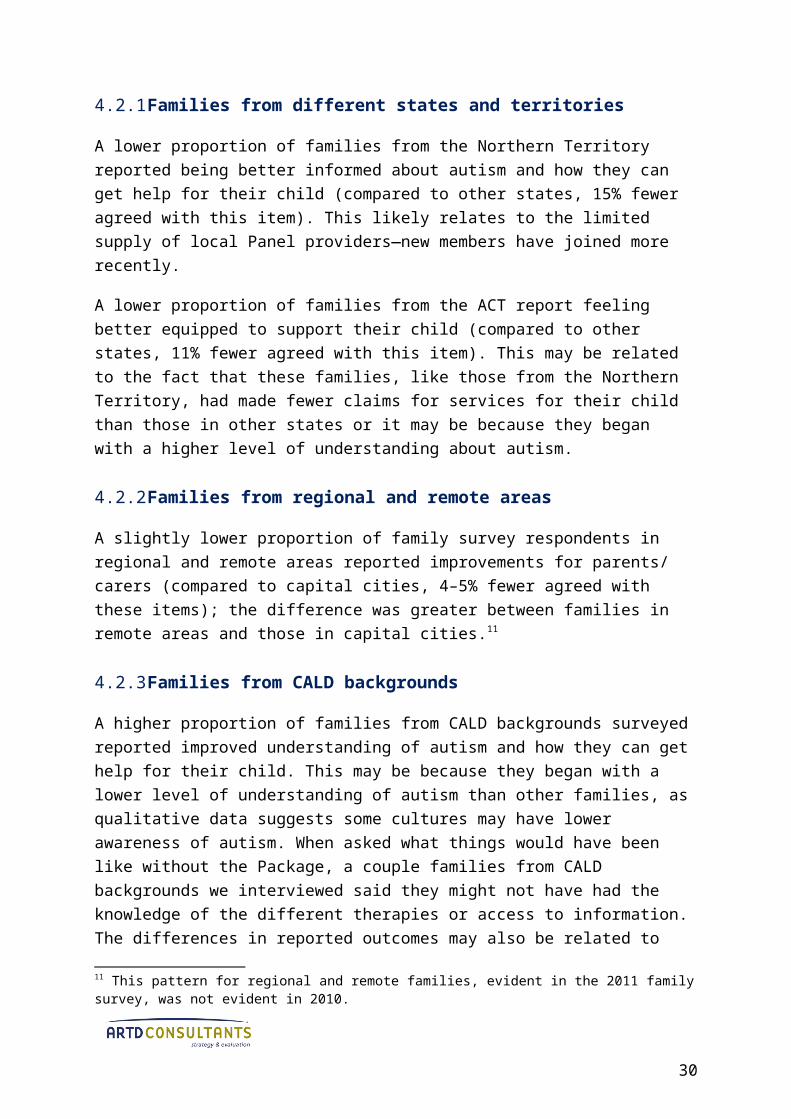
enhance existing diagnostic services than provide Medicare rebates because these provide a one-stop-shop and do not cost families.
Almost all diagnosticians surveyed agreed there is a need for more training in diagnosing autism despite autism education modules being available through the RACP (developed with DoHA funding).
Other barriers
If families are unaware of autism or expected developmental milestones, they may be less likely to pick up on the signs and seek advice. In these cases, signs of autism might not be identified until the child starts school and they are too old for the Package. Qualitative data suggests Indigenous communities may have lower awareness levels. But a couple of families that contacted us in the final evaluation said general awareness about how to deal with problems in the early stages is low. When these families first noticed something different about their child, they were unsure who to contact. One hadn’t thought of contacting a paediatrician for an otherwise healthy child. These families suggested a need for mandated screening for autism, but had different views on when and how this should occur: one suggested checks by a paediatrician at age two, the other checks by a child health nurse at age 12–18 months.
Some stakeholders say willingness to seek a label can also impact on access. One family that contacted the team in the final evaluation suggested the system should allow access to services without a label for children under three because it’s hard to ‘lump’ families with a label at such a young age and because some mothers may not follow through with obtaining a diagnosis if the child’s father is unwilling.
Others point out that children with Asperger’s Syndrome may be diagnosed later because the signs might only become apparent when they have greater interactions with other children at school. One state department representative said some children, particularly those for whom the signs are less evident, may not be picked up until they are at school, and a second said children with Pervasive Developmental Disorders Not Otherwise Defined (PDDNOS) may not be picked up until later.
Of the diagnosticians surveyed, a few also suggested some families would have greater difficulties obtaining a diagnosis—including CALD families, those in which parents have their own issues, those that lack supports and those with financial difficulties. One claimed parents with a history of issues with government departments may choose not to register and another that parents of children with Asperger’s were choosing not to register.
Other barriers to diagnosis identified by diagnosticians included the referral processes, not knowing where to go and the need to access multiple services, the complexity of the diagnosis, lack of tools and lack of agreement among professionals, parent denial of the diagnosis, lack of awareness (among GPs, school staff and parents), lack of local services
35

and stigma associated with autism. Only a handful of diagnosticians said there were no particular barriers to diagnosis.
Overcoming the barriers to diagnosis
Diagnosticians’ suggestions to overcome these barriers varied—the most common was to boost the professional workforce (for example, by providing incentives), followed by more public diagnostic services and more education either for professionals diagnosing, or for the public (for parents, childcare and school staff).
Other (less common) suggestions include better rebates for private services such as more Medicare items for allied health assessments, more flexibility around the multidisciplinary requirement (but one also suggested more stringent diagnostic criteria), increasing access in regional areas (including providing transport to families, providing outreach or using tele-health), improving referral pathways, providing a one-stop-shop, and better information on where to get a diagnosis. Other suggestions related to the Medicare items.
6.3 Some improvements but some children remain under-represented
Advisor Services have developed strategies for working with families from regional and remote areas and those from CALD backgrounds and Indigenous families, all of whom may face barriers to registering. While there have been improvements in rates of registration for some children over the years of operation to date, some remain under-represented.
6.3.1 Families from all states and territories are registering their children
On the whole, the spread of registered clients broadly reflects the population data for children 0–6 years in each state/ territory. But children from Victoria remain over-represented and those from Western Australia and the ACT under-represented assuming similar prevalence rates in all states and territories. The reason for the ACT’s under-representation is unclear. For Western Australia, it may relate to long waiting lists for the multidisciplinary diagnosis required to access state-based services and difficulties families in regional and remote areas have accessing diagnosticians. In their recent report to FaHCSIA the Western Australia Advisor Service noted processing registrations can take longer because of the difference between diagnostic criteria for state-based services and the Package.
36

Table 6.3: Registered clients by state compared with 0–6 years population
2008–09* 2009–10 2010–11 2011–12** Population 0–6 yrs
N=4,346 N=5,360 N=5,369 N=1,892 N=1,779,010
% % % % %
ACT 1% 1% 1% 1% 2%
NSW 32% 37% 32% 32% 33%
NT 1% 1% 1% 1% 1%
Qld 15% 16% 20% 20% 20%
SA 9% 7% 7% 7% 7%
Tas 2% 2% 2% 2% 2%
Vic 30% 31% 31% 32% 24%
WA 11% 6% 7% 6% 10%
No data/ other classification
N=1535
Source: FOFMS July 1 2008–November 3 2011. ABS Census 2006.*When the Package was first introduced only children aged 0–6 yrs were eligible to use funding.**Only four months of data is available for the 2011–12 financial year.
Overcoming barriers
While data suggests registrations of children from the Northern Territory are broadly in line with expectations, those in remote areas can face greater barriers to accessing a diagnostic service. Some state department representatives from the Northern Territory said the Package age limit is too low to benefit local families because it’s difficult for many to obtain an early diagnosis, particularly outside Darwin. Some Northern Territory stakeholders have also claimed there is some reluctance to provide early diagnoses among medical professionals there. One STO stakeholder suggested that additional Advisors with greater capacity to travel to communities might be seen as ‘outsiders’, but they could help by enabling the service to reach these communities more often and catch those falling through the gaps.
6.3.2 Improved access for children in inner regional areas, but not for those in outer regional and remote areas23
Families from regional and remote areas were under-represented when the Package was first introduced, assuming similar prevalence rates across all areas. While there has been an increase in access for children from inner regional areas, children from outer regional, remote and very remote areas appear to be slightly under-represented (table 6.4).
23 The location (ARIA+) data in this report replaces the analysis in the mid-term report when we were unable to obtain data from FaHCSIA in the ARIA+ format. Location data in the mid-term report should no longer be referred to.
37

Table 6.4: Registered clients by location (ARIA+) compared with 0–6 years population
2008–09* 2009–10 2010–11 2011–12** Population 0–6 years
N=4,342 N=5,356 N=5,364 N=1,892 N=1,778,175
% % % % %
Major city 77% 69% 70% 70% 68%
Inner regional 15% 22% 21% 20% 20%
Outer regional 7% 8% 8% 8% 10%
Remote 1% 1% 1% 1% 2%
Very remote 0% 0% 0% 0% 1%
No data/ other classification
N=4 N=4 N=5 N=0 N=2,366
Source: FOFMS July 1 2008–November 3 2011. ABS Census 2006.Table notes: location classifications based on Accessibility/Remoteness Index of Australia+ (ARIA+).*When the Package was first introduced only children aged 0–6 yrs were eligible to use funding.**Only four months of data is available for the 2011–12 financial year.
Overcoming barriers
Some differences are evident between Advisor Services’ models for engaging families in regional and remote areas. In Queensland Advisors are located in regional areas; NSW has an Advisor located on the Far North Coast as well as Advisors in Sydney; but Services generally cover regional areas with a fly/ drive in and out model, with Advisors based in capital cities. Victoria has held regional road shows and South Australia has recently been approved to run awareness raising sessions in regional areas. The Queensland Service noted that supporting regional families can be a challenge as they cannot visit all families due to time and budget constraints, and not all families have Internet connections. The STO manager of one Advisor Service said the Service had had good coverage of regional areas and connection with families, while the manager of another said the Service’s face-to-face coverage of regional areas had, at times, been limited by staff capacity. One STO suggested there may be a need for different funding models for Advisor Services in remote areas to recognise the extra difficulties and time needed to cover these areas.
Regardless of Advisor Service models, the main concerns for families in remote and some regional areas are the lack of local diagnosticians and travel issues including costs. Recent changes to the Medicare items to allow multiple claims on one day are positive for families travelling to access a diagnosis. But as yet, it’s unclear whether this will be enough to facilitate higher levels of registration.
The lack of local Panel providers available may also be a disincentive to registering.
38

6.3.3 Children from CALD backgrounds remain under-represented
Children from CALD backgrounds (using language other than English spoken at home as a proxy measure) make up 14% of the 0–6 years population, but they have fluctuated between a low of 9% of registered clients in 2008–09 and a high of 12% in 2009–10. This reflects feedback from Advisor Services, CALD stakeholders and some state department representatives that some CALD families face barriers to accessing a diagnosis and registering their children.
Figure 6.2: Registered clients that speak a language other than English at home compared with 0–6 years population
Percentage of clients that speak a language other than English at home compared with 0-6 years population are:
2008-2009Other language: 9% (n=394)Other language – 2006 population data: 14%
2009-2010: Other language: 12% (n=587)Other language – 2006 population data: 14%
2010-2011Other language: 10% (n=530)Other language – 2006 population data: 14%
2011-2012:Other language: 11% (n=202)
39

Other language – 2006 population data: 14%
Source: FOFMS July 1 2008–November 3 2011. ABS Census 2006.Notes: Languages other than English include Australian Indigenous languages. Proportions calculated exclude 662 clients where language spoken at home was not stated.*When the Package was first introduced only children aged 0–6 yrs were eligible to use funding.**Only four months of data is available for the 2011–12 financial year.
Looking at all client data to date, CALD families have been under-represented in all states and territories, but particularly in the Northern Territory, South Australia and Queensland (Table 6.5).
Table 6.5: CALD children registered by state (July 2008–November 2011), compared to 0–6 years population
StateRegistered CALD clients
CALD population 0–6yrs*
(n=235,279)
n % %
NT 5 4% 29%
NSW 909 16% 18%
Vic 559 11% 18%
ACT 22 11% 13%
WA 89 7% 10%
SA 40 3% 10%
Qld 87 3% 7%
Tas 2 1% 4%
Total 1713 11% 14%
No data/ not stated N=662 N=117,458Source: FOFMS July 1 2008–November 3 2011. ABS Census 2006.Notes: Languages other than English include Australian Indigenous languages.*Excludes those living in other territories.
Overcoming barriers
On the whole, data suggests that while Advisor Services have made efforts to engage CALD organisations and some have translated resources, other strategies are needed at the Package level to ensure equity for these clients.
Awareness and information resources
Given that lack of translated information resources was the main barrier identified for CALD families (particularly by Autism Advisors), translating information resources into community languages at the Package level is the most logical first step to improving awareness in CALD communities. Before this occurs, Advisor Services should be consulted about existing materials, for example, the NSW Service had a CALD subcommittee sourcing available translated materials and the Queensland Service had translated some material into Vietnamese. One CALD stakeholder we spoke to also
40

emphasised the need for materials in plain English because some families have literacy issues.
Some stakeholders suggest that some cultures have lower levels of awareness/ understanding of autism. One CALD stakeholder and a state department representative noted that some cultures don’t have a word for autism. In most CALD families we spoke to (n=11), the parents were the first to notice something was different about their child (generally when the child was aged between 18 months and 3 years). Yet some were unaware of autism before their child was diagnosed, and some only had ‘a little’ knowledge. Most said there is little awareness of autism in their community (either here or in their country or both), but because we only interviewed a small number of families the extent to which this holds true across the CALD community is unclear.
The families had a range of suggestions for distributing information but there was little or no overlap between them. Suggestions included through the media and advertisements, websites, schools, community playgroups, churches and word of mouth. One parent, who didn’t notice the signs of autism herself, suggested providing brochures for new parents outlining child development milestones to help parents identify issues. This is the approach Autism Spectrum Australia (Aspect) has taken in raising awareness in Indigenous communities for their Talking up Autism project (funded through the DEEWR Parental and Community Engagement (PaCE) Program).
One CALD stakeholder suggested using mainstream venues, such as schools and childcare centres, as a way to access all families. This stakeholder also emphasised the need for discussion with community groups (as Advisors are currently doing) because a flyer gives information but doesn’t reassure. Some stakeholders noted potential to distribute information through Multicultural Resource Centres (MRCs) for newly established communities and through cultural organisations for more established communities. A second CALD stakeholder suggested advertising in community languages on SBS radio.
Obtaining a diagnosis
Barriers to obtaining a diagnosis may also prevent uptake.
Several CALD families we spoke to said their husbands were in denial about the diagnosis initially; one said that her husband still is. A couple noted other family members were also in denial—these had chosen not to tell friends or wider family about the diagnosis, though one is planning to do so once they know more and are more comfortable with it. Because we interviewed only a small number of families, the extent to which this is an issue for CALD families more broadly is unclear. In any case, it did not actually stop these families obtaining a diagnosis. And it was an issue also raised by a couple of English-speaking families that contacted the team during the final evaluation. One Advisor noted this was an issue for one family she’d supported, but the father eventually ‘came around’ and she believes this was in part because the funding depended on a diagnosis.
41

CALD families suggested barriers that might prevent others from obtaining a diagnosis, including a) stigma attached to disability (which CALD stakeholders also mentioned) b) family members’ denial, c) thinking the child will get better and d) religious beliefs.
CALD stakeholders suggested other barriers, including lacking the means to obtain a diagnosis and, in the case of some newly arrived communities, having experienced trauma (because some developmental issues may be, or be seen as, associated with trauma). One said that in younger children, families might just dismiss the signs of autism as behavioural issues—meaning they may not receive a diagnosis in time. A state department representative said some diagnostic tools may not be culturally appropriate.
A CALD stakeholder emphasised the importance of not making generalisations across all cultural groups, as did a CALD stakeholder presenting at the APAC conference 2011.24
6.3.4 More Indigenous families are now registering their children
While children from Indigenous families were significantly under-represented in the first year of operation, and remained under-represented in the following two years, the gap has been closing steadily (figure 6.3). The first four months of data for 2011–12 suggest registrations for Indigenous children have reached expected rates. While this figure continues an upward trend, it should be interpreted with caution because it is associated with a spike in Indigenous registrations in August and September 2011, followed by a decline in October 2011. Over the years of operation to date, there have been peaks and troughs in monthly registrations of Indigenous children at different times. Caution is also needed in interpreting the data overall because there are 1,977 clients for whom Indigenous status was not stated or who declined to answer.
While the overall trend in Indigenous registrations is positive, qualitative data suggest Indigenous families may still face a range of significant barriers to registering.
24 Perepa, P., 2011, Multiculturalism: What has it got to do with providing services? University Of East London, Asia Pacific Autism Conference 2011, Perth Western Australia
42

Figure 6.3: Registered clients that Identify as Indigenous compared with 0–6 years population
Percentage of registered clients that identify as Indigenous, compared with 0-6 years population are:
2008-2009Indigenous status: 1.8% (n=71)Indigenous status – 2006 population data: 4.7%
2009-2010Indigenous status: 3.8% (n=191)Indigenous status – 2006 population data: 4.7%
2010-2011Indigenous status: 4.1% (n=186)Indigenous status – 2006 population data: 4.7%
2011-2012Indigenous status: 5% (n=72)Indigenous status – 2006 population data: 4.7%
Source: FOFMS July 1 2008–November 3 2011. ABS Census 2006Notes: Proportions calculated exclude 1882 clients for whom Indigenous status was not stated and 95 that did not wish to answer.*When the Package was first introduced only children aged 0–6 yrs were eligible to use funding.**Only four months of data is available for the 2011–12 financial years.
In client data to date, Indigenous children have been most under-represented in the Northern Territory in comparison to the 0–6 yrs population. But they’ve also been under-represented in Queensland, Tasmania, Western Australia and South Australia.
43

Table 6.6: Indigenous children registered by state (July 2008–November 2011), compared to 0–6 years population
State Registered Indigenous clients Indigenous population 0–6 yrs* (n=79,100)
n % %
NT 12 15% 43%
Qld 91 4% 7%
Tas 15 5% 7%
WA 36 3% 6%
NSW 260 5% 4%
SA 36 3% 4%
ACT 3 2% 2%
Vic 67 1% 1%
Total 520 3.5% 4.7%
Not stated/ Declined to answer N=1977 N=105,022Source: FOFMS July 1 2008–November 3 2011. ABS Census 2006.*Excludes those living in other territories.
Overcoming barriers
On the whole, data suggests Advisor Services’ efforts to engage Indigenous organisations and communities, and the cultural awareness training some have undertaken25, are helping ensure equal access for Indigenous children. But these strategies must continue if trust is to be maintained and if families are to overcome the barriers to registering. Some STOs and the South Australian Service also suggested the need for strategies at the Package level to ensure equity for these clients. One STO said a different model is needed if Autism Advisors are to engage Indigenous families.
Awareness and information resources
Qualitative data suggests Indigenous communities may have lower levels of awareness of autism. Indigenous families we spoke to (n=10) reported noticing the signs that something was different about their child at different stages—some when their child was very young; others not until their child was closer to three years old. Over half of these families said their child had other problems—including physical issues, hearing problems, seizures and difficulties sleeping—that put them in contact with medical services. When signs of autism became evident, some thought or had others tell them that these were signs of other issues, including intellectual disability, Attention Deficit Hyperactivity Disorder (ADHD), deafness and Tourette’s. One parent said she just thought she had ‘one of those weird kids’.
These families generally had low levels of awareness and understanding of autism before their child was diagnosed. Some said the Indigenous community generally lacks awareness of autism (as did some other Indigenous stakeholders)26, but others said
25 The WA, SA and NSW Services reported staff training in working with Indigenous families in November 2010–June 2011 reports.26 Indigenous stakeholders consulted in 2010 and 2011.
44

understanding is growing. When asked about potential barriers to diagnosis for Indigenous children, a couple families said lack of awareness of the signs of autism would be one, another that children for whom the signs are less prominent might go unnoticed. One Indigenous stakeholder we spoke to noted that parents generally might miss the signs compared with normal development—an issue that Aspect’s Talking Up Autism project addresses.
Stakeholders saw a need for more information on autism, though one Indigenous stakeholder said lack of information isn’t the problem; the way information is presented is. Information needs to be in plain English and relevant to Indigenous families (including pictures of Indigenous families). The SNAICC and PRC research and one Indigenous stakeholder we spoke to in 2010 suggested distributing information through Indigenous services and childcare centres. Indigenous stakeholders consulted in 2011 suggested mainstream avenues for distributing information and emphasised the importance of not only providing information but establishing strengths-based relationships and trust. Staff have a key role in forming these relationships.
The families we spoke to suggested varying potential avenues for distributing information. These included pamphlets distributed in the community and potentially in doctors’ waiting rooms and childcare centres. Other suggestions included advertising, forums, and information on the Internet or making information available through Aboriginal Medical Services, mothers’ groups and GPs. A couple suggested training childcare staff and teachers to be able to pick up on the signs (the former was also supported by families SNAICC and the PRC interviewed).
Obtaining a diagnosis
Anecdotally, Indigenous children may miss out on Package services because they are often diagnosed later.
Indigenous families consulted suggested varying barriers to diagnosis including not knowing who to go to after noticing the signs of autism (as did two non-Indigenous parents that contacted us), peer pressure, having to fill in lots of forms and the ‘intimidating’ assessment process, as well as a lack of Indigenous-specific doctors and the costs involved (as other stakeholders noted). Other barriers were similar to those raised by stakeholders generally: long waiting lists, difficulties getting referrals to the right specialists and professionals dismissing concerns.
According to one Indigenous stakeholder, some Indigenous families are in crisis mode, preventing them from seeking a diagnosis. One option for dealing with this might be to support Indigenous families in accessing a diagnosis. This might mean having services follow up with Indigenous families who contact them because things can fall off the agenda for families with significant issues. Some services providing outreach to remote communities in the Northern Territory27 noted that the high burden of other health issues can keep autism off the radar or prevent it being picked up.
27 NT Outreach services consulted in 2010.
45

Some Indigenous families may be uncomfortable with mainstream services or reluctant to approach an Indigenous service staffed by people they know. In Victoria and the Northern Territory, education-funded services include an Indigenous team. NSW recently funded a small project to raise awareness of disabilities in Indigenous communities with funded positions in Aboriginal Child and Family Services.
The Indigenous stakeholders, one of the STOs and one state department representative noted the importance of Indigenous staff in building relationships with Indigenous families, but the SNAICC and PRC research suggested either using Indigenous staff or staff that have had cultural awareness training. The PRC and SNAICC research, the Indigenous stakeholders we spoke to and some state department representatives emphasised the need to build relationships with Indigenous organisations and community (as Advisor Services are currently doing). Only one parent specifically mentioned they would have liked an Indigenous Advisor, but several others also mentioned they’d like Indigenous service staff generally because they would be easier to talk with or would better understand their situation.
Families may be reluctant to seek a label for their child or, given past negative experiences, may be concerned services will perceive them as ‘bad’ parents or that their child will be removed. One Indigenous stakeholder noted difficulties associated with the autism label: on one hand some families might have fears of accessing a label associated with fears of having their child removed, on the other, it’s important that families not find reasons to ignore the issue. One state department representative said assessment tools may not be culturally appropriate and some may have culturally different notions of disability.
On noticing something different about their children, families we spoke to sought help from different sources—paediatricians, GPs, Aboriginal Medical Services and child psychologists. They had mixed experiences of the diagnostic process: for some it was smooth, some faced longer waiting lists, some found doctors would not provide referrals or were reluctant to provide a formal diagnosis. Two received support from an Aboriginal Medical Service. A couple of the families had quite negative experiences of the diagnostic process. One was told their child had ADHD—this parent said the doctor didn’t think their child was ‘bright because his parents weren’t’. Another family was reported to Community Services’ Brighter Futures program, but were unsure why—the parent described this as ‘awful’, and like being put ‘under a microscope’.
Like other families these parents had differing reactions once their child was diagnosed: devastation, grief, mixed feelings. A couple said their families didn’t understand or just told them their child would get better. One parent said it took her a few months after the diagnosis to submit the paperwork to the Advisors; a second would have liked help with the paperwork. One Advisor Service also noted issues with registration for Indigenous families because some have difficulty with the required paperwork.
You try and explain to them but because no-one else in the family has had autism, they don’t understand. [Indigenous family interviewee]
46

As for CALD families, there is a need to recognise differences between different Indigenous communities and individuals.
6.3.5 Concerns remain about access for children from low income families
There is no client data available on family income to objectively assess competing claims about how income influences access by families.
Low income families were under-represented among family survey respondents in 2010 and 2011 compared to population data—but this may not indicate they are under-represented among Package clients (table 6.7).
Table 6.7: Income of family survey respondents compared to Australian households
Registered families surveyedAustralian
households
n % %
High gross family weekly income ($2,000 or more)
655 16% 19%
Medium gross family weekly income ($600 - $1,999)
2582 62% 52%
Low gross family weekly income (<$600) 827 20% 29%
Nil income 117 3% <1%
Negative <1%
Total 4181 100% 100%
No data 256Source: HCWA Family survey 2011. ABS 6523.0.55.001Household Income and Income Distribution, Australia—Detailed Tables, 2005–06.
Overcoming the barriers
Some stakeholders suggested low income families may face barriers to registering their children, including the cost of obtaining a diagnosis and difficulties in navigating the system; but others said the Package is increasing access for families from low socioeconomic areas. While the Medicare items enable families to claim for assessments from private diagnosticians, low income families may not be able to afford gap payments and have to rely on public sector diagnostic services with (anecdotally) long waitlists.
47

PART C: EARLY INTERVENTION
48

7. Most registered children are able to access a service but inequities remain
The early intervention funding component (up to $12,000 per registered child) is intended to ensure all children with autism from around Australia can benefit from increased access to intensive early intervention.
7.1 Most children have accessed a service(s)
Overall, the data suggests most children registered have been able to make at least one claim for service (or will be able to do so before they turn seven). Most children registered in 2008–09, 2009–10 and 2010–11 have now made a claim/s for services; fewer of those registered in 2011–12 have made a claim/s, reflecting the shorter amount of time they’ve had to do so. Indications are that at least some of the families accessing services with Package funding would have been unable afford to pay for services without it.
Table 7.1: Clients that have made at least one claim for services by financial year registered
Year registered
Whether have case claim(s) 2008–09 2009–10 2010–11 2011–12* TOTAL
N 4346 5360 5369 1892 16967
Do not have any claims 5% 6% 9% 38% 10%
Have claims 95% 94% 91% 62% 90%
TOTAL 100% 100% 100% 100% 100%Source: FOFMS July 1 2008–November 3 2011.*For 2011–2011 only four months of data is available.
As the Panel capacity has grown, a higher proportion of registered clients have made claims—only 83% of registered clients had made at least one claim by November 2010, compared with 90% by November 2011. But some types of clients (Indigenous and those in regional remote areas in particular) face particular barriers in accessing services and have been less able to make claims.
As expected (because they have had the most time to make claims), families registered in 2008–09, on average, have made more claims than other families.
49

Table 7.2: Average number of claims per client, by financial year registered
Financial year registered Average claims per client
2008–09 43.5
2009–10 35.7
2010–11 22.1
2011–12* 6.3
All years 31.2Source: FOFMS July 1 2008–November 3 2011.*For 2011–2011 only four months of data is available.
Survey data suggest the Package has generally enabled registered children to access services more frequently—most families (>80%), Panel providers (>90%) and diagnosticians (80%) surveyed agreed (see Appendix 2 for survey data).
7.1.1 Panel growth has enabled more children to access services
Data suggests there are 1,025 unique early intervention provider organisations, some providing services in multiple locations.28 We are unable to assess the exact pattern of growth over time based on available data, but the Panel has clearly continued to grow.29 In some cases, Advisor Services have had an important role advocating with providers to join the Panel. Families have also been a key motivator—some Panel providers we spoke with joined because families urged them to.
Recognising the need to boost capacity, in late 2009, policy was changed to allow sole providers to join the Panel. Most Advisors and Panel providers surveyed (in 2010) agreed this was a positive development to boost capacity, and these providers now account for a small but important proportion of Panel services (11% of unique organisations). For some families from regional areas that we spoke with, sole providers were the only local service option.
Workforce capacity is impacting on Panel growth
In all three phases of the evaluation, representatives from each stakeholder group have raised concerns about the capacity of the allied health workforce to deliver early intervention for children with autism. True to this, over half the Panel providers surveyed (in 2010) indicated they had difficulty recruiting sufficient trained staff to meet demand for Package services in their local area. The figure was higher for outreach services. Some state department representatives and state-based services also noted difficulties recruiting staff, and some said public service vacancies exist in regional areas.
28 Source: FaHCSIA Service provider data November 2011. There is a chance a small number of these locations may no longer be in operation because they have activity eligibility end dates prior to November 2011, but indications from FaHCSIA (18/11/2011) are that most of these have just not had dates updated in the file and there are only a very small number that have left the Panel or changed consortia. 29 We are unable to assess growth in providers over time because it appears that activity entitlement start dates are updated as provider agreements are renewed.
50

In Tasmania, some stakeholders (Panel providers, state-based service and the STO) raised the lack of local university programs as an issue for workforce capacity. In the Northern Territory, some stakeholders indicated regular staff turnover is an issue.
Since the Better Start Package was introduced in July 2011, the final phase of the evaluation identified emerging concerns about the capacity of each to deliver timely early intervention because some providers are Panel members for both Packages. As we do not know the proportion of HCWA Panel providers also providing services under Better Start and because Better Start is still in the early phases of implementation, we are unable to assess the extent of this issue. But, given the concerns, wait times for services should be monitored over the coming months to assess impact.
More broadly, evidence suggests the need for options to boost workforce capacity—with the recognition that allied health staff are also in demand for other services. This might involve relevant bodies, such as Health Workforce Australia. Suggestions for addressing workforce capacity from Panel providers consulted were varied—only some of them relate to changing policy associated with the Panel:
work with industry peaks increase salaries encourage local university to offer degree use new graduates and have other staff mentor and support them additional training encourage/ require new graduates to work in regional areas after graduation provide better and more stable funding fund state-based services facilitate access to research articles make it easier to join the Panel provide mentoring provide more information to providers that could join the Panel.
Some state-based services identified a need for workforce training.
Victoria (which has a state autism plan) has a workforce initiative that includes training for working with children with autism, including building workforce knowledge through Regional Autism Co-ordination Groups (ReACTs). South Australia is trialling a country visiting service model and Health has programs to recruit graduates to regional positions (not autism-specific). In the Northern Territory, the allied health workforce is drawn mainly to managing chronic disease.
51

Anecdotally, the registration process may be putting off some potential providers
Anecdotally the complexity and/or length of the registration process to join the Panel (sometimes with little communication from FaHCSIA about approval status) may prevent some eligible providers from joining. This was cited as an issue by some Panel providers (in surveys and interviews), Advisors and a representative of one of the professional colleges/ associations as well as a very small proportion of 2011 family survey respondents.
Some Advisors suggested the process could be streamlined, and the professional colleges/ association representative suggested FaHCSIA could consider providers already approved by associations to deliver autism services. There may be potential to simplify the application process and to inform providers of their application status, but in doing this there is a need to consider concerns about provider quality (see chapter 10) and to maintain a rigorous assessment process.
…the complex system for becoming a panel provider means that many therapists have chosen not to join with the scheme, so families often have limited choice especially outside of metro areas. [Panel provider survey respondent]
Our child already had a speech therapist who he worked very well with. Trying to get her registered has been a nightmare - as she is not in a consortium. As a result we have only just been able to access funding to be used for speech therapy - after over 9 months of trying. If therapists are already being used and proving successful it’s good to maintain continuity for the child. [Family survey respondent]
7.1.2 Barriers to access remain30
Not all families have an adequate choice of providers locally
Despite positive developments, only just over half of the families (54%) and Panel providers (57%) surveyed agreed families have an adequate choice of providers in their local area. A similar proportion of Advisors (56%) surveyed agreed families have an adequate choice of providers in their state. Diagnosticians surveyed were less positive than others—only 35% agreed there is an adequate choice of providers locally—but, given only 35% said they were well-informed about local Panel providers, this may be more reflective of their lack of knowledge than a lack of providers.
Not having enough local providers was a common theme among family survey comments; some families we interviewed —particularly those from regional areas—also raised this issue, as did a couple families that contacted the team in the final evaluation.
It was hard to find service providers who were registered and the ones that were had huge waiting lists. [Family survey respondent]
30 Survey data for this section in Appendix 2
52

Not all families are able to access the service their child needs locally
In 2011, more families surveyed agreed that the services their child needs are available locally than did families in previous years. Yet, given that only two-thirds (65%) agreed, the range and spread of Panel providers is an ongoing issue. Over time there will be a need to monitor the types of services available as well as the number of Panel providers to assess service accessibility. Some families we spoke to mentioned that they’d not been able to access the type of service they needed, though one of these noted the service they ended up with was good because it had a focus on social skills.
Not all families are able to access services in a timely way
Data suggest timeliness of access to Panel providers has improved—families surveyed in 2011 were more likely to agree than those surveyed in 2010 that they have timely access to local services. Client data shows average and median wait times have decreased over the years of operation to date—though these figures should be interpreted with caution because the average wait time does not include those families that have not yet made a claim (table 7.3).
Despite these improvements, only just over half (58%) of the families surveyed in 2011 agreed they have timely access to services, suggesting ongoing issues. Panel providers surveyed were more positive than families (73% agreed); it’s unclear whether this is because of differing perceptions or differing locations of survey respondents.
I’ve had trouble accessing one-off ABI – we’ve been on a waiting list. Afraid that by the time we get in, they’ll be redundant. [Follow-up family interviewee]
Table 7.3: Average wait time between registration and first claim by financial year registered (for clients that have made a claim)
Year registeredMin wait
(days)Max wait
(days)Avg
wait*(days)Median wait
(days)
2008–09 0 957 89 44
2009–10 0 832 79 38
2010–11 0 478 50 28
2011–12** 0 113 23 17
Total 68***Source: FOFMS July 1 2008–November 3 2011.*Calculated based only on families that have made a claim.**For 2011–2011 only four months of data is available.***Overall average is impacted by very long wait times of small number of clients registered.
7.1.3 Some families find it hard to decide on services
The Package model assumes diagnosticians prepare treatment plans that will be useful in guiding families to decide which services their child needs. While 70% of diagnosticians agree treatments plans are useful in guiding families, most (86%) expect
53

early intervention providers to develop more detailed plans, and only about half (48%) collaborate with providers to develop more detailed plans (table 7.4). There are anecdotal indications (from some Advisors and families) that some families don’t receive a treatment plan or that what they receive is insufficient to guide them. But a paediatrician representative indicated paediatricians are taking on a large role in educating families about evidence-based services.
Table 7.4: Diagnosticians’ views on their role advising families
Aspect of advice 2011 % agree
Individual treatment plans prepared by diagnosticians are useful in guiding families to decide on which early intervention services their child needs 70%
I find it difficult to recommend one particular type of intervention for autism over another because of the limited evidence available 78%
I expect early intervention service providers will prepare more detailed treatment plans for children who access their services 86%
I collaborate with early intervention providers to develop more detailed treatment plans for children I have diagnosed with autism 49%
Source: 2011 Diagnostician survey
Feedback—from some families, Advisors and Panel providers—suggests some families would like or need more guidance in deciding on services than the Package model currently provides. Among families surveyed, some want more individualised advice about services to access based on their child’s needs, some want more information on specific therapies (and the differences between them) or about specific providers.
Parents need more help in selecting appropriate services, in coordinating those services and in utilising the funding for resource provision rather than services. [Family survey respondent]
As the interventions available are so different from each other, and it can take several months into an intervention before you can be sure it's helpful for the child - I feel there's a need for the input of a professional in guiding families to the most appropriate service for their child. [Family survey respondent]
...some families are not able to determine an appropriate intervention plan and try to find a quick answer to their concerns by moving from service provider to service provider. In my opinion this is not productive and not conducive to a positive outcome. [Panel provider survey respondent]
Providing individualised advice is not within scope of the Advisor role because it requires different qualifications and more time than they have available, but some families have expected them to do so. While it’s easy to suggest diagnosticians need a stronger role in guiding families, many (78%) diagnosticians surveyed find it hard to recommend a particular intervention over another because of the limited evidence available.
54

In terms of understanding providers, small states like the Northern Territory have had the capacity to bring together providers to explain their services to families, but this would be more difficult in larger states, so it is important education components encourage families to ask questions of providers and access information about their interventions. The education components could be strengthened to guide families to make decisions about services, for example, by:
strengthening material providing guidance on effective decision making better promoting the material on evidence-based interventions (on the RCN
website) increasing the reach of the Early Days workshops.
Box 7.2 A family in need of some more advice
Tom was diagnosed with autism at three years of age. Tom’s mother, Jill, found it hard to find support groups. ‘You need to talk with other parents. With the diagnosis there comes a period of grieving for at least 12 months.’ Jill did eventually find an informal support group of three or four parents, but found that it was hard to socialise with the children because of their behaviour. She didn’t find out until it was too late that she could have received some respite through the Red Cross.
Jill heard about the Package when Tom was five. She was given a list of providers, which she found hard to navigate, and meant making many phone calls. She didn’t hear about Early Days workshops or PlayConnect playgroups.
Jill was told that she could just use one service, and not chop and change services. She thought that this was hard, having to make such an important decision without really knowing anything. ‘How do you know what to do, where to go? Now that my youngest is in day care I have more time, but back then I didn’t have a babysitter...I really needed advice and help with coordinating what was available. I was overwhelmed and unable to do it all myself.’
7.1.4 Panel provider lists are not always up to date
Families rely on Advisor Services and the list on the FaHCSIA website (as well as word of mouth) to find out about and then access Panel providers. But throughout the evaluation some stakeholders have raised concerns that the Panel provider list is not always up to date. Some also suggested all service locations should be listed or families might not be aware of local providers.
Advisor Services have developed provider lists (and, in some cases, lists for non-Panel services). They keep these up to date with new information from FaHCSIA and through scheduled contact with Panel providers, informal meetings, or interagency meetings. In larger states, Advisors are often assigned regions for which they keep provider information. Some Services send updates to families about new providers (something some families requested in previous evaluation phases).
55

Several Advisor Services noted updating this information can be a challenge within time constraints and because FaHCSIA does not always inform them about new services in a timely way. One suggested that FaHCSIA require providers to contact Advisor Services when they are first registered.
7.2 Service access continues to vary by family type
Data shows differences in service access by family type, associated with particular barriers.
7.2.1 Some differences in claims by state
The Northern Territory has the lowest proportion of registered clients (July 2008–November 2011) that have made a claim/s, reflecting the low number of local Panel providers, and the fact that some of these have only recently joined (table 7.5). Not only have Territorians made fewer claims than families in other states but the cost of services is higher—on average $250 per claim—reflecting the cost of travel and use of outreach providers (Table 7.6). In line with this, a lower proportion of family survey respondents from the Northern Territory than from other states agreed the funding had increased the frequency of intervention for their child, that they had an adequate choice of providers, access to the services their child needs or timely access.
Tasmania has the second lowest proportion of registered clients that have made a claim/s. This is likely related to the lack of service options in some areas, particularly the north west, and/or difficulties with transport raised by some Panel providers, the Advisor Service, state department representatives and state-based services. The Advisor Service also noted a lack of variety of providers and providers of the type families want as an issue in their recent report to FaHCSIA (November 2010–June 2011).
Table 7.5: Registered clients that have made at least one claim for services by state, cumulative by year
State Made claims No claims
n % n %
NSW 5200 92% 456 8%
VIC 4719 91% 488 9%
QLD 2539 86% 409 14%
WA 1120 92% 104 8%
SA 1093 87% 164 13%
TAS 297 84% 58 16%
ACT 180 90% 19 10%
NT 90 74% 31 26%
TOTAL 15238 90% 1729 10%Source: FOFMS July 1 2008–November 3 2011. Notes: We have used cumulative claims data because it is not possible to calculate the percentage of eligible clients making claims by financial year (because the eligibility criteria changed and because children that are technically still be eligible for funding may no longer be able to make claims because they have used their full allowance). For each
56

year we have calculated the proportion of clients registered before that date that have ever made a claim. Thus the data may over-represent current inequities to some extent.
A lower proportion of family survey respondents from the ACT than other states agreed with statements about access. But the data indicates that, unlike clients in the Northern Territory, Tasmania, Queensland and South Australia, the proportion of ACT clients that have made a claim(s) is in line with the proportion of all Panel clients that have made a claim(s). A likely explanation for ACT families’ lower level of satisfaction with access is that families in the ACT have, on average, made fewer claims over the years to date, paid more per claim and claimed less of their total funding allowance than those in other states except for the Northern Territory (table 7.6).
Although average amount per claim is only an indicative figure, given that claims relate to different session lengths and types, it suggests that families in some states will be able to claim less frequently for services.
Table 7.6: Patterns of claims by state (July 2008–November 2011)
Clients with claims
No. of claimsAvg no. claims
per clientTotal $
claimedAvg total $
claimedAvg $/claim ex
resources*
NSW 5,200 177,872 34.2 $32,901,167.15 $6,327 $177
VIC 4,719 146,726 31.1 $28,906,410.55 $6,126 $180
QLD 2,539 64,180 25.3 $14,657,691.71 $5,773 $209
WA 1,120 39,235 35.0 $7,912,080.88 $7,064 $198
SA 1,093 31,835 29.1 $6,835,949.72 $6,254 $199
TAS 297 9,998 33.7 $1,962,439.02 $6,608 $192
ACT 180 4,305 23.9 $1,071,772.26 $5,954 $227
NT 90 1,340 14.9 $379,752.37 $4,219 $250
TOTAL 15238 475491 31.2 $94,627,264 $6,210 $186Source: FOFMS July 1 2008–November 3 2011. *Avg cost per claim excludes resources because these will naturally vary in price according to what families buy.
Panel provider data suggest NSW has a higher proportion of unique provider organisations (based on Activity Org ID) than registered clients, which would help facilitate access there.
Table 7.8: Registered clients (July 2008–November 2011), compared with Panel providers by state
State
Registered Clients (July 2008–November 2011)
Unique organisationsClients/ unique
organisation*
NSW 5,656 33% 405 40% 14.0
VIC 5,207 31% 289 28% 18.0
QLD 2,948 17% 176 17% 16.8
WA 1,224 7% 61 6% 20.1
SA 1,257 7% 55 5% 22.9
57

State
Registered Clients (July 2008–November 2011)
Unique organisationsClients/ unique
organisation*
TAS 355 2% 24 2% 14.8
ACT 199 1% 9 1% 22.1
NT 121 1% 6 1% 20.2
Total 16,967 100% 1025 100% 16.6Source: FaHCSIA Panel provider data November 2011.*This is an indicative figure based on total number of clients/ total number of unique service organisations; it does not mean all clients are within range of a local provider.
Overcoming barriers
The issues for families in the Northern Territory reflect those for families in regional and remote areas—different service models are needed to boost access. The Northern Territory has a Patient Assisted Travel Scheme but this does not cover appointments with allied health professionals.
7.2.2 Fewer families in regional and remote areas have made claims 31
While the proportion of clients in regional and remote areas making claims has increased over the years of operation to date, the gap between these clients and those in major cities remains (figure 7.1). In line with this, a lower proportion of family survey respondents from regional and remote areas than those in major cities agreed they had an adequate choice of service providers, access to the services their child needs or timely access to services.
31 The location (ARIA+) data in this report replaces the analysis in the mid-term report when we were unable to obtain data from FaHCSIA in the ARIA+ format.
58

Figure 7.1: Registered clients that have made at least one claim for services by location (ARIA+), cumulative by year
Percentage of registered clients who have made at least one claim for services by location, cumulative year are:
Up to June 2009Major city; 71%Inner regional: 64%Outer regional: 53%Remote: 38%Very remote: 50%
Up to June 2010Major city: 87%Inner regional: 78%Outer regional: 70%Remote: 58%Very remote: 48%
Up to June 2011Major city: 91%Inner regional: 87%Outer regional: 80%Remote: 76%Very remote: 70%
59

Up to November 2011Major city: 92%Inner regional: 87%Outer regional 81%Remote: 73%Very remote: 72%
Source: FOFMS July 1 2008–November 3 2011.Tables notes: location classifications based on Accessibility/Remoteness Index of Australia+ (ARIA+)We have used cumulative claims data because it is not possible to calculate % of eligible clients making claims by financial year (because the eligibility criteria changed and because children that are technically still be eligible for funding may no longer be able to make claims because they have used their full allowance). For each year we have calculated the proportion of clients registered before that date that have ever made a claim. Thus the data may over-represent current inequities to some extent.
Families in outer regional and remote areas pay more, on average, per claim than those in major cities and inner regional areas. The average cost per claim in very remote areas is 1.8 times that of the average cost per claim in major cities, the cost in outer regional and remote areas is about 1.3 times that in major cities.
On average, those in regional and remote areas also make far fewer claims than those in major cities, and have spent less of their available funding. The average number of claims per client in remote and very remote areas is less than half the number per client in major cities. Reflecting this, family survey respondents in regional and remote areas were less likely to agree the Package has increased the frequency of their child’s access to services.
Table 7.9: Patterns of claims by location (July 2008–November 2011)
Clients with claims
No. of claims
Avg no. claims per client
Total $ claimed
Avg total $ claimed
Avg $/claim ex resources
Major Cities of Australia 11,103 372,641 33.6 $72,236,023.19 $6,506 $183
Inner Regional Australia 2,925 79,068 27.0 $16,202,955.20 $5,539 $186
Outer Regional Australia 1,056 21,034 19.9 $5,452,542.48 $5,163 $234
Remote Australia 101 1,679 16.6 $455,649.76 $4,511 $246
Very Remote Australia 42 572 13.6 $195,390.73 $4,652 $324
TOTAL 15,227 474,994 31.2 $94,542,561.35 $6,209 $186
No data 11 497 45.2 $84,702.30 $7,700 $170Source: FOFMS July 1 2008–November 3 2011. Table notes: location classifications based on Accessibility/Remoteness Index of Australia+ (ARIA+).*Avg cost per claim excludes resources because these will naturally vary in price according to what families buy.
Advisor and Panel provider survey data suggest that while the sufficiency of Panel providers to meet demand has increased over time, the change has occurred in metropolitan rather than regional and remote areas. But some of the regional/ remote families we spoke to had gained access to a local provider since the introduction of sole providers, suggesting this policy change has been some help.
60

Panel provider data indicates a much higher number of clients/ organisation (based on Activity Org ID) in remote areas. But this is an indicative figure only because it does not mean all clients are within range of a service.
Table 7.10: Registered clients (July 2008–November 2011), compared with Panel providers by location
State
Registered Clients (July 2008–November 2011)
Unique Service organisationsClients/ service organisations*
Major Cities of Australia 12106 71% 739 72% 16.4
Inner Regional Australia 3345 20% 211 21% 15.9
Outer Regional Australia 1306 8% 72 7% 18.1
Remote Australia 139 1% 2 <1% 69.5
Very Remote Australia 58 <1% 1 <1% 58.0
Total 16954 100% 1025 100% 16.5Source: FaHCSIA Panel provider data November 2011. Table notes: location classifications based on Accessibility/Remoteness Index of Australia+ (ARIA+).*This is an indicative figure based on total number of clients/ total number of unique service locations; it does not mean all clients are within range of a local provider.
While families often supplement the services they are able to purchase with Package funding with private services, a lower proportion of family survey respondents from regional and remote areas said they fund their child’s services this way.
Box 7.4 We get our services from one provider. What happens if they leave?
Anna and her husband, Sean, live with their four children in regional Queensland. Their youngest son, Jacob, was diagnosed with autism in 2009. Their older son has since been diagnosed with Asperger’s Syndrome. Jacob has worked with a speech therapist for a long time. Just as his family used up their Medicare rebated visits, Anna found out that sole providers could join the Panel if they joined a consortium. Anna encouraged Jacob’s therapist to find a consortium, and the provider was accepted as a member. For almost 18 months, Anna has been able to use the funding to help pay for Jacob’s speech therapy—this has meant Jacob has had more speech therapy than the family could otherwise afford, and Jacob’s speech and social recognition has improved. But now, the lead agency is withdrawing from the consortium and Anna is worried that the speech therapist will not be accepted onto the Panel as a sole provider. The problem for families like Anna’s in regional Queensland is that there are very few Panel providers. Jacob and his therapist have a great relationship built over the years, but Anna and Sean cannot afford to pay for Jacob to have speech therapy regularly without the assistance of the Package.
61

Overcoming barriers
Different delivery models are needed to boost access given the lack of local providers in remote and some regional areas.
Suggestions canvassed at the Autism Advisor forum (May 2011) included finding different service delivery models, providing incentives to travel and funding outreach.
Suggestions from representatives of the professional colleges/ associations included supporting tele-health/ online approaches. But one said online approaches would only be appropriate for parent-focused sessions, and a second said there would need to be one face-to-face appointment before a establishing a virtual relationship. Other suggestions were funding multidisciplinary teams to travel to regional areas and strengthening trans-disciplinary approaches, which would require adequate buy-in from all the disciplines because barriers to trans-disciplinary work include professional boundaries and regulatory requirements.
State department representatives also noted challenges to ensuring access for regional and remote families, particularly where there is a lack of local providers or too few clients to sustain a service. State early intervention and education services use a range of approaches to supporting families in regional areas, including hub and spoke models of delivery, fly in and out services, and regular visiting services. Victoria uses a secondary consultation model to build the skills of therapists32. Some have used or are exploring tele-health options, but one representative noted technological approaches have limitations and are perhaps only suitable for case conferencing.
State department representatives suggested Panel providers delivering outreach connect with local services providing families with ongoing support and that providers use parent education models (that would enable ongoing intervention for the child). State-based services suggested bolstering existing services, block funding (to provide more stability), incentives to get professionals to regional areas once they finish training, collaborative positions funded by both state and federal government, having existing regional services provide accommodation support to visiting therapists. One service, though, suggested that the introduction of Better Start may help build critical mass in the regions for services on both the HCWA and Better Start Panels.
Experiences and suggestions for providing outreach
Of the Panel providers that currently service regional and/or remote areas through outreach, some see a need to better support outreach under the Package.33 Their most common suggestion was for travel and associated expenses (e.g. accommodation) to be
32 Victoria has an Autism Consultation and Training Strategy - NOW (ACT – NOW). The strategy uses Regional Autism Coordination Teams (ReACTs). http://www.med.monash.edu.au/spppm/research/devpsych/actnow/project.html33 Some Panel providers seem to have misinterpreted ‘outreach’ as services in the family home, as opposed to outreach to regional and remote areas. Only relevant suggestions have been included here.
62

covered through additional funds. A few suggested a need to allow Panel providers to charge families for travel, but others are already doing this. Other proposals encompassed boosting the number of regional providers, up-skilling the existing workforce, funding existing organisations to cover regional areas, or providing incentives to travel or relocate.
A less common issue was the way outreach providers are currently connected to families. Some suggested increasing regional families’ awareness of existing services or coordinating referrals to allow visits to several families at a time (demand aggregation). The Northern Territory and Western Australian Services have already made efforts to link families in regional areas to providers, and this may be feasible for other Services.
Some also suggested supporting alternative delivery models, including Skype, videoconferencing or teleconferencing. In interviews, some providers described already using these mechanisms following an initial face-to-face consultation. Evidence from the Western Australian Autism Association’s experience (presented at the APAC 2011 conference)34 with these models suggests some families are less technologically capable than others and require support in setting up the systems needed. The Association provided families with webcams so they could participate, but the model was not feasible in areas with unreliable Internet access. For those with the Internet, connection costs and download speed were an issue, so using phone lines for the audio content and the Internet only for visual content was most effective.
Those not currently providing outreach, identified the main barriers as the cost of travel (both travel expenses and income forfeited while travelling); but lack of staff capacity or difficulties hiring extra staff was another common barrier for which there is no easy solution. They suggested similar strategies to current outreach providers, with one addition—helping providers with access to a room/ office to use at the location.
The biggest obstacle is the additional cost and time for travel. [Panel provider survey respondent]
As I am a sole provider and am generally working at full capacity, providing an outreach program is difficult unless I employ other speech pathologists. [Panel provider survey respondent]
…as a practitioner, I have made the decision to do outreach work because my incentive is to provide the service and not generate profit, but I can’t speak for other people. They may not see the point. [Panel provider interviewee]
7.2.3 A similar proportion of CALD families are making claim(s)
While stakeholders are concerned about access for children from CALD backgrounds, the proportion of CALD children registered (July 2008–November 2011) who have made at least one claim for services is similar to that for English-speaking families (figure 7.2). 34 Breitenbach, K., 2011, Providing services to regional and remote areas of Western Australia using web based facilities, Western Australian Autism Association, Asia Pacific Autism Conference 2011
63

A higher proportion of CALD than English-speaking family survey respondents indicated they were accessing services for their child more frequently, have access to the services their child needs, adequate choice of services and timely access. The reason for this difference is unclear, but it may relate to differing expectations of the service system.
While the finding is positive, qualitative data suggests those families with lower English proficiency may face greater barriers in accessing services. And, if the CALD clients that have registered are mostly those with higher levels of English proficiency, the findings may in part be a reflection of CALD clients’ under-representation among registered clients.
Figure 7.2: Registered clients that have made at least one claim for services by CALD status, cumulative by year
Percentage of registered clients who have at least one claim for services by CALD status are:
Up to June 2009English: 68%Other language: 68%
Up to June 2010English: 83%Other language: 86%
Up to June 2011English: 89%Other language: 90%
64

Up to November 2011English: 90%Other language: 91%
Source: FOFMS July 1 2008–November 3 2011. Note: We have used cumulative claims data because it is not possible to calculate % of eligible clients making claims by financial year (because the eligibility criteria changed and because children that are technically still be eligible for funding may no longer be able to make claims because they have used their full allowance). For each year we have calculated the proportion of clients registered before that date that have ever made a claim. Thus the data may over-represent current inequities to some extent.
Claims data suggest, on average, CALD families make a similar number of claims, use a similar proportion of their funding allowance and spend a similar amount per claim as English-speaking families.
Table 7.11: Patterns of claims by CALD status (July 2008–November 2011)
Language Clients with claims
No. of claims Avg no. claims per client
Total $ claimed
Avg total $ claimed
Avg $/claim ex resources*
English 13,065 403,784 30.9 $80,831,066 $6,187 $176.42
Other 1,565 51,715 33.0 $9,668,114 $6,178 $173.51
Total 14,630 455,499 31.1 $90,499,180 $6,186 $176.09
Unknown 608 19,992 32.9 $4,128,084 $6,790 $176.42Source: FOFMS July 1 2008–November 3 2011. *Avg cost per claim excludes resources because these will naturally vary in price according to what families buy.
Overcoming barriers
While stakeholders noted barriers for CALD families, the extent to which they’ve made claims suggests a range of factors might have facilitated their access, including the additional support Advisors said they provided some families from CALD backgrounds.
The families we spoke to suggested varying potential barriers to access including lack of confidence with English, lack of understanding of different therapy methods, not knowing which providers are good, the lack of a centralised information source and lack of guidance, as well as issues common across family types like waiting lists and service costs. One CALD stakeholder also noted that the way a service is labelled can also have an impact on access because of the stigma associated with disability in some cultures.
Anecdotally, some families may also have found Panel providers able to deliver services in their language, helping to overcome the barriers they would otherwise face. While not all CALD families will be able to access a provider delivering in their language, we interviewed an English-speaking provider that said they had been able to achieve good outcomes for a child of non-English-speaking parents by communicating through the child’s sibling; others, however, noted relying on a sibling/ family member translate is not ideal.
65

Information about services
CALD families we interviewed had different sources for information and advice about services, including Autism Advisors, state services, paediatricians, other parents, support groups and child health nurses. But a couple would have liked someone to tell them what to do. One explained this would ‘save time and money as you wouldn’t go through unsuitable things’. Another parent suggested the need for a service flowchart and a website that connected parents and providers.
7.2.4 Indigenous families
While there have been improvements over time, Indigenous children remain less likely to access services. Only 80% of those registered (July 2008–November 2011) have made at least one claim for services, compared with 91% of non-Indigenous clients (figure 7.3).
While Indigenous and non-Indigenous family survey respondents had similar levels of agreement about timeliness of access and service availability, some families we spoke to were concerned about a lack of culturally appropriate services.
Figure 7.3: Registered clients that have made at least one claim for services by Indigenous status, cumulative by year
Percentage of clients that have made at least one claim for services by Indigenous status, cumulative by year are:2008-2009Indigenous status: 55%Non-Indigenous status: 68%
66

2009-2010Indigenous status: 68%Non-Indigenous status: 84%
2010-2011Indigenous status: 79%Non-indigenous status: 90%
2011-2012*Indigenous status: 80%Non-Indigenous status: 91%
Source: FOFMS July 1 2008–November 3 2011. Note: We have used cumulative claims data because it is not possible to calculate % of eligible clients making claims by financial year (because the eligibility criteria changed and because children that are technically still be eligible for funding may no longer be able to make claims because they have used their full allowance). For each year we have calculated the proportion of clients registered before that date that have ever made a claim. Thus the data may over-represent current inequities to some extent.
On average, Indigenous clients have made fewer claims and spent a lower proportion of their funding allowance (table 7.12). But Indigenous family survey respondents were as likely as other families to agree the Package had increased the frequency of their child’s access to services, suggesting they may have had differing starting levels of access.
Table 7.12: Patterns of claims by Indigenous status (July 2008–November 2011)
Clients with claims
No. of claims Avg no. claims per client
Total $ claimed
Avg total $ claimed
Indigenous 415 9812 23.6 $2,060,109 $4,964
Non-Indigenous 13180 425216 32.3 $84,017,416 $6,375
Total 13595 435,028 32.0 $86,077,525 $6,332
Not stated/ Declined to answer 1643 40463 24.6 $8,549,738 $5,204Source: FOFMS July 1 2008–November 32011.
Only a couple Indigenous families we spoke to noted paying for services privately; similarly, a lower proportion of Indigenous than non-Indigenous families surveyed were funding their child’s early intervention through services they pay for privately.
Overcoming barriers
Qualitative data35 and research conducted by SNAICC and the PRC suggest a range of barriers Indigenous families may face to accessing services.
35 From Indigenous stakeholders interviewed in 2010 and 2011 and Indigenous families interviewed in 2011 as well as other stakeholders.
67

Some families may need more help navigating the system. Families interviewed noted potential barriers for Indigenous families accessing services, including lack of knowledge of available services, therapy types or how the funding can be used, as well as difficulties ringing around getting quotes and arranging services, filling in forms and navigating the system.
Kooris won’t chase people and services and if the services don’t understand, Kooris won’t chase them. [Indigenous family interviewee]
You have to navigate a minefield to get intervention you need and they need to centralise the whole thing. [Indigenous family interviewee]
Other barriers are similar to those described in chapter 6, including travel, costs and the lack of culturally appropriate services or lack of Indigenous services/ staff. One family mentioned the difficulties with losing a place in a service if you need to skip an appointment because of cultural commitments.
It would be nice to talk to someone who understands the dynamics of Koori families because being Aboriginal is an added barrier. [Indigenous family interviewee]
…some services really don’t understand us. [Indigenous family interviewee]
Because we interviewed only a small number of families, the extent to which the issues identified apply across the population is unclear. Alternative models to ensure culturally appropriate and accessible services should be further explored with Indigenous organisations. One state department representative said boosting the capacity of Aboriginal Medical Services to deliver services could be effective but this would need support from a management level.
The evaluation also identified some examples of non-Indigenous providers working effectively with local Indigenous services (provided in the mid-term evaluation report), for example, developing partnerships and providing services from the Indigenous organisation to build trust—an approach supported in the SNAICC and PRC research and by some states-based services (some of which also provide Package services). These sorts of models could be supported under the Panel.
Information about services
Some Indigenous families we spoke to had difficulty getting information about services. Quite a few did their own research or used the Internet to find out more about services.
7.2.5 Some concerns about access to services for low income families
Insufficient client data exists on family income level to assess access competing claims about access to early intervention for these families. Throughout the evaluation stakeholders have raised concerns about service access for low income families. Others (including some Panel provider survey respondents and quite a few of those we spoke to) have claimed the Package has enabled some families, particularly those from low
68

socioeconomic areas, to access services they would not otherwise have been able to. In focus groups one Advisor Service reported having feedback from paediatricians that the Package had enhanced access for families from low socioeconomic areas.
An excellent package to help support people from lower socio-economic backgrounds access services which they would otherwise not be able to afford. [Panel provider survey respondent]
It has given low SES and other families, like where parents have their own issues, access to therapy their child would not have had before. [Panel provider interviewee]
Among family survey respondents, income was associated with satisfaction with service access. A higher proportion of those with higher weekly incomes agreed the services their child needs are available locally.
Overcoming barriers
Given the lack of data to objectively assess issues with access, the evaluation is not able to make clear recommendations for ways forward. As previously noted, Advisors should collect data on family income for registered clients so the Department can assess access and address concerns if necessary.
7.2.6 Anecdotally, some other families may also have difficulties accessing services
Some stakeholders suggested other families may also be at a disadvantage accessing services, including those with
parents/ carers with a disability (who may need extra help to navigate the service system)
children with higher needs (who may need longer and more intensive early intervention)
children in out-of-home care.
One state department representative claimed some families (for example, in which parents have a diagnosis) have chosen not to use Package services because of the complexity involved.
A couple of state-based services were concerned that children with co-morbid disorders may not have their needs met under the Package or have to access services through multiple systems.
69

8. The payment model
The early intervention funding component (up to $12,000 per registered child) is intended to increase families’ access to early intervention and enable them to purchase resources important to their child’s therapy. Families in outer regional and remote areas (as defined by ARIA+) and those that can prove significant difficulties accessing services can also receive the Access Support Payment ($2000). It is intended to complement existing state and territory government services, and should be recognised as contributing to an existing and continuing system of support.
8.1 Funding is making services more affordable but some think it’s not enough
Throughout the evaluation most families surveyed (>88% in any year) agreed the Package has made services more affordable. Evidence—from family survey respondents, follow-up, CALD and Indigenous family interviewees, Panel provider interviewees, diagnosticians, and two of the representatives from the professional colleges/ associations—suggests some families would have been unable to access services or unable to access services as frequently without the funding. Some would have done so but the Package has reduced the financial burden on the family.
..many families would simply do without those services if it wasn't for the HCWA Package [Panel provider interviewee]
Less worry about where finances to pay for therapy are to come from has relieved a lot of stress in our family. [Family survey respondent]
Despite being a high earning family, our financial commitments are also high and therefore we would not have been able to access the depth and breadth of services without this funding. [Family survey respondent]
Before the HCWA funding came in we were using our private money to get private OTs and we started to get to the end of that so we were getting stressed. [Follow-up family interviewee]
While the Package has made services more affordable, about two-thirds of families surveyed (in 2010) said they suffer financial hardship to provide additional services for their child they pay for privately. In line with this, extending the funding limit—because it is insufficient to cover the services their child needs—was one of the common themes among 2011 family survey respondents. A few families we interviewed also noted the funding was insufficient to provide the support their child needs. Some argued higher government investment in early intervention would save costs to government later.
70

A representative of one of the professional colleges/ associations suggested the funding was insufficient to provide the intensive level of service recommended for early intervention. This representative noted, as have others, that for children diagnosed at a younger age the funding will not last.
The funding lessened the financial burden for a period of two months and then the money ran out. This is our third year of ABA and each year we spend $50,000 or more on early intervention. We are grateful for the funding but is [sic] simply not enough for a life time of therapy. [Family survey respondent]
It is not enough money - we are spending $5,000 a month, so the $12,000 over two years is a tiny drop in the ocean [Family survey respondent]
While only a low proportion of families have currently claimed the full $12,000 of their early intervention funding, this may relate more to difficulties accessing services or trying to spread the funding out over time than lack of need.
Table 8.1: Total amount of funding families have claimed by financial year registered
Client expenditure (claims) 2008–09 2009–10 2010–11 2011–12 TOTAL
N 4,120 5,052 4,901 1,165 15,238
Less than $500 1% 1% 3% 25% 4%
$500-$999 1% 2% 5% 27% 4%
$1,000-$1,999 2% 4% 13% 28% 8%
$2,000-$2,999 4% 6% 15% 13% 9%
$3,000-$3,999 4% 7% 15% 4% 8%
$4,000-$4,999 4% 8% 12% 1% 8%
$5,000-$5,999 5% 12% 11% 1% 9%
$6,000-$6,999 7% 11% 9% <1% 8%
$7,000-$7,999 6% 10% 7% 0% 7%
$8,000-$8,999 7% 11% 5% 0% 7%
$9,000-$9,999 9% 8% 3% 0% 6%
$10,000-$10,999 10% 8% 1% 0% 6%
$11,000-$11,999 27% 9% 1% 0% 11%
$12,000 or more14% 3% <1% 0% 5%
TOTAL 100% 100% 100% 100% 100%Source: FOFMS July 1 2008 to November 3 2011.
Survey data (2011 and 2010) suggest most families are spending less than $5,000 in addition to Package funding each year for their child/ren with autism36 (table 8.2). While this figure may seem low, for some families it would be a significant burden—low income families were less likely than others to be paying anything for services privately (23%), and high income families were most likely to be paying over $5,000 (34%).
36 Note some family survey respondents had more than one child with autism and would have calculated spending for multiple children.
71

Table 8.2: Amount family survey respondents pay on supports for their child/ren in addition to HCWA funding each year
Amount paid privately for services 2010 2011
$0 12% 16%
Up to $5,000 59% 60%
From $5,001 to $10,000 17% 16%
From $10,001 to $20,000 6% 5%
More than $20,000 5% 3%Source: Family surveys 2010 and 2011.
With the available evidence, it is not possible to make a clear recommendation on the need to increase the funding, particularly as it is intended only as a contribution to an existing service system. But there is a need to consider indexing the $12,000 over time to ensure the funding continues to buy a commensurate amount of services.
Box 8.1 Access reduced financial difficulties
Lilly lives with her husband, Ivan, and two daughters, Stacey and Natalie, in NSW. They’ve faced financial difficulties due to the support needs of both girls, especially those of their older daughter, Stacey. Stacey has a diagnosis of autism and a developmental delay requiring intensive ongoing support. She was diagnosed nearly two years before the Package funding was available. The costs associated with private support services for both Stacey and Natalie, and the limited amount of state-based support available led Lilly and Ivan to make significant sacrifices, including selling their home and moving to Ivan’s native country for a short period to take advantage of the free comprehensive autism services available there. This was very difficult for Lilly and the couple were convinced to move back to Australia when they heard about new funding sources available, particularly the HCWA Package.
The funding has enabled Lilly and Ivan to ensure that both girls receive many of the support services they need and has helped reduce the family’s financial difficulties significantly. Lilly feels that if it wasn’t for the funding, they would have had to prioritise services and focus their efforts on Stacey who has lower levels of functioning and requires more support. She fears that in order to ensure the necessary levels of support for both daughters, Ivan might have had to stay in the other country with Stacey which would have been very hard for the whole family.
Box 8.2 Intensive intervention: the funding doesn’t cover the costs
Sarah and her husband Mark live in Melbourne with their son Christopher and his younger sister. Christopher, who is nearly five, was diagnosed with autism when he was just over two-and-a-half years old, just before the Package became available. After doing their own research, the family opted for an ABA approach because they believe it has the strongest evidence base. While they’ve heard some other families are struggling to spend their funding, they’ve found that $12,000 does not go very far towards covering the costs of ABA. The funding covers some sessions with the ABA psychologist. But they can’t use it for their ABA therapists because the therapists aren’t approved professionals; and, in any case, the money would not stretch that far. They’ve also accessed a private speech pathologist but have cut back on this because the fees have increased under the Package. Their son has benefited from the intervention, but they still have ups and downs, with behaviour a major issue in the past 12 months. While they don’t suggest their son should automatically qualify for more funding because he has high
72

needs, they think there should be a way to apply for additional funding when the money has been spent well and the child is assessed as having an ongoing need for intensive intervention.
Box 8.3 Early diagnosis: making the funding last
John and Jenny live in with their two daughters and 12-month old son. They started thinking something was different about their second daughter, Laura, when she was only three months old because she didn’t look at them or respond. Laura was diagnosed with PDDNOS at age two. For the past few years she has been seeing a private speech pathologist and occupational therapist—at first fortnightly, then monthly and currently every third week. While she’s also able to access some support through the state system, she’s had very limited access to state-funded speech pathology. At first the family were unsure about how best to spend their funding so it would last. They’ve been using their private health insurance to get rebates for some sessions, a Chronic Disease Management plan that gives access to five allied health sessions annually and the Package funding. Earlier this year, the family developed a budget to ensure they have some funding left for the transition to school period and for a Panel provider to support Laura in her first year at school because they believe that time is crucial and want to make sure their daughter has the best opportunities.
8.1.1 Impact on affordability for different families
Differences by family type
Reflecting their difficulties accessing services locally, family survey respondents from the Northern Territory and the ACT were less likely than others to agree that the funding has made services more affordable for their family. For other families, the differences in level of agreement weren’t substantive.
For lower functioning children
In their overall comments, a handful of Panel provider survey respondents raised concerns about the equity of a flat funding structure given that children have varying levels of need; as did some state-based services. A few families with lower functioning children we spoke to, however, did not think other families should receive less money. A couple explained this was because some higher-functioning children might have behavioural issues for which they need more extensive support. Also, there is not a standardised tool to assess level of need on which to base funding.
Children who are more affected by their autism, should receive a higher funding level as the current amount does not cover anywhere near enough hours to make a lasting difference. [Panel provider survey respondent]
73

8.1.2 Concerns about service fees and administrative charges
Stakeholders (including some Autism Advisors, Panel providers, state-based services, families, and diagnosticians, and state department representatives) are concerned that some providers are charging excessive fees and some are charging administrative fees.
While nearly three-quarters of families indicate their provider charges more for services delivered under HCWA, only just over one-third (36%) of Panel providers surveyed said they charge families more (see Appendix 2 for survey data). It’s unclear whether this difference is due to some confusion among families or because a higher proportion of the providers who did not respond to the survey charge families more. In most cases, providers charge between 5 and 20% more, due to the cost of administration but also due to the costs of coordination, assessment and development of treatment plans and infrastructure costs.37
A common theme among family survey comments , also identified by some family interviewees and some families that contact the team, was a concern about provider fees, but only a very small proportion of survey comments suggested certain Panel providers’ had misused funds.
Most of these on the Panel charge way more $$$ than the other private ones. Some of these providers are ‘cashing in’ on the already vulnerable. [Family survey respondent]
I have found that many therapists take gross advantage of the funding, charging up to a premium of $30 per therapy session (put through under the funding) for "administration costs", which greatly eats away at the funding and hence benefit to our child. [Family survey respondent]
Another charged my friend near to $2,000 for ONE SESSION for a 'consultation' with their supervisors from America. She had to sign a contract to agree to this, before they would take her on as a client. After the experience she just felt 'ripped off' and angry [Family survey respondent]
I talked to one speechie about how much she was charging for a home visit and her basic attitude was, well, parents can afford it [Follow-up family interviewee]
No data is available to assess how comparable fees are with those of services generally. And it is difficult to assess the cost of services delivered under the Package because, while charges vary significantly, so do the services provided. Some relate to one-hour sessions, while others are for several sessions. Looking at the average amount charged per claim by service type (in constant AUD) compared with the inflation rate between 2008 and 2011, shows average costs per claim across different therapy types have remained fairly constant or ‘dropped’ in real terms. But, because session types and lengths vary so much, this figure could hide increasing costs. FaHCSIA may need to further investigate costs data to ascertain whether some providers’ fees have increased
37 Explanations for additional charges from 2010 Panel provider qualitative survey data
74

considerably. Comparing costs between providers, however, may not be useful as session types and skills vary considerably.
Figure 8.1: Average amount charged* per claim (in constant 2008 AUD), by type of early intervention service
Source: FOFMS data July 1 2008–November 3 2011; ABS Consumer Price Index, Australia, Sep 2011.*Figures based on amount charged rather than amount claimed so the full extent of service costs is included.Price index indicates inflation rate for consumer products
Average amount charged* per claim (in constant 2008 AUD), by type of early intervention service:
Behavioural interventions:2008-2009: $251.562009-2010: $246.402010-2011: $240.672011-2012*: $290.82
Child psychology:2008-2009: $193.032009-2010: $197.072010-2011: $195.912011-2012*: $192.87
Developmental interventions:2008-2009: $460.082009-2010:$300.17
75

2010-2011: $280.292011-2012*: $578.51
Family based interventions:2008-2009: $364.642009-2010: $299.01 2010-2011: $267.492011-2012*: $284.93
Occupational Therapy:2008-2009: $156.222009-2010: $146.682010-2011: $152.392011-2012*: $147.78
Other Service:2008-2009: $430.962009-2010: $365.692010-2011: $381.772011-2012*: $351.47
Resources:2008-2009: $333.502009-2010: $297.692010-2011: $443.372011-2012*: $440.49
Social learning interventions:2008-2009: $255.562009-2010: $190.492010-2011: $262.382011-2012*: $274.97
Speech Pathology:2008-2009: $151.352009-2010: $142.422010-2011: $141.722011-2012*: $134.99
Therapy based:2008-2009: $383.012009-2010: $380.252010-2011: $349.192011-2012*: $358.49
76

Price Index (base 2008 = 100):2008-2009: 1002009-2010: 101.262010-2011: 104.082011-2012*: 107.75
One state department representative suggested it would have been more cost-effective to fund particular providers as state governments do; another suggested that given the amount of funding the Package channels into the sector there should be greater scope to negotiate fee structures.
FaHCSIA is unable to set the fees of private providers as some stakeholders suggested, but reducing providers’ administrative burden may help to reduce fees. It might also be possible to regulate administrative fees or require providers to display these (and the differences between their fees for Package and non-Package services) on the Panel provider list.
8.2 Some would like more flexibility in how the funding can be spent
Some families suggested a need for more flexibility in how the funding can be spent. Some 2011 family survey respondents suggested greater flexibility to choose their provider. Others wanted to be able to continue with their child’s existing non-Panel provider or lacked another option because there weren’t local Panel providers. Some wanted greater flexibility in the types of interventions funded including in-school supports (like aides) and biomedical or alternative therapies. One family that contacted the team suggested funding should cover all relevant needs, including community integration and sleeping and feeding issues related to autism.
We, as parents, should have more control over how and where our money is spent. [Family survey respondent]
It would have been handy to have a portion of money to use as we pleased, especially when our providers were not linked to the package funding - we had to use own money & this was very difficult for us financially. [Family survey respondent]
I would rather [sic] been able to continue accessing private qualified therapists our family was already using rather than have to get to know new service providers. [Family survey respondent]
For me I would rather put the Autism Package $12,000 towards my son going to an autism school where he could get the small group therapy that these children need. [Family survey respondent]
Being able to convert some of the funding to more Medicare visits on top of the 20 provided in the Autisum [sic]/Mental Health package [Family survey respondent]
77

My son has been afraid of water for a very long time. I enquired with the Autism Advisor whether we could use this funding to purchase private 'swimming' lessons for our son and was advised that such a service could not be funded but we could engage a psychologist to see why he is so fearful. [Family survey respondent]
Bio-medical programs ought to be covered as this line of approach has had a MASSIVE positive impact on our child. [Family survey respondent]
A very small proportion of survey respondents suggested families should be able to spend more than $6,000 of the funding in one year.
It would have suited my child better if access to the entire $12,000 funding was available as needed, rather than broken into two $6,000 sums -- In the first year…he benefited from intensive intervention from various providers and I found the $6,000 wasn't enough to cover all of his needs. [Family survey respondent]
A very small number of diagnosticians also suggested some more flexibility in funding including allowing children to access other qualified practitioners not on the Panel or to continue with a therapist with whom they have an existing relationship.
While there is argument for greater flexibility, previous experience shows changes that introduce ‘grey areas’ to what is allowed can create confusion and inconsistent practice. Also, there is a need to consider the risk of funding being used for non-evidence based interventions—though only a low proportion of families surveyed suggested they should be able to spend funding this way, 28% indicated using biomedical or alternative therapies for their child.
Box 9.4 We had to spend our own money because the treatments we want aren’t covered
Debbi and her husband Peter live in regional Queensland with their children, two of whom (Anna and Hamish), were diagnosed with autism at age three. The couple run a successful business and had their children late, so were in a good financial position when the children were born. The family was in a position to pay for a private paediatrician during the process of diagnosis, and to pay for centre-based early intervention after Anna and Hamish were diagnosed. They have paid for Anna and Hamish to have more private speech and occupational therapy sessions than they would have received if they were relying solely on the Package.
But not all the treatments that Debbi and Peter want for their children are covered by the Package. They paid for Peter to go to America to learn how to implement the home-based Son Rise program, and then to modify their house for home-schooling Anna and Hamish. The family pays an early childhood teacher to come to their home and assist with schooling. Anna and Hamish also receive biomedical vitamins and injections therapy, which cost $500 per child per month. To get these vitamins, they pay a biomedical paediatrician $400 for an hour review every three months. The family plans to pay for Anna and Hamish to start Brain Gym, a kinesiology program for children with autism, and to receive sound therapy. Debbi and Peter feel lucky to be able to buy the therapies they want for their children. But it is expensive to do so, and they feel guilty that they spend less on Anna and Hamish’s siblings as a result. Debbi and Peter say that it would be useful if they could buy the range of services and resources they
78

want using Package funds.
8.3 Mixed views on sustainability of the payment model
Panel providers surveyed had mixed views—across provider types—on whether the payment model is sustainable. Some were uncertain or suggested changes are needed; others had already made changes to ensure the true costs of service delivery are covered, mostly by raising fees to cover administrative costs. While the concerns about sustainability are widespread, there is little indication that they have yet led to providers’ ceasing to deliver Panel services.
Those that believe the model is unsustainable or has issues raised a range of common issues discussed below (in order of frequency).
8.3.1 Inability to charge for non face-to-face time
Some currently have charges that cover these aspects of service, but some of those not currently charging are concerned about sustainability. Providers need clarity on what can and cannot be charged. This should duly consider sustainability of services as well as the implications for service fees.
FAHCSIA should also recognise that preparation of reports and programs, and meeting with other professionals to prepare joint plans all takes time and in theory cannot be claimed. How then are professionals to be expected to provide these essential parts of the service—out of the goodness of their hearts??? [Panel provider survey respondent]
8.3.2 High administration burden
The administrative work associated with Panel membership has been raised as a significant issue throughout the evaluation. Panel providers generally spend more time on administration for Package clients than on other programs38, and most of those who raise their fees for Package services cite covering administration costs as the reason. In particular, providers surveyed and interviewed raised issues with FOFMS—the system is slow, it sometimes crashes in the middle of processing payments, and sometimes locks them out. A few raised issues with the need for two people to approve payments, seeing this as over the top. One sole provider was particularly concerned because they didn’t have another staff member to check off payments.
Panel providers appear to have different understandings of whether they are permitted to pass on administrative charges to families; and some are simply reluctant to do so. Surveys and interviews of consortia members raised issues with the amount their lead agency charges them to process claims. Some indicated they’d taken over administration 38In the 2010 Panel provider survey only 25% agreed the amount of time they spend on admin for Package clients is similar to the time spent on admin for other clients; the high administrative workload was also raised in 2011 qualitative data.
79

from their lead agency, but not all we spoke to seemed aware they could do this. Some consortia members, however, saw fees as a reasonable exchange for lifting their administrative burden. In practice, lead agencies’ administration fees seem to vary considerably.
The large amount of time spent administering the service, claiming funds and procuring resources is not covered by HCWA. [Panel provider survey respondent]
The payment model is very expensive to administer. That is why we need to charge families more. [Panel provider survey respondent]
FOFMS—Completely user UNfriendly. Archaic, clumsy, slow. No notification of changes to the training video whereabouts. Most frustrating to use. Needs a complete overhaul to allow efficient processing. [Panel provider survey respondent]
8.3.3 Fee-for-service model
Views of the fee-for-service model were somewhat mixed.
Some NGOs mentioned that block funding, which they currently receive for other services, makes services easier to sustain. A couple, though, have seen the Package as the first step in the broader trend toward individualised funding models, as apparent with the announcement of the National Disability Insurance Scheme (NDIS).
The fee for service creates difficulties in engaging permanent staff as it is reliant on the number of families who take up services with us. We cannot assume that we will get the same number of families accessing our services from year to year so tend to employ staff on annual contracts. this makes it difficult to sustain the workforce. [Panel provider survey respondent]
On the flipside, a few providers described Panel membership as enhancing the sustainability of their service, mainly mentioning the benefit of having a regular income that is not tied to clients’ ability to pay for services.
The biggest benefit is the regular income. You know you will definitely get your money from FaHCSIA clients. [Panel provider interviewee]
8.3.4 Inability to charge for cancellations and multi-session programs
Cancellations
Some Panel providers surveyed and some of those interviewed raised concerns about their inability to recoup fees for cancelled sessions, which they cannot claim under the Package. But the policy for not allowing claims for cancelled sessions from Package funding is consistent with Medicare and private health funds’ practice.
Some of those that raised issues with cancellation fees claim that Package clients are more likely than others to cancel sessions. Some believe this is because they value the
80

service less because they are not paying for it. This claim cannot be objectively assessed because there is no service-wide data on standard cancellation rates versus cancellations under the Package. But there are claims from other stakeholders that individualised funding better engages families in services; and one state-based service claimed that the Package has led families to devalue state-based services because they’re not paid for.
One Panel provider we spoke to suggested parents pay a means-tested contribution fee for services to ensure parent ‘ownership and engagement’. But this would inhibit access for families with less means to pay. There would probably be more support for this provider’s other suggestion that there be better parent education about their expected role in their child’s therapy.
A lot of our therapists have found families extremely unreliable in cancelling sessions—you’re not allowed to take cancellation fees through HCWA. We have a cancellation policy that says have to pay $50 if cancel within two hours, so we send them a bill and they never pay it. [Panel provider interviewee]
Clients tend to not attend sessions, leaving other clients waiting for appointments. Being a private billing practice, we cannot charge a non-attendance fee through HCWA, and some clients fail to come back to pay this fee when charged. Some clients do not value the service that they are receiving, as they do not pay for it. [Panel provider survey respondent]
Multi-session programs
The Package is intended to give families the ability to choose services for their child and the flexibility to change providers if they think a service is not suited to them. Therefore Panel providers are not able to charge families in advance for multi-session programs. Some said this challenges the viability of these programs. A couple we spoke to said it meant their multi-session group programs had run at a loss and they were reluctant to offer them again. One provider running group sessions had to raise the fees for all families to sustain the losses for non-attendance, but thinks this is unfair to those that attend regularly. This provider also noted that charging in multi-session blocks would decrease administrative costs and allow them to funnel the money saved back into supporting families.
But a representative of one the professional colleges/ associations was concerned some providers make parents commit to block sessions (even if they can’t be claimed upfront), arguing that this doesn’t give families the choice to opt out if a service doesn’t work for them. One provider we spoke to said they’d be happy to refund un-used sessions if a family no longer wanted to continue for this reason and felt issues like this could be worked out if discussed.
The challenge in considering this issue is balancing family choice with service sustainability and the implications for service fees or services not being offered.
81

8.3.5 Processing payments
Speed of payment
Providers generally indicated they’re happy with the speed with which accounts are paid. But a few, mostly consortium members, had experienced delays in payments, suggesting these may be because of delays in the consortium lead lodging claims.
Over-claiming
A few providers noted some families who are accessing multiple providers use more services than they can afford within the funding. The Queensland Advisor Service also noted this as an issue in their report to FaHCSIA (November 2010–June 2011). Some have been unsuccessful in recouping money privately when this occurs; one non-government provider says the few times this has occurred they’ve preferred not to damage their relationship with the family by trying to charge them because they knew the family could not afford it.
We sometimes find that we have provided a service to people who don’t have any money left. The consortium members do try to keep us up to date, but if a client is using multiple services it can be really hard. That tends to happen a lot towards the end of the financial year. [Panel provider interview]
The requirement for invoices to be processed within one month (introduced in late 2010) may help to address this issue.
8.4 The resources policy—some issues
While most families (91%) and Panel providers (92%) surveyed agreed resources purchased using Package early intervention funding have been important to children’s outcomes (see Appendix 2 for data), families and Panel providers have identified issues with the resources policy. One professional college/ association representative was concerned that the resources component takes away from the Package’s focus on early intervention, though they recognised the benefit for families without local services.
8.4.1 Some issues identified by families
Just under three-quarters (71%) of families surveyed agreed they’d been able to easily obtain resources to support their child’s/ children’s therapy through Package funding (see Appendix 2 for data). But some commented on difficulties they’d had purchasing resources and concerns about fees charged for processing resources claims (as did some Advisors). A family that contacted the team during the final evaluation said families should be able to claim for resources directly to avoid costs, but this could disadvantage low-income families who could not afford the upfront costs.
82

I found the procedure in ordering resources through HCWA a nightmare. We ended up buying virtually all of ours out of pocket due to the time frame and difficulty with the process. [Family survey respondent]
More control over buying resources for your own child. Very difficult going through a therapist. WE know our children best and often can source resources cheaper as we've been researching for a long time for our kids. I'm wasting precious funding for the time it takes my therapist to buy and source resources that I can buy myself. [Family survey respondent]
8.4.2 Some providers’ lack clarity
Some changes have been made to the resources policy over time; currently resources can be approved by Panel providers if they form an integral part of a child’s therapy. As it stands, only two-thirds (66%) of Panel providers surveyed agreed the resources policy is clear; and more of these tended to agree (55%) than agree (11%) (see Appendix 2 for data). But those providers who raised issues felt a list of approved resources would not help because each child’s needs are different.
My biggest concern is that FaHCSIA will say what is NOT in the scope of resources, but they don’t really say much about what’s in scope. They say that you need to use your professional judgement. But, for example, I have bought early literacy resources for some children, and yet the newsletter says that academic research is not in scope. So I am really uneasy about it all. [Panel provider interviewee]
8.4.3 Claims of pressure from families
Some Panel providers said families are pressuring providers to approve resources such as iPads and trampolines that they feel are unwarranted. A few said some families came to them with shopping lists, and a few were concerned that parents chose resources that were more for themselves than for their child. Resisting this pressure can strain therapeutic relationships.
They all want the iPad and trampoline...Parents find out other families have equipment so want that. They don’t know how to evaluate long-term needs for their child. [Panel provider interviewee]
...not against trying iPads but it has to be necessary part of their ongoing program with us. That’s what clients don’t get. They get so much info and misinformation; they come expecting to give a shopping list. [Panel provider interviewee]
8.4.4 Administrative time required
A small proportion of providers surveyed and some interviewed raised concerns about the significant time required to process resources claims, and some about an inability to adequately recoup the costs, particularly the recent ruling preventing them from charging administrative fees for processing these claims. From previous years, there is anecdotal evidence to suggest some providers may refuse to purchase resources
83

because of the time involved. A few of the non-government providers we spoke to in 2011 indicated families had come to them purely to access resources. A state-based service said they’d had private providers approach their service to develop or provide resources (for example, visuals for PECS programs) because they can do it for ‘free’. Another state-based service and state department representative were concerned that some families pay a lot for resources but don’t receive much follow-up support to make use of the resource.
Despite FaHCSIA's interpretation of resource purchasing being a minor 'extra' in terms of time and administration, the reality is that it is a significant burden if it is done properly. Many families are unable to research and/or purchase their own resources… [Panel provider survey respondent]
8.4.5 Suggested changes to resources policy
Despite the issues, providers consulted generally said it’s important for professionals to approve resources (as did those surveyed in 2010). Only one we spoke to said the cost of administering the policy and the difficulties involved when they don’t approve resources a family wants means the benefits of provider approval are not worth the cost.
But only a few providers made specific suggestions to address the issues with the resources component.
Provide clearer and more consistent information to parents about the resources policy, so they understand that a resource must be relevant for their child—they are not entitled to it simply because another family has received it.
Give providers more clarity on the policy and what can and cannot be approved. A few thought case examples in the newsletter would be useful; others were not convinced.
Enable providers to charge for researching, sourcing and accessing resources.
Box 8.6 Family unable to access resources
Susie and her husband Peter live with their three children—their oldest son Aaron was diagnosed with autism at age three in 2009. They were keen to use their funding for an iPad when they heard other families had been able to because it’s hard work keeping their son motivated, but he’d really engaged when using iPhone applications with his state-funded speech pathologist and at home with them. They’d also read about a non-verbal child with autism learning to communicate with his family using an iPad. But their Panel provider would not approve an iPad because they didn’t see it as part of the program they had with their service. The family couldn’t afford to buy an iPad; luckily a family member gave them one.
They were also unable to use their funding for a trampoline—though they’d heard other families had been able to. They thought a trampoline would help with Aaron’s stimming. They’ve since bought their own trampoline and say it’s the best money they’ve ever spent because they’re outside all the time and Aaron is playing with his siblings.
84

The family have struggled to spend their funding because there aren’t many service providers nearby. They’d really like to be able to spend their funding to top up the time he’s able to be supported by an aide in school because it would mean more time for them to help him interact with classmates and to keep him focused.
8.4.6 Potential difficulties for some families in regional and remote areas
While some stakeholders noted the potential benefit of the resources policy for those in regional and remote areas with access to fewer local providers, others claimed these families may find it difficult to claim for resources because they don’t have a relationship with a Panel provider that can approve the purchase. Reflecting the issues for these families, family survey respondents from the Northern Territory were the least likely to agree (47%) they had been easily able to obtain resources with the funding. Those in remote areas were less likely to make claims for resources.
One Advisor Service and some state department representatives and state-based services suggested other qualified professionals, including state-based services be allowed to approve resources for families without a local Panel provider.
Table 8.3: Resources claims by location
Made claims for resources No claims for resources
n % n %
Major Cities of Australia 5937 49% 6169 51%
Inner Regional Australia 1997 60% 1348 40%
Outer Regional Australia 729 56% 577 44%
Remote Australia 62 45% 77 55%
Very Remote Australia 20 34% 38 66%
TOTAL 8745 52% 8209 48%
No data 9 4Source: FOFMS data July 1 2008–November 3 2011
8.5 Outer Regional and Remote and Access Support Payment
8.5.1 Processing the Payments—a need for greater clarity
Access Payment expenditure data reflects distribution across the states in roughly similar proportions as in 2009. Because families may be eligible for the Payment, based not only on location (ARIA+) but on other factors affecting their ability to access services, it is not possible to assess whether distribution is in line with expectations. The three most populous states account for most of the expenditure.
Table 8.4: Distribution of Access Support Payments (July 2008–November 2011)
85

State/ territory$ Access Support
Expenditure
% of all Access Support
Expenditure
QLD $2,400,000.00 27%
VIC $2,318,000.00 26%
NSW $1,958,000.00 22%
SA $836,000.00 9%
WA $680,000.00 8%
TAS $332,000.00 4%
NT $234,000.00 3%
ACT $60,000.00 1%
Total $8,818,000 100%Source: FOFMS data July 1 2008–November 3 2011
Expansion of the eligibility criteria in 2009 (opening the Payment to families with significant factors impacting on their ability to access services) saw a huge growth in expenditure to 2010 because of the ‘grey areas’ this created in eligibility. Expenditure only increased by $1,472,000 between November 2010 and November 2011, suggesting the changes made to approval process in November 2010 have brought Payments back to within more expected levels.
But data suggests some issues remain with clarity about the Access Payment—less than half (46%) of Advisors surveyed agreed eligibility criteria for the Access Payment are clear, down from 80% in 2010. Qualitative data from Autism Advisors (forum, survey, focus groups and Advisor Service reports) reflects this issue, with some unclear about the conditions required for approval. One Service (in their report to FaHCSIA) suggested it would be easier if the Payment were only available to families based on ARIA+ because others have been unlikely to get approved. Advisors also noted difficulties occur when families are aware of others that received the Payment prior to eligibility changes or when there are delays in the approval process or FaHCSIA does not provide a full explanation of why an application is declined so Advisors cannot explain to families.
8.5.2 The Payments help with service access but may not always be sufficient
The Access Support Payment is intended to help families access services and many families surveyed agreed that it had (2010) (see Appendix 2). Family survey data (2011) suggests families most commonly spent this Payment on resources to support their child’s therapy. The next most common usages were payment for travel and additional interventions—from private providers not on the Panel, for types of interventions not approved by the Panel, or from providers whose Panel status they did not specify.
86

Other, much less common uses included alterations to the home environment to suit the child with autism, support for siblings not eligible for the Package, assisting with the cost of re-location to be closer to services, school-related costs, assessments, parent workshops, and research.
However, indications from other stakeholders including some Advisor Services and state department representatives are that the Payment is insufficient to overcome obstacles in some cases such as high travel costs in the Northern Territory. The Tasmanian STO noted that while the north west of Tasmania lacks local services and transport options, some families there are not eligible for the Access Payment. Also, the Payment might not be enough for some families there because of the distance to service providers and the limited transport options.
87

9. Ensuring quality and best practice
Having a Panel of approved providers is intended to ensure children receive only best practice early intervention services with their funding. The original requirement for providers to be multidisciplinary organisations or to form consortia aimed to ensure children receive a coordinated and multidisciplinary service. While sole providers are now allowed to join, they are also expected to coordinate.
9.1 Concerns about quality
Families and Advisors surveyed generally agreed (>80% agreed) most Panel providers offer quality services. While diagnosticians were slightly less likely to agree, this may relate to their self-reported lack of knowledge of providers (see Appendix 2 for survey data).
But throughout the evaluation, representatives from a range of stakeholder groups (including families and Advisors) raised concerns about the quality of services delivered under the Panel. While most stakeholders raised general rather than specific concerns about quality, a small number of stakeholders raised significant complaints about a few specific providers. FaHCSIA has since investigated these. Some stakeholders, including a representative of one of the professional colleges/ associations and some state department representatives, raised concerns about specific interventions or resources allegedly being delivered under the Package including sensory integration, conductive education, facilitated communication, therapeutic listening, Makaton, brushing and weighted vests (though a parent we spoke to described how brushing had helped her child).
Only a small proportion of family survey comments related to Panel provider quality: some were positive, some raised concerns. Most families we followed up and most Indigenous families we spoke to were generally satisfied with most of their Panel providers. A couple CALD families we spoke to raised concerns about provider quality, as did a couple families that contacted the team during the final evaluation.
The level of expertise of the providers with autism knowledge and experience in [metro area] was excellent. [Family survey respondent]
I have found this service to be so supportive and has helped my child and family, more than I thought was possible. The staff of the service providers and the autism advisor have been completely dedicated to helping me and my child. [Family survey respondent]
88

The quality of services can be patchy and I would much rather have the ability to pick and choose quality services and use them over a longer period of time than the current system allows. [Family survey respondent]
It is also disappointing that when you do find a provider with an opening, many are using junior therapists with little or no experience in autism and charging them at excessive rates and blaming the high demand on services. [Family survey respondent]
There are a lot of inadequately trained people delivering services…these people deliver services through a consortium who bill in the name of the lead. [Panel provider survey respondent]
Some concerns related to Panel providers delivering non-evidence based interventions as part of their private practice, which FaHCSIA cannot control. A representative of one of the professional colleges/ associations was particularly concerned about this because Panel membership gives these providers ‘credibility’. We understand that the FaHCSIA Panel provider lists now notes if they deliver non-evidence based intervention—this process should be continued.
There were also a few broader concerns that providers are self-interested in encouraging service use. But many Panel providers we interviewed mentioned selfless reasons for joining: because families had asked them, because there were few or no other local providers, and to provide services to families that could not otherwise afford them. Though some did mention joining to grow or change the focus of their business.
I think the HWCA package is vulnerable to misuse. I feel service providers shouldn't be able to diagnose & provide services. I think this is a conflict of interest. [Panel provider survey respondent]
The only reason I joined the Panel was for the families we saw—parents were asking us to go on the Package. [Panel provider interviewee]
There was no one else locally who was registered and so I decided to start the process... [Panel provider interviewee]
9.1.1 Some differences between families’ views on quality
A lower proportion of those from the Northern Territory, Tasmania and the ACT than those in other states agreed their local Panel providers had enough expertise in autism or offered quality services—the difference was greatest between those from the Northern Territory and others. Low income families were also slightly less likely than others to agree that providers had sufficient expertise and provide quality services.
9.1.2 Perceived need for a quality assurance process
Quality is assessed as part of a provider’s Panel application, but there is not currently a quality monitoring process to review practice, besides the investigation of particular complaints raised with FaHCSIA. One of the main concerns about quality (from Advisors, Panel providers and representatives of the professional colleges/ associations) is the
89

lack of a quality assurance process. Many are concerned about providers’ ability to hire new staff not included in the original approval.
Because stakeholders were not systematically asked about the preferences for a quality assurance mechanism we are not able to assess the levels of support for particular approaches.39 Suggested options for quality assurance (noted in 2011) included
building on professional associations’ registration processes using Medicare quality processes such as random and targeted audits and
continuing professional development (CPD) requirements audits, but some noted this process would need to be a positive feedback experience requiring providers re-register after a certain period to assess new staff using family surveys requirements to report back to paediatricians.
An Advisor survey respondent suggested a role for Advisors in monitoring quality but this would be unpopular with other stakeholders and would open the Services to further accusations of bias.
We’ve never been audited. We have to do all this stuff to get pre- and post- data together…but will they ever look at it? We need service provider accountability under the Package. There should be a percentage of providers audited each year [Panel provider interviewee]
Think we spend a lot of time getting it all right [quality service provision]. So we’d be comfortable with that [an audit of a percentage of providers]. It would have to be a positive feedback experience though—not we suddenly chop you off the list [Panel provider interviewee]
A couple of diagnosticians and some Panel providers suggested a need to better educate families about effective and non-effective interventions. Families we followed-up had often done their own research, but as one CALD family who were generally satisfied with their providers said, ‘but how would I know if they’re good?’ Given that the Package cannot prevent families being exposed to claims about non-evidence-based interventions, this may be an effective strategy to help families make good choices about services.
Similarly, one option suggested by a state-based service was to make information about providers’ programs (their evidence base, staff skills and experience) and the selection criteria for the Panel transparent and easily available—that way, families and other stakeholders might know what would qualify as a reportable breach of practice.
39 In 2009 when specific questions were asked about quality assurance processes stakeholders’ suggestions included independent audits/ quality accreditation, self-assessment to demonstrate up-to-date skills, experience, professional development, through professional bodies (existing certification/ approvals to be built on), client surveys (noting these have some limitations), and supervision and mentoring for new graduates.
90

One family that contacted the team wanted a clearer complaints mechanism (a state department representative also mentioned a need for this). 40 But we understand from FaHCSIA (Autism Advisor Forum 2011) the complaints process can be complicated because of the need to ensure family confidentiality.
9.1.3 Practitioner expertise and experience
On the whole, Advisors and families surveyed generally agreed most providers have adequate expertise in autism. But some stakeholders41 were concerned that Panel providers lack expertise and/or sufficient experience in working with children with autism. One family we followed up was quite concerned that their providers seemed to be ‘learning on’ their child—theirs was a complex case because the child had co-morbid disorders. Some providers were concerned the Package had encouraged practitioners without experience to provide services; there were also some concerns about junior therapists. And a few Panel providers we spoke to did describe being able to develop or increase their skills in working with children with autism as a benefit of Panel membership.
The 2011 Prior and Roberts review recommended providers be required to have a minimum of two years’ experience working with children with autism to join the Panel, as did a few providers we spoke to. But some others made comments that ran against this recommendation. One provider said they’d had success recruiting and up-skilling newer graduates because they provided adequate mentoring and ongoing support. Another provider said the requirement is unnecessary because ‘you’re treating functional communication disorders, you’re not treating the disorder’.
There are also some indications this might limit Panel capacity. In considering this option, the extent of concerns about experience would need to be balanced with concerns about meeting demand.
…think experience in autism is needed for provider to be on the Panel. But that experience with autism could be difficult to find in [regional areas] where employment opportunities are limited… [Panel provider interviewee]
40 FaHCSIA has since investigated this family’s concern with a provider as they have done for other complaints.41 These include some families, Panel providers and Autism Advisors, state-based services (some also providing Package services).
91

Box 9.1 Quality: providers have been good
Cathy and Michael live in South Australia with their son, Steven, who is five years old. Steven was diagnosed with autism just before he turned two.
Since just after his diagnosis, Steven has been regularly seeing the same speech pathologist and occupational therapist (although there have been some changes in staff)—both are Panel members. Cathy has continued with these providers because Steven is doing well, ‘I am very happy with the services’. Cathy noted that since seeing the speech pathologist Steven’s speech has improved so he can follow directions better and he can now understand his parents. The occupational therapist has helped calm Steven down. The occupational therapist and the speech pathologist know that Steven is also seeing the other, and Cathy commented that they work together if they need to. The speech pathologist sought advice via email from the occupational therapist about how to calm Steven before her speech sessions with him.
Box 9.2 Quality: concerns about expertise and product push
Sandra and her husband John have one son, Adam, who has Asperger’s Syndrome and is deaf. In the second year they had access to the funding they changed some of the providers that were seeing. They’d felt pressured by one consortium to buy some resources that they thought were particularly expensive and to take on weekly sessions without an explanation of why or what specifically it would help them achieve. They also found their appointment times inconvenient and were concerned by the charges for missed appointments they had to pay out of pocket—Adam is often sick and has had to miss appointments, so this became quite costly. While Sandra is generally happy with the providers her son is seeing now, she is concerned about the lack of local private practitioners with expertise in autism. The family has felt like providers have been learning on their child, which isn’t going to ameliorate his problems. Sarah is also concerned that an ‘autism industry’ has developed since the funding became available, with providers charging more for services and some focused mainly on the bottom line. Because of this and her perception of the lack of expertise, she would prefer if instead of Package funding they could access additional services from the state-based service.
9.2 Evidence-based interventions for autism
The Panel model is designed to ensure funding is used only for interventions with an evidence base for children with autism. While a small proportion of stakeholders suggested a need for other service types to be available under the Panel, assessing the merit of various intervention types was not a focus of the evaluation. FaHCSIA should be guided by the recent Prior and Roberts review42 in any consideration to expand interventions available under the Panel.
42 Prior and Roberts et al, 2011, A Review Of The Research To Identify The Most Effective Models Of Practice In Early Intervention For Children With Autism Spectrum Disorders
92

9.3 Concerns about some aspects of best practice, particularly multidisciplinary intervention
9.3.1 Individualised planning, programming and review
Individualised planning, programming and review are among the basic good practice principles Prior and Roberts cite as fundamental to working with young children and their families.43 Evidence from the evaluation suggests these are generally part of Panel providers’ practice.
Most Panel providers surveyed said they develop individualised plans to meet the needs of children with autism (89%) and set goals for children and review their progress (92%)—with only very slight variation across provider types.
No major concerns were identified with this aspect of best practice besides some concerns about some charges for assessments and new assessment processes being needed with each provider.
9.3.2 Generalisation strategies
Available evidence suggests strategies to promote the generalisation of new skills —one of the key elements of effective intervention for children with autism44—are generally part of Panel providers’ programs. The majority of providers surveyed said they use strategies to promote the generalisation of new skills (89%).
9.3.3 Addressing children’s need for predictability and routine
As children with autism become more socially responsive and attentive when information is provided in a highly predictable manner, services can address this by establishing routines within sessions and using visually supported routines .45 The majority of providers surveyed said they address children’s need for predictability and routine in their practice (90%).
9.3.4 Family-centred practice
Family-centred practice is one the basic principles of good practice that Prior and Roberts cite as fundamental to working with young children and their families.46 While
43 Prior and Roberts et al, 2011, A Review Of The Research To Identify The Most Effective Models Of Practice In Early Intervention For Children With Autism Spectrum Disorders44 Prior and Roberts et al, 2011, A Review Of The Research To Identify The Most Effective Models Of Practice In Early Intervention For Children With Autism Spectrum Disorders45 Prior and Roberts et al, 2011, A Review Of The Research To Identify The Most Effective Models Of Practice In Early Intervention For Children With Autism Spectrum Disorders46 Prior and Roberts et al, 2011, A Review Of The Research To Identify The Most Effective Models Of Practice In Early Intervention For Children With Autism Spectrum Disorders
93

data from Panel providers suggest they include and work with families, some stakeholders are concerned Package services are not family-centred.
Most Panel providers surveyed indicated they involve parents in planning their child’s intervention (93%) and advise parents how they can continue their therapy in the home (93%). But multidisciplinary respondents were more likely to describe these as part of their practice. Among the providers we spoke to, aspects of family-centred practice were evident across provider types, but more strongly among multidisciplinary organisations.
A substantial proportion of Panel provider survey respondents also indicated they provide home and community visits (78%) and parent training (71%) as one of their services—which would form part of family-centred approaches.
State-based services (some of which also provide Package services) and some state department representatives are particularly concerned that some Package services (particularly those of private practitioners) are not family-centred, claiming the Package favours a one-on-one medical model rather than capacity building with families.
Because we didn’t specifically ask families about family-centred practice, it is difficult to assess these competing claims. A few families we followed up and some CALD families we spoke to described receiving advice from Panel providers about therapy in the home; a few others received this advice from state-based services. But one family that contacted the evaluation team during the final evaluation raised significant concerns they had been excluded from their child’s therapy; one CALD family said that while her therapists listen they don’t listen to what she suggests her child needs (in terms of resources); and another family we followed up found their Panel provider forgot the things they’d said agitated their child between sessions.
We have learned a lot from the speech therapist about how to relate to him and manage his behaviour and meet his needs. [Follow-up family interviewee]
Some providers said some families view the therapist as an expert and want to be told what to do and others see the child’s therapy session as a chance for respite. But 2010 Panel provider survey data suggest most families were actively engaged in their child’s individual service plan. When they have come across less engaged families, the providers we spoke to encourage the families to participate. One provider we spoke to said that some families want them to do weekly sessions working only with their child. Although this is not ideal, they’ve accepted it because they believed at least this way the child will get some assistance.
Suggestions for enhancing family-centred practice
The data suggest Operational Guidelines should be reviewed to ensure they adequately cover family-centred practice and that family-centred practice should be assessed as part of a quality monitoring process.
94

Given some providers’ are concerned some families’ see them as experts or don’t engage in therapy sessions, education and support components could also be strengthened to include more material to inform families about their expected role in their child’s therapy.
9.3.5 Multidisciplinary practice
Multidisciplinary practice is one of the basic principles of good practice Prior and Roberts cite as fundamental to working with young children and their families and an important aspect of intervention for children with autism.47
Accessing multiple services
While some stakeholders claimed that families focus only on one intervention type because they can only afford or manage one intervention at a time, available evidence shows most families have accessed multiple services. But, from the available data, it is not possible to assess whether families were accessing these services at the same or different times.
Table 9.1: Number of service types claimed
Number of service types accessed
2008–09 2009–10 2010–11 2009–11 Total
n 4120 5052 4901 1165 15238
1 13% 9% 15% 40% 14%
2 17% 19% 27% 34% 22%
3 23% 29% 28% 17% 26%
4 21% 23% 19% 7% 20%
5 15% 13% 7% 1% 11%
6 7% 5% 3% 1% 4%
7 3% 1% 1% 0% 1%
8 1% <1% <1% 0% <1%
9 <1% <1% <1% 0% <1%
TOTAL 100% 100% 100% 100% 100%
Source: FoFMs July 1 2008–November 3 2011
Family survey data, which includes the services families access privately or through state-based services, suggests most families have accessed between 2 and 4 service types (assuming only one additional service for those that selected ‘other’ services), not including childcare, preschool or playgroups. But from the available data it is not possible to tell if families have accessed multiple providers delivering the same intervention type.47 Prior and Roberts et al, 2011, A Review Of The Research To Identify The Most Effective Models Of Practice In Early Intervention For Children With Autism Spectrum Disorders
95

Table 9.2: Types of services family survey respondents were accessing or had accessed for their child
No of service types*
No of children
% children Cumulative %
1 276 7.3% 7.3%
2 771 20.4% 27.7%
3 1028 27.2% 54.8%
4 800 21.1% 76.0%
5 499 13.2% 89.1%
6 244 6.4% 95.6%
7 102 2.7% 98.3%
8 44 1.2% 99.4%
9 16 .4% 99.9%
10 2 .1% 99.9%
11 2 .1% 100.0%
12 1 .0% 100.0%
Total 3785** 100.0%Source: Family survey 2011, Q33*Figures based on responses from families with one child for services excluding childcare, preschool or playgroups. **Excludes 35 families with one child only accessing childcare, preschool or playgroup options.
A few providers were concerned that the model has led families to take up whichever service becomes available first, not necessarily the one that best meets their child’s needs. Some were concerned that families frequently change between services, which causes fragmentation, and may limit benefits. A couple of state-based services (some also delivering Package services) said the Package has created a ‘more is better’ mentality—some cited early intervention research that shows accessing more services from more providers has a negative effect on outcomes48. But from the available data it is not possible to assess these claims.
Families are doing a lot of chopping and changing between services; that makes it hard to get a continuous program going. [Panel provider interviewee]
Service types accessed
Under the Package, speech pathology and occupational therapy were the most common services claimed.
48 ‘Dunst, Brookfield & Epstein (1998) found that more services provided more frequently by more practitioners was negatively related to parent well-being and functioning’ (Carl J. Dunst, 2007, Early Intervention for Infants and Toddlers with Developmental Disabilities, Handbook of Developmental Disabilities, edited by Odom, Horner, Snell & Blacher, The Guilford Press).
96

Table 9.3: Claims by service type
Claimed service providedNumber of
claims% of all claims
Speech Pathology 176373 37%
Occupational Therapy 131131 28%
Resources 25615 5%
Behavioural Interventions 43079 9%
Family Based Interventions 21167 4%
Therapy Based 24065 5%
Other Service 13715 3%
Child Psychology 19924 4%
Developmental Interventions 11475 2%
Social Learning Interventions 8947 2%
TOTAL 475491 100%Source: FoFMs July 1 2008–November 3 2011
Speech and language therapies (90%) and occupational therapy (82%) are the most common types of services accessed in family survey data, which includes services accessed privately and through state-based services.49. About half (47%) accessed a child psychologist. Over one-quarter (28%) accessed medical, dietary, complementary or alternative interventions, suggesting there may be a need for more education about these approaches.
Coordination between providers50
Table 9.4: Providers’ views on multidisciplinary practice under the Package model
Provider type %
Having multidisciplinary services or consortia helps ensure families receive coordinated services for their child
Lead agency of consortium 78%
Consortium partner 73%
Multidisciplinary EISP 92%
Sole provider 75%
TOTAL 82%
Our organisation has difficulty meeting the requirement to achieve multidisciplinary practice
Lead agency of consortium 41%
Consortium partner 48%
Multidisciplinary EISP 25%
Sole provider 49%
TOTAL 40%Source: Panel provider survey 2011
Most Panel providers surveyed51 agreed having multidisciplinary services or consortia helps ensure multidisciplinary practice. Respondents from multidisciplinary organisations were about 1.2 times as likely to agree with this proposition as providers
49 This data is based on responses from the 3820 families with only one child with autism so it is clear at the individual level which services a child is accessing and how many services they’re accessing.50 Detailed chapter data is provided in Appendix 2 and case studies in Appendix 3. 51 Eighty-six% of Panel providers agreed in 2010 and 82% agreed in 2011
97

of other types52. But interview and survey data suggest this requirement is insufficient to ensure coordination.
Of Panel providers surveyed, 40% have difficulty meeting the requirement to achieve multidisciplinary practice. Consortia and sole providers (combined) were almost 1.8 times more likely than multidisciplinary organisations to say they have this difficulty.
In their overall comments, about 10% of Panel provider survey respondents mentioned that the Package model does not ensure multidisciplinary practice, with many of these feeling the Package has led to service fragmentation because coordination is not funded. Only a few providers we spoke to described enhanced professional networking as a benefit of Panel membership.
There are a lot of services being provided in isolation by sole practitioners due to lack of incentives to work with other providers. [Panel provider survey respondent]
Being a private provider and working from home can really be really isolating. I'm really happy to have comprehensive meetings once a term with the rest of the consortium, as well as having a more collaborative approach. [Panel provider interviewee]
Coordination within consortia or multidisciplinary organisations
The view that multidisciplinary services or consortia will ensure coordination assumes that children will access all of their HCWA services from the one organisation or consortia. But evidence from interviews and the 2010 Panel provider survey indicate this does not always occur.53 Parents put their children down on a range of waiting lists and may access the first available. Not all consortia have all of the types services a parent intends to access for their child, and some consortia have members located in different towns or different areas of the state making shared clients less likely.
Even when a child accesses multiple services from within one organisation or consortium, this does not guarantee they will receive a coordinated service. Interview data suggest coordination, when it occurs, is mostly informal because of a lack of time or in, some cases, the inability to charge for coordination time. This is reflected in the survey: providers are more likely to discuss and review the child’s progress together (71% say they do this for all or most shared clients) than develop a joint treatment plan for the child (48% do this for all or most children).54
Table 9.5: Providers’ practice of coordination within a consortia or multidisciplinary organisation52 This pattern holds in 2011 Panel provider survey only; in the 2010 survey lead agencies were slightly more likely than multidisciplinary organisations to agree with this statement. 53 2010 Panel provider survey only 15% say all clients access more than one service from within their consortium, 41% say most do. 2011 interview data indicates that not all clients access multiple services from within one organisation/ consortium.54These figures are from the 2011 Panel provider survey data, but this pattern was also evident in the 2010 survey.
98

Provider type % All/ most
For how many of your ASD clients who access more than one type of therapy/ intervention from within your consortium/ organisation do you work together to discuss and review the child’s progress?
Lead agency of consortium 73%
Consortium partner 43%
Multidisciplinary EISP 87%
Sole provider* 71%
TOTAL 71%
How many of your ASD clients who access more than one type of therapy/ intervention from within your consortium/ organisation have a single treatment plan you’ve prepared together?
Lead agency of consortium 47%
Consortium partner 26%
Multidisciplinary EISP 66%
Sole provider* 40%
TOTAL 48%Source: Panel provider survey 2011
Survey data suggest clients accessing multiple services from within a multidisciplinary organisation are most likely to receive a coordinated service. Multidisciplinary respondents are 1.6 times as likely as consortia to say all or most of their shared clients have joint treatment plans and 1.4 times as likely to jointly discuss and review all or most of their shared clients55.
Multidisciplinary respondents were 2.5 times as likely as consortium partners to develop shared treatment plans for all or most shared clients, and twice as likely as them to discuss and review their progress. This reflects the differential experience of coordination we found between some consortium partners in interviews. Qualitative data suggest coordination within consortia is more likely to occur in consortia with co-located members or members located within close vicinity. Co-location brings opportunities for informal information sharing and collaboration through incidental contact.
Coordination across different Panel providers
Panel provider survey data suggest families accessing services from different Panel providers are less likely to benefit from a coordinated service. Just over one-third (36%) indicated they discuss and review all or most shared clients’ progress with other Panel providers, and 12% that all or most have joint plans56. It was multidisciplinary respondents that were almost twice as likely as others to say they develop joint treatment plans for all or most clients shared with other providers,57 but sole providers that were twice as likely to discuss and review clients shared with other providers.58 While, we are uncertain of the extent to which these patterns hold true among the whole population of Panel providers, this finding suggests little evidence for concerns about
55 These calculations are based on 2011 Panel provider survey data; multidisciplinary respondents to the 2010 survey were also more likely to indicate they coordinate for all or most shared clients. 56 These figures are from the 2011 Panel provider survey data, but this pattern was also evident in the 2010 survey.57 Figures based on 2011 survey. This pattern was not evident in 2010 survey data.58 Figures based on 2011 Panel provider survey; sole provider respondents to the 2010 survey were also more likely to discuss and review shared clients with other providers.
99

sole providers’ place on the Panel. Moreover, removing sole providers from the Panel would have a substantial impact on families’ ability to access services, particularly in regional areas.
100

Table 9.6: Providers’ practice of coordination with other Panel providers
Provider type % All/Most
For how many of your ASD clients who access therapy/ intervention from another early intervention panel provider/s do you work together to discuss and review the child’s progress?
Lead agency of consortium 32%
Consortium partner 31%
Multidisciplinary EISP 25%
Sole provider 60%
TOTAL 36%
How many of your ASD clients who also access therapy/ intervention from another early intervention panel provider/s have a single treatment plan you’ve prepared together?
Lead agency of consortium 9%
Consortium partner 8%
Multidisciplinary EISP 18%
Sole provider 11%
TOTAL 12%Source: Panel provider survey 2011
Consistent with the 2010 Panel provider survey, lack of time and ability to charge were the most common barriers to collaborative practice among providers we interviewed in 2011. Differences in approach were also a common concern—and this may be more of an issue with coordination outside of consortia or multidisciplinary organisations. One of the sole providers we spoke to raised this as a reason for not wanting join a consortia.
A significant minority (43%) of 2010 Panel provider survey respondents also indicated other organisations’ lack of willingness to work with them as a barrier. But only a couple of Panel providers we interviewed raised specific concerns about work with other providers. One felt the model introduced a level of competitiveness between providers that had not previously existed, and that it could act as a barrier to cooperative work.
Coordination with state-funded services
Panel provider survey data59 suggest coordination is slightly more likely to occur with state-funded services than with other Panel providers, but it only happens for a low proportion of shared clients. Of those surveyed, 39% said they would discuss and review progress with the state-funded service for all or most shared clients, and 19% said all or most have joint treatment plans. Multidisciplinary respondents were 3.8 times as likely as others to develop a single treatment plan with state-funded services, and 1.6 times as likely to discuss and review progress with state-funded service as others. This may be, in part, because some multidisciplinary organisations are also state-funded services.
59 This pattern is evident in both the 2010 and 2011 Panel provider surveys.
101

Table 9.7: Providers’ practice of coordination with state-funded services
Provider type % All/Most
For how many of your ASD clients who access therapy/ intervention from a state-funded service provider/s do you work together to discuss and review the child’s progress?
Lead agency of consortium 15%
Consortium partner 5%
Multidisciplinary EISP 41%
Sole provider 10%
TOTAL 19%
How many of your ASD clients who also access therapy/ intervention from a state-funded service provider/s have a single treatment plan you’ve prepared together?
Lead agency of consortium 34%
Consortium partner 28%
Multidisciplinary EISP 54%
Sole provider 37%
TOTAL 39%Source: Panel provider survey 2011
Feedback from state-funded and directly delivered services reflect this low level of coordination. Some have found that willingness to coordinate varies between Panel providers, some that some providers are reluctant to coordinate (including some reluctance to share intellectual property), and others that they must always instigate coordination. Some were concerned by the fees some Panel providers charge families for coordination work, and a couple mentioned this had made some staff reluctant to contact Panel providers. But there were also concerns about the heavy reliance on families to transmit information if providers don’t collaborate.
Some state-based services described trying to focus on complementary areas not covered by the Panel provider when they share clients. Some tend to ‘step back’ while families are intensively accessing HCWA providers, or encourage families to alternate their blocks of state-funded therapy with a period of HCWA-funded therapy; one prefers not to ‘dual service’ because it confuses children. Some described issues with families accessing many providers at once: families finding it difficult to balance multiple commitments while keeping a sense of harmony in their lives or families and children feeling confused by advice from providers with different approaches. One service described the difficulty of the intersection between state and Package services: while the Package is intended to complement existing services, their funding agreement also obliges them not to ‘duplicate’ another service.
State department representatives noted varying issues with coordination between state and HCWA services including differing advice given by Panel providers and state-based services. Some raised concerns that connections rely on goodwill, or on families relaying information; others that providers charge for coordination. Other limitations they mentioned included private providers limiting work to billable hours, and the cost and time involved.
102

How this compares with coordination in other multidisciplinary models
In their review of individualised funding, Fischer et al found most providers surveyed reported high or very high levels of integration with other providers, support workers, families and informal carers. But, as with Package services, providers said interagency cooperation usually happened through informal information sharing rather than formal structures. 60
The Better Access to Psychiatrists, Psychologists and General Practitioners through the Medicare Benefits Schedule (Better Access) initiative was introduced in November 2006. Like the Package, Better Access explicitly promoted multidisciplinary cooperation through the conditions of Medicare items. But, unlike the Package, it also provided specific education and training—there were almost 1,200 multidisciplinary workshops, supported by resources (e.g., education and training materials, a website and web portal, and a 1800 phone line), and many workshops led to ongoing multidisciplinary networks of local providers. An evaluation of Better Access found that it had improved multidisciplinary collaboration between mental health care providers with providers developing an increased appreciation of others’ roles, though communication was not always optimal.61
Families’ experience of coordination
Families appear to have a more positive picture of the extent to which their child’s providers coordinate than Panel providers. About two-thirds of families surveyed62 said their children’s autism early intervention service providers work together to discuss and review their child’s/ children’s progress. Most families we followed up indicated there is some level of coordination between their providers—though some said this occurred because they took on a coordination role. One family had heard of jealousies or differences in philosophies between Panel and state-based services; another mentioned problems with providers having different approaches. Another, however, found their two speech pathologists having different ideas was ‘useful’.
CALD families we spoke to had mixed experiences with coordination—some said their providers are coordinating, some are taking on responsibilities in coordination themselves, and one said that their providers do not coordinate. The Indigenous families that commented generally thought their services were coordinated; a few of these noted their services were co-located or multidisciplinary organisations.
The [service name] services that are funded by HCWA can disagree with ABI – I can’t do some of the stuff that ABI has taught me (disciplining) – they explain that they don’t agree with it and will put me off doing it even though it works. [Follow-up family interview]
60 Fischer K., et al, 2010, Effectiveness of individual funding approaches for disability support, Occasional Paper No. 29, p4461 Pirkis, et. al., 2011, Evaluation of the Better Access to Psychiatrists, Psychologists and General Practitioners through the Medicare Benefits Schedule Initiative, Summative Evaluation Final report62 71% families agreed in 2010 and 66% agreed in 2011.
103

Box 9.3 Coordination: family taking responsibility
Lilly and her husband Ivan live in Sydney with their two daughters, Stacey and Natalie. Both girls have a diagnosis of autism and both have received early intervention support through the Package.
Natalie, Lilly’s younger daughter, has been receiving support from an occupational therapist and a speech pathologist funded through the Package, as well as early intervention support funded by the NSW Department of Education and Communities. Lilly is very satisfied with the quality of all of the practitioners who work with Natalie and is happy that they are eager to ensure that they are all on the same page when it comes to Natalie’s treatments. Although all have offered to communicate directly with each other to coordinate treatments, Lilly prefers to relay questions and discussions between them. She feels that it allows her closer involvement in—and a better understanding of—the treatment that Natalie is receiving. Lilly’s previous experiences finding, arranging and coordinating supports for her older daughter, Stacey, have given her the confidence and the skills to effectively manage this interaction. Neither the state-based early intervention staff nor the Panel providers have objected to this arrangement and Lilly feels that it has worked well for all, especially Natalie.
Box 9.4 Coordination: cross-consortia difficulties
John and Louisa have one child, Lewis, with co-morbid disorders including a diagnosis of autism. Initially they accessed two different consortia so Lewis could see the different therapists he needs. They’re now only seeing therapists from one consortium because they felt there was some tension between the two consortia and because they weren’t happy with the charges and practice of one of the consortia. Unfortunately this has meant Lewis is not getting support for his behavioural issues because they’ve been unable to access a psychologist from within their current consortium.
For a while, one of the therapists took on a coordination role, setting up meetings with the other professionals working with Lewis. But their current therapist works part-time and is unable to attend the regular meeting the school has with the other services Lewis is seeing. This therapist has also charged them for emails sent to give input into the meetings. They’re concerned about the charges for coordination activities because they thought providers’ fees were supposed to be inclusive of report writing, preparation, materials, etc.
Suggestions for enhancing multidisciplinary practice
The evidence indicates other mechanisms are needed to encourage collaboration. But Panel providers we spoke to had differing suggestions for addressing this issue.
Inconsistency in current practice of charging for coordination
Stakeholders raised concerns that, without funding, coordination relies on good will. Suggestions (from providers, professional associations/ colleges, state department representatives) to enhance collaboration included: a) allowing providers to charge families b) having separate funding for coordination, or c) making all providers build coordination into their standard service fees. Some noted a need for parameters around
104

how much could be charged for coordination, or what types of coordination could be charged (e.g. not emails), or how much time could be spent coordinating. But views differed over how much time coordination requires, and some did not think the time justified per client could be accurately measured because clients’ needs differ.
Evidence from providers suggests variation in current practices of charging for coordination: some say they don’t charge or they build the expense into their hourly rate, some charge only for face-to-face meetings or more extensive communications.
At the moment I don’t charge – although I realise it involves time. Sometimes you have to speak to someone for half hour. But I see it as part of the service I’m providing so I don’t charge for that myself. I don’t know about other providers. I do it for the sake of the clients. [Panel provider interviewee]
At the moment joint meetings happen only if parents want them to or if they’re willing to pay for that to happen. It is an expense to bring providers together. [Panel provider interviewee]
I offer to write a comprehensive report about the needs and situation of the child, if another service provider really needs it. That takes me a bit of time, however, so I charge for it and many parents prefer not to take me up on the offer. [Panel provider interviewee]
Mechanisms for enhancing collaboration
Besides funding, suggestions (from providers and professional association/ college representatives and state department representatives) included having an online system in which providers working with the same child can share information (including the goals they are working on, progress and review), requiring regular collaborative meetings or teleconferences between relevant providers, or having willingness to collaborate as a selection criterion for the Panel. A small number of diagnosticians surveyed suggested local networks—an approach also used in Better Access to Mental Health—would be useful.
One professional college/ association representative suggested an approach similar to Better Access to Mental Health—requiring practitioners to lodge plans with a paediatrician, though it is unclear how paediatricians would feel about this, and it would need funding. Only one of the diagnosticians surveyed suggested something similar—that paediatricians be allocated a Medicare item number to charge for coordination. But on the flipside one Panel provider noted that if reporting back to paediatricians or GPs is required too frequently, this can be a significant administrative burden.
There were a few suggestions from state-based services (some of whom are also Panel providers): build the requirement to collaborate into the funding agreement (also suggested by state department representatives), make charges for coordination transparent and limit to charges for meetings (not emails or short phone calls), have a lead agency to ensure coordination, and have Panel providers and state services work on a shared plan—state-based services already develop Individual Service Plans.
105

Other suggestions from state department representatives included having Panel providers participate in existing autism professional networks, requiring fly in and out providers to connect with local services, and funding Advisors to act as a coordination point for providers to feed information back to.
Given the wide variation in suggestions and the fact that the main barrier identified to coordination currently is a lack of time and funding, there is not a clear way forward for enhancing collaboration. In considering options, the Package should draw on lessons from the practices in other multidisciplinary initiatives, for example, the Chronic Disease Management Medicare items and Better Access to Psychiatrists, Psychologists and General Practitioners through the Medical Benefits Schedule Initiative. More broadly, the education components could be used to inform parents of the benefits of multidisciplinary practice.
106

PART D: Education and support
107

10. Autism Advisor Service
Autism Advisor Services were established to register children for the Package and to inform families about available services and supports and how they can access them.
10.1 Good reach to children with autism
As noted in Section B, the continued high registrations rates for the Package, suggest that reasonably effective referral pathways have been established and that Advisor Services have had good reach into the population of children with autism. But more systematic communications with diagnosticians and GPs at a Package level would help ensure medical practitioners are able to make effective referrals.
10.1.1 Some children remain under-represented
While the overall registration rates are positive and registrations for Indigenous children have grown steadily, some inequities remain. Children from CALD backgrounds and those from outer regional and remote areas remain under-represented; some stakeholders are also concerned about low income families’ access.
10.1.2 Timeliness of access—most families are satisfied
Throughout the evaluation, most families surveyed (>86% in any year) agreed they’d had timely access to an Advisor. Advisors were more positive than families and Advisor survey findings suggest timeliness of access has increased over the years of operation to date—nearly all surveyed in 2011 (97%) agreed families had timely access. The difference between Advisor and family responses may relate to when families accessed the Service (as all registered clients were surveyed in 2010 and 2011), but also to different understandings or expectations of timeliness.
10.2 Service models have evolved with some differences
Advisor Services have evolved over time—establishing and streamlining processes, developing various information resources and refining their support models. Service models differ to some extent because family to Advisor ratios vary considerably between the larger and smaller states (see table 10.1) and because the state service systems and association services families can draw on also vary between states.
108

Table 10.1: Advisor Services
State Auspice organisationFTE*
AdvisorsChildren registered (July
2008–November 2011)
NSW Autism Spectrum Australia (Aspect) 8 5656
VIC Autism Victoria 8.8 5207
QLD Autism Queensland 6 2948
SA Autism SA 4 1257
WA Autism Association of WA 4 1224
TAS Autism Tasmania 2 355
ACT Autism Asperger ACT 1.3 199
NT Autism SA—with staff in the NT 1.4 121Source: Autism Advisor reports and FOFMS data July 2008–November 3 2011*Full Time Equivalent
While Advisor Services were not established to provide ongoing support, feedback from Advisors and their STO managers indicates that some—particularly those with lower family to Advisor ratios—have provided some additional support for registered clients and some have supported families pre-diagnosis or families with children over seven years, depending on local system gaps. While others lack the capacity to provide additional supports, in some cases, they’re able to refer families to other services. For example, In Victoria, Advisors have a high client load, but can refer families to association services, including three free counselling sessions, an information line, a library and information sessions. While in the Northern Territory, the Advisor role is more extensive because there are limited local support and service options.
Services chose different ways to structure their staff and have refined these over time to better meet families’ needs—including the use of administrative support staff, having a central intake role and having a duty officer to take incoming calls. While some models rely on larger staffing complements, there may be some benefits in sharing lessons about what works with other Advisor Services, given some issues raised during the evaluation about Advisors’ administrative workload and some families’ frustration about getting Advisor Services’ recorded messages, rather than talking to someone directly.
10.2.1 Some differences in level of face-to-face delivery but also in families’ reported desire for this
Because of their higher client loads, the Victorian, NSW and Queensland Services have generally delivered a lower proportion of first appointments face to face. In their recent reports to FaHCSIA, the Victorian and NSW Services claimed not all families want face-to-face appointments, and this is reflected in family survey data. Overall, three-quarters (77%) of families surveyed agreed it’s important the initial meeting with the Advisor is face to face, but a lower proportion of those from larger states agreed than those from smaller states. Between 71 and 78% of respondents from Victoria, NSW and Queensland agreed, but between 92 and 100% of those from other states agreed. While the differences identified in the survey may not hold in the broader client population,
109

combined with the feedback from Services, the findings suggest some differences in level of face-to-face service delivery may be appropriate.
While there was only a little difference in level of agreement about the need for a face-to-face appointment between Indigenous and non-Indigenous survey respondents63, a few of the Indigenous families we spoke to specifically mentioned that they would have preferred to see their Advisor face to face. On the other hand, one of those we spoke to felt on top of things and wasn’t worried they hadn’t had a face-to-face appointment. This differing feedback reflects the comment from one Indigenous stakeholder that there is a need to recognise differences between Indigenous communities and individuals.
10.2.2 There have been positive developments for some autism associations
Autism Tasmania has grown since the Package was established; the state government provided them with additional funding for a CEO and a family support worker for children over seven years. A couple stakeholders felt these developments were linked to the association providing the Advisor Service. Likewise, Autism Asperger ACT has received additional state government funding for a family support worker.
10.2.3 Professionals’ views—some concerns about the location of Advisor services
The main issue Panel providers and representatives from the professional associations/ colleges raised about the Advisor Services was their location within state and territory autism associations providing Panel services, which they perceived as a conflict of interest. Some were particularly concerned because the first relationship a family develops is with the association. For the professional associations the issue was potential for biased referrals: one said they had initially had feedback from members that Advisors were making preferential referrals, although not recently; a second remained concerned about referrals and that Advisors may not have full knowledge of all providers; the third said the model is a conflict of interest whether it has impacted on practice or not.
While the associations delivering services are among the ten Panel providers that have processed the most claims, this is expected because they were large service delivery organisations prior to the establishment of the Package. At this stage, there is no evidence of any systematic bias in referrals. Comments from a few of the Panel providers we spoke to suggests evidence to the contrary—these providers were concerned that the Advisors’ role was of limited use because they can’t tell families which services are good. The concerns about bias in referrals may also relate to delays in updating Advisors about new providers, meaning they are not always aware of all providers available to inform families; a few Panel providers we spoke to mentioned getting few referrals from Advisors.63 There was a slightly higher level of agreement among Indigenous family survey respondents that appointments be face-to-face than among non-Indigenous respondents (about 5%) difference.
110

While over two-thirds of Panel providers surveyed agreed Advisors are sufficiently qualified, some of those we spoke to were concerned about Advisors’ qualifications or experience.
10.3 Overall satisfaction levels are high, but many would like more support
Throughout the evaluation, most families (>77% in any year) have, on the whole, been satisfied with their Advisor Service (see Appendix 2 for survey data). Most families (>74% in any year) agreed their Advisor gave them enough support when they needed it; and a similar proportion of Advisors felt they’d been able to spend as much time with families as needed. But some families and other stakeholders think Advisors should provide additional supports.
Advisor Services have a key role in the Package as a first point of contact for families and as a mechanism to link families to other components. Most families (>70% in any year) agreed Advisors had linked them to the Services their child needed. Where families disagreed, this may relate to the lack of local service options in some areas or some families’ desire for more individualised advice about what suits their child—both issues are beyond Advisors’ capacity to address. In some cases, it may also be related to the delays in informing Advisors about new Panel providers.
Out of all the aspects of support provided by the Advisor Service, families were least likely to agree that the Advisors had helped them understand what a diagnosis of autism means for their child (about 50% agreed in any year). This is likely because most families have only one appointment with an Advisor, and stakeholder feedback suggests some families find it difficult to take in all the information at that time because they are often going through a grieving process or are overwhelmed following their child’s diagnosis. It may also be related to some families’ desire for more individualised advice, as reflected in the relatively high level of agreement (>68% in any year) that even after seeing an Advisor it’s difficult to understand what services will be best for their child. A small proportion of Panel provider survey respondents also noted some families are still confused after seeing Advisors.
Reflecting these issues, in their comments, some families praised Advisor Services, some mentioned a need for more support and some said Advisors need better knowledge of local services. Some had difficulty reaching Advisors, and a small proportion of them were unclear about Advisors’ role. Three families who contacted the ARTD team during the final evaluation raised concerns about the sufficiency of support from Advisors.
Our HCWA advisor is very helpful and knowledgable [sic]. [Family survey respondent]
The Advisors should be up to date with programs, schools, facilities etc in [City] and surrounding suburbs then be able to suggest and discuss options and ideas with parents. [Family survey respondent]
111

I'm not sure who or what an Autism Advisor is. I've been given a letter and once a 1/4 receive a statement. [Family survey respondent]
My experience of autism advisors in our area is that [they] provide almost no advisory service to parents (aside from showing them the list of providers). We end up having to explain how the HCWA program works to almost all families we see. [Panel provider survey respondent]
10.3.1 Few differences in satisfaction by family type
Families from different states
There were some differences in levels of agreement about supports provided by Advisors between respondents from different states, but these varied from item to item, with no clear pattern that held across the different types of supports.
Families from regional and remote areas
There was very little difference in overall satisfaction with Advisors between family survey respondents from capital cities and those from regional and remote areas.
CALD families
Family survey respondents from CALD backgrounds were generally more positive about Advisors than English-speaking families. This may be a reflection of the additional assistance Advisors reported providing to some families from CALD backgrounds, or of the anecdotal claims that some CALD communities have lower levels of awareness of autism, meaning the support Advisors provide has a greater impact. The CALD families we interviewed were generally satisfied with the support they received from their Advisors, though one mentioned a need for more Advisors to better support families.
Indigenous families
There was generally little difference between Indigenous and non-Indigenous families’ agreement about supports provided by Advisors. But a higher proportion of Indigenous than non-Indigenous families agreed the Advisor helped them understand what a diagnosis means for their child (9% difference).64 As for CALD families, this may be a reflection of the anecdotal claims that Indigenous communities have lower levels of awareness of autism when they first come into contact with Advisor Services.
Most Indigenous families we spoke to were satisfied with the support they received from Advisors, but a couple raised concerns. One was still confused about the funding. The other had submitted their application but not received the approval and was unsure
64 This difference for Indigenous families is only evident in the 2011 family survey.
112

why the Advisor Service had not contacted them. This issue was resolved when the ARTD team (with consent) referred the family to the Advisor Service.
Several families we spoke to would have liked more ongoing contact with Advisors; others suggested Advisors should help families with the paperwork to register, provide more information on services, or give them more help to contact services and plan how to use the funding over time.
Low income families
There was little difference in agreement about supports provided by Advisors between families by income level. But those families on lower incomes were more likely than those on a high income to agree the Advisor had helped them understand the diagnosis.65 Again, this may reflect differing starting levels of understanding.
10.4 Many families would like Advisors to provide additional supports; others also recognise this need
Throughout the evaluation, some families and stakeholders suggested a need for Advisors to provide additional support. The 2011 family survey canvassed families’ views on what additional supports Advisors should provide. The findings suggest most would like Advisors to provide an exit and follow-up appointment (table 10.2). Some families we interviewed also suggested the need for these supports.
The majority also agreed Advisors should provide newsletters and information about supports and services other than Panel providers, as many of the Services are currently doing and should be able to do within current funding arrangements.
Although some Services said they are already providing transition support or follow up in some cases, practices differ, and expanding the Advisor role to include these supports would have resource implications.
65 Differences in satisfaction with Advisor Services by income level only assessed in 2011 survey data.
113

Table 10.2: Families’ views on additional supports Advisors should provide
Additional supports 2009
An appointment to inform you about service options after your child is no longer eligible for HCWA early intervention funding or the funding has run out
85%
A follow-up phone call/ appointment to see how you are going with accessing services 82%
Information about supports and services that my family might need in looking after our children other than early intervention providers
79%
Newsletters with information about services or workshops you could access 75%
Help contacting early intervention service providers 64%
Other* 17%Source: Family survey 2011.*Other suggestions included individualised advice, help connecting with support networks, more information about Panel providers, more explanation of different therapy types, written information resources, ongoing contact. Some responses were not relevant, commenting on other aspects of the Package (e.g. providers or the Package age limit) or noting they’d had to do their own research.
On a practical level, Services may have different opinions about the best time for follow-up appointments, and Advisors should be consulted about this if it is to be introduced. Advisors should also be consulted about models for exit support, given that some noted potential issues with this process (see below).
Identifying those transitioning: Transition may occur when a child turns seven years of age, or when they have used all of their funding making it difficult for services to identify families in need of transition support.
Differing needs: Transition support needs will vary between those that age out of funding and those that run out of funding before turning seven years.
Lack of services for children over seven years of age: Advisors would need other services to refer families to but these are often limited for children over seven years.
Contact: If families haven’t had contact with Advisors for two years it might be awkward for them to speak with Advisors again.
One Service said families are generally well-informed by the time their child’s funding ends so may not need transition support; they suggested developing a brochure on services for school-aged children to distribute to families. This approach may be sufficient for the 15% of families that disagreed Advisors should provide exit support.
Suggestions for other types of support (that did not fall into existing categories) included help to connect with support networks, which Advisors may be able to provide, and a need for more intensive support or individualised advice, which they cannot. While Advisors are not in a position to provide individualised advice, they could advise families on decision-making factors to consider, if they are not doing so already. Other education components could also provide guidance on effective decision making.
It would be very helpful to provide families with assistance other than the initial approval. It is a difficult time when your child is diagnosed and for many families the situation is overwhelming. [Family survey respondent]
114

It's very important is to help inform us about service options after the child is no longer eligible for the FaHCSIA funding—there are some other options out there e.g. Better access to mental health but it is so complicated and the regulations keep changing that it's really hard to find out what the child is entitled to. Even the doctors don't know all the latest changes and what's available! [Family survey respondent]
Inform parents regarding options for schooling and what happens with support there or special autism schools. [Family survey respondent]
Should get parents of autistic children together, general coffee and chat and advice service at Autism SA office [Family survey respondent]
Parents/ carers need all the information, advice, support and guidance available to cope, understand and navigate a very complex diagnosis, system of supports and individual needs for their child at a time when they are under a high degree of stress and generally have an extremely poor knowledge and understanding of the medical condition, treatments available and appropriate supports and programs for their particular child. [Family survey respondent]
10.5 Some current challenges in meeting demand and resource implications if Advisor role is to be expanded
There are indications that some Advisor Services—particularly those with higher family to Advisor ratios—have, at times, struggled to meet demand. Advisor numbers have not increased since 2009 when less than two-thirds (61%) of Advisor survey respondents agreed they had sufficient Advisors; and in reports to FaHCSIA the Victorian, NSW, Queensland and, more recently, the South Australian Services have listed meeting demand as a challenge. In the final evaluation, some Services claimed families’ demands are growing and, because children are being diagnosed earlier, some families are contacting Advisors for support on more occasions.
Some Services (in their reports to FaHCSIA and in survey comments) also mentioned having difficulties with staff recruitment and retention associated with salaries, administrative aspects of the role or lack of opportunities for career advancement. The South Australian Service noted they’d had less difficulty recently as the scope of the role had expanded and they better explain the role to potential candidates.
Services currently have considerably different family to Advisor ratios, and differing capacity to provide additional supports, as well as different supports within state systems and associations to which to refer families. If Advisors are to provide follow-up and transition appointments, the resource implications will need to be addressed.
115

11. Early Days workshops
The Early Days workshops are designed to offer parents and carers the chance to
learn about autism and what it means for their child and family learn practical strategies that can make a difference to their child's development learn how to choose between therapies and get the most out of services meet other parents and share ideas and experiences.
11.1 Issues with reach and barriers to attending
Throughout the evaluation, there have been concerns about the reach of Early Days workshops. In the 12 months to June 2011, the Parenting Research Centre (PRC) and approved Early Days providers delivered 213 face-to-face workshops (foundation, CALD and Indigenous) to 1,817 participants. Assuming only one participant per family attended, this represents about 34% of the clients registered in 2010/11, or 41% of registered clients if participants in online and telephone workshops are included. But this may be an over-estimation given that more than one family member can attend and that some families of children registered in previous financial years may also have been among participants. Only 28% of the families surveyed in 2011 had attended an Early Days workshop. Overall, the data indicates, the workshops have had limited reach; with some stakeholders concerned about the impact of the demand-driven approach to scheduling.
Reach has been particularly limited in regional areas—only 19% of participants in face-to-face workshops were from non-metropolitan areas. Some Advisor Services, which were among Early Days providers, reported being unable to run workshops in some regional areas because there weren’t enough families to meet quotas; one suggested a need to recognise the higher costs of delivering workshops in regional areas. A few Panel providers and state-based services we spoke to were also concerned about the lack of workshops, particularly in regional areas—one of the state-based services had ended up running their own information sessions.
Early days…Been problematic in this area in that they haven’t gone ahead. They had a bit of a waitlist going getting numbers together. Then the dates they offered to run them then didn’t work for the families and it just didn’t end up happening. [Panel provider interviewee]
While it was hoped that the online and telephone workshops would help address accessibility issues, to date there have only be 22 telephone workshops and most participants have been from metropolitan areas. Comments from one Advisor Service
116

suggest some families are reluctant to use the telephone workshops because they lack a landline and can’t pay for the call from a mobile.
Reflecting these issues, the lack of local workshops or workshops held when they could not attend were among the main reasons families surveyed had not been to a workshop; a small proportion said there weren’t enough people in their area for a workshop (table 11.1).
But lack of awareness of the workshops or when there would be one in their local area were also common reasons for not attending, suggesting that while Advisors inform families about the workshops and the PRC and Early Days providers promoted them in local communities, there is a need to improve promotion.
Promotion was also a challenge for the DEEWR-funded Positive Partnerships component in the initial stages, but providers have now developed databases of contacts by location and used local media and local services to promote workshops. There may be some potential for Early Days and Positive Partnerships providers to share promotional strategies.
Table 11.1: Reasons for not attending a workshop
Reason for not attending %*
Other commitments make it hard for me to attend workshops. 33%
Have not heard about Early Days workshops. 32%
The workshop in my local area was held at a time when I could not attend. 23%
There has not been an Early Days workshop in my local area. 22%
My family is already aware of information about autism and early intervention services for my child/children.
22%
I have attended other workshops on autism. 18%
Other** 17%
I didn’t get information on when a workshop would be available in my area. 13%
I didn’t think the information would be relevant for me. 5%
There weren’t enough people in my local area for a workshop to run. 4%
I am currently registered to attend a workshop. 2%Source: Family survey 2011.*% do not sum to 100 as multiple responses allowed.**Other reasons include family commitments (including the need for childcare or to be able to bring children), work commitments, already having enough information, need for different types of workshops, difficulties registering, not being informed about local workshops or given enough notice, difficulties getting to workshops (because of limited travel options or distance), feeling the workshops were not relevant for them based on their child’s needs, feeling overwhelmed, language barriers, the cost of workshops, not wanting others to know their child has a diagnosis.
Reflecting these issues one of the most common suggestions from family survey respondents for improving the workshops was making them more accessible, for example, by holding more, holding them at different times, providing childcare or providing them over the Internet; the latter suggests some are not aware of the online option. A few respondents also suggested a need to better promote the workshops.
Change the times. The times seem to always be when you have to drop and pick kids up from school. [Family survey respondent]
117
Wider advertising of the workshop would ensure more families were aware of this service and attend it. I was informed of the workshop by a private autism consultant otherwise I would have never known about it. [Family survey respondent]
11.1.1 The challenge for the new model
Since July 1 2011, the Early Days Consortium of Autism Specialist Providers (made up of state and territory autism associations) has had responsibility for delivering workshops. Start-up was delayed while staff received training, so it is too early to tell whether the new model will address issues with reach. In the July to September quarter of 2011, the consortium was only able to deliver 27 workshops to 236 participants, falling short of targets. But it is positive that 39% of participants were from regional areas. Despite the slow start, STO managers are generally confident the consortium can deliver the workshops as intended, noting a range of different strengths: the credibility/ experience of the associations in this kind of work, associations’ networks to promote the workshops, or the success some have already had in delivering workshops. The National Coordinator was also positive about some early successes—they had high levels of interest in a few workshops. The South Australian Association has also had some success running modified versions of the workshops that allow parents to attend between dropping off and picking up children from school and evening sessions that have attracted fathers.
While managers and associations and some of the providers we spoke to were positive about the new model, some organisations that provided workshops under the PRC model were disappointed with the change or unaware of the reasons for it. Some said that the PRC model of using local early intervention services to deliver workshops meant families were linked to local services; when they provided a workshop in an area they did not service, they linked families in with local services. These stakeholders were concerned the new model would not support this practice. Some were also concerned about the conflict of interest in the associations providing the workshops.
11.1.2 Evolving models for different families
Families from regional and remote areas
The main issue for regional and remote families has been limited access. The new consortium is planning to progress different models to enhance accessibility, including online options like Skype and webcams. The Coordinator has been in contact with those delivering Positive Partnerships, who have had success in attracting regional participants, and there is potential for the two programs to share lessons. In developing new strategies, the consortium could also learn from the Western Australian Autism Association’s experience with virtual support for regional families. They found some families needed technical support and that issues with dial up speed and cost of connection fees made using the telephone for audio and webcam only for visuals more
118

effective.66 One state-based service suggested the Package could partner with state health services to use their infrastructure for videoconferencing approaches.
CALD families
CALD families with higher levels of English proficiency or those living in communities without many other families of the same background may attend standard workshops. The foundation workshop has been translated into some community languages to ensure access for those with lower English proficiency, but materials need to be updated as workshops have changed since the content was first translated. The National Coordinator also noted the need for facilitators to understand cultural considerations in working with different communities, suggesting a handbook could be developed with advice for working with different communities.
There is also potential to share learnings with Positive Partnerships providers about working with CALD communities.
Indigenous families
As for other components, Indigenous families may face barriers to attending workshops. Recognising these issues, the PRC worked with SNAICC to develop an Indigenous workshop in consultation with Indigenous stakeholders. But in the 12 months to June 2011, only 8 Indigenous workshops were delivered to 57 participants. And the new consortium has questioned the suitability of some of the content of the Indigenous workshop and the single family model developed by the PRC.
Positive Partnerships has also had limited reach to Indigenous communities to date and has not yet finalised an Indigenous-specific format. They’ve worked with the local community in Moree to develop content that meets their needs, but have not yet delivered a workshop.
While the Early Days Coordinator has connected with Positive Partnerships providers and the organisations that provided the Indigenous Early Days workshops under the PRC model, both Positive Partnerships and Early Days could learn from the recently established Talking Up Autism project (run by Aspect and funded by the DEEWR PaCE project), which is raising awareness of autism in Indigenous communities. These workshops are at the community, rather than the individual level, giving the program wider and more sustainable reach. The team understands that the manager of the Talking up Autism project is happy to share the information materials the project has developed, provided the source is acknowledged and the documents are kept as a whole.
One Indigenous stakeholder consulted suggested a range of factors to consider in ensuring workshops meet the needs of Indigenous communities.
66 Breitenbach, K., 2011, Providing services to regional and remote areas of Western Australia using web based facilities, Western Australian Autism Association, Asia Pacific Autism Conference 2011
119

Begin with ‘small steps’, present information at an accessible level before moving on to complex content.
Provide information from a positive perspective, reducing stigma. Provide more than a fly-in fly-out model.
‒ First understand and build relationships with the local community, recognising differences between communities (something also reflected by the DEEWR managers of Positive Partnerships).
‒ Identify a local champion.‒ Involve local services (Indigenous and non-Indigenous) so information is shared
across the community and so families are connected to services that can provide ongoing support.
‒ Commit to coming back to the community.‒ Plan to meet information needs that arise later so people don’t feel abandoned.
The organisation, at all levels, must be genuinely committed to Indigenous access and community partnerships with Indigenous organisations; Indigenous staff, cultural competency and genuine engagement are important.
In establishing new approaches care should also be taken not to lose the value of the work already done. One of the Indigenous families we spoke to that had attended a workshop said it had really helped her family better understand autism.
Low socioeconomic status families
The initial evaluation (2009) found tertiary-educated parents/ carers were over-represented among workshop attendees. There is not data available for 2010 or 2011 to assess whether this trend has continued, but we suggest this category be included in the new data collection system being developed by the National Coordinator, so the Department can assess whether the Package is reaching the full range of families.
11.1.3 Making information accessible for those that can’t attend
While new strategies have the potential to increase the reach of workshops, survey data suggest there will always be some families that can’t attend—one-third of families surveyed had not attended because of other commitments. Given families need for information about autism and evidence-based services to make effective decisions about therapy, this suggests a need to make information accessible in other formats without duplicating other information sources.
Both the National Coordinator and a representative of one of the professional associations/ colleges suggested making the material available online would ensure greater access and enable parents to re-access information as they need it. A representative of one of the other professional associations and colleges suggested making the content available in DVD format.
120

11.2 Positive outcomes for those attending
Throughout the evaluation, most families surveyed that had attended a workshop reported gains in knowledge and understanding (table 11.2). Autism Advisors (surveyed in 2010) also reported generally positive feedback from families that had attended. Given that families attend workshops at different stages post-diagnosis and having done varying amounts of their own research, those that did not report these gains, may have begun with a higher level of understanding.
Table 11.2: Impact of the Early Days workshops on families attending
As a result of the Early Days Workshop 2010 2011
…I have a better understanding of my child’s/ children’s autism diagnosis. 87% 91%
…I have a better understanding of the types of early intervention services available. 82% 84%
…I am more aware of the research and evidence available on different therapies/ early intervention services.
82% 80%
…I feel more confident in discussing my child’s/ children’s needs with early intervention service providers.
84% 86%
…I feel more confident in engaging with my child’s/ children’s treatment/ service plan. 83% 85%Source: Family surveys 2010, 2011. Questions were only for those that have attended a workshop.Table notes: There is no independent data for the Early Days workshops from 2009, but pre- and post-surveys administered by the PRC showed a 25% increase in mean scores (from 7.2 to 9.6 out of 12).
While for some families sharing with others was a particular benefit of the workshop (reflecting other data sources about families’ desire to connect with others in similar situations), some felt confronted by this or would have preferred more structured information.
11.3 Some room for improvement
Some family survey respondents identified issues with the workshop content and format. Their suggested changes broadly reflect those mentioned in previous evaluation phases.
Change content‒ Provide more practical information, for example, on deciding between services
available and on navigating the system, including other funding sources.‒ Provide more detailed information.‒ Provide more information about different types of therapies.
Change timing post-diagnosis: some would prefer workshops earlier, some later. Hold separate workshops based on diagnosis, specific issues or age of child. Ensure providers have more practical experience, more experience in autism. Provide follow-up (reflecting this issue, one family that contacted the team during
the final evaluation suggested the Package should provide more intensive parent training like in California, where parents apparently receive 12 weeks of 3-hour sessions).
121

Given resourcing constraints, it’s unlikely that the workshops will be able to fulfil all of these needs. But, while there may not be capacity to provide face-to-face workshops by diagnosis or stage or the time to provide more detailed information, there may be potential to provide more differentiated material online. Issues with the timing of workshops may be addressed as strategies to increase reach are developed.
Given other data that families often find it difficult to make decisions about appropriate services for their children, the workshop content could also be revisited to assess whether it could provide more guidance on decision making.
11.3.1 Increasing reach and efficiency for a sustainable model
The challenge for the consortium is to develop new strategies that increase reach and efficiency, without limiting access to regional families and without losing the benefits families have gained through making connections with others in the face-to-face model.
Again, there may be opportunities for shared lessons with Positive Partnerships. While Positive Partnerships has delivered to more participants than anticipated, the program is also aiming to increase efficiencies—the plans for this program are to increase the target number of clients per year, not per session (which could disadvantage regional families). They have also used a train-the-trainer approach to train state government staff to provide workshops.
122

12. Raising Children Network website: Children with Autism pages
The Children with Autism pages of the Raising Children Network (RCN) website are designed to provide information, online resources and interactive functions to support parents, carers and professionals. The website also has information to help families understand the evidence base for therapies and a Services Pathfinder to help them locate local services.
12.1 The website could be better promoted to increase use
While the Children with Autism landing page has remained among the top ten landing pages of the RCN website throughout the evaluation (ranked fifth as of June 2011), the number of page views has not again reached the peak it did in March 2009 (13,168 page views). Views for the last six-months have remained above 5,000 per month—but this figure cannot be used to assess the website’s reach because it is unclear how many are repeat views (Figure 12.1).
Figure 12.1: Page views of Children with Autism landing page
Source: RCN report January–June 2011
In the six months to June 2011, RCN promoted the Children with Autism pages in a number of ways: through the Australian Association of Child and Family Health Nurses Conference (May 2011), postcards distributed through PlayConnect playgroups in
123

Victoria, and emails to the autism associations. Autism Advisors also continued to inform families about the website. But family survey data suggest a need for greater promotion, for example, through Advisor Service and FaHCSIA newsletters. Less than half (42%) of families surveyed had used the website. Nearly two-thirds (63%) of those that had not used the website said this was because they were unaware of it (Table 12.1).
Table 12.1: Reasons for not using the Children with Autism pages
Reason for not using the website %*
I was not aware of the website. 63%
I have accessed information about autism from other websites. 21%
I had already done my own research by the time I heard about the website. 18%
I have not had time to access the website. 14%
I feel like I have got enough information about autism. 11%
Other** 9%Source: Family survey 2011. Questions only for those that responded they had not used the website.*% do not sum to 100 as multiple responses allowed.**Other reasons include lack of access to Internet or computer, lack of time, not finding the information useful, difficulties navigating the site, having other information sources, not yet being ready for the information.
Other, less common, reasons for not having used the site were having information from other websites, having done their own research by the time they heard about the website, lack of time, or already having enough information about autism.
I didn't own a computer and don't have time to access it at the library. [Family survey respondent]
I may have been told about it before but there was so much information to take in at the time. I have been told about it recently which I will have look when I get some time. [Family survey respondent]
12.1.1 Access by family type—limited evidence
CALD and Indigenous families
We have limited information about accessibility of the website for CALD and Indigenous families. Only some of the CALD and Indigenous families we interviewed were aware of the website, but this is not unexpected given the low level of awareness among families surveyed.
Feedback about access issues for Indigenous and CALD families to the Package more broadly suggests the website should provide information in plain English and includes images and information about families from a range of backgrounds. Rajkovic and colleagues recommended that information on the website be provided in community languages as occurs in the United Kingdom, where the National Autistic Society (NAS) of the United Kingdom website (www.autism.org.uk) offers information on ‘What is
124

autism? and ‘Ways you can help’ in a variety of languages.67 If translated and plain English information resources are developed at a Package level these could be made available on the website.
Low socioeconomic status families
Some stakeholders, including one Advisor Service and a representative of one of the professional colleges/ associations, mentioned some families might have difficulty accessing information on the Package generally, or through the Children with Autism pages in particular, because they don’t have reliable (or any) access to the Internet. Some Advisor Services reported handing out RCN fact sheets to families; this could be part of standard practice for families without Internet access.
12.2 The site has been useful for families accessing it
Throughout the evaluation, most families who had used the site agreed it had helped them understand where to get help for their children and what services would be best for their child (table 12.2). Most also found it easy to find the information they wanted. Advisors surveyed (in previous evaluation phases) were also mostly positive. Only a very small proportion of family survey comments mentioned that the content is not useful or that the website is difficult to navigate.
Reflecting other data that families want to connect with others in similar situations, the parent forum has remained the most popular of the Children with Autism pages, and among the most popular of the RCN website throughout the evaluation. Sub-forums were created in late 2010 to streamline discussions, which should improve navigability and help parents connect to those with similar concerns now that the number of topics has grown to over 4,000.
Some stakeholders noted the value of a website generally (not RCN specifically) because it allows families to return and re-read information as needed. Rajkovic and colleagues noted that while a website cannot deliver the personalised information on their child that parents want, because the Internet will likely remain a large source of information for families, information should be as personalised and local as possible.68
67 Rajkovic, M. et al, 2009, FaHCSIA Occasional Paper No 35, Post-diagnosis support for children with Autism Spectrum Disorder, their families and carers, Social Policy Research Centre, p7668 Rajkovic, M. et al, 2009, FaHCSIA Occasional Paper No 35, Post-diagnosis support for children with Autism Spectrum Disorder, their families and carers, Social Policy Research Centre, p76
125

Table 12.2: Families’ views of the Children with Autism pages
2009 2011
It was easy to find the information I was looking for on the Raising Children website. 80% 90%
The Autism Service Pathfinder on the Raising Children website helped our family understand where we could find help for our child or children.
72% 81%
The Parent's Guide to Therapies on the Raising Children website helped our family understand what services would be best for our child or children.
70% 81%
Source: Family surveys 2009 and 2011. Questions only for those that have accessed the Children with Autism pages.
12.2.1 Limited information about satisfaction for different families
Of the few CALD families we spoke to who had used and commented on the website, one found it useful, while a second would have liked the site to have professionals answering questions and a parent forum (the latter suggests they had either not found the forum or were confused about which website they were referring to). The suggestion to have professionals answering questions reflects a comment from one of the state-based services we spoke to. This stakeholder said that while a website is good, they find that families want to talk to someone to have things confirmed and get individualised advice; this is why they provide a telephone consultation to waitlisted families. A third CALD family said it was still too early for them to take in all the information on the website.
Of the couple Indigenous families we spoke to that had used and commented on the website, both found it useful. But one suggested a need for more information for supports in school and more explanation of the funding, how it can be used and what it can be used for.
12.2.2 Content being updated to meet families’ needs but some potential for other improvements
It is positive that new content is being developed for the site to fill areas of need identified by families. Topics of recently published articles and those under development appear to be in line with areas of need identified in the evaluation, for example, school and behaviour management. Given the difficulties parents have in making effective decisions about services, the website content could also be revised to ensure it provides parents with guidance on decision-making factors.
There were only a few comments about the website in 2011 data, but in previous phases stakeholders have raised issues with the Services Pathfinder, which is not always up to date because it relies on the FaHCSIA Panel provider.
It’s important that the website also links to information on state-based service systems. But while the evaluation team is aware of services for children with autism funded and/
126

or directly delivered by both education and disability or human services departments, the Pathfinder generally only provides links to one or the other of these services in each state and the links to education-based services for Tasmania, Queensland and the ACT were not functioning when the evaluation team accessed the website.69
Given the complexity of the service system, and some stakeholders’ suggestion of the need for a clear service system diagram, the site could also provide a one-page diagram of the system—beginning with accessing a diagnosis and continuing onto services for children over seven years, and incorporating all Package components and the state service system.
12.3 A need to increase the reach of this small but important component
The Children with Autism pages of the RCN website is an important component of the Package given families’ need for information about autism and evidence-based interventions to make effective decisions for their children. It is a relatively small component in funding terms and updating of content is built into the funding agreement, making it relatively easy to maintain. But survey data suggest a need to better promote the site to increase its reach and ensure families benefit from this investment.
69 Accessed October 28, 2011
127

13. PlayConnect playgroups70
PlayConnect Playgroups are designed to give families the opportunity to learn through play in a setting that recognises and caters for the developmental needs of children with autism in a safe, supportive and friendly environment. While children with autism often play alone, it is thought that involving them in facilitated play will help develop their social skills and support their entry into mainstream settings. The playgroups also aim to provide an informal support for parents/ carers and increase their capacity to manage their child’s behaviour and engage in the community.
13.1 Target met, with groups in all states and territories
Playgroup Australia has now met the target of 150 PlayConnect playgroups around Australia. The playgroups usually have between three and six families attending, which is an appropriate size for this target group.
Some groups were established in areas where high demand was expected but did not eventuate; these have since been relocated. For the providers, this experience has emphasised the importance of having flexibility to establish sites not only based on the number of children with autism in the area, but also taking into account the existing local service system, transport and facilities.
Embedding the groups in local communities was initially a challenge but, according to Playgroup Australia, referral pathways have now been established. Because there are a limited number of groups, promotional efforts have been concentrated in selected sites. Promotional activities have included advertising and material in local media, through development workers establishing relationships with local services and diagnosticians, and through parents/ carers informing others. Some development workers, though, felt too much responsibility for promotion was placed on them.
Autism Advisors have also promoted the groups to families and were in a position to inform Playgroup Australia about potential locations for groups during the establishment phase. While it took some time for Advisors to understand and promote PlayConnect, stakeholders said stronger links have developed since PlayConnect representatives began attending Advisor forums.
In promoting the groups Playgroup Australia has found it helpful that they do not require a diagnosis because a label can be a barrier when children are very young and because not all children will yet have a diagnosis, given the complexities involved.
70 This section is based on data from the 2010 evaluation of PlayConnect and interviews with Playgroup Australia and STO managers in 2011.
128

13.1.1 Mixed views on how the groups work for different families
According to Playgroup Australia the groups have worked particularly well in regional areas because there is often a lack of other local service options. When families have multiple commitments and appointments, it can make finding the time to attend difficult.
Development workers had mixed views on whether the groups work better for some families than others—just over half (57%) agreed they do. These workers said the groups work best for families in which at least one parent is not working, where parents are better educated, are hearing about autism for the first time and/or are emotionally ready to deal with their child’s diagnosis. They also said it works for families who have access to transport and those who lack social supports. In terms of children’s situation, they said it works best when they’re not at school or receiving other services (or when appointment times can be shifted).
Some development workers said it might be difficult for families whose first language is not English if there is not another family from a similar background attending the group. Playgroups Australia and some development workers suggested difficulties for families from cultural backgrounds in which autism is not openly accepted or understood. But current data may under-represent CALD (and Indigenous) families because in some cases, they have been reluctant to record their status—either because they want to be treated as all other families or because they don’t understand the need to record it.
13.1.2 Information resource for those unable to attend
Because the groups cannot reach everyone, Playgroup Australia (in consultation with Autism Victoria) has developed an information resource in the form of a USB flash drive that includes a range of information and ideas for play. The resource is easily transportable and doesn’t require Internet access so will be suitable for a broad range of families.
13.2 Participating families are mostly positive
Because children do not need a diagnosis to access the playgroups, they are an important early source of support and can be an effective soft-entry point to the service system—a place for parents/ carers to learn more about autism and available supports and network with other families.
Most families surveyed who had attended regularly agreed the groups had led to positive outcomes for their children and themselves (table 13.1); development workers were also positive about the outcomes achieved for parents and children.
129

Table 13.1: Families’ views of PlayConnect
Attending a PlayConnect Playgroup… 2010
...helps my child/ children learn to play better with other children 80%
...helps my child/ children learn new skills 77%
...is a positive experience for my child/ children, e.g. enjoyable, fun, stimulating 93%
...is part of my child's/ children's treatment/ service plan 77%
...helps me as a parent to better understand autism and available early intervention services 84%
...helps me as a parent to learn new skills to support my child/ children with autism 74%
... enables me to make connections with other parents 96%
...has made me aware of other services in my community for children with autism and their families 89%Source: Family survey 2010. Questions only for those that attended groups regularly.
The PlayConnect groups provide routine and structure, but also expose children to new activities. Those attending regularly described their children playing with each other more, playing with adults and learning to take turns. Other outcomes for some children included improvements to gross and fine motor skills, speech and communication, concentration and listening to instructions.
Parents appreciated that groups were non-judgemental and provided a place where their children’s behaviour was understood and accepted—this helped them and their child relax and gave them opportunities to socialise. The groups also provided an opportunity for families to share information and develop friendship and support networks; reflecting this, Playgroup Australia said some parents whose children have transitioned to school or other services have come back to the groups to share their knowledge with newer members.
For those with a child more recently diagnosed or with less knowledge of autism, the groups can be a source of information about and linkages to early intervention services. The groups provide opportunities for learning about child development, managing behaviour, ideas for play at home, and about local services.
The groups also allow the whole family to attend—with some Saturday morning groups established for this purpose—or can give one parent time-out while the other attends with the children.
But PlayConnect does not suit all families. The parents who reported limited benefits described groups in which disruptive behaviour was not managed to their satisfaction or where their child’s level of disability was too different from others attending, making it difficult for them to play with others. Some were uncomfortable with unstructured play and would have preferred more emphasis on therapeutic activities.
13.3 Some concerns about sustainability
While groups have had success transitioning individuals to other supports, the plan to transition groups to self-management at the end of a two-year funding period is unlikely to be feasible for most groups. It can be difficult to find a parent to take responsibility for
130

organising the groups because of regular turnover as children transition to early intervention services or school and because of the intense demands already on many parents of children with autism. To date, PlayConnect has re-funded some sites to ensure success. Consideration will need to be given to the groups approaching the end of the two-year period but in need of ongoing support in the lead-up to the end of the current funding agreement with Playgroup Australia (July 2012).
Irregular attendance patterns (often due to families’ competing commitments, including taking their child to early intervention services) have, at times, been a challenge for managing the groups. But, according to development workers, most families attend regularly (every week or alternate week); in only a very small proportion of groups do most families attend irregularly. The experience suggests a need for continued flexibility in establishing the groups not only based on population with autism, but on other factors including other local service options available.
Most groups have been resourced appropriately, enabling facilitators to provide activities that meet the strengths, needs, interests and abilities of children and use resources aimed at visual, sensory and tactile senses. But budgets for playgroups are quite small, and resources vary depending on what is accessible through the state or territory playgroup association or through in-kind support from partner organisations. Around one-third of developmental workers surveyed were seeking specific resources not currently available to their group.
131

PART E: The Package as a service model
132

14. The Package is making a positive contribution to the service system
The FaHCSIA components introduced a new approach to funding early intervention services to address the limited service access for children with autism, in an area where the Commonwealth was not previously directly involved.
14.1 Supporting families to access services
Available evidence indicates that the Package has helped most children registered (90%) access services, and that at least some of these children would not have been able to access services without the early intervention funding or would not have been able to access services as frequently.
As the Panel has grown in the years of operation to date, more children have been able to access services. But there is insufficient evidence to indicate whether the growth is due to a) new providers establishing practices that provide early intervention for autism, b) existing practices joining, or c) professionals being drawn away from other services. While exodus from the public sector was a concern with the Better Access to Mental Health initiative, which similarly increased the viability of private practice, the evaluation of that initiative found that the shift had not occurred to the extent anticipated.71 Anecdotally from Panel provider interviews, a few have left other jobs, for example, in the education system, to begin in private practice or are practising privately in addition to full-time work in other services. One Advisor Service claimed the Package has led providers to leave the state system, which is a problem in regional areas, but one state department representative said it hasn’t affected their ability to recruit staff. Others didn’t comment on this as an issue.
Some providers believe the Package has increased the number of providers with a focus on servicing clients with autism.
I think it has encouraged speech pathologists and other allied health professionals to include a focus in their service on autism. [Panel provider interviewee]
71 Pirkis, et. al., 2011, Evaluation of the Better Access to Psychiatrists, Psychologists and General Practitioners through the Medicare Benefits Schedule Initiative, Summative Evaluation Final report, p10
133

14.2 Contribution to outcomes
As noted in Part A, because children with autism often access other supports and services, including state-based services and those they pay for privately, outcomes are not attributable to the Package alone. But in their comments on outcomes families surveyed often associated their children’s outcomes with services accessed through the Package. Some families we followed up noted the outcomes their child had achieved would not have been possible without the funding; others said the funding had made a significant contribution.
Without this funding we wouldn't have been able to do such intensive therapies and achieved amazing results. [Family survey respondent]
Our son has come so far since having therapy and I would hate to think how far behind he would have been without the funding. He is further behind in school work than a typical child but he would have been much worse without funding for therapy. [Family survey respondent]
This has eased the burden on the school and they have commented that with all the early intervention…he 'fits' better at school than those in higher grades who have received no treatment. [Family survey respondent]
Many of the Panel providers interviewed that described positive outcomes for children associated these with the increased level of service the funding allowed them to provide to children; as did a representative from one of the professional colleges/ associations. Some described increased service intensity as one of the Package’s positive impacts on the system.
..being able to actually have consistent sessions with kids because parents aren’t concerned about payments. That’s enabled better outcomes. [Panel provider interviewee]
I think we’ve really seen improvements for children and that’s because of the regularity and quality of services that they can access with the additional money. [Panel provider interviewee]
But, reflecting that the Package is only intended to contribute to the service system, some families surveyed and some we spoke to said their child’s outcomes could not be attributed directly or only to the early intervention funding. For some families that have been unable to access Panel providers, the Package did not contribute to outcomes.
We've been given general advice but the majority of improvement has been from reading books and using our intuition. [Family survey respondent]
…the HCWA therapists (intervention funding) have been fantastic help but in no way if that was all we did would our son have progressed so far. [Family survey respondent]
134

15. The components: a good combination that could be better integrated
The Package model recognises that families of children with autism have different needs at various stages of their journey, providing a combination of education and support components as well as intervention services to assist in meeting these needs
15.1 Good combination of components
The combination of components from the three departments (FaHCSIA, DoHA and DEEWR) provides support to help families across their autism journey: from accessing a diagnosis (DoHA Medicare rebates for assessment and planning); finding out about autism and linking in with services/ supports (Advisor Services, Early Days Workshops, RCN website Children with Autism pages); accessing early intervention (early intervention funding and Medicare rebates for 20 sessions); to strengthening interactions between school staff and parents/ carers (Positive Partnerships). The various education components enable families to obtain information in a range of ways depending on what suits them.
Not all families are accessing all Package components but of the families surveyed who had accessed each component most reported positive outcomes associated with it. This suggests each component is making an important contribution to the overall positive outcomes.
Families accessing particular education components reported increased understanding of autism and/or services available; other outcomes included increased confidence and skills.
Most also reported increased ability to access services gained through the early intervention funding in general and, when eligible, the Access Support Payment in particular. Most of those that have used the funding for resources also agreed these had made an important contribution to their children’s outcomes.
15.2 Increased synergies between components would facilitate smoother pathways for families
Evidence suggests that greater synergies between components could create smoother pathways for families through what can be a complex service system and prevent duplication of effort.
135

15.2.1 Autism Advisor Services
Advisors, as the first point of contact for families, have a key role in linking families to the supports and services available through the Package (and in the state system), which is recognised by management stakeholders. But evidence suggests some families find it difficult to take in all the information Advisors provide in an initial appointment. Having Advisors provide a follow-up appointment (as many families would like) may help to ensure greater awareness of and connections with other components (see section D).
In their role, Advisors link with diagnosticians and providers of other components—though fewer report having regular contact with PlayConnect (table 15.1). While Advisor Service reports show increased linkages developed with other components, NSW is the only state with regular formal meetings established between the range of education and support components to share strategies and lessons. Given the key linkage role Advisors play, this type of forum could be considered in other states and territories, although the STO notes this would rely on all parties being willing to ‘come to the table’ and their capacity to do so.
Table 15.1: Advisors’ linkages with other services
2011
We have regular contact with diagnosticians referring children to the Package 80%
We have good relationships with members of the Early Intervention Service Provider Panel 91%
We have regular contact with providers of PlayConnect 69% Source: Advisor survey 2011.
15.2.2 Early Days workshops
Some management stakeholders are hopeful that now state autism associations are providing Early Days workshops there is potential for greater synergies between Advisor Services and this program.
15.2.3 Raising Children Network website: Children with Autism pages
The Children with Autism pages—with information about evidence-based intervention and the Service Pathfinder—are another key source of information to link families to the supports and services they need. Unlike other components, it’s a source of information that families can return to over and again as needed.
The Early Days website, FaHCSIA and the Queensland and Victorian autism associations were among the top 20 sources of entry to the website in the six months to June 2011, suggesting that cross-referrals between Package-related websites are occurring. But family survey data suggest a need for greater promotion of the site. As noted in section D, there is also a need to ensure the Services Pathfinder is up to date if it is to be a useful
136

linkage mechanism. And, given the complexity of the service system, a one-page diagram that includes all Package components and the state service system would be useful.
15.2.4 PlayConnect playgroups
According to management stakeholders, it took some time for Advisors to develop a good understanding of PlayConnect and to develop stronger referral pathways to the groups. Indications are that having PlayConnect representatives attend Advisor forums helped strengthen referral pathways.
15.2.5 Panel providers
Most Panel providers surveyed (80%) agreed they have good relationships with Autism Advisors in their service area. But some Advisors feel that Panel providers lack a good understanding of their role. Also, while Advisors were a source of referrals among some Panel providers we interviewed, some providers surveyed raised concerns about the lack of referrals from Advisors. Advisors themselves are concerned that FaHCSIA does not always update them of new Panel providers in a timely way. This situation may be fuelling perceptions among some Panel providers that Advisors’ referrals are biased.
Some Advisor Services also suggested a need to establish greater linkages between Panel providers so they can share knowledge because, in some cases, providers are turning to Advisors with their questions. Over three-quarters (78%) of Panel providers surveyed in 2010 agreed that an electronic workspace with a discussion forum where Panel providers can share information would be useful.
15.2.6 DoHA components
As noted in Section B, the evidence suggests a need for more systematic communications with diagnosticians—both those funded through the DoHA Medicare rebates and those in the public sector—to ensure smooth referral pathways for families.
In 2011, DoHA broadened the 20 Medicare sessions to cover types of intervention available under the Better Start Package, introducing a difference between this component and the FaHCSIA-managed Early Service Intervention Provider Panel, which does not include these services. Some stakeholders were confused—they thought the change also applied to the FaHCSIA component and did not approve of the broadening of intervention types (though other stakeholders noted some children with autism may need interventions available under Better Start). The evaluation did not focus on which interventions should be eligible under the Package, and FaHCSIA should be guided by the recent Prior and Roberts review72 in considering any expansion of Panel services.
72 Prior and Roberts et al, 2011, A Review Of The Research To Identify The Most Effective Models Of Practice In Early Intervention For Children With Autism Spectrum Disorders
137

But while there is a difference between DoHA and FaHCSIA components, there is a need to ensure clear communications dispel any confusion about eligible services.
Reflecting that some families are confused about sources of support, DoHA has sometimes received Ministerial correspondence related to FaHCSIA-managed components (and diagnosticians we consulted for this evaluation used the opportunity to raise issues with the Medicare items). But DoHA representatives noted this issue is not unique to the Package, and is not particularly problematic as staff can forward communications to relevant others.
15.2.7 DEEWR components
While DEEWR representatives said that service system pathways have improved over time, they noted potential for future joint work ensuring clarity on how the Package works as a whole.
Advisors currently inform families about Positive Partnerships among other available services, but if their role is expanded to include an exit interview they could refer to Positive Partnerships when families are mostly likely to need this type of support. DEEWR representatives suggested having a Positive Partnerships representative attend Advisor forums could also help maintain links between the components—an approach that was apparently effective for PlayConnect.
While Early Days and Positive Partnerships both provide parent education, DEEWR representatives noted the focus of the two programs is very different. The Early Days National Coordinator said there is little overlap between materials of the two programs except in terms of key information that parents need at both junctures, such as guidance on decision making about services. But DEEWR representatives noted the potential for duplication as providers of the two components develop information materials to meet families’ identified needs (with some overlap in website materials being developed). Links between the two components would prevent duplication of effort, as each could refer families to content available through the other, rather than duplicating resources. As noted in section D, there is also potential for the two programs to share lessons about working with families in regional and remote areas, families from CALD backgrounds and Indigenous families.
15.2.8 Cross-component linkages
The various components undertake their own promotional activities and, in some cases, are developing their own information about other components—for example, PlayConnect has developed information handouts on other components. A representative of one the components suggested greater sharing across components of resources and promotional strategies could help achieve synergies and reduce duplication of effort. They suggested a need for a face-to-face Package-level forum to establish relationships between components at least initially; while an online forum
138

could facilitate communication, it would need material—like resources—to draw stakeholders to it. Another potential avenue for cross-Package communications are the newsletters FaHCSIA has established for various components.
As DoHA and DEEWR representatives also noted awareness raising as one of the initial challenges for their components, there may also be potential to share lessons about communication and promotion with these components.
15.3 Management: a need to strengthen communications
As a new and emergent model there have been several changes to the Package that were designed to enhance access to it. But Advisor Services and Panel providers have raised some concerns about the way changes have been managed and communicated. In some cases, changes have created confusion. Some stakeholders have also had difficulties obtaining timely responses to queries from FaHCSIA.
Among Panel providers surveyed, levels of satisfaction with FaHCSIA’s responsiveness and change management remained stable between 2010 and 2011 (table 15.2), whereas Advisor Service management satisfaction dropped (table 15.3). The figure for Advisors should, however, be interpreted with caution because there was a lower response rate to the 2011 survey than the 2010 survey. In consultations and in Advisor Service reports, some Advisors noted recent improvements in communication; but others (in focus groups and the survey) noted the need for timely communication about policy changes and timely responses to queries as well as clear and consistent information. Some Advisors said issues occur when families can’t get through to FaHCSIA to answer questions that Advisors cannot, and suggested having a Frequently Asked Questions (FAQ) sheet for families on the website might help with this issue.
Table 15.2: Providers’ views on management
Aspects of management 2009 2010 2011
FaHCSIA are responsive when we raise issues about the program 56% 69% 66%
When there are changes to this program, they are managed well by FaHCSIA 57% 68% 64%Source: Panel provider surveys 2009, 2010, 2011.
Table 15.3: Advisors’ views on management
Aspects of management 2009* 2010 2011
FaHCSIA are responsive when we raise issues about the program 70% 63% 38%
When there are changes to this program, they are managed well by FaHCSIA 33% 53% 38%Source: Advisor surveys 2009, 2010, 2011*The 2009 survey asked all Advisors and managers about management issues, the 2010 and 2011 survey asked only managers and Team leaders.
About 10% of Panel provider survey respondents’ overall comments related to issues with communication, either with FaHCSIA or the FOFMS helpdesk, most noting it takes a
139

long time to get answers to their questions. This issue was also raised by some Panel providers interviewed. A couple, in particular, were frustrated that FaHCSIA does not provide written responses to their questions. One of the professional colleges/ associations also raised this concern because it makes some providers anxious they lack evidence to back up their actions. Other communications issues the professional colleges/ associations raised related to communications with consortia members and concerns about consistency of messages from FaHCSIA with staff turnover.
We find it very difficult to communicate with FaHCSIA and almost impossible at times to get a response and/ or answer to questions in a timely manner. This can be very frustrating—particularly if the service provided to families is impacted by this communication breakdown. [Panel provider survey respondent]
15.3.1 State and Territory Office role in management: increased clarity
Since early 2010, FaHCSIA State and Territory Offices (STOs) have managed the Advisor Services; more recently, they took on the management of Early Days workshops. Over the last 12 months, STOs have developed stronger relationships with Advisor Services and a better understanding of the Package; they are still settling into their role in managing the workshops given the recent change in program delivery. The STOs generally have a similar level of contact with Advisor Services as with other programs they manage—which ranges from once a week in some states to once a month in others—although this varies depending on current issues.
When management was devolved to the STOs there was some confusion about lines of communication. Most STOs said this has now been clarified, but one Advisor survey respondent suggested greater clarity is still needed. According to STOs they’re able to answer queries related to the Advisor Service, and the National Office answers questions about the Panel and eligibility—though the extent to which they answer queries or forward them to National Office varies. This is reflected in comments from some Advisor Services that most of their dealings remain with National Office.
Two STOs noted feedback that Advisor Services find the current arrangements frustrating. But one of these said their Office would not have the capacity to take on a larger role, and two others noted the importance of National Office’s role in ensuring policy consistency (though other measures might also be able to ensure this). STOs noted decisions around management structure would need to take into consideration resources and cost efficiencies.
140

16. The model’s fit with best practice and emerging policy trends
The Package established a service model intended to ensure children with autism and their families receive best practice early intervention.
16.1 The Package is consistent with the trend towards individualised funding
Individualised funding has been introduced in most Western European countries and parts of North America.73 With the announcement of the National Disability Insurance Scheme (NDIS) for Australia in 2011, the Package is in line with broader trends towards individualised funding.
In practice, there are differences between individualised funding models that impact on how much flexibility and control funding provides people with disabilities and their families. In their review of individualised funding, Fischer et al found ‘packages that are managed by the person with a disability, their family or a facilitator and that can be spent in the open market, can generally be tailored more easily towards the consumer’s preferences than more restrictive packages or those that must be spent through a single service provider.’74 The Package model provides this flexibility and control.
Some providers, that are used to block funding, noted concerns about the sustainability of the fee-for-service model, but a small number saw it as part of the broader trend in disability services funding and a way of trialling this delivery.
16.2 Service based on diagnosis
Throughout the evaluation some stakeholders (including state-based services—some of which also provide HCWA—state department representatives and professional college/ association representatives) have raised concerns with the eligibility criteria for the Package. Their concerns are about the inequity it creates for children with other disabilities; some are concerned it has led to over-servicing of children with autism. While some of those who see the Package as inequitable suggest Better Start is helping
73 Fischer K., et al, 2010, Effectiveness of individual funding approaches for disability support, Occasional Paper No. 2974 Fischer K., et al, 2010, Effectiveness of individual funding approaches for disability support, Occasional Paper No. 29
141

to address their concerns, whereas others note Better Start is only limited to five disability types.
Most diagnosticians surveyed agreed the requirement for a diagnosis from a paediatrician or psychiatrist is appropriate, but still only just over half agreed that the Package eligibility criteria are appropriate. Whether this reflects disagreement with the requirement for a formal diagnosis or particular aspects of the criteria including age limits is unclear. But in their suggestions for improving the Package about 15% of diagnosticians suggested access to intervention based on need not diagnosis.
Some stakeholders were concerned about the need for formal diagnosis because some families may be less able (financially or geographically), less willing, or less ready to seek a diagnosis. One diagnostician suggested ‘labelling’ a child can have negative consequences. One state department representative was concerned that the Package creates urgency in getting services but families need to deal with the emotion before they can productively engage in early intervention.
A few state department representatives and some state-based services (some of which also provide Package services) were concerned that the diagnosis-driven approach to support is out of sync with trends in their services. One representative suggested services should not require a diagnosis because there needs to be a soft entry point to the system. And there were some concerns about the expectation the Package creates for ongoing autism-specific services and strategies, rather than services incorporated within broader disability supports.
I think that’s just unfortunate for parents of children with other disabilities. I guess Better Start is retro-fitting that need, but still. [Panel provider interviewee]
Intervention should be based on developmental need rather than a specific diagnostic label. [Diagnostician survey respondent]
On the flipside, a couple of state department representatives noted that because autism services have previously been limited it’s appropriate for the Package to bring autism to the fore until the system has the capacity to effectively support these children. Some states have or are developing autism plans, suggesting that autism-specific initiatives remain on the broader agenda.
16.3 Balancing family choice and need for support
Stakeholders had mixed views on the family choice model. While some saw it as empowering families to make decisions about their intervention, others were concerned some families need more support to make choices than the Package model provides.
It’s good that it has flexibility for families to choose their own providers. If they can work with providers well, kids will benefit more. If they’re happy with the provider and they have a good relationship... [Panel provider interviewee]
142

For some, there are too many choices, and not enough advice. ABA/ Speech/ OT…they get confused, and can easily be taken advantage of. They receive so much information they can’t take it all in, and don’t understand the jargon/ language... [Panel provider interviewee]
16.4 Case coordination
Throughout the evaluation, some stakeholders (including Advisors, Panel providers, state-based services, state department representatives, diagnosticians and professional colleges/ associations have raised concerns about the lack of a case coordinator/ case manager to support families. Some believe that, without this, some families find it difficult to make choices about effective services and effective combinations of services. In practice, decision-making support provided in other individualised funding Package’s varies, and includes ‘information and guidelines, facilitators and coordinators, case managers, and use of peak bodies and advocacy organisations to work closely with people with disabilities.’75
Who needs the support?
Stakeholders generally said only some families would need additional support to access and coordinate services, though some suggested all families would need this support at least in the initial stages after diagnosis when they are emotional and unfamiliar with the service system. Family data suggest only about half of families surveyed have trouble coordinating and planning services (see Appendix 2 for survey data)—but some of these are further along their service journey, so less in need of support. Some families we followed up over the course of the evaluation said they wouldn’t need the extra support now but it would have been useful when their child was first diagnosed. In reflecting back on their needs over their time in the Package, some families we followed up indicated a need for coordination support—some for the initial period post-diagnosis, others in an ongoing capacity. Some suggested this would have helped them avoid misspending funding on services their child wasn’t yet ready for. But others had done their own research and were confident in making choices. Box 16.1 and 16.2 provide examples of two families’ journeys.
I believe there is a need for independent case managers to oversee and coordinate children's early intervention providers, particularly if providers are not part of a shared service. This will ensure that HCWA funding provides maximum benefit to the child/ren by reducing any overlapping of services and allowing for more complimentary services and outcomes. [Family survey respondent]
When getting the Package it is very over whelming [sic] as personally you don't know what is going to work best for the child. I think everyone needs a coordinator to help you decide. [Family survey respondent]
Indications from Advisors are that CALD families, families from low socioeconomic backgrounds, those with children with complex or co-morbid disorders and Indigenous
75 Fischer K., et al, 2010, Effectiveness of individual fun ding approaches for disability support, Occasional Paper No. 29, 31
143

families would more likely need case coordination support. Of the families we surveyed, CALD families and those on low incomes were more likely to agree they have difficulty planning and coordinating services for their child, but they were also more likely to report receiving professional help for this. Differences were not evident between Indigenous and non-Indigenous families surveyed—but some of those we spoke to described needing extra support.
Because not all families would need a coordinator, Advisors could identify need at point of entry, but without strict guidelines for assessing need this could cause confusion and over-referral.
Box 16.1 Family making their own decisions about services
Jad and Tracey have three children: Derek, Rosa and Ricky. As Derek grew he had various difficulties and Tracey kept a diary of his behaviours. He was diagnosed when he was three-and-a-half years old with borderline autism/ PDD-NOS. This was partly due to the written accounts of his behaviour Tracey kept. Following the diagnosis, Derek continued to see the speech pathologist he had been seeing. Tracey and Jad attended an information session and two weekend workshops on ABA, (paid for by state government funding). Derek attended kindergarten at an autism unit run by the Department of Education, plus a preschool that does one-on-one teaching of ABA, with only three in the class. The family found that their ABA program and the autism unit didn’t mesh, so they changed to ABA therapy fortnightly plus a behavioural therapist who helped a lot with toilet training.
Tracey contacted the Autism Advisor when she heard about the Package. The Autism Advisor was very informative, but Tracey found it ‘a nightmare’ to sift through the available therapies. Derek began individual speech therapy and the therapist suggested he go onto ADHD medication. This was a big decision for Tracey and Jad to make, so they waited for about eight months to see a paediatrician. The paediatrician thought that Derek had sensory issues and recommended that he see an occupational therapist.
Tracey and Jad also explored a new direction in a treatment. They used funding to purchase the license for a product Tracey researched on the Internet called Fast ForWord. It’s a computer based program, working with neuroplasticity, and you can purchase a license for a certain period of time. Tracey believes that a lot depends on how you access the services that are available. She goes into sessions with Derek, and asks for advice on what she can do at home. She talks with Derek’s teachers and does her best to ensure that the parents, teachers, therapists and computer program are all working together. Tracey believes that parents need to shop around.
Tracey and Jad also attended the Positive Partnerships workshop and found it to be very good because it gives parents lots of tools for approaching schools, lots of written material and access to the facilitator for up to three months after the workshop, for advice. ‘Having someone else doing the research makes such a difference.’
144

Who should fill a coordinator role?
Stakeholders had differing views about who would be best placed to provide case coordination support to families (table 16.1). Advisors were most likely to favour themselves or state-based providers. Diagnosticians also favoured Advisors and state-based services as well as themselves. While Panel providers favoured themselves, few Advisors or diagnosticians did. Suggestions from the professional colleges/ associations also varied.
Table 16.1: Who should provide case coordination support?
Case coordination for newly diagnosed children with autism would best be provided by…
AAS EISP Diag
Paediatricians 6% 12% 21%
Autism Advisors 40% 27% 31%
HCWA Early Intervention Panel Providers 6% 31% 11%
State/ Territory funded early intervention services 34% 15% 23%
Local GPs 0% 2% 1%
Other, please specify* 14% 12% 14%*AAs’ ‘other’ responses include family support workers in community organisations, autism association, specialist case managers and autism-specific services.Panel providers ‘other’ responses (<6 respondents each) included allowing families to choose the most relevant coordinator for them, existing early intervention providers, a case management service (some specified this should be independent), a combination of the stakeholders in the table above, social workers, state autism associations, experienced clinicians and non-medical professionals.Diagnosticians’ ‘other’ responses included psychiatrists, the best trained, whoever the parent wants, the parent (so money isn’t wasted on professionals), social workers or specialist disability workers.
How families are being supported currently
Family survey data (2010) suggest that most families are coordinating the services their child receives themselves; with a small proportion (< 14%) receiving help from Panel providers, Advisors, local GPs, state-based services, autism associations and paediatricians.76 This conflicts with data from Advisors, diagnosticians and Panel providers who indicated providing a higher proportion of families with some form of case coordination. The difference may be due to different understandings of case coordination or because families don’t see the support they receive from professionals as case coordination.
Paediatrician [is] not involved in treatment plan for early intervention and as far as we know does not discuss [child] with other service providers. I pass on what ST or OT has said to the paediatrician. Not sure what he adds at all to helping [child]. I coordinate all the services. GP also wants to see [child] regularly and I feel this is just a waste of our time. [Follow-up family interviewee]
Some state-based services also provide key workers or case managers to support families. Some of these claimed families rely on their case managers for guidance about the Package. But of the families surveyed in 2010 only 5% indicated they were receiving
76 2010 family survey data
145

help from a state-based service to coordinate services, suggesting the reliance on these managers for support with Package services is not wide-spread or that families don’t see the support they’re receiving from state-based services as case management related to the Package.
Resource implications
While Advisors were more likely to see themselves than other stakeholders as appropriate to fulfil the coordinator role. some of those consulted and some survey respondents, particularly from larger states, mentioned they lack the capacity to fulfil this role. One of these Services said other available services have tailored their supports to meet system gaps; they’ve also involved caseworkers from community organisations in family consultations as needed. A second Advisor Service said it would be necessary to assess what other services are available in each state (and from associations) in considering what supports are needed. Clearly there is a need to consider fit with other systems and the resource implications if case coordination support is to be provided under the Package.
16.5 Fit with best practice principles
The Panel model is also designed to ensure providers deliver services consistent with best practice principles for children with autism. Evidence (from Panel providers) suggests their practices largely incorporate individualised planning, programming and review, as well as strategies to promote the generalisation of skills and to address children’s need for predictability and routine, consistent with best practice for children with autism.
But there are competing claims from Panel providers and state-based services and representatives about the extent to which Panel services are family centred. As noted in Section C, these should be followed up through a quality monitoring process. Some stakeholders also suggested the need for more holistic services; and a small proportion of comments from families raised the need for support for parents and siblings or for respite. While these services may be needed, the Package cannot fulfil all needs within the available funding and should make the most of opportunities to effectively connect parents to services available through other initiatives (for example, Better Access to Mental Health initiative, Chronic Disease Management Medicare items, and funded respite services) through Advisor Services.
Given the concerns about multidisciplinary practice and the evidence from Panel providers, there is a particular need for new strategies to ensure adherence to this best practice principle.
146

16.6 Concerns about age limits and services for children 7 years and over
As in previous years, one of the most common issues raised by family survey respondents was the need to extend the Package beyond a child’s seventh birthday. Most comments related to the need to extend the Package or make other services available because people with autism have lifelong needs. But some wanted longer to spend the funding so they could best utilise the full $12,000; others emphasised a need for supports for school-aged children in particular. Some families we interviewed and some families who contacted the team during the final evaluation were also concerned about the lack of ongoing support.
Why do you cut it off at seven years? There is no doubt the funding is crucial from an early age, but autism does not go away at seven! If anything more support is required, because it's a lot harder for a seven year old who is developmentally delayed to fit in. Deep and regular social therapy is required, and it's not cheap. [Family survey respondent]
We have had difficulty using up the $12,000 on therapy, without burning out our child and ourselves. It would be great to have access to unused funds after his seventh birthday. [Family survey respondent]
We were very limitted [sic] and only having a year to use this money to bennifit [sic] my son ... most of the money was not accessed due to lack of providers at the time. [Family survey respondent]
I get that it is for EI but some form of ongoing funding for school age would be ideal. [Family survey respondent]
Families should be able to access funding up until 10 [years] and not be forced to use it based on silly financial year and age restrictions. My son will need speech for several years but I am wasting up to $2000 trying to use it before the cut off from between 1 July and 10 Sep [sic] when he turns seven. [Family survey respondent]
…I feel that a lot of the work we did with my son in early intervention was in vein [sic], due to the inability to continue with ongoing treatment. This package should go until the child has AT LEAST finished primary school, or better still go through until they are in high school. [Family survey respondent]
Some other stakeholders, including Advisors, state department representatives, Panel providers and diagnosticians also noted concerns about age limits because some children (for example, children with Aspergers) may receive a diagnosis later and miss out on support. In some cases, age limits can create inequalities between siblings (where one receives the funding and the other does not). One suggestion from some of these stakeholders was that families be able to access services for two years post date of diagnosis. One stakeholder suggested allowing families to spend the full balance of remaining funding in the year up to the child’s seventh birthday.
I have a family whose younger child received the package and an older child (just diagnosed) who just turned six years old has been denied. This has caused considerable stress and anguish
147

for the parents who can offer one child treatment opportunities and the other child none. [Panel provider survey respondent]
Box 16.3 Information about the change in child age eligibility criteria was not widely communicated
Marie-Louise shares the care of her twins, Luke and Sophie, and their brother Mark with her ex-husband Paul. Luke was diagnosed with autism when he was three years old, before the HCWA Package was introduced. Within two months of his diagnosis, Luke’s family began paying for him to have home-based ABA therapy. Luke has received consistent support at school from the Special Education Unit. A respite worker comes to the family home each week, which is a Home and Community Care (HACC) service subsidised heavily by a local Community Access and Respite provider.
Marie-Louise learnt about the HCWA Package just after Luke turned six. This was around the time that FaHCSIA broadened the eligibility criteria to enable children to access support up to their seventh birthday. When Marie-Louise first enquired, she was told that Luke was ineligible because of his age. Some months later, a friend told Marie-Louise that children up to seven years could now access funding. By the time Luke’s application was submitted and approved, there were only six weeks left until his seventh birthday and he became ineligible for further support. During those six weeks, the family was able to use the funds they received to pay for some of Luke’s home-based ABA. They still needed to pay the difference between the HCWA payment and the cost of the home-based therapy, and Marie-Louise and her ex-husband have continued to pay for it in its entirety since. Being at home with Luke means that Marie-Louise cannot work and, even though the family is capable of paying for the services that Luke receives, it has been a financially difficult time since Luke was diagnosed.
The family was frustrated that, because of the timing of their enquiry, the changes to eligibility criteria and the length of time it took for Luke’s application to be approved, that Luke was only able to access six weeks instead of almost 12 months of HCWA funding. The family welcomed the money they did receive, but believe that offering funding for a fixed period from the date of first access would be more useful for families like theirs.
16.6.1 Services for school-aged children
Some stakeholder concerns about the age limit are related to the drop off in supports for children over seven years. A number of children are already using their funding for in-school support during transition to school. Stakeholders also noted the need for support at other transition periods during schooling, but these would be outside the Package’s focus on early intervention.
There were a few suggestions that children be able to use remaining funding to top-up supports like teacher’s aides. But there would be a need to consider how this would overlap with state government support for children with disabilities in schools and federal initiatives following the review of funding for students with disability (due at the end of 2011) and the More Support for Students with Disability initiative, with funding of $200 million announced in July 2011.
148

A few stakeholders also raised concerns about the understanding of childcare and school staff with children with autism, with some suggestions about how Package services could address this, for example, one Advisor Service suggested they could provide autism education to services like childcare. But there is a need to consider how this would overlap with the remit of other programs and services. The DEEWR-funded Inclusion Support program supports inclusion in childcare centres, by up-skilling carers, educators and management to help support the inclusion of CALD, Indigenous and children with disability. And the DEEWR-funded Package component, Positive Partnerships, works with school staff and parents of school-aged children specifically about autism.
16.6.2 Continuing with services—anecdotal indications
Some concerns relate to families’ ability to continue to pay for services once their child’s funding has ended. One parent who contacted the team during the final evaluation was concerned some families discontinue services for the child once their funding ends because they think this means their child has had enough early intervention. A representative from one professional college/ association also made this claim. But one provider we spoke to said some families that might not otherwise have been willing to pay Medicare gap fees had chosen to continue with their service because they’d seen the value of it for their child during the funding period.
One state-based service and a state department representative were also concerned that some providers might pressure families to continue with a service they could not afford.
Of the few families we followed up whose funding had ended, some were continuing to access or try to find ways to access services, while others could no longer afford it. Of the Indigenous families we spoke to, one had come to the end of their funding period and was no longer able to access services.
149

17. Fit with the existing service system
The combination of education and support components the Package provides are all intended to complement existing services—they should be recognised as contributing to an existing and continuing system of support.
17.1 Perceived impact on the diagnostic sector
Throughout the evaluation some stakeholders—including diagnosticians, state-based services, Panel providers77 and state department representatives—have raised concerns that the Package has created pressure to diagnose and, in some cases, may be leading to misdiagnosis. But other stakeholders were less convinced this is occurring or that misdiagnosis is widespread.
I think this program has created demand, and in some instances I’m not sure whether there are people on the program who might otherwise not have been diagnosed with autism. [Panel provider interviewee]
About three-quarters of diagnosticians surveyed reported feeling pressured to provide an autism diagnosis (table 17.1). One mentioned it has led to ‘diagnosis shopping’ and another that some families are researching autism and exaggerating their child’s symptoms in parent questionnaires like the ADI-R (Autism Diagnostic Interview–Revised). One Panel provider we spoke to was also concerned the latter is occurring.
The same proportion (three-quarters) of diagnosticians surveyed also agreed the nature of what is presenting and being diagnosed as autism may be widening because of the early intervention funding. Likewise, some state department representatives and state-based services claimed some children in their services with an autism diagnosis would not previously have received one. A small proportion of diagnosticians and one state department representative mentioned concerns that this can lead to mismanagement of treatment. But a second state department representative emphasised the need to deal with suspected misdiagnosis cautiously so as not to further stress parents/ carers.
77 Nearly two-thirds (63%) of Panel providers surveyed in 2010 agreed they’d seen an increase in families seeking a diagnosis of ASD for their child because of the early intervention funding.
150

Table 17.1: Impact on autism diagnoses, diagnosticians’ views
Diagnosticians’ views of the Package’s impact on diagnoses 2009 2011
I feel pressure from some parents to provide an early diagnosis of autism so that they can access HCWA funding for early intervention services 69% 76%
I feel that the nature of what is presenting and being diagnosed as autism may be widening because of the HCWA funding for early intervention services - 77%
Source: Diagnostician survey 2009 and 2011.The 2009 and 2011 surveys cannot be directly compared because the 2011 sample includes psychiatrists and neither are representative.
At this stage registrations remain roughly in line with the estimated prevalence rates for autism in children. But, given the concern among stakeholders, registration figures should continue to be monitored against prevalence estimates. The Package’s impact on actual diagnostic rates, however, cannot accurately be scoped because diagnostic rates had already been increasing before the Package was introduced, meaning any increase may simply be a continuation of that trend.
17.2 Fit with state-based services
17.2.1 A need for clearer links between the Package and state-based services
Evidence from Advisor Services and state-based services interviewed is that cross-referrals between the two systems are occurring (table 17.2). But only 61% of Advisors agreed that linkages between the Package and state-funded services are clear. Some other stakeholders—state department representatives, state-based services (some also providing Package services), a handful of diagnosticians, and a representative of one of the professional colleges/ associations—raised concerns that having two systems is confusing for families or can lead to fragmented service delivery. But only a minority suggested that existing services should have been funded instead. Some families we spoke to and a small proportion of family survey respondents suggested a need for clearer linkages between the Package and state-based system.
There seem to be a range of things out there—but none of them connecting. I stumbled across ECIS78—never told about them as another source of possible funding. I also couldn’t get hold of a speech therapist [sic] (regionally) and no one seemed to be able to help me. [Family survey respondent]
Autism Advisor Services are recognised by some stakeholders as helping to clarify and support access to the two systems. But a few stakeholders suggested potential for greater synergies between the entry points to the two systems. One state department representative and a representative of one of the professional colleges/ associations suggested there may be potential to look at combining the entry points to the two systems, though there would be funding issues to work out. In South Australia, Advisors are already the entry point to the state-based system and the Package—but the couple of 78 Victorian Early Childhood Intervention Service
151

stakeholders that commented on this arrangement had mixed views on how this was working.
Table 17.2: Advisor linkages with state-based services
2011
We have regular contact with state/ territory early intervention services 80%
Autism Advisors regularly link families with state/ territory early intervention services if they are not already aware of these services
88%
The linkages between the HCWA Package and state/ territory funded Autism Spectrum Disorder services are clear
61%
Source: Advisor survey 2011
Box 17.1 Differences in diagnostic criteria
Qld: Diagnosis must be by a paediatrician, neurologist or psychiatrist. SA: Children with PDDNOS are not eligible for state-based disability services unless they also have an
intellectual disability. WA: A multidisciplinary diagnosis is required.
The differences in diagnostic criteria between states may also be contributing to confusion for families (box 17.1). One state department representative suggested a need for consistent diagnostic criteria across the nation, which would also assist families that move between states.
17.2.2 Impact on access to state-funded early intervention services
While it is not state government policy to deny children receiving Package early intervention funding access to state-based services or to give them lower priority for these, there are indications that this may occur when state-based services with limited capacity have to make decisions about prioritising children on waiting lists. Services’ prioritisation criteria may include whether the child has access to any other services.
Throughout the evaluation a range of stakeholders have raised concerns about access to state-based services. In the final round, this concern was raised by some Advisor Services, Panel providers and STOs, but was not a significant issue in family survey comments. Of the families surveyed, less than one-third (28%) reported funding their child’s early intervention through state-based services (Box 17.2). This is somewhat at odds with interview data, as only a few families we spoke with mentioned issues with access to state-based services. Some of the children of families surveyed that were not accessing state-based services may currently be on the waitlist for a service or over the age limit for state-based early intervention.
Box 17.2 Supported by both the Package and the state-based system
Elizabeth and Rod live in Canberra and have two children. Nick is five-and-a-half years old and was
152

diagnosed with autism at age two.
Since the diagnosis Nick has accessed a range of interventions, both state-based and Panel providers. The state-based services have included a disability-specific playgroup, which Nick attended between the ages of two and three. Elizabeth was very happy with the playgroup and described it as ‘desperately needed…good to meet other mothers’. Nick also attended a state-based autism-specific unit, which was appropriate for Nick’s needs at first, but he became distressed by the noisiness of the environment (he is noise-sensitive) so Elizabeth moved him to a state-based school for students with intellectual disability. Elizabeth said that since Nick has attended this school he has really progressed and she thinks this is because he isn’t getting stressed anymore. Nick also sees a state-based occupational therapist and speech pathologist. With his Package early intervention funding, Nick has been seeing a therapist regularly and Elizabeth is very happy with this service.
One of the Advisor Services and an STO suggested some of the issues raised with access may actually relate to family confusion (see box 17.3). And, given the impetus for the Package was limited services for children with autism, it’s unclear whether these children would have received a state-based service prior to the Package. Anecdotally, there are still concerns about waiting lists for some state-based services. On the whole, though, the family survey data, combined with concerns raised by stakeholders, suggest some cause for concern.
Box 17.3 Access to the Package and state-based services: potential for confusion
Susie and her husband Peter live with their three children—their oldest son Aaron was diagnosed with autism at age three in 2009. Before the funding became available, Aaron was receiving therapy from a few state-based services. After they received the funding, they mentioned another provider they were seeing to a state-based service staff member and were told this might be considered ‘double dipping’. For a few months they didn’t have any appointments with this service, and had trouble getting therapists to return their phone calls. Susie was unsure whether this was because of the perception that accessing both services would be double dipping and somehow unfair or simply because the service was in high demand. When we spoke to them the following year they were accessing therapy through the state system without any problems. There may have been some confusion because through the state system families are able to access blocks of therapy then have to wait again to have their turn, or there may have been an individual staff member misinterpreting policy.
For their part, some state-based services we spoke to said that some families may disengage from or choose to have less involvement with their service if they are accessing intensive intervention through the Package or if both parents are working and taking their child to Panel providers. Some tend to ‘step back’ while families are intensively accessing Panel providers, or encourage families to alternate their blocks of
153
state-based therapy with a period of Package services; one prefers not to ‘dual service’ because it confuses children.
17.2.3 Interaction with education services
The final evaluation has identified some emerging concerns about the interaction between the Package and state education services.
Assessments for teacher’s aides
To obtain teacher’s aide support, a child must receive a professional assessment, either through the public system or from a private provider. One family we spoke paid their Panel provider to undertake this assessment because they didn’t want to stress their child by accessing a public service they were unfamiliar with. But this family was concerned that they could not use the Package funding to pay for the assessment. One provider we spoke to also raised this issue, though recognised there might be some objection to federal funding being used to meet the requirements of a state-based service.
Transition and in-school support
Transition support is generally provided by state-based early intervention services in the lead up to the child starting school and, in some cases, during a child’s first term at school. According to some families we followed up, in-school support isn’t available to children attending non-government schools. Once a child begins school, education departments have responsibility for in-school supports, but these vary from state to state—some departments directly employ allied health professionals, others don’t, and across all there is limited capacity for direct work with children.
Given this, some Panel providers have supported children in the lead-up to transition or in the school environment. Of the families we followed up, quite a few had received transition support from state-based services; some had received support from Panel providers. Several chose to use their Panel providers to support to their child in school or were planning to, but one of these noted this meant their child was not getting support from education-funded speech pathologists because these prioritise children not accessing any other services. One family said it was important to use their provider because the school would be more likely to listen to them than the family.
We think it’s important she [provider] goes to the school as well. Just so the teachers are aware of what our kids need. Teachers will listen more to what someone like Anne says compared to us. [Follow-up family interviewee]
There is little evidence about the interaction between state-based and Panel transition support, although one state department representative said their transition support
154

program steps back when Panel providers are involved in teacher meetings because sometimes having multiple professionals involved can cause confusion.
There is more evidence about in-school support—with concerns about how this is working in some cases. Some Panel providers and state department representatives had heard of some schools preventing certain Panel providers from working in their school, in some cases because of previous negative experiences. While some state education representatives raised concerns about the philosophical fit between therapy and education approaches to supporting children, others (as well as Panel providers and DEEWR representatives) suggested issues occur when individual providers don’t understand what works in the school context or don’t tailor their approaches to the school environment. Some said attitudes to therapeutic input can vary between schools. Some stakeholders involved also noted issues may be related to the different orientation of Package supports and those provided through the state system—under the Package parents organise the support, while under the state system, schools request it.
One state education department representative noted they’d had mixed feedback about Panel providers—some had effectively integrated into schools, while others provided a parallel service. They were concerned about the latter occurring because if children are pulled out of class for intervention they might miss other important learning opportunities. Another noted that issues with work in schools can also be practical—with the need to consider logistics, occupational health and safety, and how providers interact with other students. Similarly, another representative mentioned that schools may not have the facilities to accommodate individual sessions.
One state department representative suggested Panel providers be required to fit into state transition plans to ensure coordination. Another suggested a need for more streamlined processes for Panel providers to connect with schools when supporting students—providers could be required to link with student support services (or equivalent) in schools.
Some education representatives suggested addressing issues by providing training for education and allied health staff so they can develop better understandings of each other’s practice and better working relationships. But one said this would be very resource intensive and fact sheets would be a more practical approach.
Pressure on the education system
Some education stakeholders claimed the Package has increased family expectations of the education system, for example, expectations that schools will have autism policies rather than existing disability policies or expectations of ongoing autism-specific supports when schools generally support teachers to adapt practice to meet children’s needs. But one representative said while they’d thought this might be an issue it hasn’t eventuated to the extent they thought it would.
155

17.2.4 Opportunities for linkages with state departments
The evidence suggests stronger connections between Package management and state and territory government departments would be useful. While state department representatives we consulted generally saw the need for greater communications, they had some differing views about how regularly contact should occur. Generally though, they wanted communications to focus on achieving better coordination between the systems and identifying gaps and overlaps; some also wanted feedback following the evaluation and any implications for the service going forward. Some (that directly deliver services) have had contact with Autism Advisor Services, and some others would also like contact with Autism Advisors at the local level as well as having policy-level conversations.
While connections between the Package and state departments could occur at the STO level, only the Victorian, Tasmanian and NSW STOs have had any contact with state departments in relation to disability services or autism in particular. One of these had contact to discuss access issues, which they said are related to service staff interpretation of policy, meaning ongoing contact is needed to address the concerns because of staff turnover. Three of the STOs said future planned connections with state departments should occur at the National Office level for different reasons: because it will ensure consistency; be at the level to effect policy change; or because of capacity issues. A couple, however, noted potential for relationships at both levels—either where the STO has an existing relationship with state departments, or for particular issues.
17.3 Fit with other funding options
Since the establishment of the Better Start Package (July 2011), an emerging issue in the final evaluation was the fit with this program. Children with a dual diagnosis are only able to access one Package, but there was some concern families might need help deciding which services to access services. Another concern was that because autism may be diagnosed later than other disabilities, children will not have access to autism-specific services because they would have accessed Better Start first. Some Advisors were also concerned about any change that would see their role absorbed into Better Start.
Families with children with autism may also be able to access services through the Better Access to Mental Health initiative and Chronic Disease Management. Some families consulted had become well aware of the range of available funding options and how to make use of them, but if not doing so already Advisors could inform families of these options; given the amount of information families need to take in, these other options could also be noted on the RCN website’s Service Pathfinder.
In future there will also be a need to consider how the Package (and Better Start) will fit with the National Disability Insurance Scheme.
156

Appendix 1: Survey respondent characteristics
Family survey respondents
Table A1: Diagnosis, Child 1
n %
Autism disorder 3053 69%
Asperger’s disorder/ syndrome 729 17%
Pervasive developmental disorder - not otherwise specified
570 13%
Retts disorder 10 0%
Other 31 1%
Total 4393 100%
No data 44
Table A2: Diagnosis, Child 2
n %
Autism disorder 3053 69%
Asperger’s disorder/ syndrome 729 17%
Pervasive developmental disorder - not otherwise specified
570 13%
Retts disorder 10 0%
Other 31 1%
Total 4393 100%
No data 3824
Table A3: Diagnosis, Child 3
n %
Autism disorder 53 56%
Asperger’s disorder/ syndrome 21 22%
Pervasive developmental disorder - not otherwise specified
13 14%
Other 8 8%
Total 95 100%
No data 4342
157

Table A4: Diagnosis, Child 4
n %
Autism disorder 18 72%
Pervasive developmental disorder - not otherwise specified
5 20%
Other 2 8%
Total 25 100%
No data 4412
Table A5: Diagnosis, Child 5
n %
Autism disorder 3 33%
Pervasive developmental disorder - not otherwise specified
3 33%
Other 3 33%
Total 9 100%
No data 4428
Table A6: Child’s age now
Mean Std.dev. Min. Max. Count No data
Age now Child 1 5.9 2.1 0 51 4356 80
Age now Child 2 6.1 2.7 1 25 592 3844
Age now Child 3 6.0 3.2 1 20 94 4342
Age now Child 4 4.5 1.8 1 8 23 4413
Age now Child 5 3.9 2.1 1 7 8 4428
Table A7: Child’s age when diagnosed
Mean Std.dev. Min. Max. Count No data
Age now Child 1 3.8 1.8 0 54 4312 124
Age now Child 2 4.0 2.2 1 25 579 3857
Age now Child 3 4.0 2.5 2 19 88 4348
Age now Child 4 3.4 1.8 1 8 19 4417
Age now Child 5 3.4 1.2 2 5 4 4432
158

Table A8: Child’s age when registered
Mean Std.dev. Min. Max.* Count No data
Age now Child 1 4.2 1.2 0 12 4086 350
Age now Child 2 3.9 1.2 1 8 453 3983
Age now Child 3 3.9 1.5 2 11 75 4361
Age now Child 4 3.6 1.4 2 6 20 4416
Age now Child 5 4.1 1.2 2 5 5 4431* Responses suggest some confusion about Package age limits.
Table A9: State located
N %
Australian Capital Territory 53 1%
New South Wales 1490 34%
Northern Territory 20 0%
Queensland 767 17%
South Australia 274 6%
Tasmania 84 2%
Victoria 1439 33%
Western Australia 294 7%
Total 4421 100%
Missing 16
Table A10: Region located
N %
Capital city 2529 58%
Regional or rural area 1759 40%
Remote area 68 2%
Total 4356 100%
Missing 81
Table A11: Language mainly spoken at home
N %
English 4091 93%
Other, please specify 301 7%
Total 4392 100%
Missing 45
159

160

Table A12: English proficiency
N %
Very well 4001 91%
Well 264 6%
Not well 104 2%
Not at all 27 1%
Total 4396 100%
Missing 41
Table A13: Does child identify as Indigenous
N %
Yes 140 3%
No 4262 97%
Total 4402 100%
Missing 35
Table A14: Family gross weekly income
N %
High gross family weekly income ($2,000 or more) 655 16%
Medium gross family weekly income ($600–$1,999) 2582 62%
Low gross family weekly income (<$600) 827 20%
Nil income 117 3%
Total 4181 100%
Missing 256
Advisor Services
Table A15: Position in organisation
N %
CEO/ President state autism association 4 11%
Coordinator (Autism Advisors) 3 9%
Team Leader 5 14%
Autism Advisor 23 66%
Total 35 100%
Missing 1
161

162

Table A16: Year began with the Autism Advisor Service
N %
2008 10 32%
2009 10 32%
2010 7 23%
2011 4 13%
Total 31 100%
Missing 5
Panel providers
Table A17: Panel provider type
N %
Lead agency of a consortium 91 33%
Consortium partner 59 21%
Multidisciplinary Early Intervention Service Provider
68 25%
Sole provider 57 21%
Total 275 100%
Missing 1
Table A18: Position in organisation
N %
CEO 41 15%
Manager 74 27%
Clinician 119 43%
Other, please specify 42 15%
Total 276 100%
Missing 0
Table A19: Profession (for clinicians only)
N %
Occupational therapist 62 29%
Speech pathologist 96 45%
Psychologist 27 13%
Other, please specify 28 13%
Total 213 100%
Missing 94
163

Table A20: State located
N %
Australian Capital Territory 2 1%
New South Wales 105 38%
Queensland 46 17%
South Australia 18 7%
Tasmania 6 2%
Victoria 80 29%
Western Australia 17 6%
Northern Territory 2 1%
Total 276 100%
Missing 0
Table A21: Northern Territory outreach
N %
Yes 11 4%
No 262 96%
Total 273 100%
Missing 3
Table A22: Area service covers
N %
Capital city only 102 38%
Capital city with outreach to regional/ remote areas 51 19%
Regional centre/s only 65 24%
Regional centre/s with outreach to remote areas 37 14%
Remote area only 2 1%
Other, please specify 12 4%
Total 269 100%
Missing 7
Table A23: Type of early intervention provided
N %*
Behavioural interventions 174 63%
Developmental and social learning interventions 222 80%
Therapy-based interventions 260 94%
Family-based interventions 203 74%*Does not sum to 100% because multiple responses allowed
164

Table A24: Year joined the Panel
N %
2007* 2 1%
2008 41 16%
2009 73 28%
2010 83 32%
2011 58 23%
Total 257 100%
Missing 19*The Panel was not established until 2008.
Diagnosticians
Table A25: Main areas of practice
n %*
Child development and behaviour 34 34%
Paediatric psychiatry 37 37%
General paediatric medicine 46 46%
Other paediatric medicine sub-specialties 5 5%
Paediatric surgery 0 0%
Neonatology 2 2%
Other, please specify 5 5%
Total 129
Table A26: State located
N %
Australian Capital Territory 3 3%
New South Wales 24 25%
Northern Territory 5 5%
Queensland 24 25%
South Australia 7 7%
Tasmania 2 2%
Victoria 28 29%
Western Australia 4 4%
Total 97 100%
Missing 2
165

Table A27: Region located
N %
Capital city 69 70%
Regional area 27 28%
Remote area 2 2%
Total 98 100%
Missing 1
Table A28: Client groups that access your practice
N %*
Families from English-speaking backgrounds 93 94%
Families from Indigenous backgrounds 54 55%
Families from culturally and linguistically diverse backgrounds 71 72%
*Does not sum to 100% because multiple responses allowed
166

167

Appendix 2: Detailed chapter data
Chapter 5
Table 5.2: Sources of information about the Package
Source Paed Psych Total
Word of mouth, through colleagues 71% 43% 61%
From the www.fahcsia.gov.au/autism website 65% 16% 46%
From the www.health.gov.au/autism website 48% 38% 44%
Through the Autism Advisor Service 53% 11% 37%
Brochures and posters obtained from FaHCSIA 26% 24% 25%
From RACP eBulletin 35% 5% 24%
From the www.raisingchildren.net.au website 29% 14% 23%
Through early intervention service providers 35% 3% 23%
Through the State or Territory Autism Association 19% 3% 13%
Read about it in a newspaper or heard on the radio 5% 11% 7%
Not seen any information about the Package before now 0% 16% 6%
Through information sessions conducted by the Department of Health and Ageing 6% 3% 5%
Other, please specify 5% 8% 3%
From AGPN eBulletin 0% 0% 0%
168

Source: 2011 Diagnostician survey (99 respondents: 62 paediatricians and 37 psychiatrists). *Percentages do not add to 100% as respondents could select more than one source.
Table 5.3: Sources of information about local Panel providers
Source Paed Psych Total
Word of mouth 52% 49% 51%
From early intervention service providers themselves 60% 16% 43%
From the patient’s families themselves 48% 32% 42%
From the Autism Advisor Service 56% 14% 40%
From the www.fahcsia.gov.au/autism website 27% 19% 24%
From the State or Territory Autism Association 26% 19% 23%
From the www.raisingchildren.net.au website 15% 11% 13%
Through a web engine search 8% 8% 8%
Not aware of local autism early intervention services funded under the HCWA package 2% 8% 4%
Other, please specify 5% 0% 2%
169

Source: 2011 Diagnostician survey (99 respondents: 62 paediatricians and 37 psychiatrists).*Percentages do not add to 100% as respondents could select more than one source.
Table 5.4: Paediatricians’ and psychiatrists’ understanding and referral processes
Diagnosticians’ understanding of the Package—paediatricians compared with psychiatrists
Paed Psych Overall
The eligibility criteria for children to access the HCWA funded early intervention services are clear
88% 69% 82%
The way different sources of funding for early intervention services [Medicare rebates and HCWA early intervention funding ($12,000)] can be used is clear 45% 20% 36%
I am well informed about the role of Autism Advisors 57% 22% 44%
I am well informed about the Early Days Workshops for families with a child with autism 29% 20% 26%
I am well informed about specialist playgroups for children with autism (PlayConnect) 38% 19% 31%
I am well informed about the Autism Specific Early Learning and Care Centres for children with autism 25% 17% 22%
I am well informed about early intervention services that are on the Panel to deliver HCWA-funded services in my local area 48% 14% 35%
I regularly inform families with a child newly diagnosed with autism about the Autism Advisor Service 92% 53% 78%
I regularly refer families with a child newly diagnosed with autism directly to local early intervention services funded under the HCWA Package 81% 42% 67%
170

Source: 2011 Diagnostician survey (99 respondents: 62 paediatricians and 37 psychiatrists)
Table 5.5: Diagnosticians’ understanding and referral processes over time*
2009 2011
The eligibility criteria for children to access the HCWA funded early intervention services are reasonable
58% 56%
The requirement for the autism diagnosis to be made either by a paediatrician or psychiatrist in order to access funding is appropriate
79% 89%
The eligibility criteria for children to access the HCWA funded early intervention services are clear
51% 82%
The way different sources of funding for early intervention services [Medicare rebates and HCWA early intervention funding ($12,000)] can be used is clear - 36%
I am well informed about the role of Autism Advisors 51% 44%
I am well informed about the Early Days Workshops for families with a child with autism 56% 26%
I am well informed about specialist playgroups for children with autism (PlayConnect) 56% 31%
I am well informed about the Autism Specific Early Learning and Care Centres for children with autism 42% 22%
I am well informed about early intervention services that are on the Panel to deliver HCWA-funded services in my local area - 35%
I regularly inform families with a child newly diagnosed with autism about the Autism Advisor Service
80% 78%
I regularly refer families with a child newly diagnosed with autism directly to local early intervention services funded under the HCWA Package
58% 67%
Source: 2011 and 2009 Diagnostician surveys.The 2009 and 2011 surveys cannot be directly compared because the 2011 sample includes psychiatrists and neither are representative.
171

Chapter 7
Table 7.13: Families’ views on access to early intervention (2009–11)
Early intervention 2009 2010 2011
Because of the HCWA early intervention funding ($12,000) I am accessing early intervention services for my child/ children more frequently.
- 82% 85%
My family has an adequate choice of HCWA funded early intervention service providers in our local area.*
36% 31% 54%
The early intervention services my child/children need are available locally.
52% 57% 65%
My family is able to access HCWA funded early intervention services in a timely way our local area.
– 52% 58%
Source: Family surveys 2009, 2010 and 2011.*2010 slightly different question wording: There are enough HCWA funded early intervention service providers in our local area to choose from.
Table 7.14: Advisors’ views on access to early intervention (2009–11)
Early intervention 2009 2010 2011
Families have adequate choice of early intervention services in our state/ territory
37% 43% 56%
In metropolitan areas, there are sufficient local autism early intervention service providers on the panel to meet families' needs
– 43% 72%
In regional and rural areas, there are sufficient autism early intervention service providers on the panel to meet families' needs
– 2% 3%
There are sufficient autism early intervention service providers on the panel that provide outreach to remote areas to meet families' needs
– 2% 0%
Source: Advisor surveys 2009, 2010 and 2011.
Table 7.15: Panel providers’ views on access to early intervention (2009–11)
Early intervention 2009 2010 2011
Because of the HCWA early intervention funding, the families I see are accessing early intervention services for their child or children more frequently.
- 91% 95%
Because of the HCWA early intervention funding, more of the families I see are accessing multiple types of therapy for their child or children.
89% 92%
172

Early intervention 2009 2010 2011
Families have an adequate choice of early intervention panel provider services in our local area. 60% 52% 57%
There are sufficient early intervention panel providers to meet families' needs in our local area. 48% 55%
There are sufficient early intervention panel providers to meet families' needs in the area/s to which we provide outreach.* 14% 11%
Families are able to access early intervention panel provider services in a timely way in our local area. 50% 61% 73%
Source: Panel provider surveys 2009, 2010 and 2011.*Question for outreach providers only.
Table 7.16: Diagnostician views
Early intervention 2009 2011
Because of the HCWA early intervention funding, my patients (aged 0–7) with autism are accessing early intervention services more frequently
- 80%
Families have an adequate choice of early intervention services funded under the HCWA Package in our local area 17% 35%
Families are able to access early intervention services funded under the HCWA Package in a timely way 27% 43%
Source: Diagnostician surveys 2009and 2011.
Chapter 8
Table 8.5: Families’ views on the payment model (2009–2011)
Early intervention 2009 2010 2011
The HCWA early intervention funding ($12,000) makes services more affordable for my family.
88% 88% 91%
My family is suffering financial hardship to pay for additional early intervention services for my child/ children with autism
71% 65%
The HCWA early intervention service providers that my child/children access charge more for therapy sessions when I pay with HCWA funding than when I pay privately.
70% 74%
The HCWA funded early intervention service providers that I am aware of offer value for money services for children with autism
64%
Using my HCWA early intervention funding, I have been able to easily obtain resources to support my child’s/ children’s therapy at home.
60% 71%
Resources purchased using HCWA early intervention funding have been important in achieving improvements for my child/children
84% 91%
The Outer Regional and Rural and Access Support Payment ($2,000) has made it easier for my family to access early intervention services
83%
Source: Family surveys 2009, 2010 and 2011.
Table 8.6: Advisors’ views on the payment model (2009–2011)
173

Early intervention 2009 2010 2011
In my view most Panel providers in our state offer value for money services for children with autism
50% 60%
Source: Advisor surveys 2009, 2010 and 2011.
174

Table 8.7: Providers’ views on the payment model (2009–2011)
Early intervention 2009 2010 2011
In my view most Panel providers in our state offer value for money services for children with autism
88%
The policy for approving resources is clear 66%
It’s important that early intervention service providers approve resources that families are able to spend HCWA funding on
92%
Having early intervention Panel providers source and provide resources for families is efficient
56%
In my experience, resources paid for through HCWA have been important in achieving improvements for the children I see.
91% 92%
The Outer Regional and Remote and Access Support payment ($2000) makes it easier for eligible families to access services
72%
Source: Panel provider surveys 2009, 2010 and 2011.
Table 8.9: Provider fees for Package clients
Charges for HCWA funded services compared with other clients 2010 2011
Less 7% 4%
The same 58% 59%
More 36% 36%Source: Panel provider surveys 2009, 2010 and 2011.
Table 8.10: Fee differences for those that charge more for Package clients
How much more do HCWA clients pay?* 2010 2011
Less than 5% 9% 9%
5 - 10% 34% 36%
11 - 20% 29% 37%
21 - 50% 17% 11%
More than 50% 11% 7%Source: Panel provider surveys 2009, 2010 and 2011.*Question for Panel providers that charge more only.
Table 8.11: Diagnosticians’ views on the payment model (2009–2011)
Diagnosticians views on service range 2009 2011
The range of services for autism spectrum disorders that are funded under the HCWA Package are appropriate
46% 54%
More of my patients (aged 0–7) with autism are receiving early intervention services as a result of the HCWA Package
62% 84%
Source: Diagnostician surveys 2009and 2011.
175

Chapter 9
Table 9.8: Families’ views on quality and best practice (2009–11)
Early intervention 2009 2010 2011
The local HCWA funded early intervention service providers have enough expertise in autism.
77% 80% 82%
Local HCWA funded early intervention service providers offer quality services.
81% 83% 84%
Source: Family surveys 2009, 2010 and 2011.
Table 9.9: Advisors’ views on quality and best practice (2009–11)
Early intervention 2009 2010 2011
In my view most early intervention panel providers in our state/ territory have adequate expertise in treating autism
– 73% 81%
In my view most early intervention panel providers in our state/ territory offer quality services for children with autism
– 82% 89%
Having an early intervention service provider Panel helps ensure quality services are provided to families
_ 55% _
Because of the HCWA early intervention funding, more of the families I see are accessing multiple types of therapy for their child or children.
90% 92%
Source: Advisor surveys 2009, 2010 and 2011.
Table 9.10: Providers’ views on quality and best practice (2009–11)
Early intervention 2009 2010 2011
Having multi-disciplinary services or consortia helps ensure families receive coordinated services for their child
- 86% 82%
Our organisation has difficulty meeting the requirement to achieve multi-disciplinary practice
- 33% 39%
Source: Panel provider surveys 2009, 2010 and 2011
Table 9.11: Providers’ views on family engagement
% ‘all’ or ‘most’
Early intervention 2010
How many parents are actively engaged in their child's/ children's individual service plan? 94%
How many parents are undertaking activities/ therapy in the home as part of their child's/ children's individual service plan? 85%
Source: Panel provider survey 2010
176

Table 9.12: Diagnostician views
Early intervention 2009 2011
Local early intervention services funded under the HCWA Package provide good quality services
74% 76%Source: Panel provider surveys 2009, 2010 and 2011.
Chapter 10
Table 10.3: Families’ views on Advisor Services
2009 2010 2011
My family was able to get timely advice about the HCWA package from the Autism Advisor.
87% 86% 88%
The Autism Advisor understood our needs. 88%
The Autism Advisor assisted me to understand what financial support is available for early intervention services under the HCWA Package*
91% 87% –
The Autism Advisor helped link me to the early intervention services my child/ children need.
–** 70% 76%
Our Autism Advisor gave us enough support when we needed it. 76% 74% 77%
Even with advice from the Autism Advisor, it is difficult to understand what services would be best for my child/children.
68% 71% 70%
The Autism Advisor helped me better understand what a diagnosis of autism means for my child/children.
– 48% 56%
I think it’s important that the initial meeting with the Autism Advisor be face-to-face.
77%
Overall, my family is satisfied with the advice and support provided by the Autism Advisor service.
79% 77% 77%
Source: Family surveys 2009, 2010, 2011.*Slight difference in 2009 question wording: Our Autism Advisor assisted us to understand what financial support is available from the Government for autism spectrum disorder (autism) early intervention services.**Similar 2009 survey question had a similar level of agreement: 75% agreed that their AA helped them to identify appropriate local autism early intervention services for their child.
Table 10.4: Advisors’ views on Advisor Services
2009 2010 2011
Families are able to see Autism Advisors in a timely way in our state/ territory.
86% 100% 97%
I am able to spend as much time with families as I think is needed – 79% 71%
I am able to successfully link families to the early intervention services they need
71% 88% 82%
Source: Advisor surveys 2009, 2010, 2011
177

Table 10.5: Advisors’ views on need for additional supports
% need Able to meet need
Min Max Median In the last 12 months, families have needed... Yes No Unsure
0% 100% 30%Advice/ information on two or more occasions (i.e. more than one follow-up phone call) 88% 6% 6%
0% 100% 15%Advice about transitioning from the Package to other services once the early intervention funding ends 70% 18% 12%
0% 100% 20%Information about/ referral to supports/ services other than HCWA and state-funded early intervention services 82% 9% 9%
Source: Advisor surveys 2009, 2010, 2011.
Table 10.6: Panel providers’ views on Advisor Services
2009 2010 2011
Autism Advisors are sufficiently experienced or qualified to meet families' needs for education and support
63% 76% 69%
In my experience, families are better able to make decisions about the early intervention services their child needs as a result of seeing an Autism Advisor
– 74% 66%
In my experience, Autism Advisors have helped families better understand what a diagnosis of autism means for their child/children
– 69% –
Source: Panel provider surveys 2009, 2010, 2011.
Table 10.7: Providers’ views on need for follow up
% need Able to meet need
Min Max Median In the last 12 months, families have needed... Yes No Unsure
0% 100% 90% Advice/ information on two or more occasions (i.e. more than one follow-up phone call)
68% 24% 8%
Source: Panel provider surveys 2009, 2010, 2011.
Table 10.8: Diagnosticians’ views on the Advisor Services
Diagnostician views on the AAS 2009 2011
The role of the Autism Advisor service is appropriate [initial contact re payment; education about autism; provide information about service options] 65% 74%
Source: Diagnostician surveys 2009, 2011.
Chapter 16
Table 16.2: Advisors’ views on need for case coordination
% need Able to meet need
Min Max Median In the last 12 months, families have needed... Yes No Unsure
0% 60% 10% Ongoing case coordination 36% 45% 18%Source: Advisor survey 2011
178

Table 16.3: Providers’ views on need for case coordination
% need Able to meet need
Min Max Median In the last 12 months, families have needed... Yes No Unsure
0% 100% 80% Ongoing case coordination 59% 31% 11%Source: Panel provider survey 2011
Table 16.4: Providers’ views on range of services delivered under the Package
% agree
2009 2011
The range of services for autism spectrum disorders that are funded under the HCWA Package are appropriate
69% 80%
Source: Panel provider survey 2011
Table 16.5: Diagnosticians’ views on need for case coordination
needed provided
% ‘all’ or most’
In the last 12 months, how families have needed... % ‘all’ or ‘most’
77% ...ongoing case coordination? (support to organise services they are accessing) 60%
57% ...case management? (intensive support to decide on, coordinate and plan services, monitor progress and reassess service needs)
43%
Source: Diagnostician survey 2011
Table 16.6: Diagnosticians’ views on range of services delivered under the Package
% agree
2009 2011
The range of services for autism spectrum disorders that are funded under the HCWA Package are appropriate 46% 54%
Source: Diagnostician surveys 2009 and 2011.
179