web viewq3 why ppc is concave? ... ppc is downward sloping : if the country want to produce more of...
TRANSCRIPT
Kendriya Vidyalaya no. 1 AFS, JamnagarAutumn Break Homework Class:- 12
Subject: English1. Read and make notes on one article from news paper – Find five new words their meaning 2. Draft an Invitation (formal)3. Speech
Subject: Computer Science Q.1 What do you mean by CALL BY VALUE and CALL BY REFERENCE?
Q.2 What is the difference between TYPE CASTING and TYPE CONVERSION?
Q.3 Explain: DEFAULT ARGUMENT Vs FUNTION OVERLOADING.
Q.4 What is the difference between BREAK and CONTINUE?
Q.5 How STATIC DATA MEMBER is different from other data member ?
Q.6 What are the advantages and disadvantages of INLINE functions?
Q.7 What is the significance of ACCESS LABELS in a class?
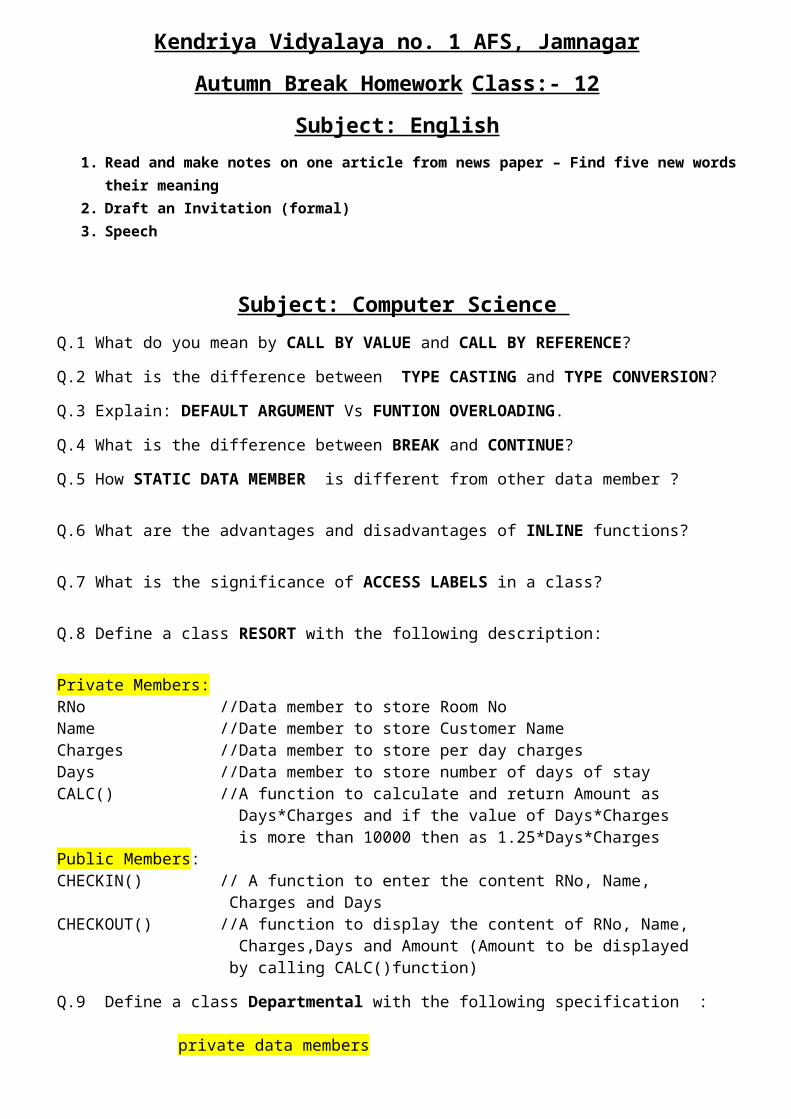
Q.8 Define a class RESORT with the following description:
Private Members:RNo //Data member to store Room NoName //Date member to store Customer NameCharges //Data member to store per day chargesDays //Data member to store number of days of stayCALC() //A function to calculate and return Amount as Days*Charges and if the value of Days*Charges is more than 10000 then as 1.25*Days*ChargesPublic Members:CHECKIN() // A function to enter the content RNo, Name, Charges and Days CHECKOUT() //A function to display the content of RNo, Name, Charges,Days and Amount (Amount to be displayed by calling CALC()function)
Q.9 Define a class Departmental with the following specification : private data members Prod_name string (45 charactes) [ Product name] Listprice long Dis_Price long [ Discount Price] Net long [Net Price ] Dis_type char(F or N) [ Discount type]
Cal_price() – The store gives a 10% discount on every product it sells. However at the time of festival season the store gives 7% festival discount after 10% regular discount. The discount type can be checked by tracking the discount type. Where ‘F’ means festival and ‘N’ means Non- festival .The Cal_price() will calculate the Discount Price and Net Price on the basis of the following table.
Product Name List Price(Rs.)Washing Machine
12000
Colour Television 17000Refrigerator 18000OTG 8000CD Player 4500
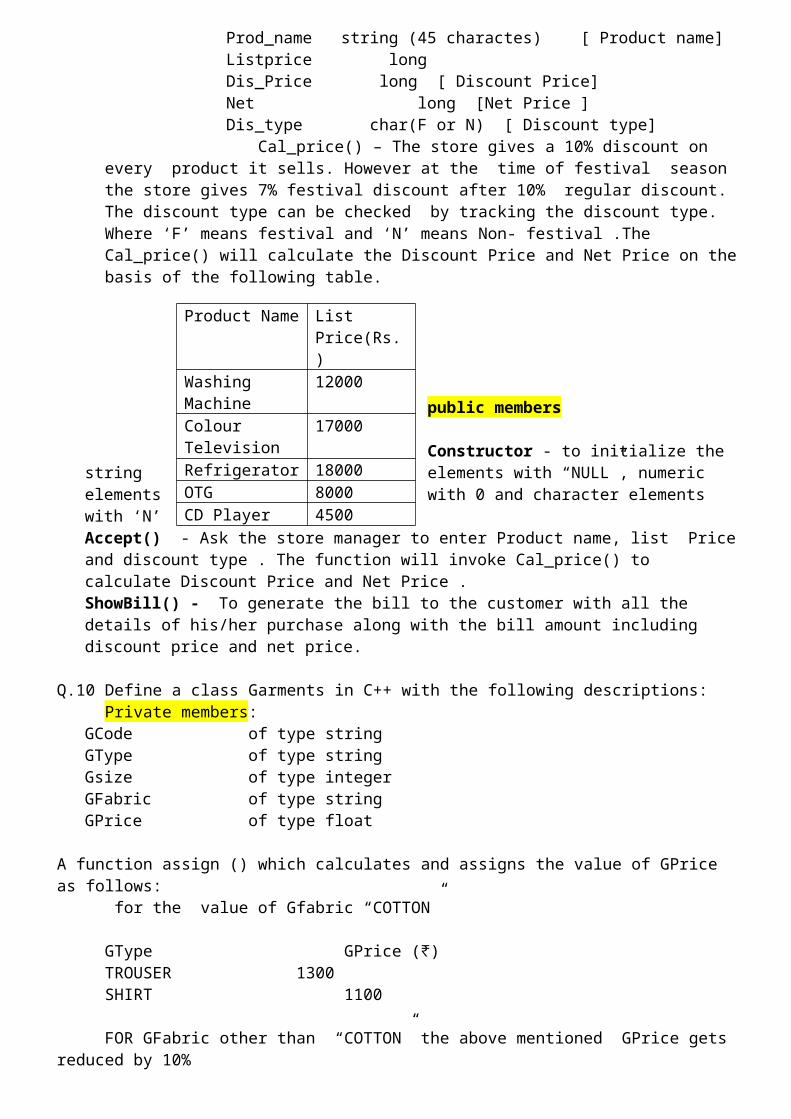
public members
Constructor - to initialize the string elements with “NULL”, numeric elements with 0 and character elements with ‘N’Accept() - Ask the store manager to enter Product name, list Price and discount type . The function will invoke Cal_price() to calculate Discount Price and Net Price .ShowBill() - To generate the bill to the customer with all the details of his/her purchase along with the bill amount including discount price and net price.
Q.10 Define a class Garments in C++ with the following descriptions:Private members:
GCode of type stringGType of type stringGsize of type integerGFabric of type stringGPrice of type float
A function assign () which calculates and assigns the value of GPrice as follows: for the value of Gfabric “COTTON”
GType GPrice ( )₹TROUSER 1300SHIRT 1100
FOR GFabric other than “COTTON” the above mentioned GPrice gets reduced by 10%Public Members: A constructor to assign initial values of GCode, Gtype and GFabric with the word “NOT
ALLOTTED” AND GSize AND GPrice WITH 0. A FUNCTION Input() to input the values of the data members Gcode, Gtype, GSize and GFabric and
invoke the Assign() function. A function Display() which displays the content of all the data members for a Garment.
Q.11 The following code is from a game, which generate a set of 4 random numbers. Praful is playing this game, help him to identify the correct option(s) out of the four choices given below as the possible set of such numbers generated from the program code so that he wins the game. Justify your answer.
#include<iostream.h>#include<stdlib.h>const int LOW=25;void main(){ randomize();
int POINT=5, Number;for(int I=1;I<=4;I++){
Number=LOW+random(POINT);cout<<Number<<":" <<endl;
POINT--; } }(i) 29:26:25:28:(ii) 24:28:25:26:(iii) 29:26:24:28;(iv) 29:26:25:26:

Q.12 What is the difference between GLOBAL and LOCAL variable?
Q13. Write a function in C++ which accepts a 2D array of integers and its size as arguments and displays elements which are exactly two digit number.
Q14 Name the header file(s) that shall be needed for successful compilation of the following C++ code :
void main( )
{ char Text[40];
strcpy(Text,”AISSCE”);
puts(Text);
}
Q15 Write a function to print all the prime numbers stored in a 2-D Array.
Q.16. Draw a Logical Circuit Diagram for the following Boolean expression:
A.(B+C’)
Q.17 Express the F(X,Z)=X+X’Z into canonical SOP form.
Q.18 If F(a,b,c,d)=∑(0,2,4,5,7,8,10,12,13,15), obtain the simplified form using K-Map.
Q19 Write a function in C++ which accepts an integer array and its size as arguments and interchange the value of each elements as follow :-
before :- 1 2 3 4 5 6 after :- 2 1 4 3 6 5
Q20 Explain the following terms with example: (i) typecasting (ii) typedef (iii) call by value and call by reference (iv) #define (v) Actual Parameters and Formal Parameters.
Q21 Write a program to enter a string and print every word in a new line.
Q22 Write a program to enter integers into 2D array (3X3) and display the array’s mirror image.
Q23 Write a program to enter n integers into an array of integers and multiply all even position’s number by 2 and all odd position’s integers by 3 and display the result(Note :-array starting from index number 0).
Q24 Write a function in C++ which accepts an integer array and its size as arguments and swaps the elements of every even location with its following odd location.
Example: If an array of nine elements initially contains the elements as 2, 4, 1,6,5,7,9,23,10 then the function should rearrange the array as 4,2,6,1,7,5,23,9,10.
Q25 Differentiate between Object based programming and Object Oriented programming.
Subject :- Economics
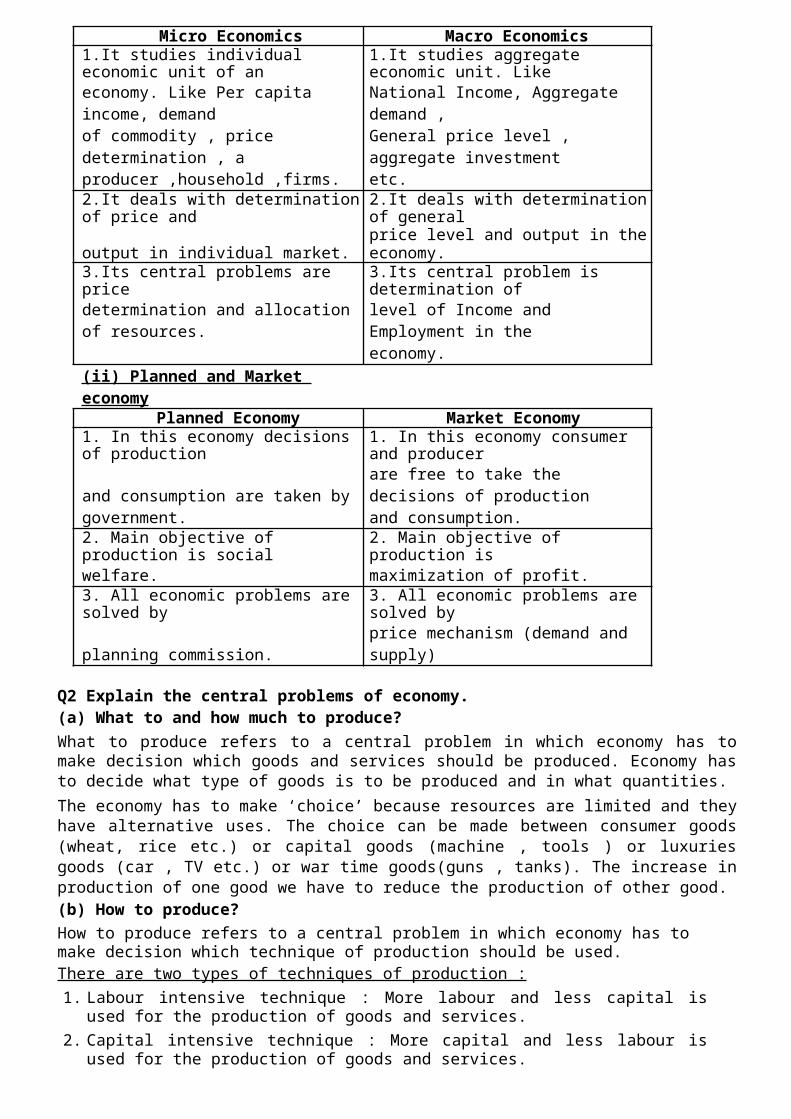
Q 1 (i)Micro and Macro EconomicsMicro Economics Macro Economics
1.It studies individual economic unit of an 1.It studies aggregate economic unit. Likeeconomy. Like Per capita income, demand National Income, Aggregate demand ,of commodity , price determination , a General price level , aggregate investment
producer ,household ,firms. etc.2.It deals with determination of price and 2.It deals with determination of generaloutput in individual market. price level and output in the economy.3.Its central problems are price 3.Its central problem is determination ofdetermination and allocation of resources. level of Income and Employment in the
economy.
(ii) Planned and Market economyPlanned Economy Market Economy
1. In this economy decisions of production 1. In this economy consumer and producerand consumption are taken by are free to take the decisions of productiongovernment. and consumption.2. Main objective of production is social 2. Main objective of production iswelfare. maximization of profit.3. All economic problems are solved by 3. All economic problems are solved byplanning commission. price mechanism (demand and supply)
Q2 Explain the central problems of economy.(a) What to and how much to produce?What to produce refers to a central problem in which economy has to make decision which goods and services should be produced. Economy has to decide what type of goods is to be produced and in what quantities.The economy has to make ‘choice’ because resources are limited and they have alternative uses. The choice can be made between consumer goods (wheat, rice etc.) or capital goods (machine , tools ) or luxuries goods (car , TV etc.) or war time goods(guns , tanks). The increase in production of one good we have to reduce the production of other good.(b) How to produce?How to produce refers to a central problem in which economy has to make decision which technique of production should be used.There are two types of techniques of production :1. Labour intensive technique : More labour and less capital is used for the production of goods and
services. 2. Capital intensive technique : More capital and less labour is used for the production of goods and
services. (c) For whom to produce? For whom to produce is one of the central problems of economy related with distribution of goods and distributions of income generated due to production.This problem arises because the output (goods) produced is limited.This problem is related with distribution of income between four factor of production (land , labour , capital and producer ) in the form of rent , wages , interest and profit. Who should get how much income is the problem. A person who contributes more in production gets higher income. Hence rich can purchase more amounts of good because he has more purchasing power (capacity to buy) than poor.Q3 Why PPC is concave?
Production possibility curve is concave to origin due to increasing marginal opportunity cost. Marginal opportunity cost is a rate at which unit of good Y is to be sacrificed for production of one more unit of X. MOC increases as all the resources are not equally efficient in production of all the goods.
1
Schedule of Increasing MOCGood X Good Y MOC
0 15 -1 14 12 12 23 9 34 5 45 0 5
Q4 Properties of PPC(i)PPC is downward sloping : If the country want to produce more of one good, it has to produce less
quantity of other goods.(ii) PPC is concave to the point of origin : Production possibility curve is concave to origin due to increasing marginal opportunity cost. Marginal opportunity cost is a rate at which unit of good Y is to
be sacrificed for production of one more unit of X.Basic
Utility: Want satisfying power of a commodity is called utility.Total Utility : Total utility is the total psychological satisfaction a consumer obtains after consuming a particular amount of a good. OR sum of marginal utility is known as total utility.Marginal Utility :It is the net addition to total utility by consuming one more unit of a good.
Q5 Law of Diminishing Marginal Utility:-It states that as the consumer consumes more and more units of a commodity, the marginal utility derived from each successive units goes on diminishing.
Quantity Marginal Total UtilityUtility
1 8 8
2 6 14
3 4 18
4 2 20
5 0 20
6 -2 18
Relationship between TU and MU:(i)When MU falls but remains positive TU increases at diminishing rate.(ii) When MU is ‘zero’ TU is maximum. (iii) When MU is negative then TU starts falling.
Consumer’s Equilibrium - BasicMarginal Utility of Money (MUm) -: This is assumed to be constant.This assumption becomes necessary because marginal utility of a commodity is measured in terms of money. It is desirable that the measure itself should not keep changing.Utility per rupee = It is the ratio of Marginal Utility of a good to price of that good.
Utility per rupee = MUx/Px (MUx= Marginal Utility of good x ; Px = Price of a good x)If a consumer gets satisfaction of 400 utils from Rs.100 Then utility of 1 rupee = 400/100 =4 utilsMarginal Utility of a good in terms of Money (MUx tm)-: This is the ratio of Marginal utility of a good to MU of money. It is just conversion of Marginal utility of a good in term of money. It means how much money is required to buy the given utility.Suppose a consumer is consuming a commodity and get 400 utils and utility per rupee is 4 utils.Then how much money(rupees) will be required to get the utility(400 utils).MUxtm = MUx/MUm= 400/4 = 100/- Rs. Rs.100 will be required to get the utility(400 utils).
2

Q6 Explain the Consumer’s Equilibrium - Two Commodity Case
In case of single commodity the consumer is in equilibrium when the utility per rupee of good x ( ) becomes equal to marginal utility of money (MUm) for that consumer.
Condition in case of good x=> (i)
Condition in case of good y => (ii)
Comparing both the above=> = =
So in case of two commodities the consumer is in equilibrium when the ratio of marginal utilities of both the goods to their respective prices becomes equal to utility per rupee.
denotes utility per rupee spent while consuming good x
denotes utility per rupee spent while consuming good y
We can also say that when utility per rupee from the last rupee spent on each good becomes equal the consumer attains equilibrium.
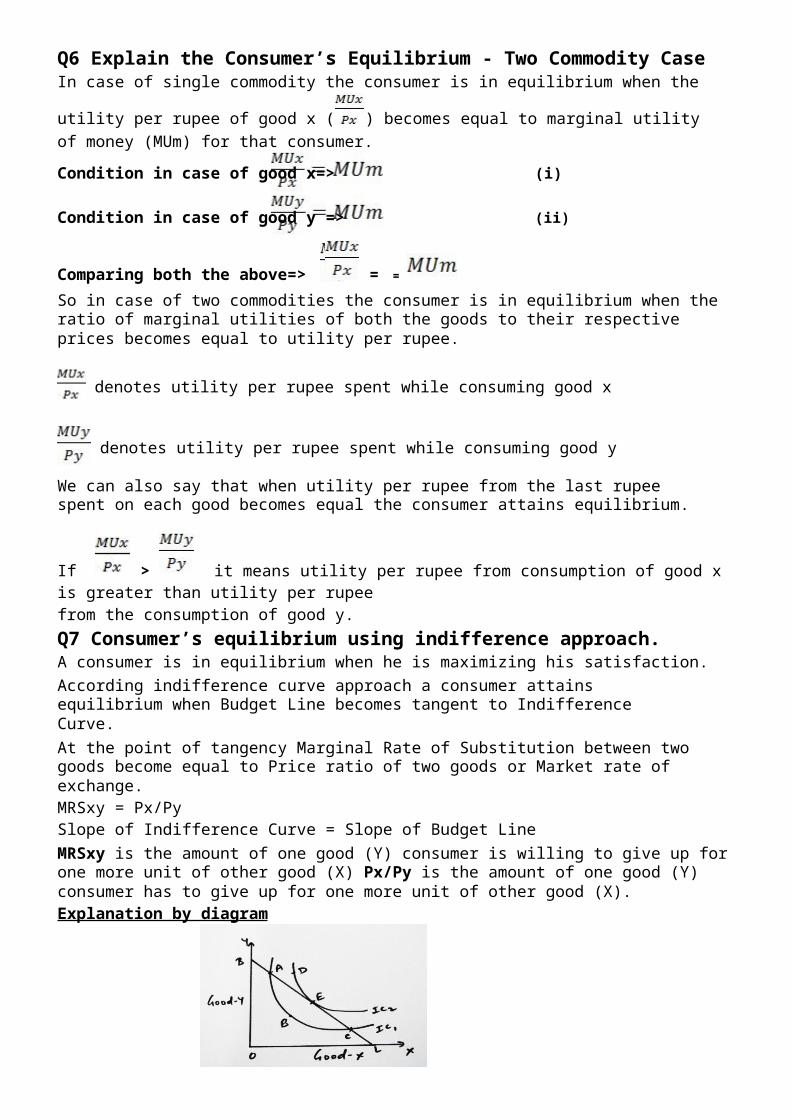
If > it means utility per rupee from consumption of good x is greater than utility per rupeefrom the consumption of good y.Q7 Consumer’s equilibrium using indifference approach.A consumer is in equilibrium when he is maximizing his satisfaction.According indifference curve approach a consumer attains equilibrium when Budget Line becomes tangent to Indifference Curve.At the point of tangency Marginal Rate of Substitution between two goods become equal to Price ratio of two goods or Market rate of exchange.MRSxy = Px/PySlope of Indifference Curve = Slope of Budget LineMRSxy is the amount of one good (Y) consumer is willing to give up for one more unit of other good (X) Px/Py is the amount of one good (Y) consumer has to give up for one more unit of other good (X).Explanation by diagram
On the diagram BL is budget line and IC is Indifference curve. Point A , B and C lie on same IC. So bundles A , B and C will gives same level of satisfaction.On bundle A and C the expenditure of consumer is equal to his income as bundle A and C lie on budget line. Expenditure on bundle B costs less than income as this point lies below the budget line.Bundle D is unattainable combination as it lies outside budget line. Bundle E is the combination of optimum choice. It is preferable over all.E is the point of equilibrium. At this point MRSxy = Px/Py (Slope of I C = Slope of B L).
3

ORConditions of consumer equilibrium under indifference curve approach.A consumer is in equilibrium when he is maximizing his satisfaction.According indifference curve approach consumer is in equilibrium when following conditions are fulfilled:
(i)MRSxy = Px/PyAt the point when Marginal Rate of Substitution between two goods become equal to Price ratio of two goods or Market rate of exchange.
Slope of Indifference Curve = Slope of Budget Line
If MRSxy > Px/Py. It means a consumer is willing to give up more amount of good than what actually he has to give up. So he is in gain therefore he will increase his consumption.If MRSxy < Px/Py. It means a consumer is willing to give up less amount of good than what actually he has to give up. So he is in loss therefore he will reduce his consumption.
(ii) MRSxy must be diminishing : It means indifference curve is convex to origin.If MRSxy is rising IC will be concave and if MRSxy is constant IC will be straight line. In both the condition equilibrium cannot be determined.*Extra Explaination : Why does MRSxy diminishes along indifference curve ?It means MRSxy falls as consumer increase the consumption of one good (X) he derives less and less satisfaction. So for less satisfaction he gives up less and less amount of other good (Y).Following schedule shows that when consumption of Good X increases MRSxy is falling.
Good X Good Y MRSxy
1 20 -
2 10 10
3 5 5
4 2 3
5 1 1
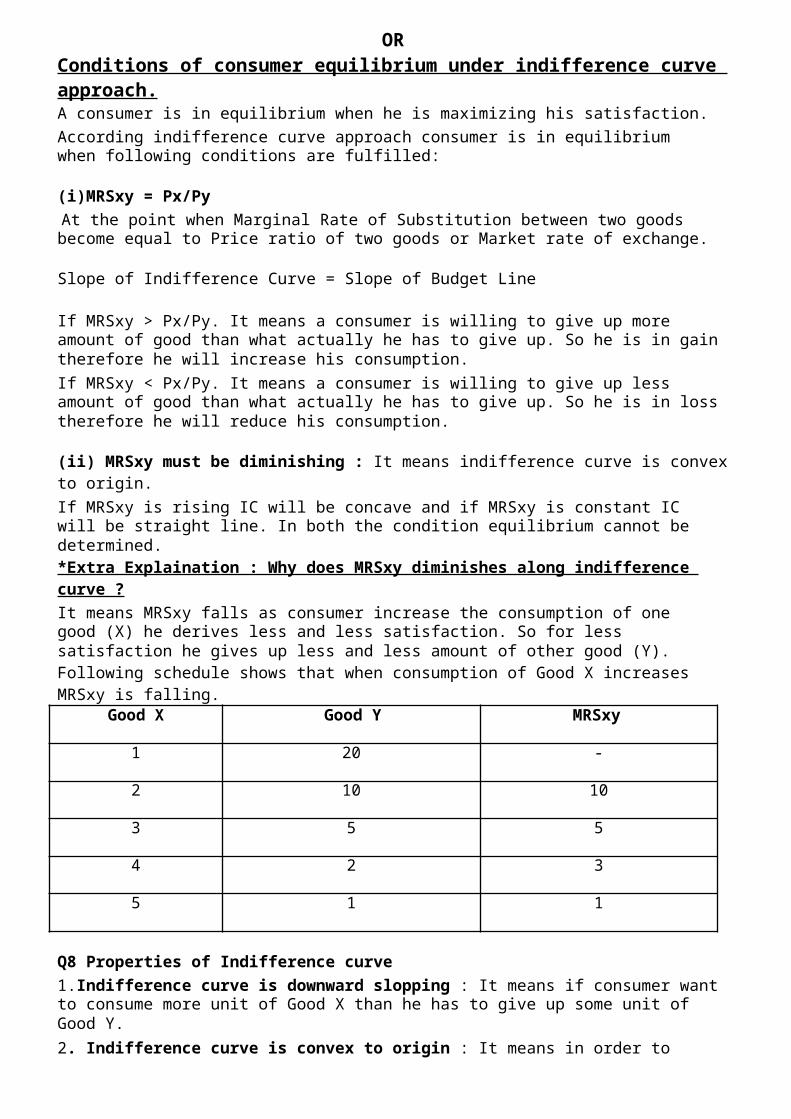
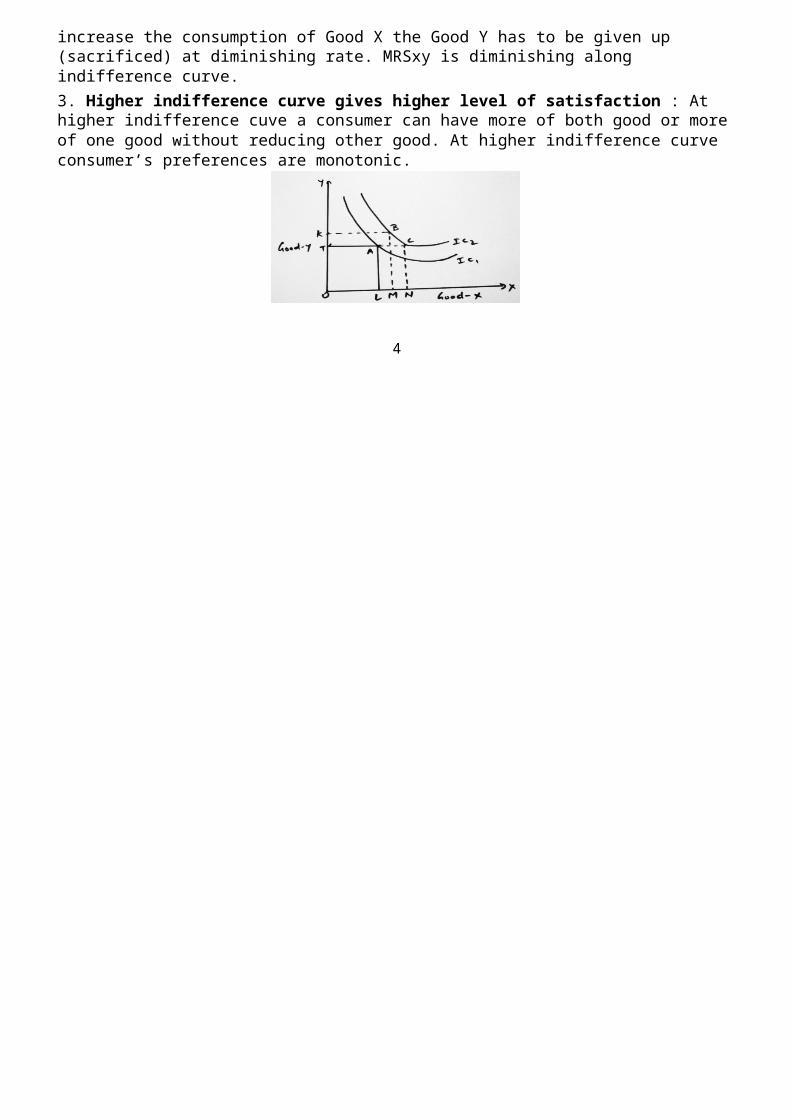
Q8 Properties of Indifference curve1.Indifference curve is downward slopping : It means if consumer want to consume more unit of Good X than he has to give up some unit of Good Y.2. Indifference curve is convex to origin : It means in order to increase the consumption of Good X the Good Y has to be given up (sacrificed) at diminishing rate. MRSxy is diminishing along indifference curve.3. Higher indifference curve gives higher level of satisfaction : At higher indifference cuve a consumer can have more of both good or more of one good without reducing other good. At higher indifference curve consumer’s preferences are monotonic.
4
At point A OL and OT are available. But at B on IC2 at least more of one good and no less of other good is available.4. Two IC never intersect each other. 5. All the combinations on one IC gives same level of satisfaction.Q9 Explain Law of demand with diagram and schedule.The law of demand states that other factors are remaining constant, when price of a good falls than the demand of a good rises and vice-versa.Assumptions : Income and taste – preference of a consumer remain constant, price of related good also remain constant (other factor remaining constant). Explanation with schedule and diagram :
Price (Rs.) Qx(Units)
3 10
2 20
1 30
On ox axis quantity demanded in units and oy axis price in Rs. is given. DD is a demand curve.The demand schedule shows that when price falls from Rs. 3 to Rs. 2 than demand rises from 10 to 20 units of a commodity.Q10 Write relationship between following :
(i) Income of the buyers and demand for a good (a) Normal Goods : Goods which are having positive relation with income of a consumer.
It means when income increases demand for normal good also increases.
In the above schedule note that as the income of a consumer increases from Rs.5000 to Rs.6000 the demand of commodity also increases at the same price. For example, when income is Rs.5000 at price of Rs.2 the demand is 20 units and when income increases at the same price of Rs.2 the demand will be 25.Increase in demand is shown in diagram by rightward (forward) shift of demand curve. It shows that at same price OP the demand increases from OQ to OQ1. DD is initial demand curve and D1D1 is new demand curve.(b) Inferior Goods : Goods which are having negative relation with income of a consumer. It means when income increases demand for inferior good decreases.
In the above schedule note that as the income of a consumer increases from Rs.5000 to Rs.6000 the demand of commodity decreases at the same price. For example When income is Rs.5000 at price of Rs.2 the QD is 20 units and when income increases at the same price of Rs. 2 the QD will be 10.Decrease in demand is shown in diagram by leftward (backward) shift of demand curve. It shows that at same price OP the QD decreases from OQ to OQ1. DD is initial demand curve and D1D1 is new demand curve.
5
Q11 Write the relation between Price of other goods(related goods) and demand for the given good.Related goods are those goods when price of a good changes the demand of other good also changes. Related goods are of two types :(a) Substitute good: Substitute goods are the goods that can be used in place of each other and give the same satisfaction to a consumer. Example Tea and CoffeeWhen price of substitute good increase: When price of substitute good (coffee) increases than the demand of given good (tea) increases at same price . Because relatively become cheaper.
(b) Complementary good : Complementary are the goods that can be used together and therefore they are demanded jointly. Example Car and PetrolWhen price of Complementary goods increases: When price of Complementary good (Petrol) increases than the demand of given good (Car) decreases at same price . Because due to increase in price of petrol it is demanded less and it is used with car therefore the demand of car also decreases at same price.
Q12 Difference between Change in Quantity Demanded and Change in DemandChange in Quantity Demanded Change in Demand
1. Other factors remain constant. 1. Price remains constant.2.Two types : 2.Two types:(1)Extension of demand (1)Increase in Demand (2) Decrease in
(2)Contraction of Demand Demand3. It is represented on same demand 3.It is represented by shifting of demandcurve.(movement along a curve) curve.4.Reason : Change in price of a commodity 4.Reason : Change in other factors like
income of consumer, price of other goodetc.
5.Extension of demand : When price of a 5.Increase in demand : When income ofcommodity decrease. consumer increase than demand ofContraction of demand : When price of a normal good increases.commodity increase. Decrease in demand : When income of
consumer decreases than demand ofnormal good decreases.
6
Q13 Methods of measuring Elasticity of demand:(a) Propionates / Percentage / Flux Method of Elasticity of demand: According to this method, price elasticity of demand is measured by dividing the percentage change in quantity demanded by the percentage change in price.
= − ×
(b) Total expenditure method of Elasticity of demand: It indicates the direction in which total expenditure on commodity changes as a result of change in price of the commodity.
Px Dx TE=Px×Dx Ed1 6 6 Ed<1 P x↑ TE↑2 5 103 4 12 Ed=1 No change in TE4 3 125 2 10 Ed>1 P x↑ TE↓6 1 6
Five degrees of elasticity of demand1. Perfectly elastic demand (Ed = ∞): If quantity demanded changes and price remain constant.2.Perfectly inelastic demand (Ed = 0): If quantity demanded remain constant and price changes. 3.Unitary elastic demand(Ed =1) : If percentage change in the quantity demanded is equal to percentage change in price of the commodity.4.More elastic demand(Ed >1) : If percentage change in the quantity demanded is more than percentage change in price of the commodity.5.Less elastic demand(Ed <1) : If percentage change in the quantity demanded is less than percentage change in price of the commodity.
Q Draw a linear demand curve and show different elasticity on it.
Ans: Method for measurement of price elasticity of demand by point elasticity method :
Point elasticity (ep) = Lower segment of demand curve
Upper segment of demand curve
7
Q14 Write Factors affecting price elasticity of demand:
(i) Nature of commodity: The demand of necessary goods is less elastic. Like wheat,dal,vegetables. Demand of luxury goods is more elastic. Like Air Conditioner, Car.
(ii) Availability of substitute good: If substitute goods are available for a commodity than demand for the commodity is more elastic. Like Coca cola and pepsi. If substitute goods are not available for a commodity than demand for the commodity is less elastic. Like
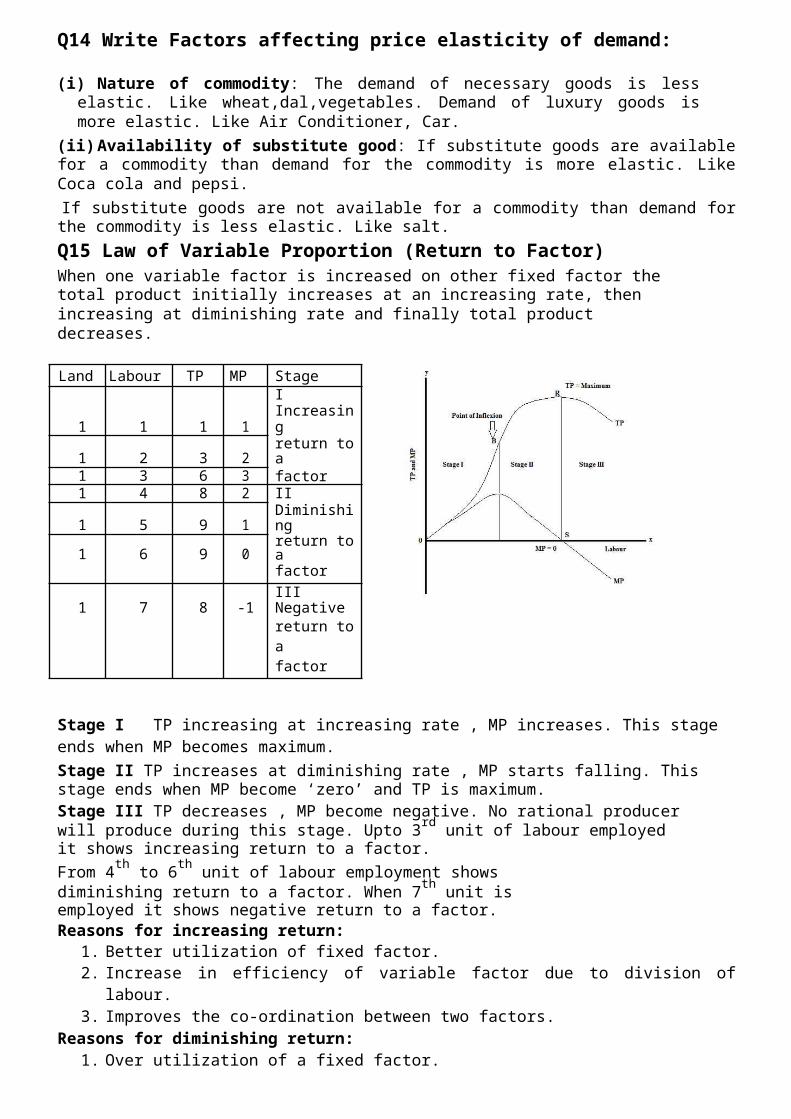
salt. Q15 Law of Variable Proportion (Return to Factor)When one variable factor is increased on other fixed factor the total product initially increases at an increasing rate, then increasing at diminishing rate and finally total product decreases.
Land Labour TP MP Stage1 1 1 1 I Increasing1 2 3 2 return to a1 3 6 3 factor1 4 8 2 II1 5 9 1 Diminishing1 6 9 0 return to a
factor1 7 8 -1 III Negative
return to afactor
Stage I TP increasing at increasing rate , MP increases. This stage ends when MP becomes maximum.Stage II TP increases at diminishing rate , MP starts falling. This stage ends when MP become ‘zero’ and TP is maximum.Stage III TP decreases , MP become negative. No rational producer will produce during this stage. Upto 3rd unit of labour employed it shows increasing return to a factor.From 4th to 6th unit of labour employment shows diminishing return to a factor. When 7th unit is employed it shows negative return to a factor.Reasons for increasing return:
1. Better utilization of fixed factor. 2. Increase in efficiency of variable factor due to division of labour. 3. Improves the co-ordination between two factors.
Reasons for diminishing return:1. Over utilization of a fixed factor. 2. Factors are imperfect substitution of each other. 3. Poor co-ordination between factors.
Q 16 Relation between TC, TFC and TVC
1. TFC is horizontal to x axis. 2. TC and TVC are S shaped (they rise initially at a decreasing rate, then at a constant rate & finally at an increasing rate) due to law of variable proportions. 3. At zero level of output TC is equal to TFC. 4. TC and TVC curves parallel to each other because TFC is constant
8
ORRelationship between AC and MC1. Both AC and MC derived from TC. 2.Both AC and MC are U shaped. 3.When AC falls MC lies below AC curve4.When AC rises MC lies above AC curve.5. MC cuts AC at its minimum where MC=AC.
ORQ Draw ATC, AVC and AFC curve on the same graph. Explain the Relationship between ATC and AVC. Do they intersect each other? Give reason in support of your answer.
Since ATC is the sum total of AFC and AVC. As output increases the AFC tends to decrease. That is whyATC & AVC comes closer to each other with the increase in output because of decrease in AFC.
Q17 Producer’s Equilibrium with the help of MC and MR Curve in perfect competition marketProducer is said to be in equilibrium when he is maximizing his profits.The producer produces a level of output where his profits are maximum. This level of output is determined where the following conditions are fulfilled ;
1. Marginal Cost becomes equal to Marginal Revenue (MC = MR) 2. Marginal Cost is increasing after equating MR
The producer is in equilibrium at ON level of output. Here MC=MR and MC rises after intersecting MR. the producer is earning profits equal to area STE. If the producer decides to produce OM level of output he would lose some profit. His profits would be equal to area SBT.
So he is not in equilibrium at OM because Area SBT < Area STEIf he decides to produce more than ON, at OK he would add more to cost and less to revenue. So he must not be maximizing his profits at OK level.At OL level of output MC = MR but afterward MC falls. This gives an incentive to producer to produce more so that he can increase his profits.Therefore the producer is in equilibrium when MC = MR and MC is rising. Hence producer is in equilibrium at ON level of output.
9

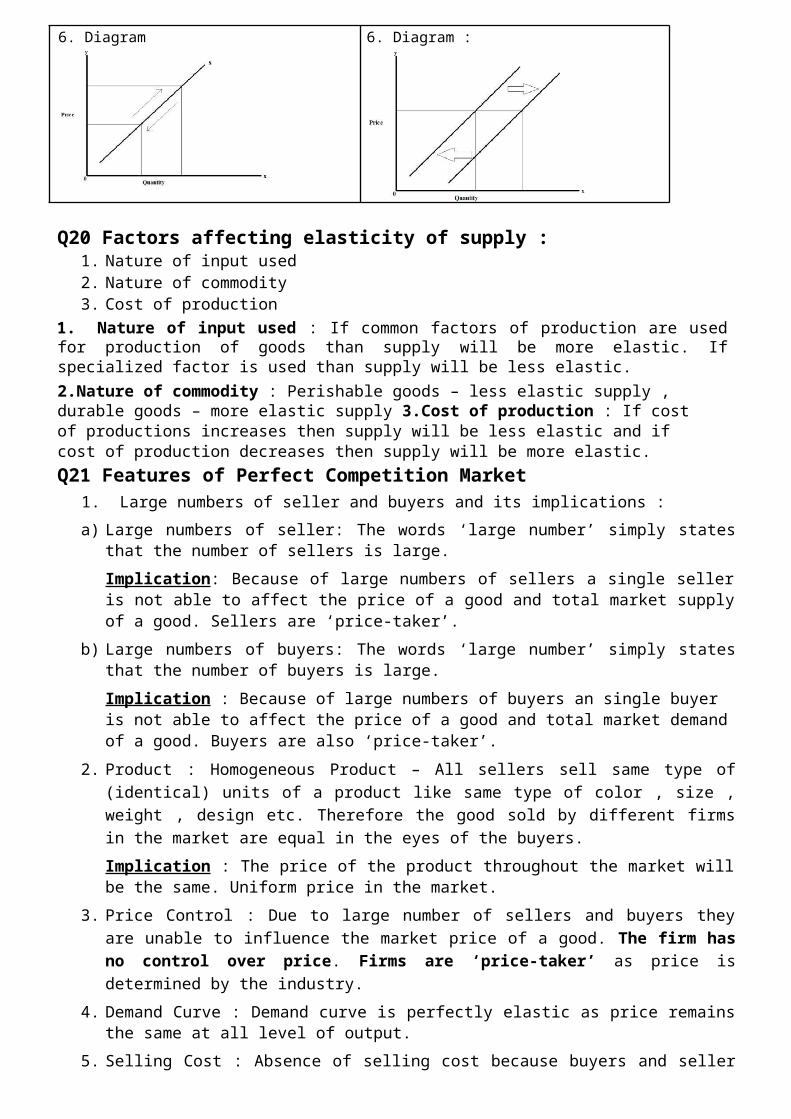
Q18 Supply of a good affected by the following factors :1. Rise in price of inputs (factors) used in production (Pf) 2. Technological improvement (T) 3. Government policy (Tax and Subsidies) (Gp)
1. Rise in price of inputs used in production : When the price of inputs used in production of a good increases, the cost of production also increases. Therefore supply of commodity decreases at constant price because production becomes less profitable.
Cost of production increases due to rise in price of inputs. Supply decreases and supply curve shifts to leftward. S’S’ in new supply curve.2. Technological improvement : Due to technological progress cost of production reduces therefore supply of commodity increases at constant price.
3. Government Policy :(a) When government reduces taxes then cost of production decreases therefore supply of commodity increases at constant price. (b) When government reduces the subsidies then cost of production increases therefore supply of commodity decreases at constant price.
Q19 Differentiate between Change in Quantity Supplied and Change in Supply
Change in Quantity Supplied Change in Supply1. Other factors remain constant. 1. Price remains constant.2.Two types : 2.Two types:(1)Extension of Supply (2)Contraction of Supply (1)Increase in Supply (2) Decrease in Supply3. It is represented on same Supply 3.It is represented by shifting of Supply curve.curve.(movement along a curve)4.Reason : Change in price of a commodity 4.Reason : Change in other factors like input
price, technological improvement, Govt. policyetc.
5.Extension of Supply : When price of a 5.Increase in Supply : When input price reducescommodity increases. supplier increase the supply of commodity.Contraction of Supply : When price of a Decrease in Supply : When input price risescommodity decreases. supplier decreases the supply of commodity.
10

6. Diagram 6. Diagram :
Q20 Factors affecting elasticity of supply :1. Nature of input used 2. Nature of commodity 3. Cost of production
1. Nature of input used : If common factors of production are used for production of goods than supply will be more elastic. If specialized factor is used than supply will be less elastic. 2.Nature of commodity : Perishable goods – less elastic supply , durable goods – more elastic supply 3.Cost of production : If cost of productions increases then supply will be less elastic and if cost of production decreases then supply will be more elastic. Q21 Features of Perfect Competition Market
1. Large numbers of seller and buyers and its implications :
a) Large numbers of seller: The words ‘large number’ simply states that the number of sellers is large.
Implication: Because of large numbers of sellers a single seller is not able to affect the price of a good and total market supply of a good. Sellers are ‘price-taker’.
b) Large numbers of buyers: The words ‘large number’ simply states that the number of buyers is large.
Implication : Because of large numbers of buyers an single buyer is not able to affect the price of a good and total market demand of a good. Buyers are also ‘price-taker’.
2. Product : Homogeneous Product – All sellers sell same type of (identical) units of a product like same type of color , size , weight , design etc. Therefore the good sold by different firms in the market are equal in the eyes of the buyers.
Implication : The price of the product throughout the market will be the same. Uniform price in the market.
3. Price Control : Due to large number of sellers and buyers they are unable to influence the market price of a good. The firm has no control over price. Firms are ‘price-taker’ as price is determined by the industry.
4. Demand Curve : Demand curve is perfectly elastic as price remains the same at all level of output.
5. Selling Cost : Absence of selling cost because buyers and seller have perfect knowledge about the market.
6. Entry or Exit : Any firm can freely enter or exit from this kind of market. 7. Profit : AR = AC in long run , therefore firm earns normal profit in long run.
Q22 Features of Monopoly Market1. Single seller and large number of buyers : One seller selling a product which has no close
substitute.11

2. Product : There is no close substitute of the product. Therefore , there is no competition form new and existing products.
3. Price Control : The firm has full control over price because there is only one seller in the market. The firm is a ‘price-marker’ because the firm decides the price of a product.
4. Demand Curve : Downward sloping Inelastic demand curve due to absence of close substitute.
5. Selling Cost : Selling costs are incurred to inform the buyers about product due to lack of perfect knowledge.
6. Entry or Exit : There are some restrictions on the entry of new firms into monopoly industry. There are patent rights or exclusive control over a technique or raw material.
7. Profit : AR > AC in long run , therefore firm earns abnormal profit in long run. Q23 Features of Monopolistic Market
1. Many sellers and Large numbers of buyers : Under monopolistic market many sellers are there in a market. The size of each firm is small. Each firm has limited share supply of good in the market.
2. Product : The unique feature of monopolistic market is product differentiation. In this market the number of firms are many but their product differ from one another in color, shape , size , packing , fragrance , brand etc. Eg. Tea , soap , Implication : Because of product differentiation each firm can decide the price of its product. The firm has partial control over price of its product.
3. Price control : Because of product differentiation each firm can decide the price of its product. Firm is neither a price-taker nor a price-maker but firm has partial control over price due to product differentiation
4. Demand Curve : Downward sloping Elastic demand curve due to presence of close substitute. 5. Selling cost : Heavy selling costs are incurred on sales promotions. Eg. Advertisement on
T.V. , hoardings etc. 6. Entry or Exit : Although there is freedom of entry and exit but it is possible only for a competitive
firm to enter or leave the industry. 7. Profit : AR = AC in long run , therefore firm earns normal profit in long run.
Q24 Features of Oligopoly Market1. Few Firms : Oligopolists are often large firms , each firm producing a significant portion of total
market supply. There are only few rival firms. Eg. Car
2. Mutual interdependence : There is a high degree of interdependence between the firms. Price and Output policy of one firm significantly impacts the price and output policy of the rival firms in the market.
For example : If maruti motors reduces price of its cars , tata motors may also do the same. If mauti motors raise the price but it is possible that tata motors will not do the same. It will lead loss to maruti motors.
Firms try to avoid price competition due to the fear of price war. They prefer non-price competition instead of price competition.
3. Price Control : Firms are mutually interdependent to determine the price of product.
4. Demand Curve : It is not possible to determine firm’s demand curve under oligopoly. Simply because it is not possible to predict change in price. When a firm lowers its price , demand for its product may not increase because rival firms may also lower the price.
5. Selling Cost : Due to severe competition and interdependence of the firms, various sales promotion technique are used.
12

For example, T.V. advertisements between Pepsi and Coca cola. It depends more on non-price competition.
6. Entry and Exit : Patents , large capital investment , Cartel , threat of competition , control over crucial raw material etc. prevent new firms from entering into industry.
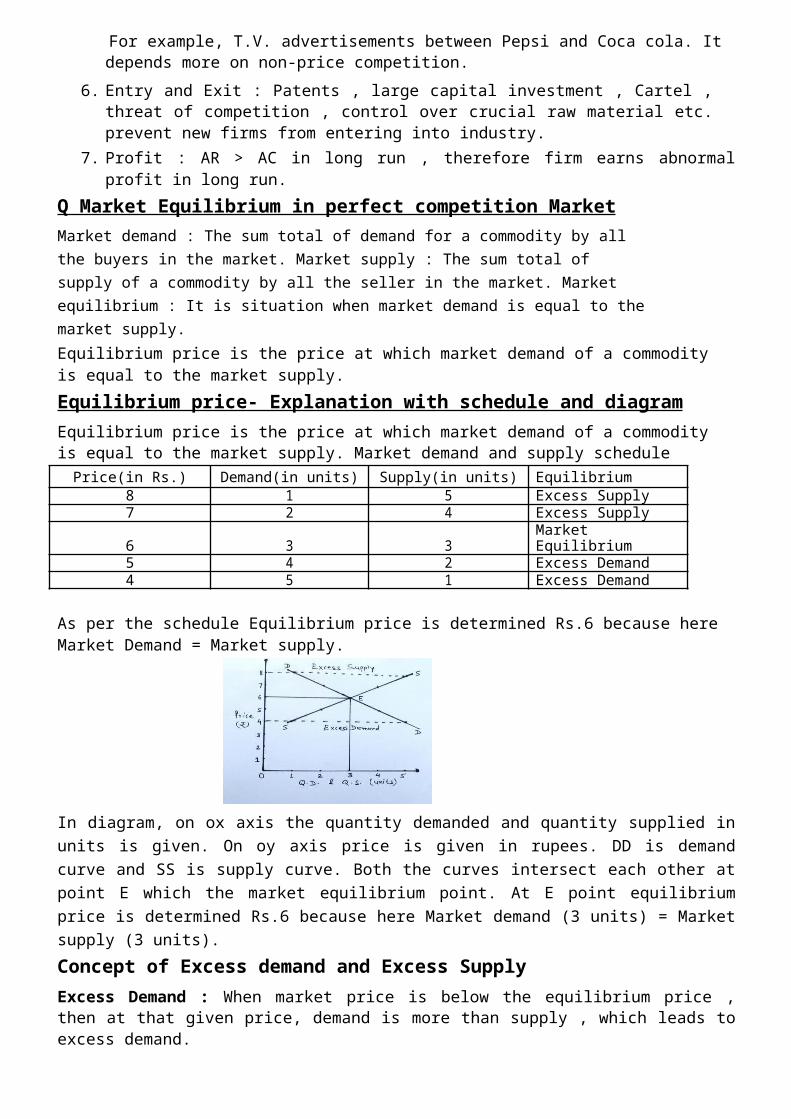
7. Profit : AR > AC in long run , therefore firm earns abnormal profit in long run. Q Market Equilibrium in perfect competition MarketMarket demand : The sum total of demand for a commodity by all the buyers in the market. Market supply : The sum total of supply of a commodity by all the seller in the market. Market equilibrium : It is situation when market demand is equal to the market supply.Equilibrium price is the price at which market demand of a commodity is equal to the market supply.Equilibrium price- Explanation with schedule and diagramEquilibrium price is the price at which market demand of a commodity is equal to the market supply. Market demand and supply schedule
Price(in Rs.) Demand(in units) Supply(in units) Equilibrium8 1 5 Excess Supply7 2 4 Excess Supply6 3 3 Market Equilibrium5 4 2 Excess Demand4 5 1 Excess Demand
As per the schedule Equilibrium price is determined Rs.6 because here Market Demand = Market supply.
In diagram, on ox axis the quantity demanded and quantity supplied in units is given. On oy axis price is given in rupees. DD is demand curve and SS is supply curve. Both the curves intersect each other at point E which the market equilibrium point. At E point equilibrium price is determined Rs.6 because here Market demand (3 units) = Market supply (3 units).Concept of Excess demand and Excess SupplyExcess Demand : When market price is below the equilibrium price , then at that given price, demand is more than supply , which leads to excess demand.
Excess Supply : When market price is above the equilibrium price , then at that given price , supply is more than demand , which leads to excess supply.
Q25 Market for a good is in equilibrium. The demand of good ‘increases’. Explain the chain of effect of this change.
In diagram, on ox axis the quantity demanded and quantity supplied in units is given. On oy axis price is given in rupees. DD is demand curve and SS is supply curve. Both the curves intersect each other at point E which the market equilibrium point.
13

As per the given condition the supply remains unchanged and due to ‘increase’ in demand ,the demand curve shifts rightward from DD to D’D’. The new demand curve D’D’ intersect supply curve SS at point E’. At this point E’ , the Equilibrium Price increases from OP to OP’ and the Equilibrium Quantity increases from OQ to OQ’The chain of effect of this change‘Increase’ in demand at old equilibrium point E shows Demand > Supply. Therefore price rises.When price rises : Demand contracts ( reduces) and Supply extends (rises).
This process of contraction of demand and extension of supply will continue till New Equilibrium point E’ is achieved.(D=E , E , D>S , P ↑ , demand contracts , supply extends , D’=S , E’)
Q26 Market for a good is in equilibrium, what are the effects of simultaneous ‘increase’ in both in demand and supply of that good on its equilibrium price and quantity.
In diagram, on ox axis the quantity demanded and quantity supplied in units is given. On oy axis price is given in rupees. DD is demand curve and SS is supply curve. Both the curves intersect each other at point E which the market equilibrium point
.
Due to increase in demand , new demand curve is D’D’ and new supply curve is S’S’ which intersect each other at new equilibrium point E’
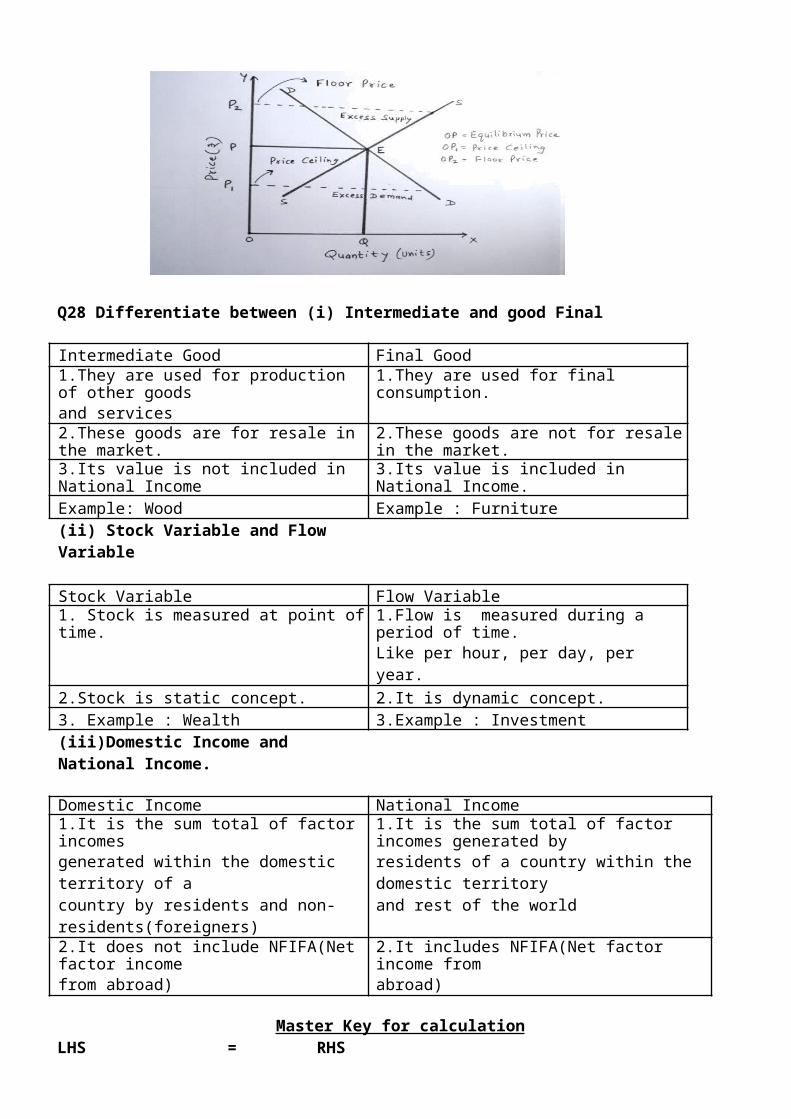
At this point E’ , the Equilibrium Price remains constant(same) from OP and the Equilibrium Quantity increases from OQ to OQ’.Price remains constant because : increase in market demand = increase in market supply.Q27 Explain price ceiling and floor price.What is ‘Price Ceiling’ ? Why it is needed ? (Price ceiling/maximum price/price control)Price ceiling or Maximum price is a rule (Law) which holds the market price below the equilibrium price. Examples : price of sugar , wheat , rice , fuel etc.This policy helps the poor or middle class people to purchase the necessary goods at lower price.What is ‘Floor Price’ ? Why it is needed ? (Floor price/minimum price/support price/MSP)Floor price or minimum price is a rule (Law) which holds the market price above the equilibrium price. Examples : Price of sugarcane, cotton , wheat , rice etc.This policy helps the farmer to sell whatever they produce and guarantee them minimum income.
14

Q28 Differentiate between (i) Intermediate and good Final
Intermediate Good Final Good1.They are used for production of other goods 1.They are used for final consumption.and services2.These goods are for resale in the market. 2.These goods are not for resale in the market.3.Its value is not included in National Income 3.Its value is included in National Income.Example: Wood Example : Furniture
(ii) Stock Variable and Flow Variable
Stock Variable Flow Variable1. Stock is measured at point of time. 1.Flow is measured during a period of time.
Like per hour, per day, per year.2.Stock is static concept. 2.It is dynamic concept.3. Example : Wealth 3.Example : Investment
(iii)Domestic Income and National Income.
Domestic Income National Income1.It is the sum total of factor incomes 1.It is the sum total of factor incomes generated bygenerated within the domestic territory of a residents of a country within the domestic territorycountry by residents and non- and rest of the worldresidents(foreigners)2.It does not include NFIFA(Net factor income 2.It includes NFIFA(Net factor income fromfrom abroad) abroad)
Master Key for calculationLHS = RHS(To be determined) = (Given)Gross = Net + DepreciationNET = Gross - DepNational Income = Domestic Income + NFIFADomestic Income = National Income - NFIFAMarket Price = Factor Cost + NITFactor Cost = Market Price - NIT
15
Three methods of calculation of national incomeI - Product Method (Value added method):The first stepGVAmp= Value of Output – Intermediate consumptionValue of output= Sales + Change in stock # Change in stock = (closing stock – opening stock) The sum of values of GVAmp of all the firms in the economy is GDPmpNNP Fc (N.I) = GDPmp - Consumption of Fixed Capital/Depreciation+ NFIFAII Income method:The first step is to determine NDPfcNDPfc = Comp. of Emp. + Operating Surplus + Mixed Income1. Compensation of Employees(Wages and Salaries+ Employer contribution to social security scheme) 2. Operating Surplus (Rent and royalty + Interest + Profit) (Profit = Corporate Tax + undistributed profit + Dividends
NNPfc = NDPfc + NFIFA
III Expenditure MethodThe first step to determine GDPmp,GDPmp=Private Final Consumption Expenditure + Government Final Consumption Expenditure + Gross Domestic Capital Formation + Net ExportGDCF= NDCF+DepreciationGDCF =Gross Domestic Fixed Capital Formation + Change in Stock GDCF= Net Domestic Fixed Capital Formation + Dep. + Change in StockGDCF= Gross business fixed investment+Gross residential construction+Gross Public investment +Change in StockNNPfc=GDPmp – Dep. + NFIFA - NIT OrNNPfc=GDPmp – Dep. - NFITA - NIT
= Private final consumption expenditure + Govt. final consumption expenditure + Netdomestic capital formation + Net Exports(This formula may be directly used when Net domestic capital formation is given Or CFC is not given) Here,Net Factor Income From Abroad (NFIFA) = FIFA - FITANet Indirect Tax (NIT) = Indirect Tax - SubsidyNet Exports = Exports - ImportsFormulas for other calculations
Private Income = NDPfc to private sector + NFIFA + Current transfer from government+ Net current transfer from abroad + Interest on National Debt
NDPfc to private sector = NDPfc -NDP fc accruing to government sector
*NDP fc accruing to government sector= Income from property and enterprises to the government + saving of non- departmental enterprises
NDPfc to private sector = NDPfc – Income from property and enterprises to the government – Saving of non- departmental enterprisesPersonal Income = Private Income – Corporate Tax – Corporate Savings (undistributed profit)*Corporate savings or undistributed profit or Net retained earnings of private corporate sector or savings of private sector enterprises may be givenPersonal Disposable Income = Personal Income – Direct Taxes paid by household – Miscellaneous receipts
16
NDPMP

GNDI and NNDIGross National Disposable Income = GNPmp + Net current transfer from rest of the (Main formula)
= GNPfc + NIT+ Net current transfer from rest of the world = GDPfc + NFIFA +NIT+ Net current transfer from rest of the world
Net National Disposable Income = NNPmp + Net current transfer from rest of the world (Main)= NNPfc + NIT+ Net current transfer from rest of the world = NDPfc + NFIFA +NIT+ Net current transfer from rest of the world
Formula of GNP DeflatorGNP Deflator measures the average level of prices of all goods and services that makes GNP. GNP Deflator = Nominal GNP(GNP at current price) X 100
Real GNP(GNP at constant price)
Q29 Explain the problem of double counting. How can we avoid it ?Double counting means counting the value of goods and services more than once in the estimation of national income. This problem arises when we consider output of firms are final output therefore we are counting the value of goods at every stage of production more than one time.But it is the fact that output of one firm may be the input for other firm. It can be avoided by following ways :
1. Taking Value Addition method in the calculation of the National income. 2. Taking the value of final goods only while calculating national income.
Q30 How ‘non-monetary exchange’ and ‘externalities’ are a limitation in taking GDP as an index of welfare?GDP is considered as an index of welfare of the people. Increase in GDP means increase in the level of welfare of the people. But some time it not true that Increase in GDP means increase in the level of welfare as given in the following context:1.Non-monetary exchange : In India, the barter system of exchange is existing in the rural areas where commodities are exchanged for commodities. Payments are made in kind instead of cash. Such transactions are not recorded when we are calculating GDP therefore GDP remains underestimated, it loses the importance as an index of welfare.2.Externalities :Externalities refers to good and bad impact of an economic activity.Positive externalities : When a beautiful garden maintained by one person will raises the welfare of other person who is not paying for it. The value of welfare is not included in the estimation of GDP.3.Negative externalities : Smoke released by factory causes air pollution. People of that locality have to suffer by diseases like asthma which causes the loss of social welfare. But nobody is penalized for it and there is no valuation of it in the estimation of GDP.Therefore GDP as an index of welfare is not a perfect index because it underestimates the level of welfare.Q31 Problem of double coincidence of wants faced under barter system. How has money solved it ?Double coincidence of wants is a pre-conditions for the barter system of exchange.Double coincidence of wants implies that goods in possession of two different individuals are needed by each other. But it is not always so simple. It is not so simple to find a person who wants your Wheat and at the same time possesses Rice that you want to buy.Accordingly, under the barter system , exchange remained extremely limited. Money as a medium of exchange solved this problem of double coincidence of wants.
17

Q32 Explain any one functions of money :(1) Medium of exchange : It means that money act as a medium for the sale and purchase of goods and services. In the absence of money goods were exchanged for goods. Use of money as medium of exchange has removed the major difficulty of ‘double coincidence of wants’ of the barter system.Exchange is now become much simpler. It save lot of time and labour. Seller and consumer can sell or purchase the goods and services whenever they desire. It facilitate multilateral trade and gives the economic freedom to the people.
2) Measure of value OR Unit of value : It means each goods and services is measured by money. Measurement of value of any commodity is difficult in barter system. Introduction of money has removed this difficulty. Now each good is value in term of money. Price of car , house , computer , mobile are expressed in term of money.By money we are able to construct development plans, we can calculate cost , revenue , profit , national income , PCI etc.
3)Store of value : Store of value means storing of purchasing power for future use. Individual s try to save a part of their income for their future requirement.It was not possible to store value in barter system. In barter system purchasing power was stored in form of goods or livestock. Goods might depreciate and livestock may die.
4) Standard deferred payment : Deferred payment refers to those payments which are made sometimes in the future. Payment of loans also refers to the deferred payments.When we borrow money from somebody, we have to return both the principal as well as interest amount. It is difficult to make such transactions in term of goods and services.
Q33 Explain th process of Credit Creation of Commercial BankCredit creation is a process of creating new deposits from initial deposits.This process depends on amount of Initial Deposits and Legal Reserve Ratio(LRR). Money Multiplier = 1 ÷ LRRIf LRR = 20% than Money Multiplier will be 5 and
Deposit Creation by Commercial BanksRound Deposits (Rs.) Loans (Rs.) Cash Reserves
(LRR=20%)Initial 100 80 20
Round I 80 64 16Round II 64 51.20 12.80
-- -- -- ---- -- -- --
Total 500 400 100As per above schedule suppose the initial deposit in bank is Rs.100 and the LRR is 20% than banks can keep Rs.20 as cash reserve and remaining Rs.80 can give as a loan.Those who receive these Cheques will deposit the cheques in their account. The deposits will increases by Rs.80 with banks.The LRR is 20% therefore banks can keep Rs.16 as cash reserve and remaining Rs.64 can give as a loan. The process of deposit creation comes to an end when : Total of LRR = Initial DepositMoney Multiplier = 5 (MM = 1 ÷ LRR , MM= 1÷20% = 5)Money Creation(New Deposits) = Rs.500 (MC = Initial Deposit ÷LRR)
18

Q34 Explain any one functions of Central Bank (RBI) :Central bank : It is the apex institution of a country’s monetary system.(1) Banker to the Government : Central Bank is a Banker, Agent and Financial Advisor to the Government. As an Agent to the Government it buys and sells securities on behalf of the Government. As an Advisor to the Government it helps the Government in making policies to regulate money market. Central Bank also has responsibility of managing the public debt.2) Banker’s Bank : As the Banker to the bank the Central Bank holds a part of the cash reserves of banks and give them short term loan. The banks have to deposit a fix ratio of their total deposits with the Central Bank. The purpose of this policy is to control the supply of money in the market. The Central Bank keeps changing CRR , SLR , and Repo Rate to maintain stability in the money market. 3) Lender of the last resort : Many times Commercial banks create liabilities more than their cash reserve. Sometimes when bank suffer the crises of money and fails to meet their financial requirements they approach to Central Bank. 4) Bank of issue : The Central Bank is the sole authority for the issue of currency in the country. All the currency issued by the Central Bank is its monetary liability.
Q35 Write any one measures of credit control by RBI1) Bank Rate: The rate of interest at which the Central Bank gives loan to commercial banks.On the basis of bank rate commercial banks determine the rate of interest on loan which is required by borrower. Bank rate affects the demand for loan (credit) by customer.If bank rate is High than demand for loan reduces by customers therefore supply of money decreases in the market. This policy is used by Central bank when there is Excess demand in the economy2) CRR(Cash Reserve Ratio) : It refers to the minimum percentage of a bank’s total deposits that commercial bank have to keep with central bank.This CRR is fixed by Central Bank. It changes time to time to control the supply of money in the market. CRR specifies the maximum limit of loan that commercial banks are able to give to their customers.
CRR is decreased to increase the supply of money in the market during the situation of Deficient demand in the economy. Now the bank has more money with them to give more amount of loan to their customer.3) SLR(Statutory Liquidity Ratio) : It refers to the minimum percentage of a bank’s total deposits that commercial bank have to keep with themselves in the form of cash or liquid assest. SLR is decreased to increase the supply of money in the market during the situation of Deficient demand in the economy. Now the bank has more money with them to give more amount of loan to their customer. 4) Open market operations : Open market operation means buying and selling of government securities by Reserve Bank of India in open market. Buying and selling of securities by Central Bank affect the supply of money in the market. Buying of securities by the Central Bank increases the supply of money in the economy. Selling of securities by the Central Bank decreases the supply of money in the economy. During the situation of Deficient Demand the Central Bank buys securities. Selling of securities leads to decrease in the supply of money with Public and Commercial Banks. 5) Margin requirement : It is the difference between value of securities and the loan granted by the bank against this security. Example : When MR = 20% If a person produces securities of Rs.1,0000 to bank than bank gives him loan of Rs.80,000 This MR is fixed by Central Bank. It changes time to time to control the supply of money in the market. MR specifies the maximum limit of loan that commercial banks are able to give to their customers.
19

Q36 Consumption function with the help of schedule and diagramConsumption Function : The functional relationship between consumption and income.
C= f (Y)Psychological Law of consumption: It states that when income increases consumption also increases but the rate of increase in consumption is less the rate of increase in income.Autonomous consumption (C): It denotes the level of consumption at ‘zero’ level of income.
Y (in Rs.) C (in Rs.)0 50
100 100200 150300 200400 250500 300
ORQ Explain the saving function with the help of schedule and diagram.Saving Function : The functional relationship between saving and income.
S= f (Y)Autonomous consumption ( - C ): It denotes the level of saving at ‘zero’ level of income.
Y (in Rs) C (in Rs) S (in Rs)Y = C+S C = Y – S S = Y – C
0 50 -50100 100 0200 150 50300 200 100400 250 150500 300 200
Explanation :(1) S = Rs.-50 when Y = 0. This is because C = Rs.50 when Y = 0. (2) S increases when Y increases. S and Y are positively related. (3) S is never greater than Y it is always remain lower than Y. Algebraic Presentation C = - C + (1-b)Y - C = autonomous saving(1-b) = MPS = △ S △Y
(1-b) denotes the change in saving due to change in income. Y refers to incomeWe can calculate S corresponding to different value of Y
20

Q37 Explain the determination of Income/Output/Employment by AD and AS approach. Including the situation of AD>AS and AS>AD.The equilibrium level of income is determined at a point when AD=AS OR S=I
On ‘X’ axis, we mention national income / output / employment (AS) On ‘Y’ axis, we mention aggregate demand (AD)AS is represented by 45 degree line. This line helps to compare X-axis with Y-axis. Both the axis are equidistance from 45 degree line.AD and AS curve intersect at point E.At ON level of output, Economy is in equilibrium because at this level AD = ASAt OL level of output , AD > AS , It means aggregate demand is more than aggregate supplyAD curve lies above AS curve.Household and firms are consuming more than what economy producing. Expenditure > Income. This will result in shortage of goods with the firms.The firm will respond to this situation by producing more output therefore employment also rises which increases income till AD = AS. At this level economy will be in equilibrium.At OM level of output , AS > AD , It means aggregate supply is more than aggregate demandHousehold and firms are consuming less than what economy producing. Income > Expenditure. This will result in unwanted unsold stock of goods with the firms.The firm will respond to this situation by reducing output therefore employment also reduces which decreases income till AD= AS. At this level economy again will be in equilibrium.
Q38 Explain the determination of Income/Output/Employment by S and I approach. Including the situation of S>I and S<I.The equilibrium level of income is determined at a point when S=I OR AD=AS AD = AS C + I = C + S I = S
21
On ‘X’ axis, we mention national income / output / employment On ‘Y’ axis, we mention Saving and InvestmentS and I curve intersect at point E.At ON level of output, Economy is in equilibrium because at this level S = IAt OL level of output , I > S , It means Investment is more than Saving I curve lies above S curve. Firms want to invest more but the saving is less. It means consuming more.This will result in shortage of goods with the firms.The firm will respond to this situation by producing more output therefore employment also rises which increases income hence saving also increases till S = I. At this level economy will be in equilibrium. At OM level of output , S > I , It means Saving is more than Investment S curve lies above I curve. Firms want to invest less but the saving is more. It means consuming less.This will result in unwanted unsold stock of goods with the firms.The firm will respond to this situation by reducing output therefore employment also reduces which decreases the income hence saving also decreases till S = I. At this level economy will be in equilibrium.Q39 Explain Deflationary gapDeflationary gap is the difference between the planned demand which is required to maintain full employment level of output and actual demand. Deficient Demand is the level of demand which is less than the required demand for full employment level of output.(It may be defined as an excess of aggregate supply over aggregate demand at the full employment level.) The deflationary gap results in the decrease in general price level. It indicates the economy that how much investment is to be increased to attain planned (desired) level of aggregate demand.
Deflationary gap occurs when people spend less money than the income generated. This results in unwanted and unplanned increase in inventories of producers. They will decrease their production or output. The economy will be on new equilibrium point G showing under employment. Earlier the economy was operating at full employment level of output (OYF). The deflationary gap is shown by EF.Measures of correction of Deflationary Gap :
a. The RBI decreases the Bank Rate, CRR, SLR, Margin requirement and buy securities from open market.
b. The Government should increase its expenditure on public programme and decreases the taxes. Q40 Explain Inflationary gap. Inflationary gap is the difference between planned demand which is required to maintain full employment level of output and actual demand.. Excess Demand is the level of demand which is more than the required demand for full employment level of output. It indicates the economy that how much investment is to be decreased to attain planned (desired) level of aggregate demand.(It may be defined as an excess of aggregate demand over aggregate supply at the full employment level). The inflationary gap results in the rise in general price level which is called inflation.
Inflationary gap occurs when people spend more money than the income generated. This results in unwanted and unplanned decrease in inventories of producers. They want to raise their production but cannot as the economy is already operating at full employment level of output (OYF). This results in inflationary gap (EF).
22

Measures of correction of Inflationary Gap :a. The RBI increases the Bank Rate, CRR, SLR, Margin requirement and sell securities from open
market. b. The Government should decrease its expenditure on public programme and increases the taxes.
Q41 (i) Outline the steps required to be taken in deriving consumption curve from the saving curve. Use diagram.Saving curve SS is given
Take oa = os on y-axisThe starting point of Consumption curve is point ‘a’Draw a 45 degree line from point of originDraw a perpendicular from point B given on ox –axis, till it intersect 45 degree line at E { at point B saving = zero}Join a and E by straight line and extend the same to get Consumption Curve.(ii) Outline the steps required to be taken in deriving saving curve from the consumption curve. Use diagram.Consumption curve CC is given
Take os = oa -y axisThe starting point of Saving curve is point ‘s’Draw a 45 degree line from point of origin it will intersect given CC at point EDraw a perpendicular form point E to ox-axis which cuts x-axis at point BJoin s and B by straight line and extend the same to get Saving Curve.
23

Q42 Write any one objective of Government budget:
1.Re-distribution of Income : To reduce inequality of income redistribution of income is one of the major objective of government budget to promote inclusive growth(includes all sections of the society). Through taxes on the income of rich people their purchasing power is reduced and through expenditure on subsidies, unemployment allowances , old age pension etc. Purchasing power of poor people can be increased. As a result the gap between rich and poor is minimized.
2.Re-allocation of resource : Sometimes demand and supply forces fails to allocate resources efficiently. Budget helps to re allocate the resources. For the welfare of the society government has to allocate resources for the development of roads, dams, education, health energy generation etc. Private sector will allocate their resource where is high profit at low cost. Production of harmful goods like liquor , cigarette can be discouraged through heavy taxation and production of welfare / useful goods like milk, food, khadi can be encouraged through subsidies.
3.Economic Stability : It means absence of fluctuations in prices. Economic stability encourage the investment and increase the growth rate of economy. Through expenditure and revenue policy the government maintains the economic stability.During Deflation / Deficient demand, taxes and public borrowings are reduced while government expenditure is increased to increase the purchasing power of the people.
Q43 Difference between (i) Capital Expenditure and Revenue Expenditure (ii) Capital Receipt and Revenue Receipt (iii)Capital Expenditure Revenue Expenditure1.It create assets for the government. 1.It do not create assets for the government.Eg. Construction of roads, dams, school Eg. Student’s scholarship,Old agebuildings pensions,subsidies2.It reduce liability of the government. 2.It do not reduce liability of the government.Eg. Repayment of loan Eg. Interest payment on loan.
Capital Receipt Revenue Receipt1.It create liability for the government. 1.It do not create liability for the government.Eg. Loan by the government Eg. Income Tax2.It reduce assets of the government. 2.It do not reduce assets of the government.Eg. Selling of the government property, selling Eg. Income Taxof the shares of Hindustan Petrolium.
Direct Taxes Indirect Taxes1.The burden of direct tax cannot be shifted. 1.The burden of indirect tax can be shifted.2.Imposition and incidence lies on the same 2.Imposition and incidence lie on differentperson person3.Imposed on income and wealth of people. 3.Imposed on goods and services.Eg. Income tax , wealth tax Eg. Sales tax, Service tax4.It is progressive in nature 4.It is regressive in nature.
24

Q44 Explain fiscal , revenue and primary deficit and its implications.
(1)What is fiscal deficit ? Explain its implications.Fiscal deficit is the excess of total expenditure over total receipts other than borrowingFiscal deficit = Total budget expenditure(RE + CE) – Total budget receipts (RR + CR other than borrowing)Fiscal deficit indicates how much total borrowing required by the government (from RBI ,Abroad,Home). It shows government’s dependence on borrowing. When the government borrowing increases ,its liability also increases to repay the loan with interest.Implications of fiscal deficit :
1. Causes inflation : Government borrowing includes borrowing from RBI. To meet the deficit requirement of the government sometime RBI prints the new currency which increases the supply of money in the market. When supply of money increases in the market than demand of goods and services also increases, this causes rise in the prices of goods and services.
2. Increase in Foreign dependence : Government borrowing includes borrowing from Abroad. It increase our dependence on other countries. Lender country will interfere and influence our political and economic policies. It increases our economic slavery.
3. Financial burden on future generation : Government borrowing includes borrowing form general public. The future generation has to repay the loan and mounting interest.This repayment of loan and interest consumes our national income hence our GDP growth and investment remains low.
(2) What is Revenue Deficit ? Explain its implications. Revenue deficit is the excess of revenue expenditure over revenue receipts.Revenue deficit = Revenue Expenditure(RE) – Revenue Receipts(RR)
Implications of revenue deficit :1. Hardship for the poor people :Government has to reduce the revenue expenditure like subsidies,
student’s scholarship ,old pension. It causes difficulty to people with low income group. 2. Causes fiscal deficit : Government has to borrow from RBI, Abroad and general public to meet the
consumption needs. It causes fiscal deficit. 3. Disinvestment : To meet the deficit requirement of the government sometime government has to
sell public properties to private enterprises.
(3)What is primary deficit ? Explain its implication.Primary deficit is equal to the Fiscal deficit minus Interest payments.Primary Deficit = Fiscal Deficit - Interest Payment
If Primary deficit is zero, means FD = IP
Q45 Difference between (i) Balance of Payment and Balance of Trade (ii) current account and capital account of BOP accountBalance of Trade Balance of Payment1.It is the difference between value of exports 1. It is the systematic record of all the transactionand imports of goods. between reporting country with the rest of
world.2.It records only visible items. 2.It records visible , invisible , capital transfers,
investment , borrowing etc.3.It is a narrow concept. 3.It is a wider concept.4.It can be in a deficit , surplus or balanced. 4. It is always in balanced.5.It is not a true indicator of economic relations 5. It is a true indicator of economic relations withwith other countries. other countries
25
Basis Current Account Capital AccountMeaning The current account records Capital account is that account which records
imports and exports of goods and all such transactions between residents of aservices and unilateral transfers. country and rest of the world which causes a
change in the assets or liability status of theresidents of a country or its government.
Component 1)Balance of trade(visible trade) 1)Borrowing from abroad & lending to abroad2)Balance of services(invisible trade) 2)Investment to & from abroad3)Unilateral transfers a)Foreign Direct Investment
b)Portfolio Investment3)Change in Foreign Exchange Reserves
Deficit A deficit in current account shows A deficit in capital account shows that thethat the outflow of foreign outflow of foreign currencies due to purchasecurrencies due to Imports are more of assets abroad by home country are morethan inflow of foreign currencies than inflow of foreign currencies due todue to Exports purchase of a assets by foreign country in
home countryExample Goods like computers , steel etc. Purchase of house, land, shares in abroad
and services like banking , insurance
Q46 (i) autonomous and accommodating transactions of BOP account and (ii)devaluation and depreciationAutonomous Items Accommodating Items1.It refers to those international economic 1.It refers to the transactions that aretransactions, which take place due to some undertaken to cover deficit or surplus ineconomic motive such as profit maximization. autonomous transactions.2.Autonomous transactions are independent of 2.Accomodating transactions are undertaken tothe state of BOP account. maintain the balance in BOP account.*3.Autonomous transactions take place on both 3.Accomodating transactions take place only oncurrent and capital accounts. capital account.4.These items are also known as ‘above the line 4.These items are also known as ‘below the lineitems’. items’.
*( If there is current a/c deficit in the BOP thenit is settled by capital inflow from abroad)
Devaluation Depreciation1.It means reduction in price of domestic 1.It means fall in market price of domesticcurrency in terms of foreign currency. currency in terms of foreign currency.2.It take place due to Government. 2.It take place due to market forces of demand
and supply of foreign currency.3.It take place under fixed exchange rate 3.It take place under flexible exchange ratesystem. system.Q 47Explain the effect of depreciation domestic currency on exports.Depreciation of domestic currency means rise in the price of foreign currency (or fall in the price of domestic currency) Eg. 1$ = 50 Rs. to 1$ = 65 Rs.. It means that now the foreigner (American) has to pay less Rs.to buy one unit of good from our country (India). This reduces the price of domestic goods
26

for foreign buyers. So one unit of foreign currency can now buy more goods and services from India. Exports become cheaper. The demand for exports may rise.
Q48 Explain the relation between foreign exchange rate and demand for it.OR When price of foreign currency rises, its demand falls. Explain why ?
Demand curve of foreign exchange is downward sloping due to inverse relationship between demand for foreign exchange and foreign exchange rate.
In diagram, on ox axis demand for foreign exchange (US dollar) and on oy axis foreign exchange rate is given. The demand curve (D$) is downward sloping. This means that when foreign exchange rate increases less foreign exchange is demanded. Due to the rise in the price of foreign exchange the foreign goods become more costly ( for India) as a result import will reduces. Thus the demand for foreign exchange will also decrease.Sources of Demand for foreign exchange :
1. To make the payment for imports of goods and services. 2. Repayment of international loans. 3. To make investment in rest of the world. 4. For giving gifts and grants to other country. 5. To purchase assets like land , shares , bonds etc. in the foreign countries.
Q49 Explain the relation between foreign exchange rate and supply for it. OR When price of foreign currency rises, its supply rises. Explain why ? Supply curve of foreign exchange is upward sloping due to positive relationship between supply for foreign exchange and foreign exchange rate.
In diagram, on ox axis supply for foreign exchange (US dollar) and on oy axis foreign exchange rate is given. The supply curve (S$) is upward sloping. This means that when foreign exchange rate increases than supply for foreign exchange also rises. Due to the rise in the price of foreign exchange the domestic goods become cheaper (to America) as a result exports will increase. Thus the supply for foreign exchange will also increase.Sources of Supply for foreign exchange :
1. It comes through exports of goods and services. 2. Recovery of international loans. 3. Through Foreign Direct Investment in domestic market.
27

4. By receiving gifts and grants from other country. 5. When foreigner purchase assets like land , shares , bonds etc. in domestic market.
Q50 How the foreign exchange is determined? Explain with diagram.Exchange rate in a free exchange market is determined at a point , where demand for foreign exchange is equal to the supply of foreign exchange.
In diagram, on ox axis Quantity demanded and Quantity Supplied of foreign currency (US$) is given. On oy axis foreign exchange rate is given which shows how many rupees are required of 1 US dollar.The demand curve (D$) is downward sloping. This means that when foreign exchange rate increases less foreign exchange is demanded.The supply curve (S$) is upward sloping. This means that when foreign exchange rate increases than supply for foreign exchange also rises.The demand curve (D$) intersect the supply curve (S$) at point E , which determines equilibrium foreign exchange rate OP$ and equilibrium quantity of foreign exchange OQ$.
Q Describe the merits & demerits of flexible exchange rate system
Merits:(i) No need of Gold reserves: Flexible exchange rate system is not to be supported with gold reserves.
Because member countries are no longer floating convertible currencies. (ii) International capital movement: Flexible exchange rate system enhances movement of capital across
different countries of the world. This is due to the fact that member countries are no longer required to keep huge international reserves.
(iii)Venture capital: Flexible exchange rate system promotes venture capital in the foreign exchange market. Trading in international currencies itself becomes an important economic activity.
(iv)Optimum Resource Allocation: Flexible exchange rate system enhances efficiency in resource allocation. Accordingly, allocation of resources in the area of international trade tends to become optimum.
Demerits:(i) Market instability: It causes instability in the international money market. Exchange rate tends to
fluctuate like price of good in the commodity market. (ii) Policy formulation: It becomes difficult to draw long period policies of exports & imports due to
instability in the market. (iii) Bilateral trade: Instability in the foreign exchange market causes instability in the area of bilateral
trade. Day to day fluctuation in exchange rate makes bilateral trade agreements a difficult exercise.External Shocks: Flexible exchange rate system has enhanced vulnerability of the domestic economy to external shocks.

Subject :- History
1. Write a note on the kitab-ul- hind.2. What were the elements of the practice of sati that drew the attention of
Bernier ?3. Discus the extent to which Bernier’s account enables historians to
reconstruct contemporary rural society.4. Discuss the way in which the Alvarts, Nayanars and Virashaivas
expressed critiques of the caste system.5. Discuss the major beliefs and practices that characterised sufism.6. Examine how and why rulers tried to establish connections with the
traditions of the Nayanars and the sufis.7. What are the architectural traditions that inspired the architects of
Vijayanagara? How did they transform these traditions?8. In what ways would the daily routine and special festivities associated
with the Mughal policies and attitudes towards regions outside the subcontinent?
9. What were the concerns that shaped Mughal policies and attitudes towards regions outside the subcontinent?
10. Discuss the major features of Mughal provincial administration. How did the centre control the provinces?
Subject : Physics
1. Ele.field due to an ele. Dipole2. Ele. Dipole in uniform ele field3. Gauss theorm and applications4. Ele.potential due to an ele. Dipole5. Equipotential surface6. Ele. Potential energy of ele. Dipole in external ele.field7. Energy stored in capacitor8. Drift velocity9. Relation between current and drift velocity10. Ohm’s law11. Emf and terminal p.d12. Internal resistance of cell13. Kirchhof’s law
14. Wheatstone bridge15. Potentiometer16. Lorentz force, magnetic force17. Biosavart’s law and application18. Ampere’s circuital law and application19. Cyclotron20. Force per unit length of wire21. Moving coil galvanometer22. Transformer23. A.c. generator24. Displacement current25. E.m. spectrum26. Derive angle of deviation 27. Astronomical telescope