mrdavisus.weebly.commrdavisus.weebly.com/.../immigration_charts_lesson.docx · web viewdescribe the...
TRANSCRIPT

Name: Date:D
esir
ed R
esul
ts
Lesson Objective (LO) Texas Essential Knowledge and Skills (TEKS)SWBAT interpret charts/graphs and maps to describe immigration patterns during the “new immigration” era
SWBAT compare immigration trends and motivations during “old” immigration era to “new” immigration era
13.B - analyze the causes and effects of changing demographic patterns resulting from legal and illegal immigration to the United States
29.D - use the process of historical inquiry to research, interpret, and use multiple types of sources of evidence
29.H - use appropriate skills to analyze and interpret social studies information such as maps, graphs, presentations, speeches, lectures, and political cartoons.
UnderstandingsWhat are the big ideas? What specific understandings about them are desired? What misunderstandings are
predictable?
Essential QuestionsWhat provocative questions will foster inquiry,
understanding, and transfer of learning?
The American Dream is an old idea that anyone can achieve success in the United States if they work hard enough.
There are many reasons why people immigrate to the United States and there have been influxes based on trends in history.
Why do people immigrate to the United States?Does everyone immigrate to the United States for the same reason?Why were there several large waves of immigration in US history?How did immigration trends and motivations change over time?
Students will know… Students will be able to…
There were several major waves of immigration in US history (old, new, modern)1. Old Immigration: mainly western Europeans2. New Immigration: increase in Eastern &
Southern Europeans as well as Chinese and Japanese immigrants
3. Modern Immigration: mainly Latin American and from countries in Southeastern Asia.
People immigrated due to push factors (motivators for leaving current state) and pull factors (attractors to a new state)1. Push factors: Escaping poor economic
opportunity, oppression, war, famine, religious persecution in home countries.
2. Pull factors: freedom, promise of economic success, seeing America as “land of milk and honey with streets paved in gold.” Pursuit of the “American Dream.”
Interpret charts/graphs to describe immigration patterns throughout US History
Identify and describe characteristics of major waves of immigration in US History
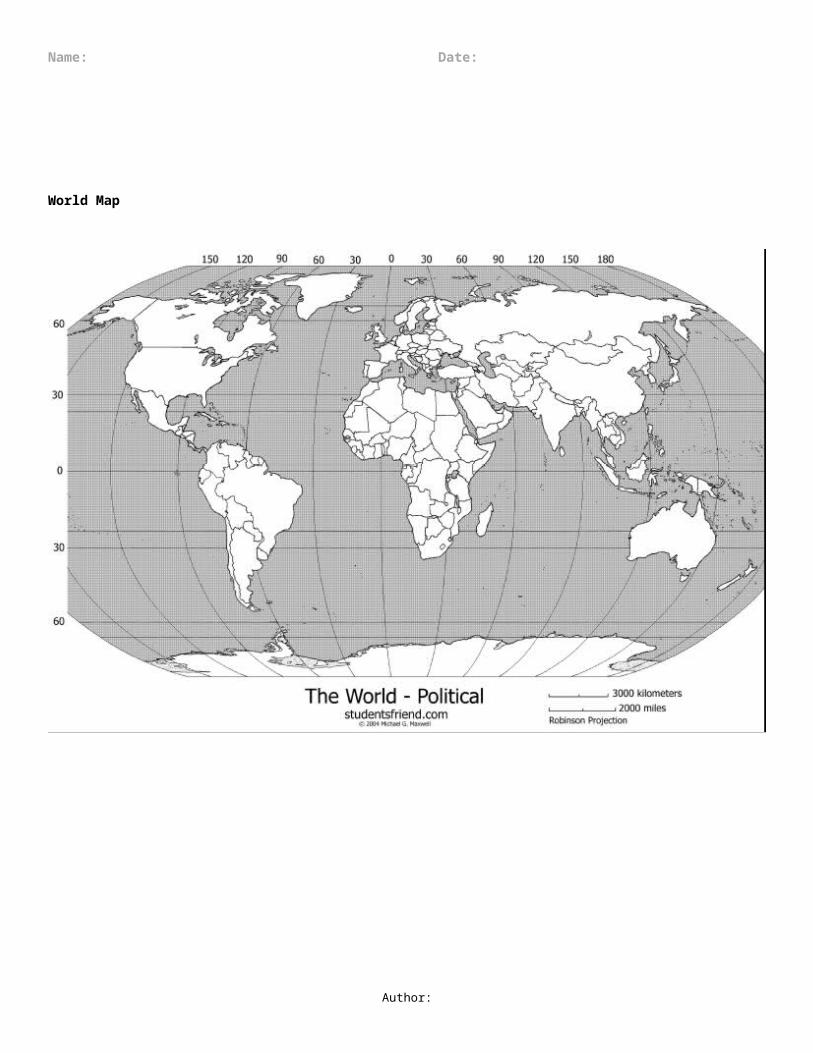
Locate and label countries on world map Compare immigration trends and motivations across
time uses a variety of sources
Ass
essm
ent E
vide
nce
Demonstration of Learning (DOL) and Corresponding Exemplar Student ResponsePerformance Task: Through what authentic performance tasks will students demonstrate the desired understandings?
By what criteria will performances of understanding be judged?1. Describe the motives (at least two) to immigrate common among immigrants in early America. Identify to which
‘theme’ of the American Dream they best relate.Motives/Theme:Search of jobs/anyone can be successful financiallyPolitical oppression/American is a place for anyoneLack of food/anyone can be successful(run other motives by your TLS or TLC is you are unsure!!)If students identify one motive/themepartial credit, two motives/themes full credit
Author:
Name: Date:
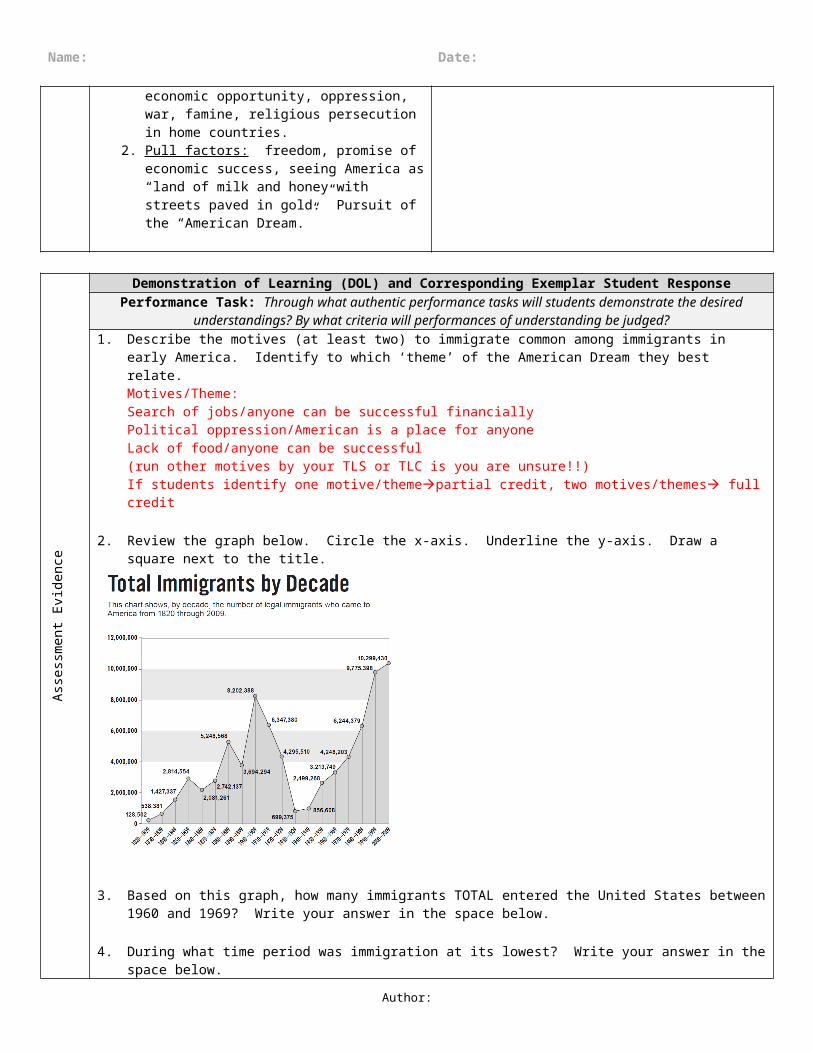
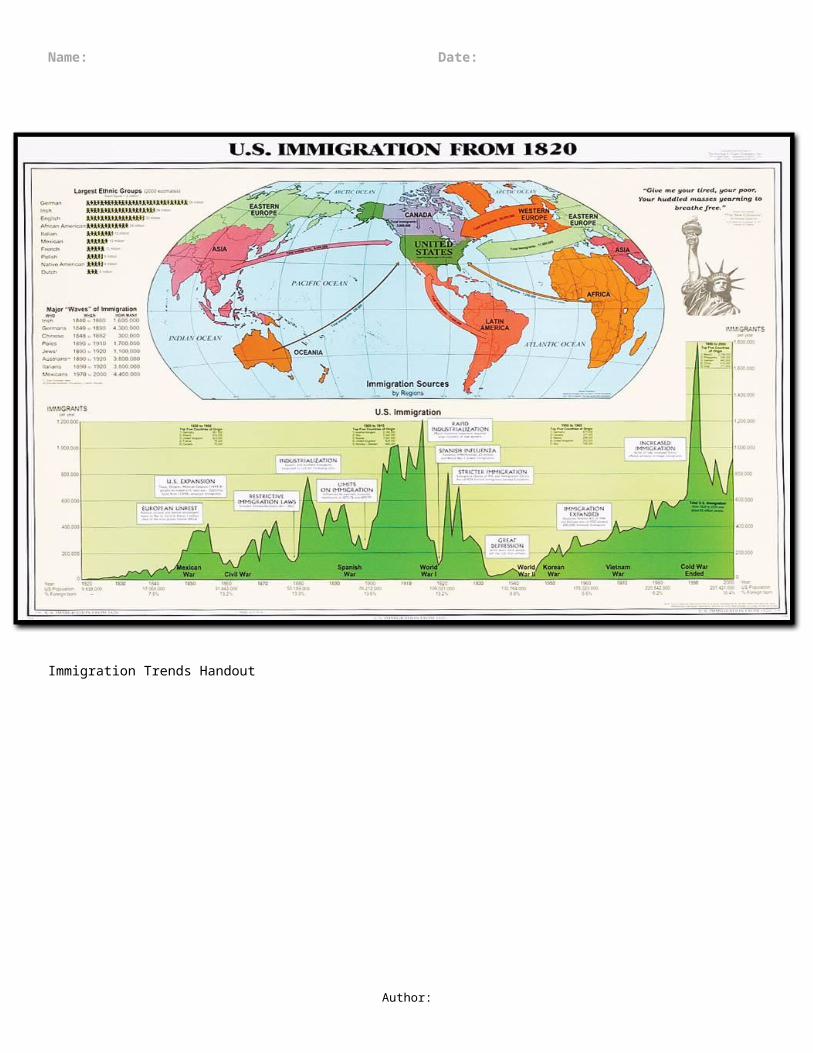
2. Review the graph below. Circle the x-axis. Underline the y-axis. Draw a square next to the title.
3. Based on this graph, how many immigrants TOTAL entered the United States between 1960 and 1969? Write your answer in the space below.
4. During what time period was immigration at its lowest? Write your answer in the space below.
5. Locate and label the region(s) of the world from which most immigrants came during the era of “old immigration.” Draw a box around the region(s).
6. Locate and label the region(s) of the world from which most immigrants have come during the era of modern immigration. Circle the region(s).
Lear
ning
Pla
n
LAUNCH (10 minutes): Prompt students to make connections to the lesson
understandings and essential questions by presenting/demonstrating a concept, challenge, or idea
Summarize the ideas and attempts that students put forward Set the purpose of the day
Purpose for students: Make connections to lesson understandings
and essential question Record initial observations Attempt unaided problem solving
Author:

Name: Date:
Teacher Actions Student Actions
Teacher provides journal question to students: “Over the past several centuries millions of immigrants have come to America seeking a new life. From where do most of our immigrants come? What draws them to America?”
Remind students that there is not a right answer when journaling your opinions.
After 5 minutes of student independent work, teacher calls on each pair/group/student to share one answer. Teacher compiles a class list on whiteboard. Students might need prompting or guiding questions.
Follow up question posed to class for discussion if it doesn’t come up naturally during sharing: “Is this answer true for everyone in every case?” Prompt for examples of how goals might differ for different groups.
Students independently journal personal responses to questions.
After five minutes, students share their answers to create a class list. (Whip around)
Students might have already discovered that their perspectives provided different answers. Possible responses: to pursue the “American Dream”, financial reasons, living in an oppressive state, to be with family, etc.
EXPLORE (40 minutes) Provide a learning activity or experience that allows students to
come into contact with the lesson understandings and essential questions
Guide students’ thinking through questioning without providing answers or explanations
Present students opportunity to clarify thinking and come to solid ideas
Reinforce key ideas and clarify misunderstandings
Have the opportunity to more deeply explore concepts and come up with theories and conjectures, possibly by:o Testing hypotheseso Making observationso Identifying patterns among similar
situations, problems, etc…o Organizing findings to clarify thinking
Teacher Actions Student ActionsConnections to Last Class (2 min)“Last class period, you learned all about the idea of the American Dream and began answering the question: “What is the American Dream?” During this class, we will continue to answer that question that big question. Additionally, we are going to focus on asking ourselves, “Who are the people who came/come to America in search of the American Dream?” We will be thinking to ourselves, “What is the American Dream to each of these people?”
Graphic Exploration (15 min)http://www.nytimes.com/interactive/2009/03/10/us/20090310-immigration-explorer.html?_r=0Pull up website. Ask students to take a minute to look at the graphic. Answer the following (you should have these written out as well as asking students verbally)
What is this showing us? How do you know? What is the title? Where is the key? What does the key show us? What do the various colors mean? What is the significance of the timeline?
Together we are going to move through each decade (a period of 10 years). For each decade, you are going to have 45 seconds to write down your observation and/or any questions that you may have. Let’s look at an example of an observation:
After you’ve gone through the decades ask students to share (you should also have them written out):
Students write their answers on whiteboards and show their answers after each question. If there are any discrepancies ask students to defend their answers to identify any misconceptions. Address misconceptions to the class. These questions are testing whether students are able to read the graph and understand the information it is providing.
In student journals – students write down their observations for each decade. Student Response Example: I notice that most of the
Author:
Name: Date:
I would like to hear from four people your responses to the following questions:
What trends did they see? What happened over time?
Immigrants are settling in all parts of the US. Shifted from mainly European immigrants to largely immigrants from Asia and Latin America.
What questions did this spark for them?
Investigating Graphs (15 min) Let’s take a look at some graphs that will help us understand a little better the immigration history of our nation. Distribute Handout 1
Right now, we are going to walk through each graph details – Title, What axes represent, type of graph, what information we can expect to learn from it. (5 minutes)
In a small group, you are going to use the graphs to answer the following questions. (Decide who is going to be in what group, how are people going to move to groups, what should students be talking about during the activity etc.)
During which periods in American history were there major increases in immigration?
During which periods were there major drops in immigration?
From which region of the world have we received the highest number of immigrants?
From which region of the world have we received the fewest?
During which time period did Europeans make up the majority of immigrants coming into the United States?
During which time period(s) did immigrants from North and South America make up the largest percent?
What questions do these graphs raise for you?
Give students about 5 minutes to respond to the questions and then discuss.
immigrants seems to be European and a lot of them are settling in the East. So I might jot down “Mainly Western Europeans – Eastern US.”
Students share their answers in pairs. Give students 2-3 minutes to share with a partner. Ask four students to share responses to the two discussion questions. Some questions you might hear: Why were there fewer immigrants coming to the US in the 1930s? (if this doesn’t come up point it out – ask students if they know why – Great Depression). What was there such a big increase in Asian immigration after the 1960s and 70s? (Explain that is an excellent observation and that we’ll have a chance to learn about that later this week!).
As a class review graph details – ask for volunteers and cold call to a variety of students.
In small groups 3-4 students will respond the discussion questions using graphs.
PRACTICE (40 minutes):Purpose for teachers:
Prompt student practice Coach and provide feedback Assess student understanding
Purpose for students: Summarize the work they did in groups Apply understanding by practicing in groups,
pairs, independently Reflect and self-assess on learning
Teacher Actions Student ActionsAssign students to groups of 3 – 4. Explain that for the next
Author:

Name: Date:
part of the lesson they’ll be working in groups to investigate one of the four major waves of immigration in the United States. Briefly walk through handouts 2 – 4 and the world map (distribute handouts – note that students should not do anything with them at this point). These specific instructions should be written out prior to your lesson and shared with your TLC.
Share that to model what students are going to be doing in groups, you’re going to walk through an example of a period in history when immigration was at a low point. While students will be investigating the four waves of immigration, the time period you will review is not considered a wave, since immigration numbers were so low. You’ll be taking a look at immigration from 1930 – 1965.
Step 1: Locate the correct reading in Handout 2. Ask students to turn to page 4 of Handout 2. Share that you are going to read through the reading once, taking care to use your reading strategies to underline, circle, and note questions or comments. Read the section aloud, stopping to do metacognitive modeling, asking students to annotate their text as you are.Step 2. Go back through the text to answer the questions on your chart: Time Period, Who, Why, Notes of Interest. Show where you are finding these in the text and how you would write abbreviated notes into your chart (will be in PPT)Step 3. We know that certain groups of immigrants during this period were being discriminated against and treated very unfairly, in some cases brutally, due to their native countries being our enemies in the war. I want to know where exactly their homelands are. I’m going to use my textbook Atlas and blank world map to label and shade these countries (Germany, Italy, Japan). Share with students that your reading talked specifically about certain countries. Their reading will talk about general regions. Because we want to know more specifically who was coming to the states during the four waves of immigration, they’ll need to use the chart in Handout 3 to pinpoint the top 2 – 3 countries from which immigrants were coming during the time period. (show an example on PPT if you are using one)Step 4. I have a general overview of this time period so I’m going to put together a poster that I can use to teach my classmates about what I learned. (show an example on PPT of what should be included in poster). My poster is going to include the time period, the wave of immigration (it’s not part of one so mine actually won’t show that), the major groups of immigrants in this time period, their motivations for coming to the US, and any obstacles that they faced. I’m going to put my map on the poster so that everybody can see exactly what countries I am talking about.
Explain that students will have approximately 45 minutes of work time. Set expectations for group work time (noise level, protocol for asking for help, etc). While students are working you should give them time checks (after 15 minutes should be through article – at 20 should be done with chart – at 30 should be working on map – final time should be putting
As you are modeling students are following along with you on the reading and taking notes of the steps you are taking to create the poster.
Students work in groups on the practice. At 15 minutes students should have read through the article and annotated. At 20 minutes students
Author:
Name: Date:
together poster).
After students have finished their posters they will participate in a gallery walk. The purpose of the gallery walk is for students to learn more about the other three waves of immigration. Explain directions for gallery walk (will have 5 minutes at each station – move clockwise and only when I say “move” – will move silently – when at stations will read through poster and record appropriate information into appropriate chart row – should be thinking “how is this similar or different to the other waves of immigration?.”
DOL (10 minutes)
will be done with the chart and at 30 minutes they should be working on the map and poster.
Students record appropriate information in their graphic organizer as they move through the gallery walk.
Students completed DOL independently.
Handout 1 – Patterns of US Immigration
Author:
Name: Date:
It is six years since the United States won the War of Independence. America is becoming, in Thomas Paine's words, "the asylum for the persecuted lovers of civil and religious liberty from every part of Europe."
The first Census is underway and of the 3.9 million people counted, the English are the largest ethnic group. Nearly 20% are of African heritage. German, Scottish and Irish residents are also well represented. Census takers didn't count Native Americans.
The early Congresses could do little to affect immigration - the Constitution gave that power to the states. However, Congress was given the authority to ban the slave trade after 1808 - which it did - and the authority to establish rules for naturalization.
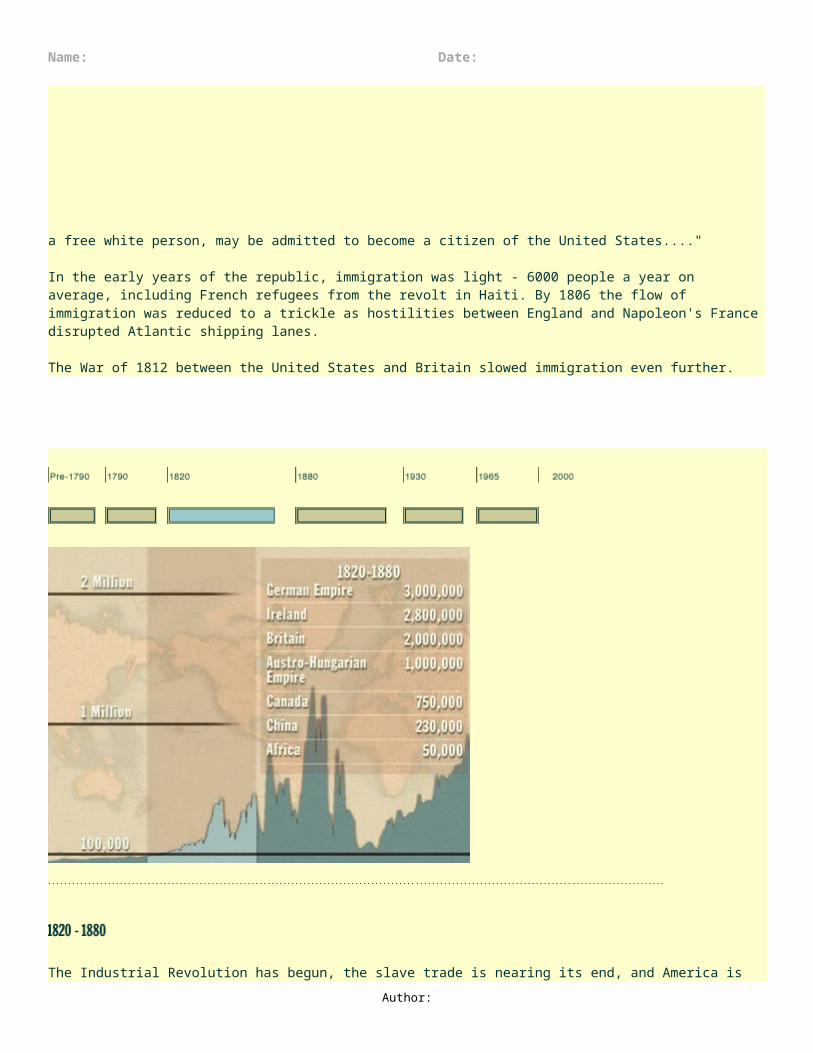
In 1790 it passed the first Naturalization Act, which stipulated that "… any alien, being a free white person, may be admitted to become a citizen of the United States...."
In the early years of the republic, immigration was light - 6000 people a year on average, including French refugees from the revolt in Haiti. By 1806 the flow of immigration was reduced to a trickle as hostilities between England and Napoleon's France disrupted Atlantic shipping lanes.
The War of 1812 between the United States and Britain slowed immigration even further.
With peace re-established in 1814, immigration from Great Britain, Ireland and Western Europe resumed at a record pace. Major port cities of this era - New York, Boston, Philadelphia, and Charleston - were overwhelmed with newcomers, many of them sick or dying from the long journey.
Congress responded with the Steerage Act of 1819, requiring ship captains to keep detailed passenger records and provide more humane conditions for those on board.
Author:
Name: Date:
The Industrial Revolution has begun, the slave trade is nearing its end, and America is pushing westward. Thousands of immigrants find work on the trans-continental railroad, settling in towns along the way. Word of the California Gold Rush has spread around the world, drawing immigrants from both Asia and Europe.
Although many new immigrants came in pursuit of a dream, nearly all the Irish immigrants from the 1840's and 1850's came to escape a nightmare - a devastating famine back home. As one immigrant recalled, "I saw the crop. I smelt the fearful stench… the death sign of each field of potatoes…the luxuriant stalks soon withered, the leaves decayed…" The Great Hunger would leave 1.5 million dead, and just as many would flee to America.
The Irish weren't the only newcomers. Rapid population growth, changes in land distribution, and industrialization had stripped many European peasants and artisans of their livelihoods. Departing from Liverpool and Hamburg, they came in through the major Eastern ports, and New Orleans. Chinese immigrants began to arrive in the 1850's, entering through San Francisco.
As in the past, the immigrants of this period were welcome neighbors while the economy was strong. During the Civil War both the Union and Confederate armies relied on their strength. But during hard times, the immigrants were cast out and accused of stealing jobs from American workers. Some of the loudest protests came from the Know-Nothings - a political party of the 1850's famous for its anti-immigrant and anti-Catholic leanings.
But it was the pro-immigrant voices of this era that would be most influential. The Republican platform of 1864 stated, "Foreign immigration which in the past has added so much to the wealth, resources, and increase of power to the nation … should be fostered and encouraged."
Author:

Name: Date:
By the 1880's, steam power had shortened the journey to America dramatically. Immigrants poured in from around the world: from the Middle East, the Mediterranean, Southern and Eastern Europe, and down from Canada.
The door was wide open for Europeans - In the 1880s alone, 9% of the total population of Norway emigrated to America. After 1892 nearly all immigrants came in through the newly opened Ellis Island.
One immigrant recalled arriving at Ellis Island: "The boat anchored at mid-bay and then they tendered us on the ship to Ellis Island… We got off the boat…you got your bag in your hand and went right into the building Ah, that day must have been about five to six thousand people. Jammed, I remember it was August. Hot as a pistol, and I'm wearing my long johns, and my heavy Irish tweed suit."
Families often immigrated together during this era, although young men frequently came first to find work. Some of these then sent for their wives, children, and siblings; others returned to their families in Europe with their saved wages.
The experience for Asian immigrants in this period was quite different. In 1882 Congress passed the Chinese Exclusion Act, severely restricting immigration from China. Since earlier laws made it difficult for those Chinese immigrants who were already here to bring over their wives and families, most Chinese communities remained "bachelor societies."
The 1907 "Gentlemen's Agreement" with Japan extended the government's hostility towards Asian workers and families. For thousands, the Angel Island Immigration Station in San Francisco Bay would be as close as they would ever get to the American mainland.
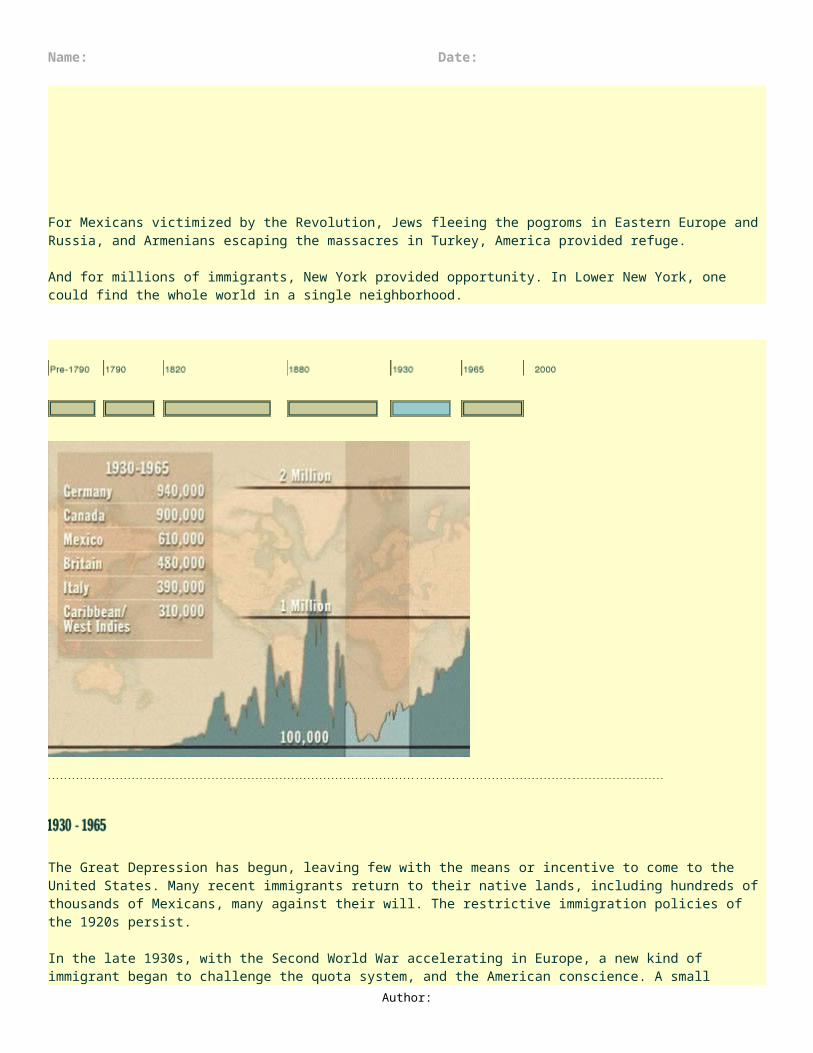
For Mexicans victimized by the Revolution, Jews fleeing the pogroms in Eastern Europe and Russia, and Armenians escaping the massacres in Turkey, America provided refuge.
Author:
Name: Date:
And for millions of immigrants, New York provided opportunity. In Lower New York, one could find the whole world in a single neighborhood.
Between 1880 and 1930 over 27 million people entered the United States - about 20 million through Ellis
The Great Depression has begun, leaving few with the means or incentive to come to the United States. Many recent immigrants return to their native lands, including hundreds of thousands of Mexicans, many against their will. The restrictive immigration policies of the 1920s persist.
In the late 1930s, with the Second World War accelerating in Europe, a new kind of immigrant began to challenge the quota system, and the American conscience. A small number of refugees fleeing Nazi persecution arrived under the quota system, but most were turned away.
Once the US declared war against the Axis Powers, German and Italian resident aliens were detained; but for the Japanese, the policies were more extreme: both resident aliens and American-born citizens of Japanese descent were interned. Congress would officially apologize for the Japanese Internment in 1988.
After the war, the refugee crisis continued. President Truman responded: "I urge the Congress to turn its attention to this world problem in an effort to find ways whereby we can fulfill our responsibilities to these thousands of homeless and suffering refugees of all faiths."
Congress answered with the Displaced Persons Act of 1948, offering hundreds of thousands entry into the
Author:

Name: Date:
United States. But millions more were left to seek refuge elsewhere.
Between 1956 and 1957, the US admitted 38,000 Hungarians, refugees from a failed uprising against the Soviets. These were among the first of the Cold War refugees.
In this era, for the first time in US history, more women than men entered the country. They were reuniting
The effects of the Immigration and Naturalization Act of 1965 were immediate and significant. Within 5 years, Asian immigration would more than quadruple. This trend was magnified even further by the surge in refugees from the war in South East Asia.
On the other side of the world, Cuban refugees told a similar story: "…we got a telegram in the middle of the night saying that we were authorized to go…I remember I kept on looking back at my home and feeling very bad, very sad, and then going to Havana and going to the plane. My father was in a nervous state."
But escaping the Cold War conflicts of the 60s and 70s was not the only draw for the country's newest immigrants. Throughout this period, in a policy that continues to this day, the government has given preferences to professionals like doctors, nurses, scientists, and hi-tech specialists, creating what is often called the "Brain Drain." Many of these skilled workers are women, who are often the first link in a chain of migration, working and saving enough money to bring family members to the US.
Author:

Name: Date:
California now stands at the crossroads of America's newest cultures, receiving most of the immigrants from the Asian mainland and the Philippines, Mexico, and Central America. Their influence is felt from the Imperial Valley to Silicon Valley.
Immigrants can enter the country by air, by sea, and by land routes through Canada and Mexico, making it easier than ever to enter the country illegally. Through the 80s and 90s illegal immigration was a constant topic of political debate. In 1986, the government gave amnesty to more than 3 million aliens through the Immigration Reform Act, but during the recession years of the early 90s, there was a resurgence of anti-immigrant feeling.
Still, immigration rates through the 1990s soared, leaving today's generation with lingering questions: Does America have a duty to keep its doors open to the world? Can immigrants keep their own culture and language, and still be called Americans? Is continued economic growth in America dependent upon a liberal immigration policy? The debates will certainly continue, as new immigrants arrive on our shores daily, bringing with them their own histories, traditions, and ideas, all of which broaden and enrich our sense of what it means to be an American.
Author:
Name: Date:
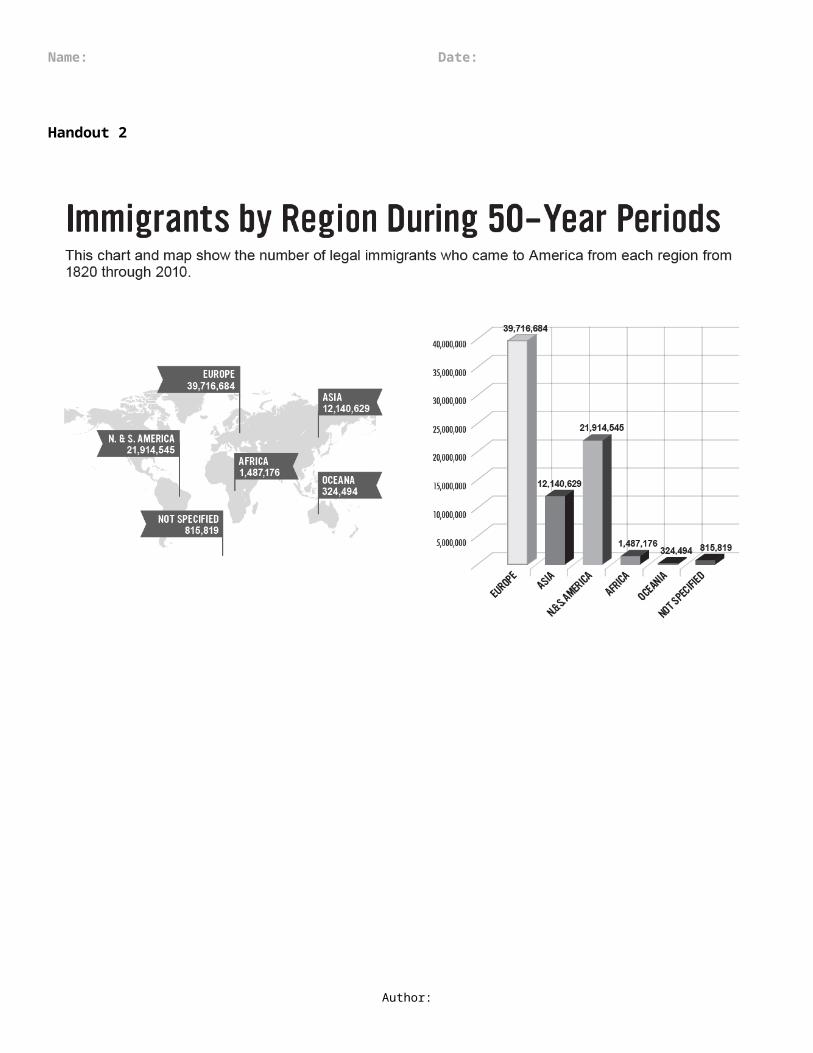
Handout 2
Author:

Name: Date:
Immigration Trends Handout
Author:

Name: Date:
World Map
Author:

Name: Date:
Author:
Name: Date:
Handout 3
Wave Time Period Who Why Notes of Interest1st Wave
2nd Wave
3rd Wave
4th Wave
Author:
Name: Date:
Group Handouts
Region and Country or Area of Birth of the Foreign-Born Population, With Geographic Detail Shown in Decennial Census Publications of 1930 or Earlier: 1850 to 1930 and 1960 to 1990
Source: U.S. Bureau of the CensusInternet Release date: March 9, 1999
(See text for sources, definitions, and explanations)
Region and country or area 1930 1920 1910 1900 1890 1880 1870 1860
Total 14,204,149 13,920,692 13,515,886 10,341,276 9,249,547 6,679,943 5,567,229 4,138,697 2,244,602
Reported by region and/or country 14,197,553 13,911,767 13,506,272 10,330,534 9,243,535 6,675,875 5,563,637 4,134,809 2,202,625
Europe 11,784,010 11,916,048 11,810,115 8,881,548 8,030,347 5,751,823 4,941,049 3,807,062 2,031,867
United Kingdom 1,402,923 (X) (X) (X) (X) (X) (X) (X)
Great Britain 1,224,091 1,135,489 1,221,283 1,167,623 1,251,402 917,598 770,414 587,775
England 809,563 813,853 877,719 840,513 908,141 662,676 550,924 431,692
Scotland 354,323 254,570 261,076 233,524 242,231 170,136 140,835 108,518
Wales 60,205 67,066 82,488 93,586 100,079 83,302 74,533 45,763
Northern Ireland 178,832 (X) (X) (X) (X) (X) (X) (X)
Ireland 744,810 1,037,234 1,352,251 1,615,459 1,871,509 1,854,571 1,855,827 1,611,304
Scandinavia 1,267,818 1,328,426 1,380,413 1,134,733 933,249 440,262 241,685 72,582
Denmark 179,474 189,154 181,649 153,690 132,543 64,196 30,107 9,962
Finland 142,478 149,824 129,680 62,641 (NA) (NA) (NA) (NA)
Iceland 2,764 (NA) (NA) (NA) (NA) (NA) (NA) (NA)
Norway 347,852 363,863 403,877 336,388 322,665 181,729 114,246 43,995
Sweden 595,250 625,585 665,207 582,014 478,041 194,337 97,332 18,625
Belgium 64,194 62,687 49,400 29,757 22,639 15,535 12,553 9,072
Luxembourg 9,048 12,585 3,071 3,031 2,882 12,836 5,802 (NA)
Netherlands 133,133 131,766 120,063 94,931 81,828 58,090 46,802 28,281
Austria 370,914 575,627 626,341 275,907 123,271 38,663 30,508 25,061
France 135,592 153,072 117,418 104,197 113,174 106,971 116,402 109,870
Germany 1,608,814 1,686,108 2,311,237 2,663,418 2,784,894 1,966,742 1,690,533 1,276,075
Author:
Name: Date:
Switzerland 113,010 118,659 124,848 115,593 104,069 88,621 75,153 53,327
Greece 174,526 175,976 101,282 8,515 1,887 776 390 328
Italy 1,790,429 1,610,113 1,343,125 484,027 182,580 44,230 17,157 11,677
Portugal 108,775 103,976 77,634 40,376 25,735 15,650 8,973 5,477
Azores 35,611 33,995 18,274 9,768 9,739 7,512 4,431 1,361
Portugal 73,164 69,981 59,360 30,608 15,996 8,138 4,542 4,116
Spain 59,362 49,535 22,108 7,050 6,185 5,121 3,764 4,244
Albania 8,814 5,608 (NA) (NA) (NA) (NA) (NA) (NA)
Bulgaria 9,399 10,477 11,498 (NA) (NA) (NA) (NA) (NA)
Czechoslovakia 491,638 362,438 219,214 156,891 118,106 85,361 40,289 (NA)
Estonia 3,550 (NA) (NA) (NA) (NA) (NA) (NA) (NA)
Hungary 274,450 397,283 495,609 145,714 62,435 11,526 3,737 (NA)
Latvia 20,673 (NA) (NA) (NA) (NA) (NA) (NA) (NA)
Lithuania 193,606 135,068 (NA) (NA) (NA) (NA) (NA) (NA)
Poland 1,268,583 1,139,979 937,884 383,407 147,440 48,557 14,436 7,298
Romania 146,393 102,823 65,923 15,032 (NA) (NA) (NA) (NA)
Soviet Union 1,153,628 1,400,495 1,184,412 423,726 182,644 35,722 4,644 3,160
Turkey in Europe 2,257 5,284 32,230 9,910 1,839 1,205 302 128
Yugoslavia 211,416 169,439 (NA) (NA) (NA) (NA) (NA) (NA)
Asia 275,665 237,950 191,484 120,248 113,383 107,630 64,565 36,796
Armenia 32,166 36,628 (NA) (NA) (NA) (NA) (NA) (NA)
China 1/ 46,129 43,560 56,756 81,534 106,688 104,468 63,042 35,565
India 5,850 4,901 4,664 2,031 2,143 1,707 586 (NA)
Japan 70,993 81,502 67,744 24,788 2,292 401 73 (NA)
Palestine 6,137 3,203 (NA) (NA) (NA) (NA) (NA) (NA)
Syria 57,227 51,901 (NA) (NA) (NA) (NA) (NA) (NA)
Turkey in Asia 46,654 11,019 59,729 (NA) (NA) (NA) (NA) (NA)
Other Asia 10,509 5,236 2,591 11,895 2,260 1,054 864 1,231
Africa 18,326 16,126 3,992 2,538 2,207 2,204 2,657 526
Africa excl. Atlantic Islands 8,859 5,781 3,992 2,538 2,207 2,204 2,657 526
Atlantic Islands 9,467 10,345 (NA) (NA) (NA) (NA) (NA) (NA)
Oceania 17,343 14,626 11,450 8,820 9,353 6,859 4,028 2,140
Australia 12,816 10,914 9,035 6,807 5,984 4,906 3,118 1,419
Sandwich Islands (Hawaii) (X) (X) (X) (X) 1,304 1,147 584 435
Other Oceania 4,527 3,712 2,415 2,013 2,065 806 326 286
Latin America 791,840 588,843 279,514 137,458 107,307 90,073 57,871 38,315
Caribbean 106,241 78,962 47,635 25,435 23,256 16,401 11,570 7,353
Cuba 18,493 14,872 15,133 11,081 (NA) 6,917 5,319 (NA)
Other Caribbean 87,748 64,090 32,502 14,354 (NA) 9,484 6,251 (NA)
Central America 651,976 491,330 223,651 107,290 79,045 69,106 42,736 27,699
Mexico 641,462 486,418 221,915 103,393 77,853 68,399 42,435 27,466
Other Central America 10,514 4,912 1,736 3,897 1,192 707 301 233
South America 33,623 18,551 8,228 4,733 5,006 4,566 3,565 3,263
Author:

Name: Date:
Northern America 1,310,369 1,138,174 1,209,717 1,179,922 980,938 717,286 493,467 249,970
Canada 1,310,369 1,138,174 1,209,717 1,179,922 980,938 717,157 493,464 249,970
Canada-French 370,852 307,786 385,083 395,126 302,496 (NA) (NA) (NA)
Canada-Other 915,537 817,139 819,554 784,796 678,442 (NA) (NA) (NA)
Newfoundland 23,980 13,249 5,080 (NA) (NA) (NA) (NA) (NA)
Other Northern America (NA) (NA) (NA) (NA) (NA) 129 3 (NA)
Author: