· web view5-1 learning targets: represent relations and functions using tables, diagrams, and...
TRANSCRIPT
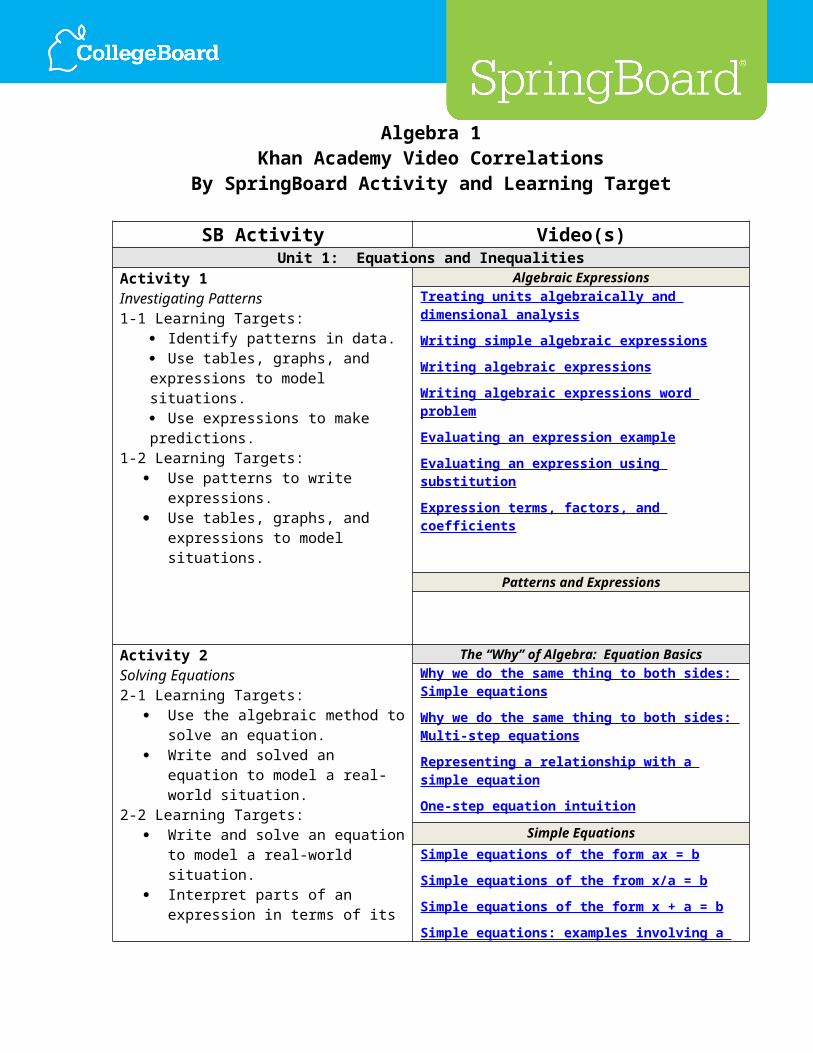
Algebra 1Khan Academy Video Correlations
By SpringBoard Activity and Learning Target
SB Activity Video(s)Unit 1: Equations and Inequalities
Activity 1Investigating Patterns1-1 Learning Targets:
Identify patterns in data. Use tables, graphs, and expressions to model situations. Use expressions to make predictions.
1-2 Learning Targets: Use patterns to write expressions. Use tables, graphs, and expressions to
model situations.
Algebraic ExpressionsTreating units algebraically and dimensional analysis
Writing simple algebraic expressions
Writing algebraic expressions
Writing algebraic expressions word problem
Evaluating an expression example
Evaluating an expression using substitution
Expression terms, factors, and coefficients
Patterns and Expressions
Activity 2Solving Equations2-1 Learning Targets:
Use the algebraic method to solve an equation.
Write and solved an equation to model a real-world situation.
2-2 Learning Targets: Write and solve an equation to model a
real-world situation. Interpret parts of an expression in
terms of its context. 2-3 Learning Targets:
Solve complex equations with variables on both sides and justify each step in the solution process.
Write and solve an equation to model a real-world situation.
2-4 Learning Targets: Identify equations that have no
solution. Identify equations that have infinitely
many solutions.
The “Why” of Algebra: Equation BasicsWhy we do the same thing to both sides: Simple equations
Why we do the same thing to both sides: Multi-step equations
Representing a relationship with a simple equation
One-step equation intuition
Simple EquationsSimple equations of the form ax = b
Simple equations of the from x/a = b
Simple equations of the form x + a = b
Simple equations: examples involving a variety of forms
Equations with Variable on Both SidesSolving two-step equations
Example: two-step equations
Adding and subtracting from both sides of an equation
Dividing from both sides of an equation
Example: two-step equation with numerator x
More Complex Equations
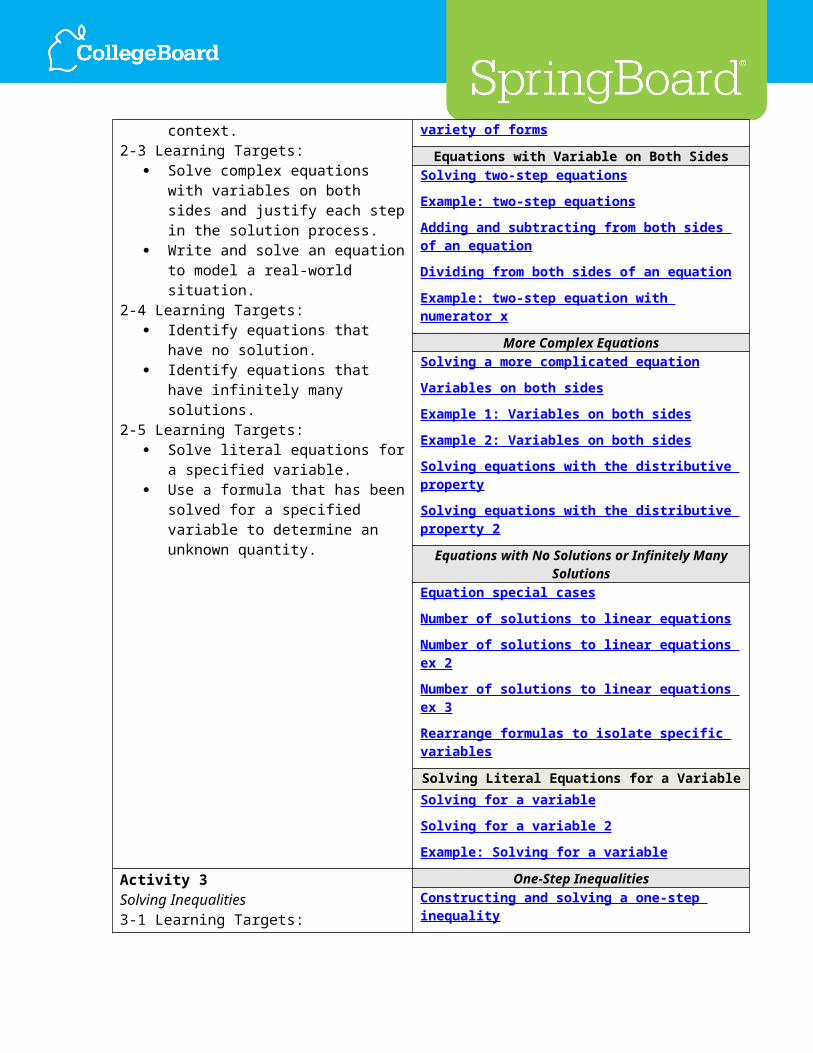
2-5 Learning Targets: Solve literal equations for a specified
variable. Use a formula that has been solved for
a specified variable to determine an unknown quantity.
Solving a more complicated equation
Variables on both sides
Example 1: Variables on both sides
Example 2: Variables on both sides
Solving equations with the distributive property
Solving equations with the distributive property 2
Equations with No Solutions or Infinitely Many SolutionsEquation special cases
Number of solutions to linear equations
Number of solutions to linear equations ex 2
Number of solutions to linear equations ex 3
Rearrange formulas to isolate specific variables
Solving Literal Equations for a Variable
Solving for a variable
Solving for a variable 2
Example: Solving for a variable
Activity 3Solving Inequalities3-1 Learning Targets:
Understand what is meant by a solution of an inequality.
Graph solutions of inequalities on a number line.
3-2 Learning Targets: Write inequalities to represent real-
world situations. Solve multi-step inequalities.
3-3 Learning Targets: Graph compound inequalities. Solve compound inequalities.
One-Step InequalitiesConstructing and solving a one-step inequality
One-step inequality involving addition
Inequalities using addition and subtraction
Multiplying and dividing with inequalities
Multiplying and dividing with inequalities example
Multi-Step InequalitiesConstructing and solving a two-step inequality
Constructing, solving a two-step inequality example
Solving a two-step inequality
Multi-step inequalities
Multi-step inequalities 2
Multi-step inequalities 3
Compound InequalitiesCompound inequalities
Compound inequalities
Compound inequalities 2
Compound inequalities 3
Compound inequalities 4
Absolute Value Equations
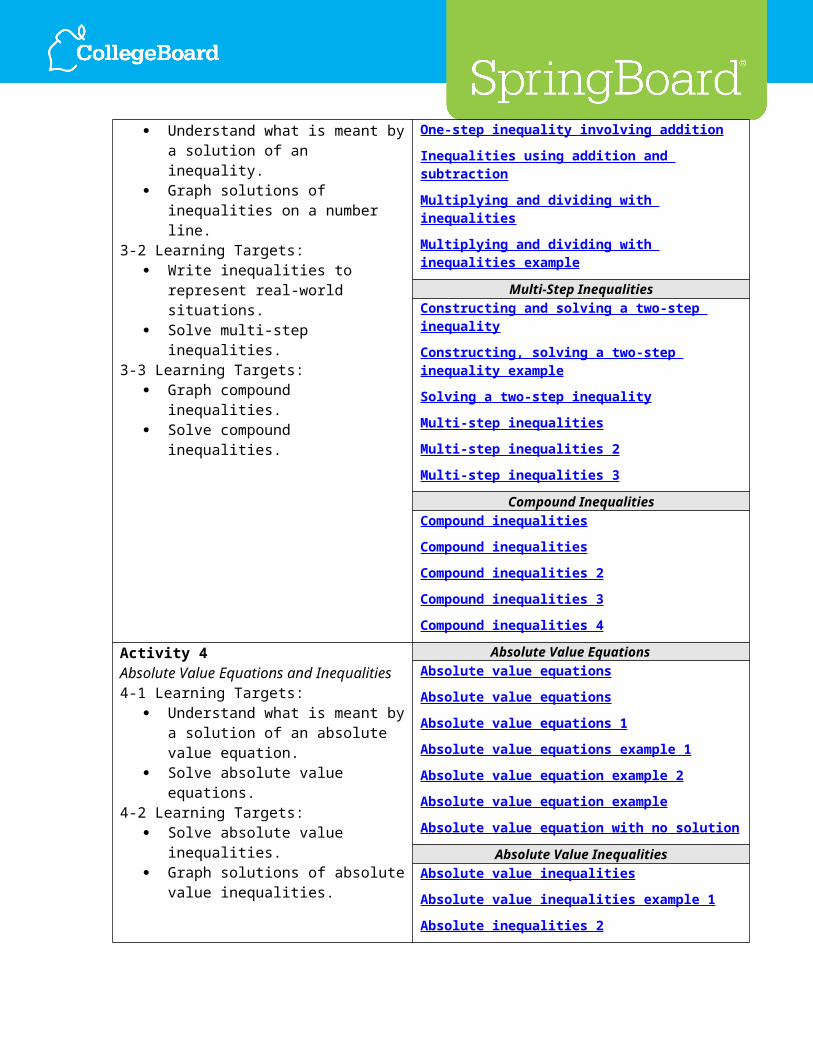
Activity 4Absolute Value Equations and Inequalities4-1 Learning Targets:
Understand what is meant by a solution of an absolute value equation.
Solve absolute value equations. 4-2 Learning Targets:
Solve absolute value inequalities. Graph solutions of absolute value
inequalities.
Absolute value equations
Absolute value equations
Absolute value equations 1
Absolute value equations example 1
Absolute value equation example 2
Absolute value equation example
Absolute value equation with no solution
Absolute Value Inequalities Absolute value inequalities
Absolute value inequalities example 1
Absolute inequalities 2
Absolute value inequalities example 3
Unit 2: FunctionsActivity 5Functions and Function Notation5-1 Learning Targets:
Represent relations and functions using tables, diagrams, and graphs.
Identify relations that are functions. 5-2 Learning Targets:
Describe the domain and range of a function.
Find input-output pairs for a function. 5-3 Learning Targets:
Use and interpret function notation. Evaluate a function for specific values
of the domain.
Relations and Functions What is a function?
Relations and functions
Recognizing functions (example 1)
Domain and Range Domain and range of a relation
Domain and range of a function
Domain and range 1
Function Notation Evaluating with function notation
Understanding function notation (example 1)
Understanding function notation (example 2)
Understanding function notation (example 3)
Graphs of Functions
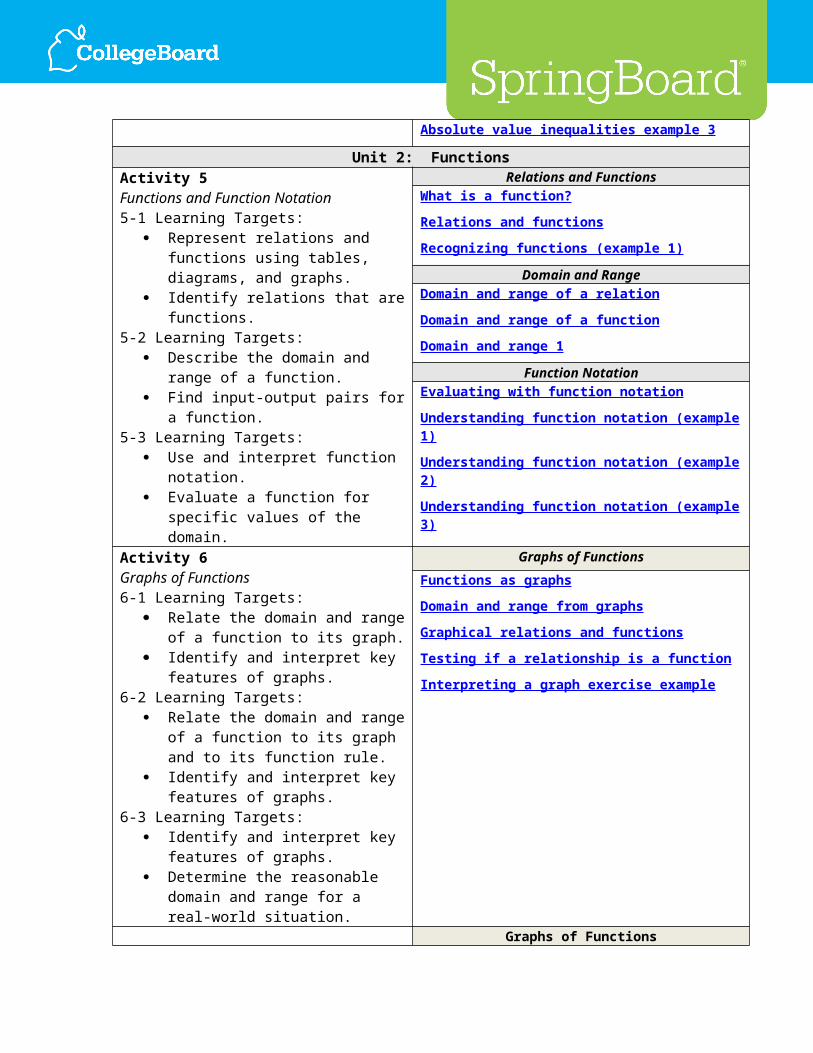
Activity 6Graphs of Functions6-1 Learning Targets:
Relate the domain and range of a function to its graph.
Identify and interpret key features of graphs.
6-2 Learning Targets: Relate the domain and range of a
function to its graph and to its function rule.
Identify and interpret key features of graphs.
6-3 Learning Targets: Identify and interpret key features of
graphs. Determine the reasonable domain and
range for a real-world situation.
Functions as graphs
Domain and range from graphs
Graphical relations and functions
Testing if a relationship is a function
Interpreting a graph exercise example
Activity 7Graphs of Functions7-1 Learning Targets:
Graph a function given a table. Write an equation for a function given a
table or graph. 7-2 Learning Targets:
Graph a function describing a real-world situation and identify and interpret key features of the graph.
7-3 Learning Targets: Given a verbal description of a function,
make a table and a graph of the function.
Graph a function and identify and interpret key features of the graph.
Graphs of FunctionsGraphing exponential functions
Interpreting a graph exercise example
Activity 8Transformations of Functions8-1 Learning Targets:
Identify the effect on the graph of replacing f(x) by f(x) + k.
Identify the transformation used to produce one graph from another.
N/A
Activity 9Rates of Change9-1 Learning Targets:
SlopeSlope of a line
Slope of a line 2
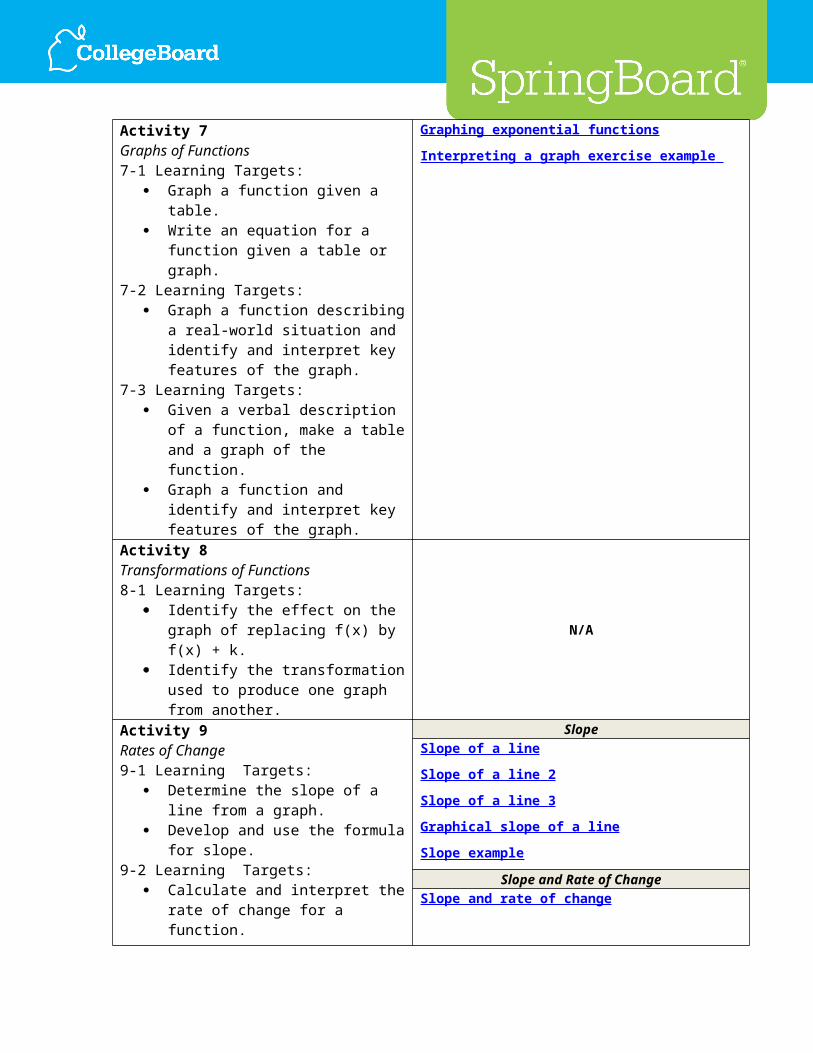
Determine the slope of a line from a graph.
Develop and use the formula for slope.9-2 Learning Targets:
Calculate and interpret the rate of change for a function.
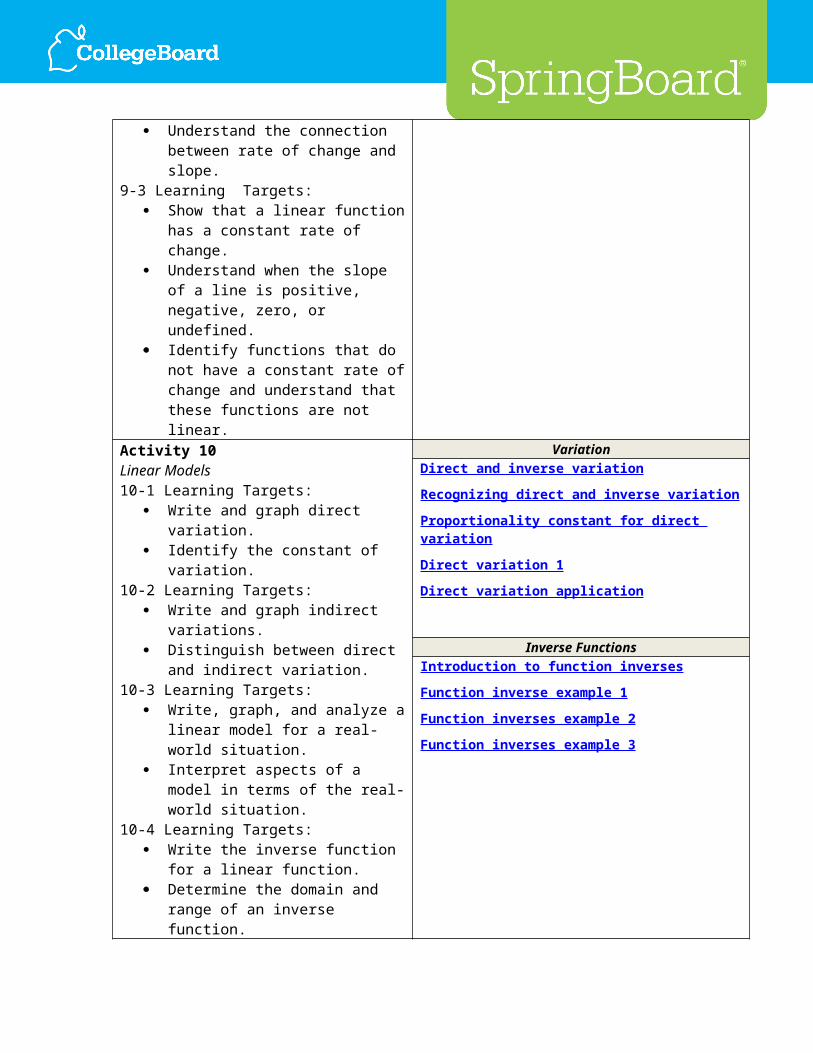
Understand the connection between rate of change and slope.
9-3 Learning Targets: Show that a linear function has a
constant rate of change. Understand when the slope of a line is
positive, negative, zero, or undefined. Identify functions that do not have a
constant rate of change and understand that these functions are not linear.
Slope of a line 3
Graphical slope of a line
Slope example
Slope and Rate of ChangeSlope and rate of change
Activity 10Linear Models10-1 Learning Targets:
Write and graph direct variation. Identify the constant of variation.
10-2 Learning Targets: Write and graph indirect variations. Distinguish between direct and indirect
variation.10-3 Learning Targets:
Write, graph, and analyze a linear model for a real-world situation.
Interpret aspects of a model in terms of the real-world situation.
10-4 Learning Targets: Write the inverse function for a linear
function. Determine the domain and range of an
inverse function.
VariationDirect and inverse variation
Recognizing direct and inverse variation
Proportionality constant for direct variation
Direct variation 1
Direct variation application
Inverse FunctionsIntroduction to function inverses
Function inverse example 1
Function inverses example 2
Function inverses example 3
Arithmetic Sequences
Activity 11Arithmetic Sequences11-1 Learning Targets:
Identify sequences that are arithmetic sequences.
Use the common difference to determine a specified term of an arithmetic sequence.
11-2 Learning Targets: Develop an explicit formula for the nth
term of an arithmetic sequence. Use an explicit formula to find any term
of an arithmetic sequence. Write a formula for an arithmetic
sequence given two terms or a graph.11-3 Learning Targets:
Use function notation to write a general formula for the nth term of an arithmetic sequence.
Find any term of an arithmetic sequence written as a function.
11-4 Learning Targets: Write a recursive formula for a given
arithmetic sequence. Use a recursive formula to find the
terms of an arithmetic sequence.
Arithmetic sequences
Explicit and recursive definitions of sequences
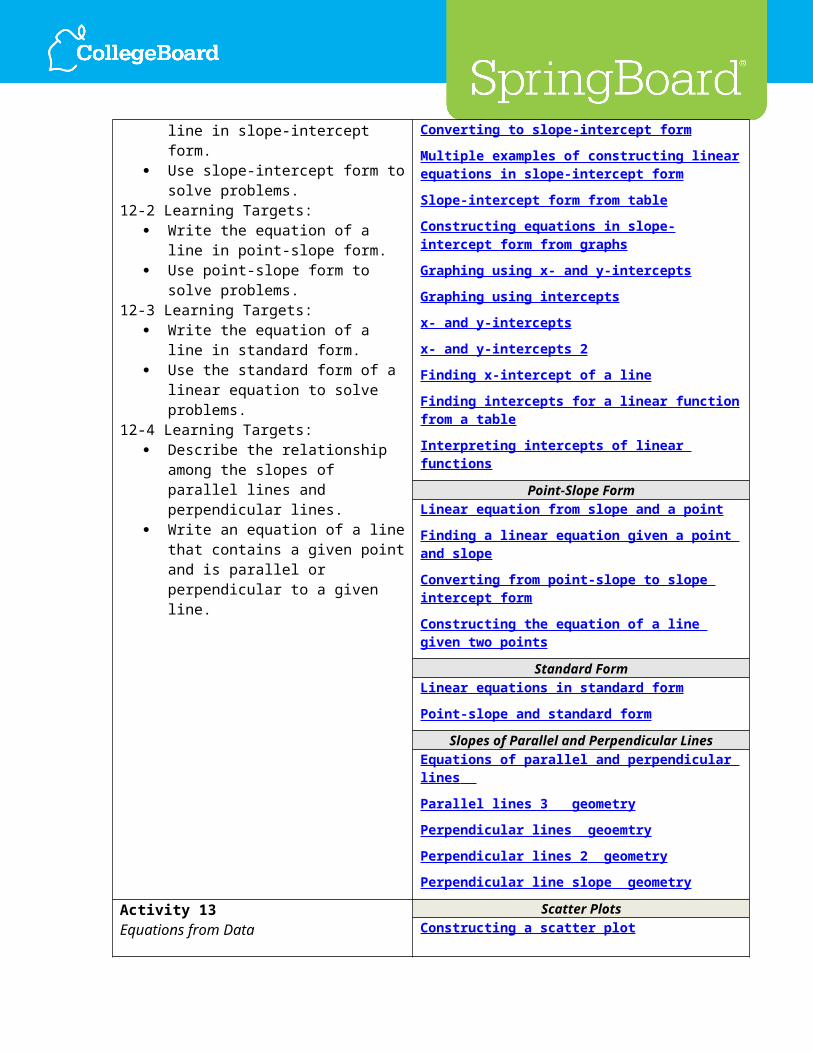
Activity 12Forms of Linear Functions12-1 Learning Targets:
Write the equation of a line in slope-intercept form.
Slope-Intercept Form Constructing linear equations to solve word problems
Graphing a line in slope-intercept form
Converting to slope-intercept form
Multiple examples of constructing linear equations in
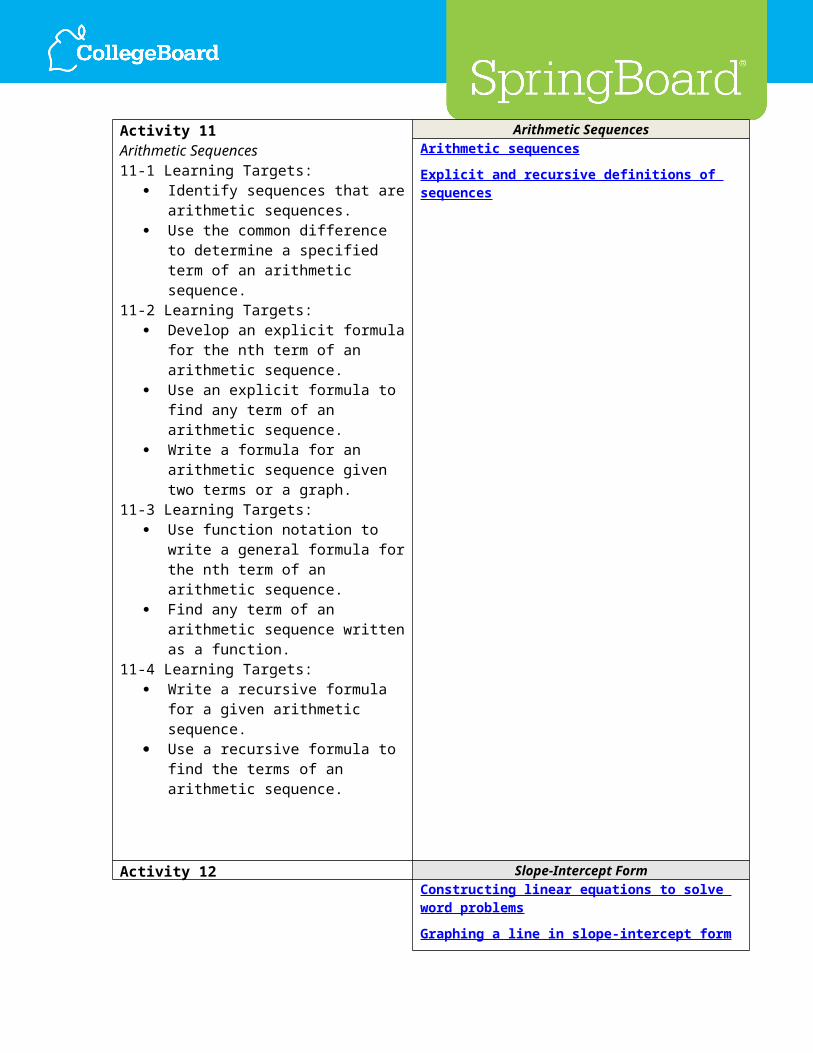
Use slope-intercept form to solve problems.
12-2 Learning Targets: Write the equation of a line in point-
slope form. Use point-slope form to solve
problems.12-3 Learning Targets:
Write the equation of a line in standard form.
Use the standard form of a linear equation to solve problems.
12-4 Learning Targets: Describe the relationship among the
slopes of parallel lines and perpendicular lines.
Write an equation of a line that contains a given point and is parallel or perpendicular to a given line.
slope-intercept form
Slope-intercept form from table
Constructing equations in slope-intercept form from graphs
Graphing using x- and y-intercepts
Graphing using intercepts
x- and y-intercepts
x- and y-intercepts 2
Finding x-intercept of a line
Finding intercepts for a linear function from a table
Interpreting intercepts of linear functions
Point-Slope Form Linear equation from slope and a point
Finding a linear equation given a point and slope
Converting from point-slope to slope intercept form
Constructing the equation of a line given two points
Standard Form Linear equations in standard form
Point-slope and standard form
Slopes of Parallel and Perpendicular Lines Equations of parallel and perpendicular lines
Parallel lines 3 geometry
Perpendicular lines geoemtry
Perpendicular lines 2 geometry
Perpendicular line slope geometry
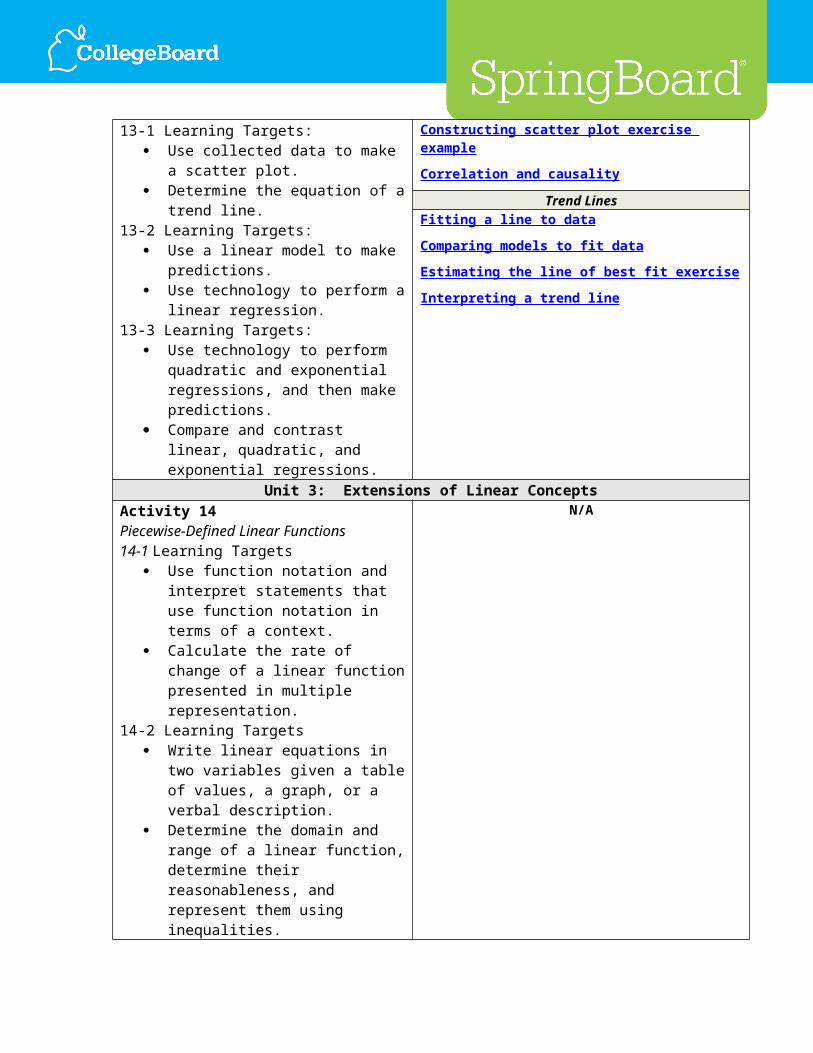
Activity 13Equations from Data13-1 Learning Targets:
Use collected data to make a scatter plot.
Determine the equation of a trend line.13-2 Learning Targets:
Use a linear model to make predictions. Use technology to perform a linear
regression.13-3 Learning Targets:
Use technology to perform quadratic and exponential regressions, and then make predictions.
Scatter PlotsConstructing a scatter plot
Constructing scatter plot exercise example
Correlation and causality
Trend LinesFitting a line to data
Comparing models to fit data
Estimating the line of best fit exercise
Interpreting a trend line
Compare and contrast linear, quadratic, and exponential regressions.
Unit 3: Extensions of Linear ConceptsActivity 14Piecewise-Defined Linear Functions14-1 Learning Targets
Use function notation and interpret statements that use function notation in terms of a context.
Calculate the rate of change of a linear function presented in multiple representation.
14-2 Learning Targets Write linear equations in two variables
given a table of values, a graph, or a verbal description.
Determine the domain and range of a linear function, determine their reasonableness, and represent them using inequalities.
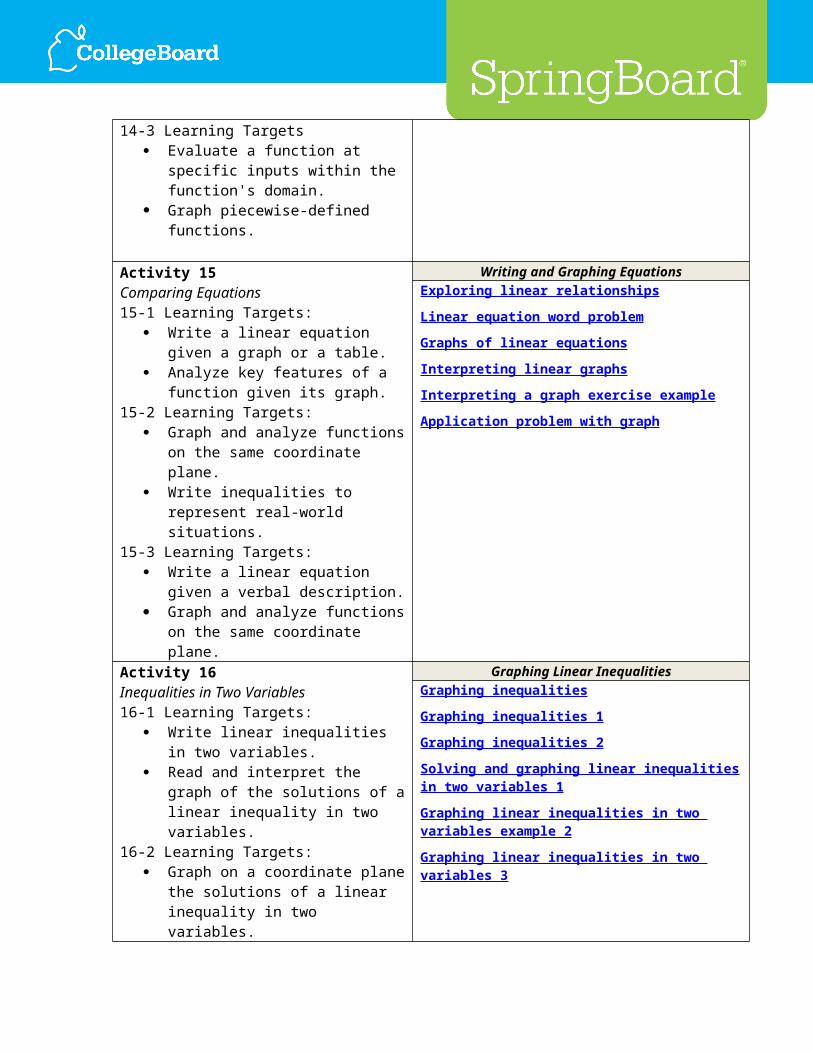
14-3 Learning Targets Evaluate a function at specific inputs
within the function's domain. Graph piecewise-defined functions.
N/A
Activity 15Comparing Equations15-1 Learning Targets:
Write a linear equation given a graph or a table.
Analyze key features of a function given its graph.
15-2 Learning Targets: Graph and analyze functions on the
same coordinate plane. Write inequalities to represent real-
world situations.15-3 Learning Targets:
Write a linear equation given a verbal description.
Graph and analyze functions on the same coordinate plane.
Writing and Graphing EquationsExploring linear relationships
Linear equation word problem
Graphs of linear equations
Interpreting linear graphs
Interpreting a graph exercise example
Application problem with graph
Activity 16Inequalities in Two Variables16-1 Learning Targets:
Write linear inequalities in two
Graphing Linear InequalitiesGraphing inequalities
Graphing inequalities 1
variables. Read and interpret the graph of the
solutions of a linear inequality in two variables.
16-2 Learning Targets: Graph on a coordinate plane the
solutions of a linear inequality in two variables.
Interpret the graph of the solutions of a linear inequality in two variables.
Graphing inequalities 2
Solving and graphing linear inequalities in two variables 1
Graphing linear inequalities in two variables example 2
Graphing linear inequalities in two variables 3
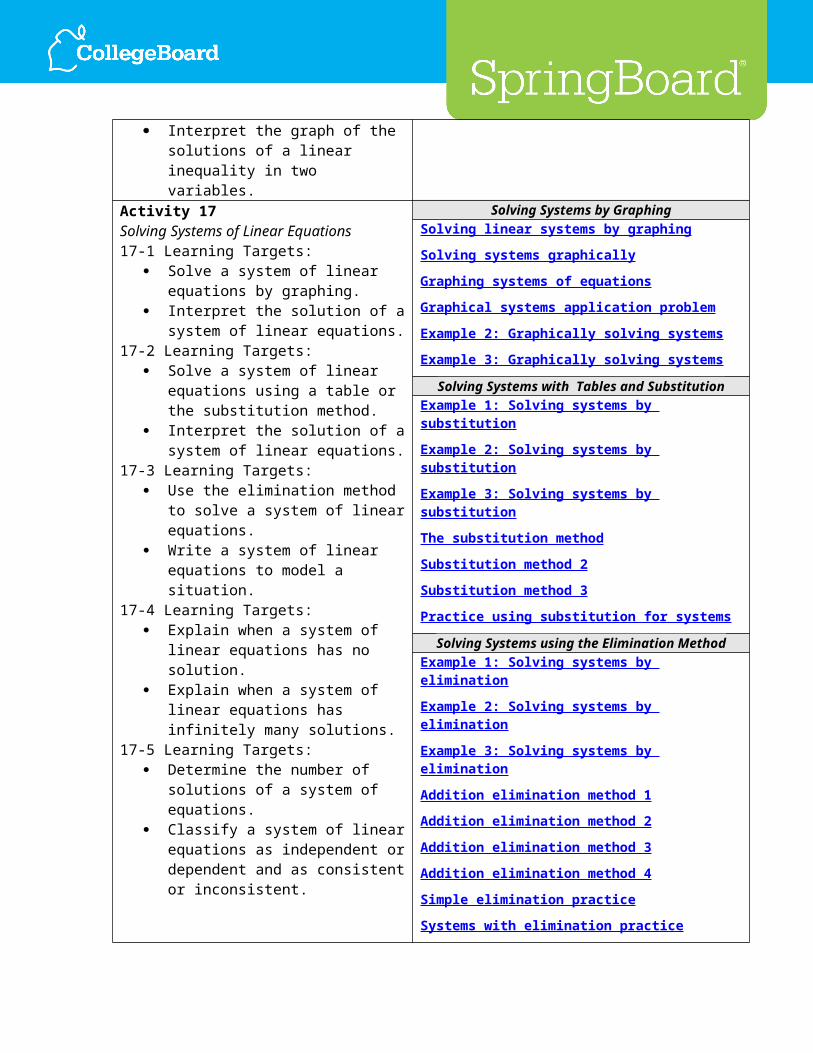
Activity 17Solving Systems of Linear Equations17-1 Learning Targets:
Solve a system of linear equations by graphing.
Interpret the solution of a system of linear equations.
17-2 Learning Targets: Solve a system of linear equations using
a table or the substitution method. Interpret the solution of a system of
linear equations.17-3 Learning Targets:
Use the elimination method to solve a system of linear equations.
Write a system of linear equations to model a situation.
17-4 Learning Targets: Explain when a system of linear
equations has no solution. Explain when a system of linear
equations has infinitely many solutions.17-5 Learning Targets:
Determine the number of solutions of a system of equations.
Classify a system of linear equations as independent or dependent and as consistent or inconsistent.
Solving Systems by GraphingSolving linear systems by graphing
Solving systems graphically
Graphing systems of equations
Graphical systems application problem
Example 2: Graphically solving systems
Example 3: Graphically solving systems
Solving Systems with Tables and Substitution Example 1: Solving systems by substitution
Example 2: Solving systems by substitution
Example 3: Solving systems by substitution
The substitution method
Substitution method 2
Substitution method 3
Practice using substitution for systems
Solving Systems using the Elimination Method Example 1: Solving systems by elimination
Example 2: Solving systems by elimination
Example 3: Solving systems by elimination
Addition elimination method 1
Addition elimination method 2
Addition elimination method 3
Addition elimination method 4
Simple elimination practice
Systems with elimination practice
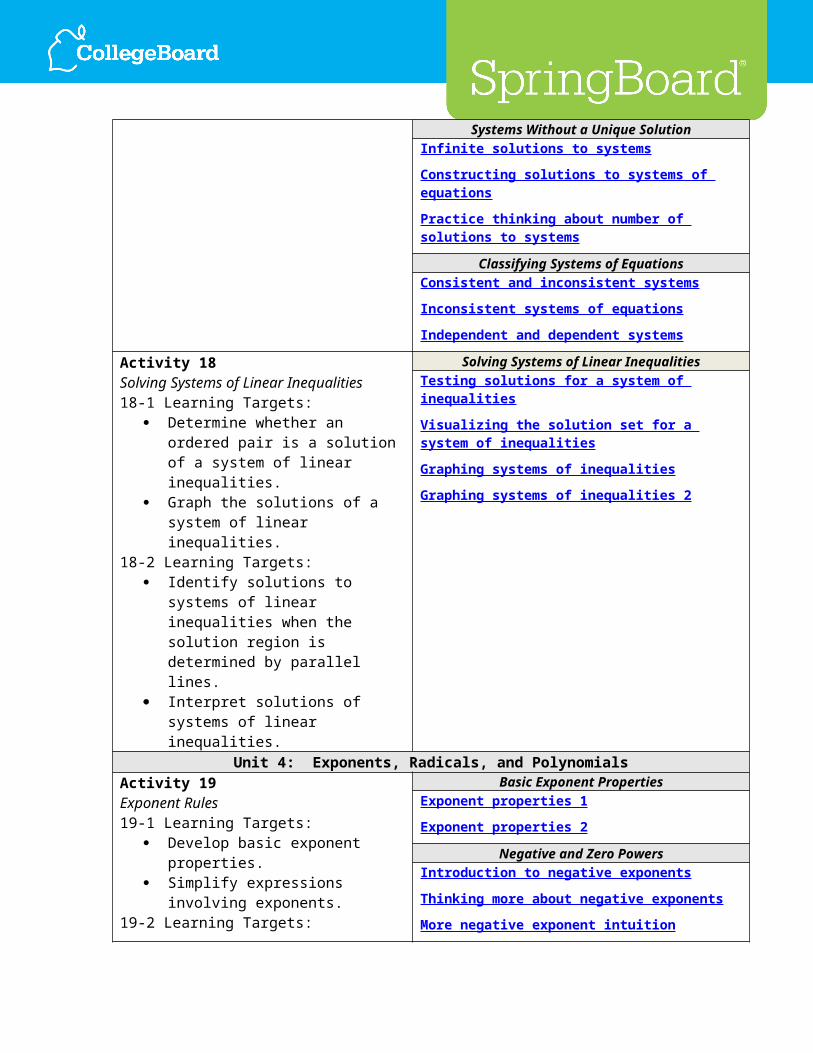
Systems Without a Unique Solution Infinite solutions to systems
Constructing solutions to systems of equations
Practice thinking about number of solutions to systems
Classifying Systems of Equations Consistent and inconsistent systems
Inconsistent systems of equations
Independent and dependent systems
Activity 18Solving Systems of Linear Inequalities18-1 Learning Targets:
Determine whether an ordered pair is a solution of a system of linear inequalities.
Graph the solutions of a system of linear inequalities.
18-2 Learning Targets: Identify solutions to systems of linear
inequalities when the solution region is determined by parallel lines.
Interpret solutions of systems of linear inequalities.
Solving Systems of Linear InequalitiesTesting solutions for a system of inequalities
Visualizing the solution set for a system of inequalities
Graphing systems of inequalities
Graphing systems of inequalities 2
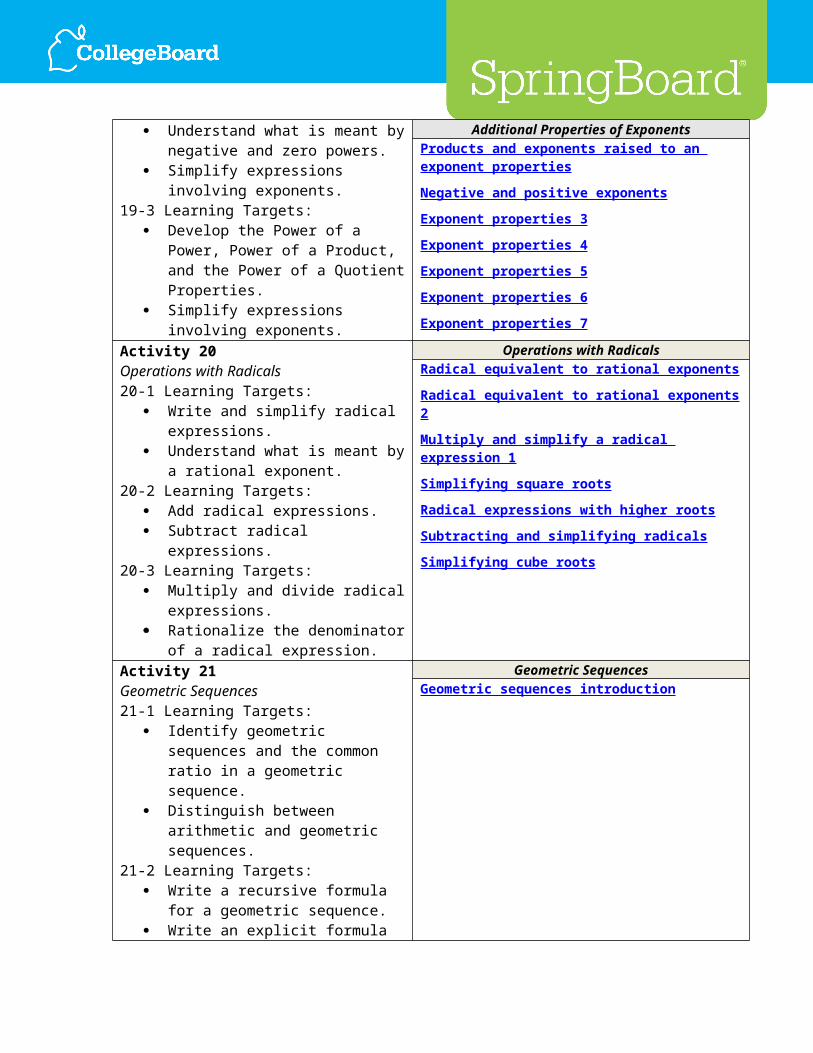
Unit 4: Exponents, Radicals, and PolynomialsActivity 19Exponent Rules19-1 Learning Targets:
Develop basic exponent properties. Simplify expressions involving
exponents.19-2 Learning Targets:
Understand what is meant by negative and zero powers.
Simplify expressions involving exponents.
19-3 Learning Targets: Develop the Power of a Power, Power
of a Product, and the Power of a Quotient Properties.
Simplify expressions involving exponents.
Basic Exponent Properties Exponent properties 1
Exponent properties 2
Negative and Zero Powers Introduction to negative exponents
Thinking more about negative exponents
More negative exponent intuition
Additional Properties of Exponents Products and exponents raised to an exponent properties
Negative and positive exponents
Exponent properties 3
Exponent properties 4
Exponent properties 5
Exponent properties 6
Exponent properties 7
Activity 20Operations with Radicals20-1 Learning Targets:
Write and simplify radical expressions. Understand what is meant by a rational
exponent.
Operations with RadicalsRadical equivalent to rational exponents
Radical equivalent to rational exponents 2
Multiply and simplify a radical expression 1
20-2 Learning Targets: Add radical expressions. Subtract radical expressions.
20-3 Learning Targets: Multiply and divide radical expressions. Rationalize the denominator of a
radical expression.
Simplifying square roots
Radical expressions with higher roots
Subtracting and simplifying radicals
Simplifying cube roots
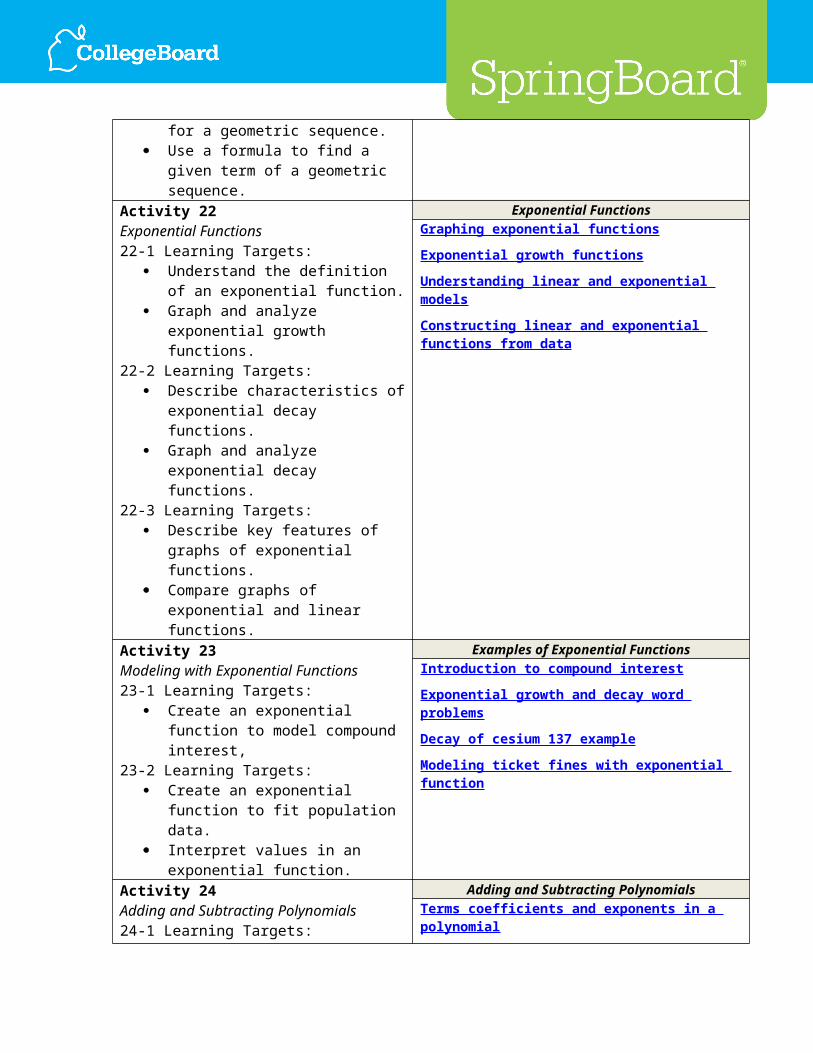
Activity 21Geometric Sequences21-1 Learning Targets:
Identify geometric sequences and the common ratio in a geometric sequence.
Distinguish between arithmetic and geometric sequences.
21-2 Learning Targets: Write a recursive formula for a
geometric sequence. Write an explicit formula for a
geometric sequence. Use a formula to find a given term of a
geometric sequence.
Geometric SequencesGeometric sequences introduction
Activity 22Exponential Functions22-1 Learning Targets:
Understand the definition of an exponential function.
Graph and analyze exponential growth functions.
22-2 Learning Targets: Describe characteristics of exponential
decay functions. Graph and analyze exponential decay
functions.22-3 Learning Targets:
Describe key features of graphs of exponential functions.
Compare graphs of exponential and linear functions.
Exponential FunctionsGraphing exponential functions
Exponential growth functions
Understanding linear and exponential models
Constructing linear and exponential functions from data
Activity 23Modeling with Exponential Functions23-1 Learning Targets:
Create an exponential function to model compound interest,
23-2 Learning Targets: Create an exponential function to fit
population data.
Examples of Exponential FunctionsIntroduction to compound interest
Exponential growth and decay word problems
Decay of cesium 137 example
Modeling ticket fines with exponential function
Interpret values in an exponential function.
Activity 24Adding and Subtracting Polynomials24-1 Learning Targets:
Identify parts of a polynomial. Identify the degree of a polynomial.
24-2 Learning Targets: Use algebra tiles to add polynomials. Add polynomials algebraically.
24-3 Learning Targets: Subtract polynomials algebraically.
Adding and Subtracting PolynomialsTerms coefficients and exponents in a polynomial
Adding polynomials
Polynomials 2
Example: Adding polynomials with multiple variables
Subtracting polynomials
Subtracting polynomials with multiple variables
Addition and subtraction of polynomials
Adding and subtracting polynomials 1
Adding and subtracting polynomials 2
Adding and subtracting polynomials 3
Activity 25Multiplying Polynomials25-1 Learning Targets:
Use a graphic organizer to multiply expressions.
Use the Distributive Property to multiply expressions.
25-2 Learning Targets: Multiply binomials. Find special products of binomials.
25-3 Learning Targets: Use a graphic organizer to multiply
polynomials. Use the Distributive Property to
multiply polynomials.
Multiplying PolynomialsMultiplying binomials and polynomials
Multiplying binomials word problems
FOIL for multiplying binomials
FOIL method for multiplying binomials example 2
Special Products of BinomialsSquare a binomial
Squaring a binomial
Squaring a binomial example 2
Special products of binomials
Multiplying binomials to get difference of squares
Activity 26Factoring26-1 Learning Targets:
Identify the GCF of the terms in a polynomial.
Factor the GCF from a polynomial.26-2 Learning Targets:
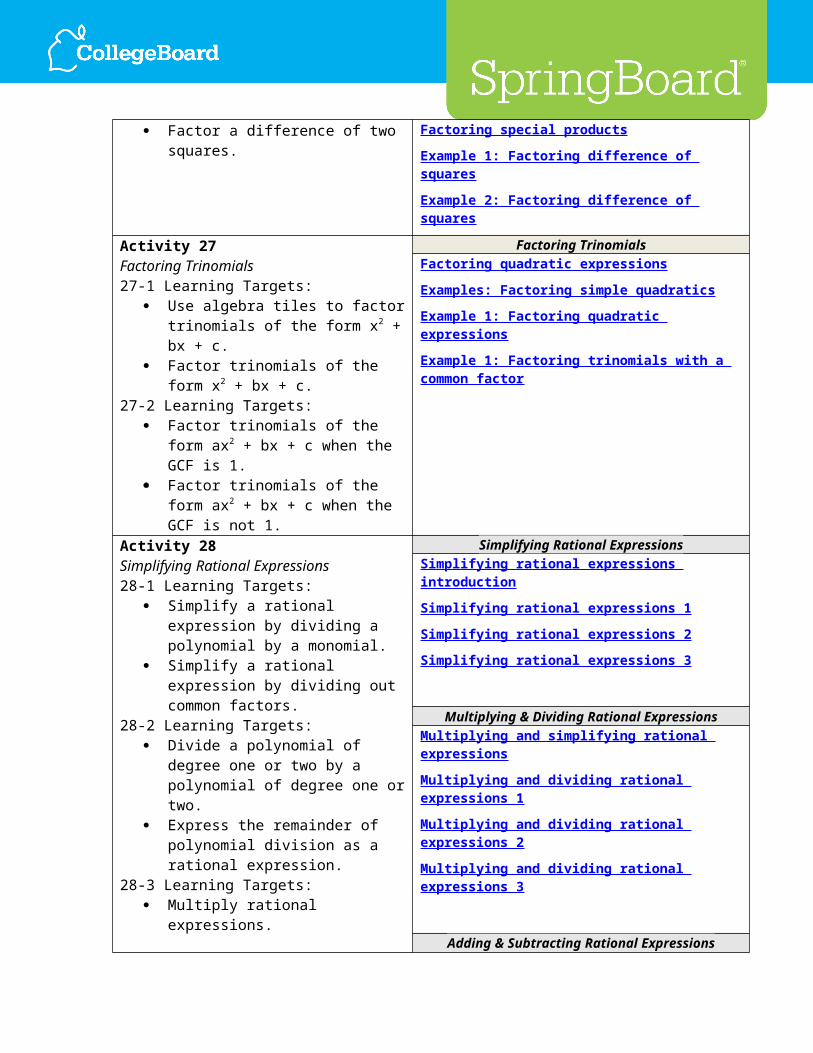
Factor a perfect square trinomial. Factor a difference of two squares.
Factoring by Greatest Common Factor Factor expressions using the GCF
Factoring linear binomials
Factoring and the distributive property
Factoring and the distributive property 2
Factoring Special Products Example: Factoring perfect square trinomials
Factoring special products
Example 1: Factoring difference of squares
Example 2: Factoring difference of squares
Activity 27Factoring Trinomials
Factoring TrinomialsFactoring quadratic expressions
27-1 Learning Targets: Use algebra tiles to factor trinomials of
the form x2 + bx + c. Factor trinomials of the form x2 + bx + c.
27-2 Learning Targets: Factor trinomials of the form ax2 + bx +
c when the GCF is 1. Factor trinomials of the form ax2 + bx +
c when the GCF is not 1.
Examples: Factoring simple quadratics
Example 1: Factoring quadratic expressions
Example 1: Factoring trinomials with a common factor
Activity 28Simplifying Rational Expressions28-1 Learning Targets:
Simplify a rational expression by dividing a polynomial by a monomial.
Simplify a rational expression by dividing out common factors.
28-2 Learning Targets: Divide a polynomial of degree one or
two by a polynomial of degree one or two.
Express the remainder of polynomial division as a rational expression.
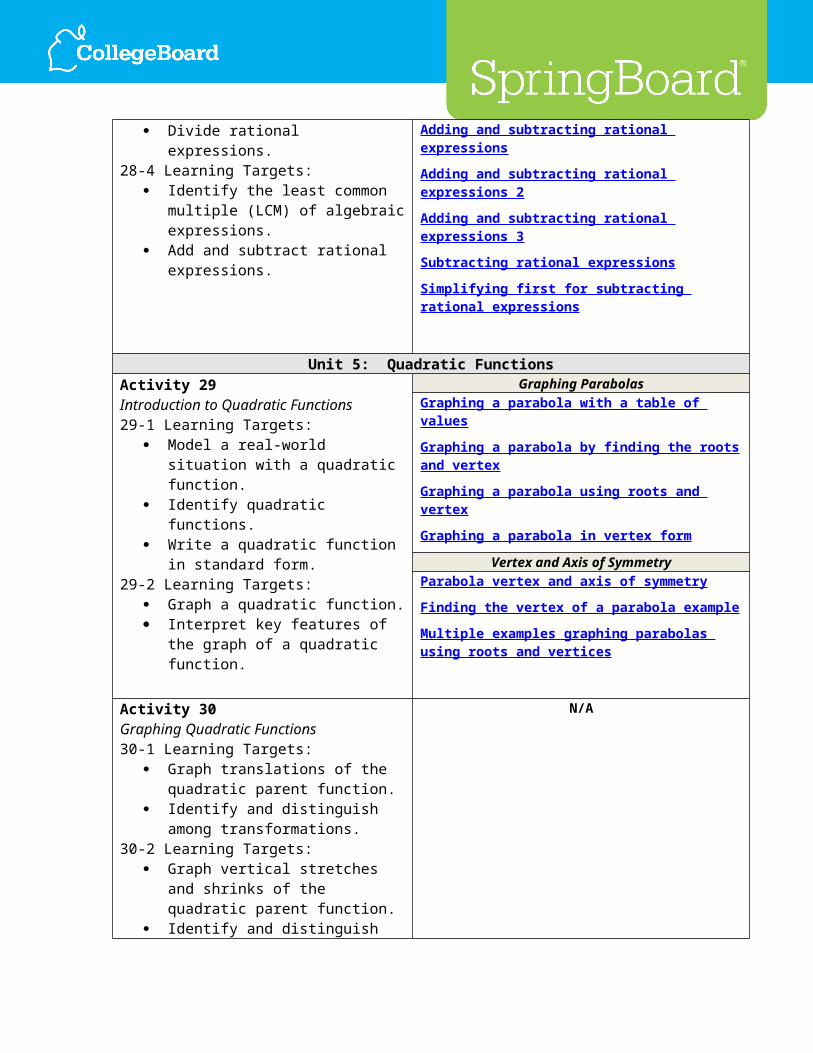
28-3 Learning Targets: Multiply rational expressions. Divide rational expressions.
28-4 Learning Targets: Identify the least common multiple
(LCM) of algebraic expressions. Add and subtract rational expressions.
Simplifying Rational Expressions Simplifying rational expressions introduction
Simplifying rational expressions 1
Simplifying rational expressions 2
Simplifying rational expressions 3
Multiplying & Dividing Rational Expressions Multiplying and simplifying rational expressions
Multiplying and dividing rational expressions 1
Multiplying and dividing rational expressions 2
Multiplying and dividing rational expressions 3
Adding & Subtracting Rational Expressions Adding and subtracting rational expressions
Adding and subtracting rational expressions 2
Adding and subtracting rational expressions 3
Subtracting rational expressions
Simplifying first for subtracting rational expressions
Unit 5: Quadratic FunctionsActivity 29Introduction to Quadratic Functions29-1 Learning Targets:
Model a real-world situation with a quadratic function.
Identify quadratic functions. Write a quadratic function in standard
form.29-2 Learning Targets:
Graph a quadratic function. Interpret key features of the graph of a
quadratic function.
Graphing ParabolasGraphing a parabola with a table of values
Graphing a parabola by finding the roots and vertex
Graphing a parabola using roots and vertex
Graphing a parabola in vertex form
Vertex and Axis of SymmetryParabola vertex and axis of symmetry
Finding the vertex of a parabola example
Multiple examples graphing parabolas using roots and vertices
Activity 30Graphing Quadratic Functions30-1 Learning Targets:
Graph translations of the quadratic parent function.
Identify and distinguish among transformations.
30-2 Learning Targets: Graph vertical stretches and shrinks of
the quadratic parent function. Identify and distinguish among
transformations.30-3 Learning Targets:
Graph reflections of the quadratic parent function.
Identify and distinguish among transformations.
Compare functions represented in different ways.
N/A
Activity 31Solving Quadratic Equations by Graphing and Factoring31-1 Learning Targets:
Use a graph to solve a quadratic equation.
Use factoring to solve a quadratic equation.
Describe the connection between the zeros of a quadratic function and the x-intercepts of the function's graph.
31-2 Learning Targets: Identify the axis of symmetry of the
graph of a quadratic function. Identify the vertex of the graph of a
quadratic function.31-3 Learning Targets:
Use the axis of symmetry, the vertex, and the zeros to graph a quadratic function.
Interpret the graph of a quadratic function.
Solving Quadratic Equations
Vertex and Axis of SymmetryParabola vertex and axis of symmetry
Finding the vertex of a parabola example
Multiple examples graphing parabolas using roots and vertices
Activity 32Algebraic Methods of Solving Quadratic Equations
The Square Root Method Solving quadratic equations by square roots
Example: Solving simple quadratic
32-1 Learning Targets: Solve quadratic equations by the
square root method. Provide examples of quadratic
equations having a given number of real solutions.
32-2 Learning Targets: Solve quadratic equations by
completing the square. Complete the square to analyze a
quadratic function.32-3 Learning Targets:
Derive the quadratic formula. Solve quadratic equations using the
quadratic formula.32-4 Learning Targets:
Choose a method to solve a quadratic equation.
Use the discriminant to determine the number of real solutions of a quadratic equation.
32-5 Learning Targets: Use the imaginary unit i to write
complex numbers. Solve a quadratic equation that has
complex solutions.
Completing the Square Solving quadratic equations by completing the square
Example 1: Completing the square
Example 2: Completing the square
Example 3: Completing the square
The Quadratic Formula How to use the quadratic formula
Example: Quadratics in standard form
Example 1: Using the quadratic formula
Example 2: Using the quadratic formula
Example 3: Using the quadratic formula
Example 4: Applying the quadratic formula
Example 5: Using the quadratic formula
Choosing a Method and Using the Discriminant Discriminant of quadratic equations
Discriminant for types of solutions for a quadratic
Complex Solutions Example: Complex roots for a quadratic
Activity 33Applying Quadratic Equations33-1 Learning Targets:
Write a quadratic function to fit data. Use a quadratic model to solve
problems.33-2 Learning Targets:
Solve quadratic equations. Interpret the solutions of a quadratic
equation in a real-world context.
Fitting Data with Quadratic and Exponential Functions
Comparing models to fit data
Comparing exponential and quadratic models
Activity 34Modeling with Functions34-1 Learning Targets:
Construct linear, quadratic, and exponential models for data.
Graph and interpret linear, quadratic, and exponential functions.
34-2 Learning Targets: Identify characteristics of linear,
Modeling with FunctionsComparing exponential and quadratic models
Constructing linear and exponential functions from data
Constructing linear and exponential functions from graph
quadratic, and exponential functions. Compare linear, quadratic, and
exponential functions.34-3 Learning Targets:
Compare piecewise-defined, linear, quadratic, and exponential functions.
Write a verbal description that matches a given graph.
Activity 35Systems of Equations35-1 Learning Targets:
Write a function to model a real-world situation.
Solve a system of equations by graphing.
35-2 Learning Targets: Write a system of equations to model a
real-world situation. Solve a system of equations
algebraically.
Solving Systems of Nonlinear EquationsSystems of nonlinear equations 1
Systems of nonlinear equations 2
Systems of nonlinear equations 3
Non-linear systems of equations 1
Non-linear systems of equations 2
Non-linear systems of equations 3
Unit 6: Probability and StatisticsActivity 36Measures of Center and Spread36-1 Learning Targets:
Interpret differences in center and spread of data in context.
Compare center and spread of two or more data sets.
Determine the mean absolute deviation of a set of data.
36-2 Learning Targets: Interpret differences in center and
spread of data in context. Compare center and spread of two or
more data sets. Determine the mean absolute deviation
of a set of data.
Mean, Median, ModeStatistics intro: Mean, median and mode
Finding mean, median and mode
Exploring the mean and median
DistributionComparing means of distributions
Means and medians of different distributions
Variance of a population
Activity 37Dot and Box Plots and the Normal Distribution37-1 Learning Targets:
Construct representations of univariate data in a real-world context.
Describe characteristics of a data distribution, such as center, shape, and spread, using graphs and numerical summaries.
Box and WhiskerBox and whisker plot
Constructing a box and whisker plot
RangeFinding the range and mid-range
Introduction to the normal distribution
Compare distributions, commenting on similarities and differences among them.
37-2 Learning Targets: Use modified box plots to summarize
data in a way that shows outliers. Compare distributions, commenting on
similarities and differences among them.
Activity 38Correlation38-1 Learning Targets:
Describe a linear relationship between two numerical variables in terms of direction and strength.
Use the correlation coefficient to describe the strength and direction of a linear relationship between two numerical variables.
38-2 Learning Targets: Calculate correlation. Distinguish between correlation and
causation.
CorrelationConstructing a scatter plot
Correlation and causality
Activity 39The Best-Fit Line39-1 Learning Targets:
Describe the linear relationship between two numerical variables using the best-fit line.
Use the equation of the best-fit line to make predictions and compare the predictions to actual values.
39-2 Learning Targets: Use technology to determine the
equation of the best-fit line. Describe the linear relationship
between two numerical variables using the best-fit line.
Use residuals to investigate whether a given line is an appropriate model of the relationship between numerical variables.
39-3 Learning Targets: Interpret the slope of the best-fit line in
the context of the data. Distinguish between scatter plots that
Line of Best-fit Fitting a line to data
Estimating the line of best fit exercise
Comparing models to fit data
Interpreting a trend line
show a linear relationship and those where the relationship is not linear.
39-4 Learning Targets: Create a residual plot given a set of
data and the equation of the best-fit line.
Use residuals to investigate whether a line is an appropriate description of the relationship between numerical variables.
Activity 40Bivariate Data40-1 Learning Targets:
Summarize bivariate categorical data in a two-way frequency table.
Interpret frequencies and relative frequencies in two-way tables.
40-2 Learning Targets: Interpret frequencies and relative
frequencies in two-way tables. Recognize and describe patterns of
association in two-way tables.
Two-way Frequency TablesTwo-way frequency tables and Venn diagrams
Two-way relative frequency tables
Interpreting two way tables
Categorical DateAnalyzing trends in categorical data