view - international food policy research institute
TRANSCRIPT
IFPRI Discussion Paper 01275
July 2013
Comprehensive Food Security and Vulnerability Analysis
Nigeria
Oluyemisi Kuku-Shittu
Astrid Mathiassen
Amit Wadhwa
Lucy Myles
Akeem Ajibola
Development Strategy and Governance Division

INTERNATIONAL FOOD POLICY RESEARCH INSTITUTE
The International Food Policy Research Institute (IFPRI), established in 1975, provides evidence-based policy solutions to sustainably end hunger and malnutrition and reduce poverty. The Institute conducts research, communicates results, optimizes partnerships, and builds capacity to ensure sustainable food production, promote healthy food systems, improve markets and trade, transform agriculture, build resilience, and strengthen institutions and governance. Gender is considered in all of the Institute’s work. IFPRI collaborates with partners around the world, including development implementers, public institutions, the private sector, and farmers’ organizations, to ensure that local, national, regional, and global food policies are based on evidence. IFPRI is a member of the CGIAR Consortium.
AUTHORS Oluyemisi Kuku-Shittu, International Food Policy Research Institute Postdoctoral Fellow, Development Strategy and Governance Division [email protected] Astrid Mathiassen, World Food Programme Senior Food Security Analyst [email protected] Amit Wadhwa, World Food Programme Food Security Analyst [email protected] Lucy Myles, The Congressional Hunger Center Mickey Leland International Hunger Fellows Program [email protected] Akeem Ajibola, International Food Policy Research Institute Senior Research Assistant, Development Strategy and Governance Division [email protected]
Notices 1. IFPRI Discussion Papers contain preliminary material and research results. They have been peer reviewed, but have not been subject to a formal external review via IFPRI’s Publications Review Committee. They are circulated in order to stimulate discussion and critical comment; any opinions expressed are those of the author(s) and do not necessarily reflect the policies or opinions of IFPRI. 2. The boundaries and names shown and the designations used on the map(s) herein do not imply official endorsement or acceptance by the International Food Policy Research Institute (IFPRI) or its partners and contributors.
Copyright 2013 International Food Policy Research Institute/World Food Programme. All rights reserved. Sections of this material may be reproduced for personal and not-for-profit use without the express written permission of but with acknowledgment to IFPRI. To reproduce the material contained herein for profit or commercial use requires express written permission. To obtain permission, contact the IFPRI Communications Division at [email protected].
iii
Contents
Abstract v
Acknowledgment vi
1. Introduction 1
2. Methodology 6
3. Demographics 10
4. Vulnerability 17
5. Food Consumption 24
6. Shocks and Coping Strategies 30
7. Conclusions and Recommendations 32
References 33
iv
Tables
2.1—Wealth indicators used in composite index 7 2.2—Livelihood group definitions 8 2.3—Food consumption score thresholds 9 3.1—Mean household size and percentage of female-headed households by wealth quintile,
livelihood group, and geographical zone 11 3.2—Education and literacy of household head and spouse (percentage) 13 3.3—Young-child-feeding practices and vitamin A supplementation 15 4.1—Livelihood groups by wealth quintile (percent) 18 5.1—Mean number of days food items were consumed by households per week 25 5.2—Intrahousehold food allocations by wealth and geographic area 29
Figures
1.1—Map of Nigeria showing the six major geopolitical zones 2 2.1—Percentage of households with unimproved amenities 7 2.2—Distribution of households in each livelihood group 9 3.1—Age distribution of household members 10 3.2—Mean dependency rate by wealth quintile 11 3.3—Use of unimproved water and sanitation facilities by geographic region 16 4.1—Prevalence of wealth quintiles within geographic regions 17 4.2—Wealthiest livelihood groups (those with the highest proportion of households in the two
wealthiest quintiles) by sector 19 4.3—Poorest livelihood groups (those with the highest proportion of households in the two poorest
wealth quintiles) by sector 19 4.4—Food sources by geographic area 20 4.5a—Food sources by wealth quintile, urban areas 21 4.5b—Food sources by wealth quintile, rural areas 21 4.6—Food sources by livelihood group 22 4.7—Percentage of households with high food expenditure (> 75% of total household resources) by
wealth quintile 23 4.8—Percentage of households with high food expenditure (>75% of total household resources) by
livelihood group 23 5.1a—Frequency of food items consumed by wealth quintile—starches 26 5.1b—Frequency of food items consumed by wealth quintile—protein 26 5.1c—Frequency of food items consumed by wealth quintile—fruit and vegetables 27 5.2—Diet category by wealth quintile 28 6.1—Most common causes of food shortages (percentage of households) 30 6.2—Percentage of households that used coping strategies by wealth quintile 31
v
ABSTRACT
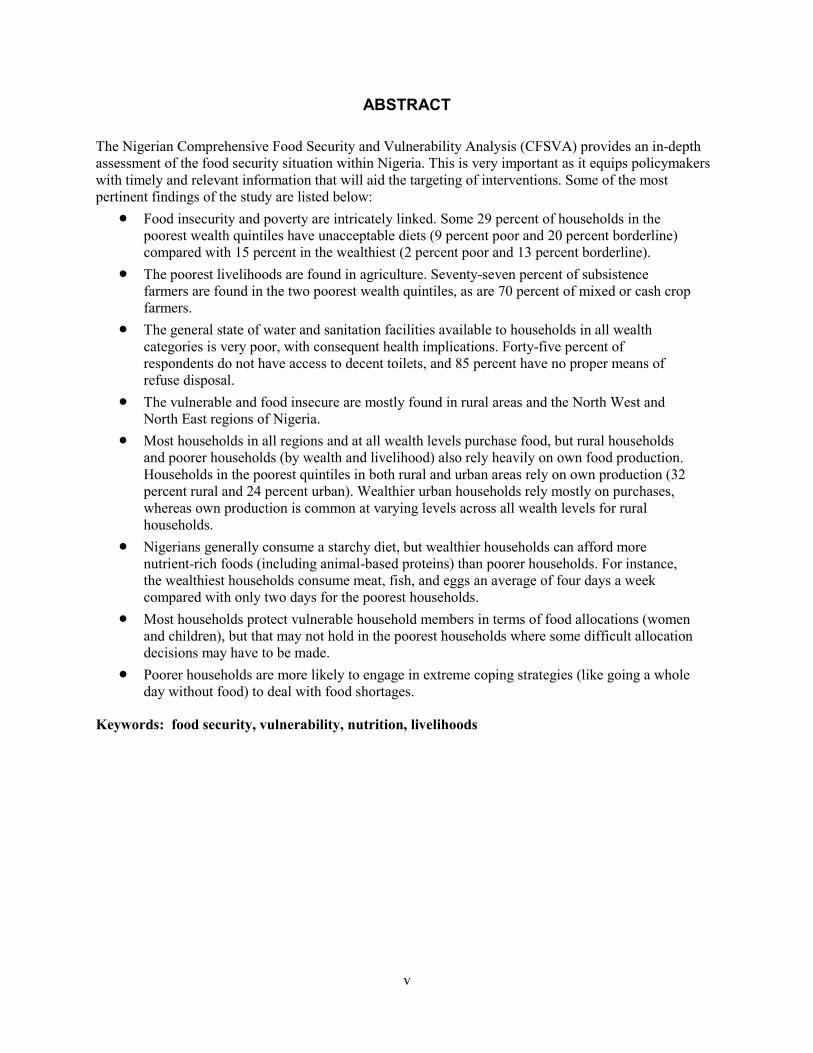
The Nigerian Comprehensive Food Security and Vulnerability Analysis (CFSVA) provides an in-depth assessment of the food security situation within Nigeria. This is very important as it equips policymakers with timely and relevant information that will aid the targeting of interventions. Some of the most pertinent findings of the study are listed below:
• Food insecurity and poverty are intricately linked. Some 29 percent of households in the poorest wealth quintiles have unacceptable diets (9 percent poor and 20 percent borderline) compared with 15 percent in the wealthiest (2 percent poor and 13 percent borderline).
• The poorest livelihoods are found in agriculture. Seventy-seven percent of subsistence farmers are found in the two poorest wealth quintiles, as are 70 percent of mixed or cash crop farmers.
• The general state of water and sanitation facilities available to households in all wealth categories is very poor, with consequent health implications. Forty-five percent of respondents do not have access to decent toilets, and 85 percent have no proper means of refuse disposal.
• The vulnerable and food insecure are mostly found in rural areas and the North West and North East regions of Nigeria.
• Most households in all regions and at all wealth levels purchase food, but rural households and poorer households (by wealth and livelihood) also rely heavily on own food production. Households in the poorest quintiles in both rural and urban areas rely on own production (32 percent rural and 24 percent urban). Wealthier urban households rely mostly on purchases, whereas own production is common at varying levels across all wealth levels for rural households.
• Nigerians generally consume a starchy diet, but wealthier households can afford more nutrient-rich foods (including animal-based proteins) than poorer households. For instance, the wealthiest households consume meat, fish, and eggs an average of four days a week compared with only two days for the poorest households.
• Most households protect vulnerable household members in terms of food allocations (women and children), but that may not hold in the poorest households where some difficult allocation decisions may have to be made.
• Poorer households are more likely to engage in extreme coping strategies (like going a whole day without food) to deal with food shortages.
Keywords: food security, vulnerability, nutrition, livelihoods
vi
ACKNOWLEDGMENTS
This publication was prepared by the Nigeria Strategy Support Program of the International Food Policy Research Institute (IFPRI) and the World Food Programme, which receives funding from the US Agency for International Development through the Feed the Future initiative and the Bill & Melinda Gates Foundation. It has not been peer reviewed. Any opinions stated herein are those of the authors and do not necessarily reflect the policies of IFPRI or the World Food Programme.
We are grateful to Tolulope Odetola and Chinonso Etumnu, both of IFPRI, for their excellent research support; and equally grateful to the World Food Programme Food Security Analysis team in Rome, particularly and Katy Williams and Lisa Hjelm for their insightful comments.
Lastly, we would like to express our profound appreciation to the National Bureau of Statistics and the World Bank for making the survey available for the purposes of this report.
1
1. INTRODUCTION
The aim of the Nigeria Comprehensive Food Security and Vulnerability Analysis (CFSVA) is to increase understanding of how food insecurity affects Nigerians so that the root causes of hunger and malnutrition can be better addressed. This assessment relies on national household data to examine the different factors that influence food security and vulnerability in Nigeria. The findings from this analysis will serve as an input into the policymaking process, as well as a resource for the World Food Programme to optimize program delivery and for other development stakeholders working to address hunger and food insecurity in Nigeria.
The primary objectives of the assessment are as follows: 1. Determine the extent of food insecurity and vulnerability in Nigeria. 2. Identify which geographic areas and which groups are more prone to food insecurity
and vulnerability. 3. Gain understanding about the characteristics of the food insecure and vulnerable. 4. Identify the key determinants of food insecurity and vulnerability.
This assessment uses data from the Living Standards Measurement Study–Integrated Surveys on Agriculture (LSMS–ISA), which is a national survey on household welfare conducted by the Nigerian Bureau of Statistics in partnership with the World Bank. The data used in the analysis represent a 5,000-household panel, which was derived from the larger nationally representative General Household Survey of 22,000 households. The panel is not nationally representative because the geographical domain of analysis is Nigeria’s six geopolitical zones, which form the basis for the analysis in this report. The sample of 5,000 represented by the panel was surveyed twice—once in 2010 and once in 2011—to gather detailed longitudinal data on agricultural activities and household consumption. Postplanting (lean season) data were collected in 2010, and postharvest data were collected in 2011. The findings in this report are based on the 2011 postharvest data.
The first section of the report provides background information on the Nigerian context. Section 2 presents the methodologies used for the analysis of data in this report. Demographic data from the LSMS–ISA are described in Section 3, which includes household information in addition to education and health data relevant to food security. Section 4 provides analysis of the key vulnerabilities to food security, and Section 5 presents the key indicators for food consumption. An overview of shocks and coping mechanisms is given in Section 6. The final section provides conclusions and recommendations.
Overview of Nigeria
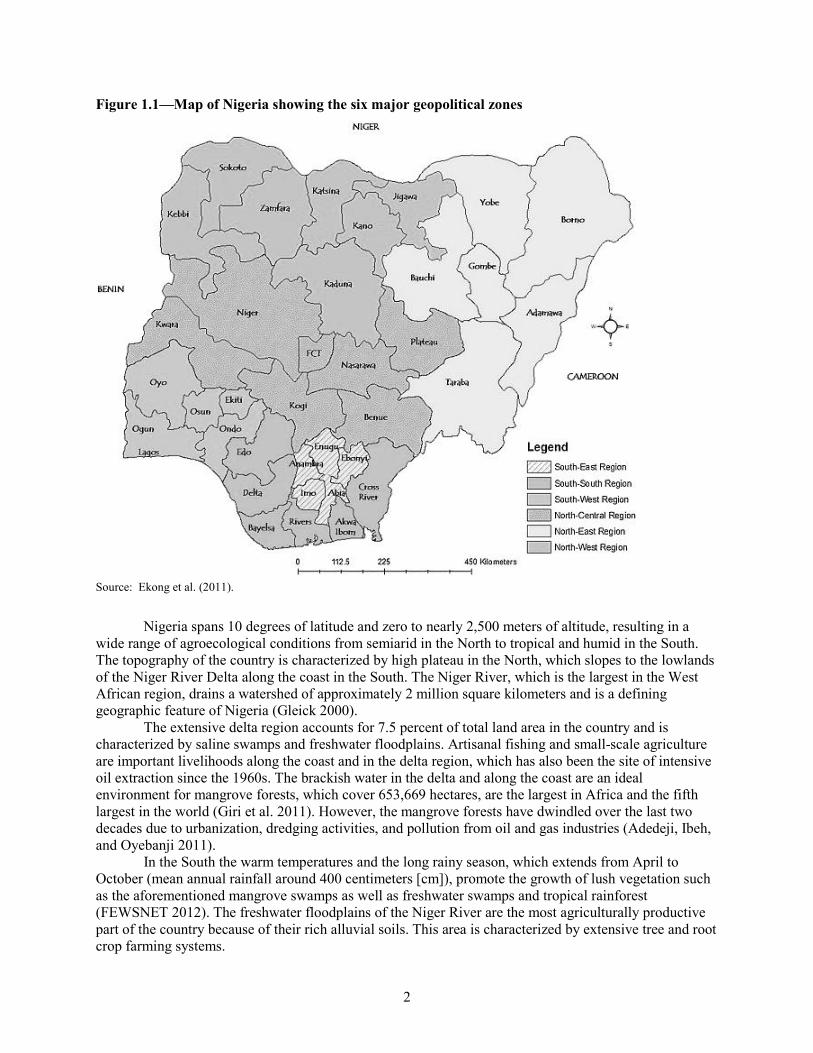
Geography and Environmental Context Bordered by the Niger Republic and the Republic of Chad to the north, the Republic of Cameroon to the east, and the Republic of Benin to the west, Nigeria has approximately 850 kilometers of coastline on the Gulf of Guinea to the south. It is divided into 36 states, plus the Federal Capital Territory of Abuja. The states are grouped into six distinct geopolitical zones—North Central, North East, North West, South East, South South, and South West—which are used as the primary geographic identifiers in this report. The total land area is 923,000 square kilometers.
2
Figure 1.1—Map of Nigeria showing the six major geopolitical zones
Source: Ekong et al. (2011).
Nigeria spans 10 degrees of latitude and zero to nearly 2,500 meters of altitude, resulting in a wide range of agroecological conditions from semiarid in the North to tropical and humid in the South. The topography of the country is characterized by high plateau in the North, which slopes to the lowlands of the Niger River Delta along the coast in the South. The Niger River, which is the largest in the West African region, drains a watershed of approximately 2 million square kilometers and is a defining geographic feature of Nigeria (Gleick 2000).
The extensive delta region accounts for 7.5 percent of total land area in the country and is characterized by saline swamps and freshwater floodplains. Artisanal fishing and small-scale agriculture are important livelihoods along the coast and in the delta region, which has also been the site of intensive oil extraction since the 1960s. The brackish water in the delta and along the coast are an ideal environment for mangrove forests, which cover 653,669 hectares, are the largest in Africa and the fifth largest in the world (Giri et al. 2011). However, the mangrove forests have dwindled over the last two decades due to urbanization, dredging activities, and pollution from oil and gas industries (Adedeji, Ibeh, and Oyebanji 2011).
In the South the warm temperatures and the long rainy season, which extends from April to October (mean annual rainfall around 400 centimeters [cm]), promote the growth of lush vegetation such as the aforementioned mangrove swamps as well as freshwater swamps and tropical rainforest (FEWSNET 2012). The freshwater floodplains of the Niger River are the most agriculturally productive part of the country because of their rich alluvial soils. This area is characterized by extensive tree and root crop farming systems.
3
The subhumid zone, which has a savannah landscape, accounts for approximately half of Nigeria’s land area and includes the middle belt and northern regions, which are significantly more arid with a rainy season of only four to five months from around May to September. Nutrient runoff, resulting from poor water penetration, combined with a shallow water table mean this region has poorer soil quality. Agricultural productivity in this climactic zone is lower than the floodplains in the South (Mohamed-Saleem 1986). The dominant farming systems include grain production and livestock production. The extreme North is prone to drought with an average annual rainfall of only about 60 cm, which exposes the land to encroaching desertification and soil erosion (FEWSNET 2012). This part of the country has traditionally supported pastoralists with migratory patterns.
Nigeria has relatively abundant freshwater resources; however, water is not evenly distributed across the country and access to it can vary by season and between years. Many areas of the country are vulnerable to disaster either from drought, most frequently experienced in the North, or from flooding experienced along the major rivers and in the delta region. Both flooding and drought can be widespread and severely affect food production and thus food availability. Further, climate change threatens the accessibility of safe drinking water, which has a direct impact on health and jeopardizes water-dependent ecosystems that many poor households rely on for their livelihoods (Enete and Ezenwanji 2011).
The range in agroecological conditions across the country makes Nigeria well suited for diversified food production. Nigeria’s Ministry of the Environment (2001) estimates that 35 percent of the total land area is fit for crop production with an additional 15 percent of land area suitable for pasturing livestock. However, a study that examined the pattern of land cover changes between 1975 and 2005 found overall loss of prime arable lands. With encroaching desertification of the Sudan savannah ecology in the North, pastoralism and cereal production are shifting southward into the areas previously dominated by root and tuber production across the middle belt. Demands on agricultural land have led to increased use of virgin forestland with a 51 percent reduction in undisturbed forest area since 1975 (Abbas 2009).
In spite of land use changes over the past three decades, agriculture remains the dominant presence on the Nigerian landscape. Beyond the impact of shifting climatic patterns, rapid population growth has become another defining factor in Nigeria’s changing land use dynamics. Increased population pressure has led to the subdivision of plots. Nationally the average cultivated area is 1 hectare (ha) per household, but in the densely populated South the mean plot size is only 0.5 ha (IFAD 2001).
Sociopolitical Context Nigeria is the most populous country in Africa and the seventh most populous in the world, with an estimated 170 million people in 2012 (CIA 2012). The population is continuing to grow at an annual rate of 2.6 percent as a result of the high fertility rate (5.38 children born per woman) (CIA 2012). The ballooning population has numerous social, environmental, and economic impacts with implications for food security.
Rising population pressure is leading to overcrowding with an estimated population density of 174 people per square kilometer in 2010 (IFAD 2012). The scarcity of land and other resources in rural areas is causing rapid urban migration. Nigeria has one of the highest urban growth rates in the world at 4.1 percent (UNICEF 2010). The explosive rate of urban growth has led to the proliferation of slum settlements and falling living standards in Nigeria’s major cities. Another challenge with the increasingly urbanized population is meeting the growing demand for jobs. It is estimated that there are 1.8 million new entrants to the labor force every five years, and the unemployment rate has steadily increased from 19.7 percent in 2009 to 23.9 percent in 2011 (NBS 2011).
The Nigerian population displays a high degree of ethnic diversity with more than 250 distinct ethnic groups. Among the most prominent groups are the Hausa/Fulani, Yoruba, and Igbo. Although the official language is English, more than 500 indigenous languages and dialects are spoken across the country. The most widely spoken indigenous languages are those of the prominent ethnic groups. Given the ethnic diversity, sectarian violence has broken out periodically between groups with competing

4
interests. The religious divide between the Christian-dominated South and the Muslim-dominated North has been another aggravating factor in civil unrest. The 1967-to-1970 civil war, also known as the Nigerian–Biafran War, was caused by the attempted secession of the South Eastern provinces.
Inadequate infrastructure has far-reaching impacts on the population, especially those in rural areas. These include irregular supply of electricity, inadequate supply of potable water, fuel scarcity, and unreliable healthcare services, among others (Akinwale 2010). Nigeria needs to increase its current investment of 7 percent of annual gross domestic product (GDP) on infrastructure improvements to at least 12 percent to meet demand: this translates to a total investment of US$10 billion over the next 10 years (Sanusi 2012).
Economic Context Nigeria is considered a lower-middle-income country with a national GDP of $235.9 billion, which translates to a national per capita GDP of $1,452 (World Bank 2012). The average GDP growth rate of 6.8 percent over the seven years from 2005 to 2011 was higher than both the global average of 4.9 percent and the African average of 5.5 percent. Between 2008 and 2011 the average annual inflation rate was 12.63 percent.
Agriculture remains the largest contributor to the Nigerian economy, accounting for about 40 percent of the national GDP and providing employment for about 70 percent of the labor force (NBS 2012a, 2012b). Despite the economic importance of the sector, development of the agricultural sector has been neglected as attention and resources have been predominantly focused on the extraction of natural resources. Food production growth rates are estimated to be 3.7 percent, which lags behind the growth rate of food demand at 6.5 percent (Liverpool-Tasie, Kuku, and Ajibola 2011). Low agricultural productivity in Nigeria is due to a wide variety of factors including poor soil quality caused by pollution, erosion, and leaching, the negative impact of climate change on weather patterns, the scarcity and high cost of inputs, rudimentary implements, and outdated farming practices (Liverpool-Tasie, Kuku, and Ajibola 2011). As a result of slow growth in the agricultural sector and rapid increases in population, Nigeria shifted from being self-sufficient in food production in the 1960s to being heavily dependent on food imports in the 1980s (Fasoranti 2006). Dependence on food imports makes Nigeria vulnerable to fluctuating world market prices. The spike in world food prices in 2007 and 2008 caused inflation to rise from 5.4 percent in 2007 to 9.7 percent in 2008, and the share of household income spent on food for the same period increased from 45 to 80 percent (NISER 2008). Poor agricultural output and widespread poverty have resulted in extensive and persistent food insecurity, with some case studies suggesting that as many as 70 percent of Nigerians are food insecure (Obayelu 2010; Orewa and Iyanbe 2009).
Nigeria is well endowed with natural resources and is the largest oil-exporting country in Africa. Oil production has been an important element of the economy since the 1960s. The oil sector currently accounts for only about 14 percent of total GDP but represents nearly all the value of foreign exports (NBS 2012a). Although the oil industry is a major force in the Nigerian economy, the country suffers from the resource curse/Dutch disease or paradox of plenty experienced by natural-resource-rich developing countries. Discovery of oil made non-oil exports more expensive and, therefore, less competitive, and local production has struggled to compete with relatively cheaper imports. In addition, Nigeria has not had the political stability to use the wealth to advance economic growth (Auty 1993). Although oil revenues bring in billions of dollars annually, the wealth is concentrated with an elite few and does not reach the poor. Beyond the inequality resulting from the oil industry, harmful environmental impacts have resulted from oil extraction. The three decades between 1976 and 2006 have seen more than 6,800 spills in the Niger Delta that have caused damage to soil, water, and air quality (Amnesty International 2009). Such events have the greatest negative impact on the poorest segment of the population that relies on traditional livelihoods such as artisanal fishing and subsistence agriculture.
5
Poverty is pervasive across the country with 61 percent of the population estimated to live on less than a dollar a day and 69 percent living below the relative poverty line, which is set slightly higher at 1.22 dollars per day (66,802 naira per year) (NBS 2012c). The proportion of Nigerians living below the relative poverty line has increased significantly from just 27 percent of the population in 1980. With population growth, the absolute number of poor has increased sixfold (NBS 2012c). Poverty is not equally distributed, with the highest proportion of poor in the North East and North West zones. Poverty is also higher in rural areas than urban. The degree of inequity among the population, measured using the Gini coefficient, is also increasing. In 2010 the Gini coefficient was 0.447, which represents an increase of 4.1 percent in the degree of inequity from 2004 (NBS 2012c). The Gini coefficient in Nigeria is close to the Africa south of the Sahra regional average of 0.46, although there are differences within countries: Cote d’Ivoire’s Gini coefficient in 2008/2009 was 0.529, whereas Sierra Leone’s was 0.32 (UN-HABITAT 2009).
6
2. METHODOLOGY
This report mainly identifies current trends in different measures of food insecurity and vulnerability. This section provides definitions of concepts and details of methodologies used in developing indexes that are used in this report.
Food Security Context The Food and Agriculture Organization of the United Nations defines food security as “a situation that exists when all people, at all times, have physical, social and economic access to sufficient, safe and nutritious food that meets their dietary needs and food preferences for an active and healthy life” (FAO 2002). This definition implies that food insecurity reflects uncertain access to enough and appropriate foods (Barrett 2002). Food security is widely recognized to encompass three major concepts: availability, access, and utilization.
Availability in the macro sense refers to the efforts by governments to ensure that sufficient quantities of food are available for the populace; access refers to the ability of households to obtain food in the marketplace or from other sources. The major constraints facing the agricultural sector and food price fluctuations because of overexposure to world markets may reduce food access for the poorest Nigerians. This report aims to identify trends in the different dimensions of food access. Indicators to explain those dimensions include a wealth index, identification of different livelihood groups, an index of income diversification, share of household resources devoted to food, as well as shocks and coping strategies. A thorough understanding of trends in these different concepts will provide some indication of the exposure of many lower-income Nigerians to food and economic shocks, and this has a direct impact on their ability to lay legitimate claims to food resources.
In addition, the report examines food security concepts that provide some idea of the quality of food that different categories of Nigerian households have access to. Indexes such as food consumption scores and dietary diversity cover these dimensions, so that there is information not just on how much food Nigerians, particularly lower-income Nigerians, can purchase but also on the diversity of the food groups they consume.
Utilization, which refers to the proper usage of food and includes processing, storage, consumption, and digestion, is often measured via anthropometric variables. Due to data constraints in the LSMS–ISA, this report will not focus directly on utilization indicators. It will, however, include analysis of underlying causes such as access to safe drinking water, sanitation, and health.
Wealth Index The wealth index is a composite index that attempts to measure wealth without relying on income and expenditure data. The index is created by using a form of data reduction analysis called principal component analysis. A number of variables are used collectively to describe the wealth of a household. In Nigeria, 16 variables were used to construct the wealth index (Table 2.1).

7
Table 2.1—Wealth indicators used in composite index Assets Household amenities
• TV • Mobile phone • Iron, sewing machine • Refrigerator, stove • Electricity generator • Car • Sofa, chairs, table
• Improved walls/roof/floora • Improved drinking water • Improved sanitation • Electricity • Cooking fuel
Source: Derived by authors from LSMS-ISA data. Notes: a Improved household amenities refer to amenities that members of the household can use without being harmed or their
health being adversely affected. For instance, improved water sources would include treated water, wells, and protected springs, whereas unimproved water would include open bodies of water that are already contaminated or have a high risk of contamination.
After creating the index, the households are ranked and placed in quintiles to describe wealth groups within the population, ranging from quintile 1, the poorest, to quintile 5, the wealthiest.
Figure 2.1 provides the distribution of household amenities included in the wealth index. It reveals that very few households have access to proper refuse disposal or cooking fuel, and more than 40 percent of the sample do not have access to decent toilets. Although amenities will be discussed in more detail in the relevant section of the report, the health implications of the findings make them noteworthy even at this point.
Figure 2.1—Percentage of households with unimproved amenities
Source: Computed by authors from LSMS-ISA data.
8
19
29
32
36
42
44
48
69
85
0 20 40 60 80 100
Lighting
Roof
Floor
Cell phone
Drinking water
Toilet
Electricity
Outer wall
Cooking fuel
Refuse disposal
Percent
8
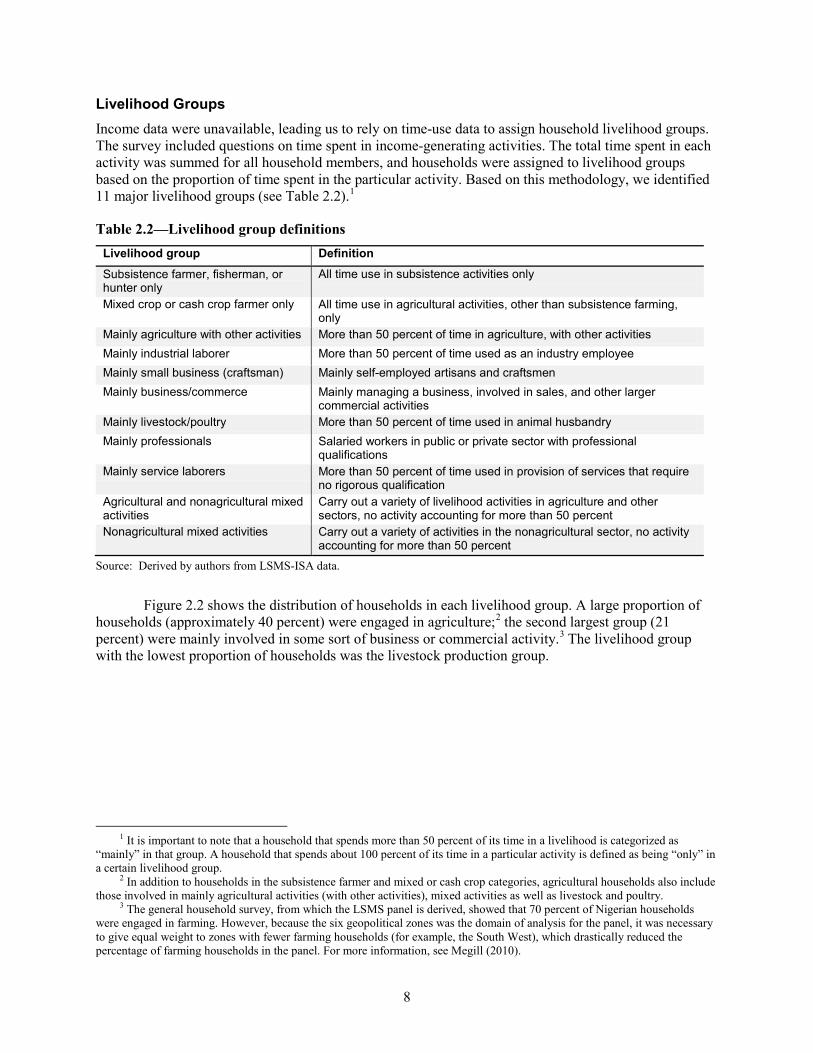
Livelihood Groups Income data were unavailable, leading us to rely on time-use data to assign household livelihood groups. The survey included questions on time spent in income-generating activities. The total time spent in each activity was summed for all household members, and households were assigned to livelihood groups based on the proportion of time spent in the particular activity. Based on this methodology, we identified 11 major livelihood groups (see Table 2.2).1
Table 2.2—Livelihood group definitions Livelihood group Definition
Subsistence farmer, fisherman, or hunter only
All time use in subsistence activities only
Mixed crop or cash crop farmer only All time use in agricultural activities, other than subsistence farming, only
Mainly agriculture with other activities More than 50 percent of time in agriculture, with other activities Mainly industrial laborer More than 50 percent of time used as an industry employee Mainly small business (craftsman) Mainly self-employed artisans and craftsmen Mainly business/commerce Mainly managing a business, involved in sales, and other larger
commercial activities Mainly livestock/poultry More than 50 percent of time used in animal husbandry Mainly professionals Salaried workers in public or private sector with professional
qualifications Mainly service laborers More than 50 percent of time used in provision of services that require
no rigorous qualification Agricultural and nonagricultural mixed activities
Carry out a variety of livelihood activities in agriculture and other sectors, no activity accounting for more than 50 percent
Nonagricultural mixed activities Carry out a variety of activities in the nonagricultural sector, no activity accounting for more than 50 percent
Source: Derived by authors from LSMS-ISA data.
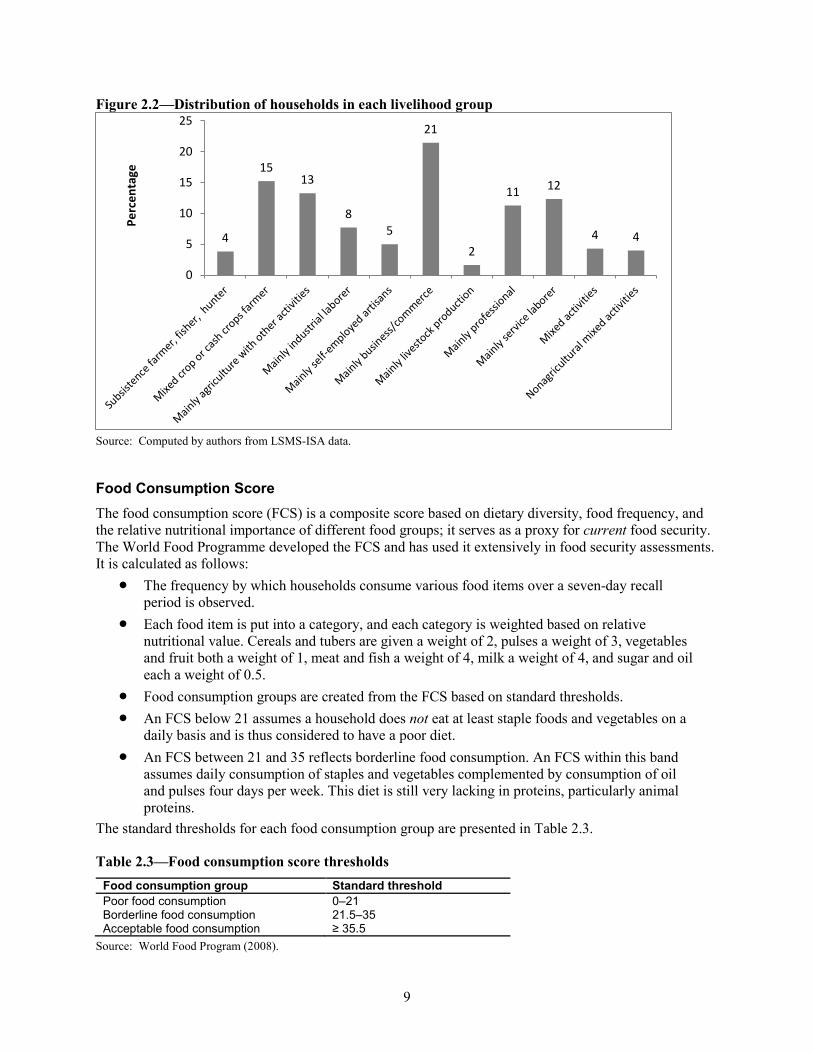
Figure 2.2 shows the distribution of households in each livelihood group. A large proportion of households (approximately 40 percent) were engaged in agriculture;2 the second largest group (21 percent) were mainly involved in some sort of business or commercial activity.3 The livelihood group with the lowest proportion of households was the livestock production group.
1 It is important to note that a household that spends more than 50 percent of its time in a livelihood is categorized as
“mainly” in that group. A household that spends about 100 percent of its time in a particular activity is defined as being “only” in a certain livelihood group.
2 In addition to households in the subsistence farmer and mixed or cash crop categories, agricultural households also include those involved in mainly agricultural activities (with other activities), mixed activities as well as livestock and poultry.
3 The general household survey, from which the LSMS panel is derived, showed that 70 percent of Nigerian households were engaged in farming. However, because the six geopolitical zones was the domain of analysis for the panel, it was necessary to give equal weight to zones with fewer farming households (for example, the South West), which drastically reduced the percentage of farming households in the panel. For more information, see Megill (2010).
9
Figure 2.2—Distribution of households in each livelihood group
Source: Computed by authors from LSMS-ISA data.
Food Consumption Score The food consumption score (FCS) is a composite score based on dietary diversity, food frequency, and the relative nutritional importance of different food groups; it serves as a proxy for current food security. The World Food Programme developed the FCS and has used it extensively in food security assessments. It is calculated as follows:
• The frequency by which households consume various food items over a seven-day recall period is observed.
• Each food item is put into a category, and each category is weighted based on relative nutritional value. Cereals and tubers are given a weight of 2, pulses a weight of 3, vegetables and fruit both a weight of 1, meat and fish a weight of 4, milk a weight of 4, and sugar and oil each a weight of 0.5.
• Food consumption groups are created from the FCS based on standard thresholds. • An FCS below 21 assumes a household does not eat at least staple foods and vegetables on a
daily basis and is thus considered to have a poor diet. • An FCS between 21 and 35 reflects borderline food consumption. An FCS within this band
assumes daily consumption of staples and vegetables complemented by consumption of oil and pulses four days per week. This diet is still very lacking in proteins, particularly animal proteins.
The standard thresholds for each food consumption group are presented in Table 2.3.
Table 2.3—Food consumption score thresholds Food consumption group Standard threshold Poor food consumption 0–21 Borderline food consumption 21.5–35 Acceptable food consumption ≥ 35.5
Source: World Food Program (2008).
4
15 13
8 5
21
2
11 12
4 4
0
5
10
15
20
25Pe
rcen
tage

10
3. DEMOGRAPHICS
Household demographic characteristics provide indicators of human and social capital, which determine potential economic opportunities and challenges at the household level. Demographic characteristics such as household composition and size, educational level, and health status give important information that provides better understanding of the causes and impacts of food insecurity within households. The demographic data also help paint a broad picture of the Nigerian population and different subgroups of the population, which may vary by wealth status, geographic region, livelihood group, or whether the household is in an urban or rural setting.
Household Characteristics With a fertility rate of more than five children per woman, Nigeria has an expanding young population with about 43 percent of its people under the age of 15. A young population suggests that population growth will continue to increase when the current youth reach reproductive age. Further, due to advances in healthcare, life expectancy has increased from 46 years to 52 years over the past decade (World Bank 2012), suggesting that there is also a larger elderly population than in previous years. Figure 3.1 shows age distribution at the household level. Within households, approximately half of the members are either under the age of 15 or over the age of 60. This gives a percentage of household members who are dependent of 46 percent, based on the assumption that people in those two age groups do not make significant contributions to household income.
Figure 3.1—Age distribution of household members
Source: Computed by authors from LSMS-ISA data.
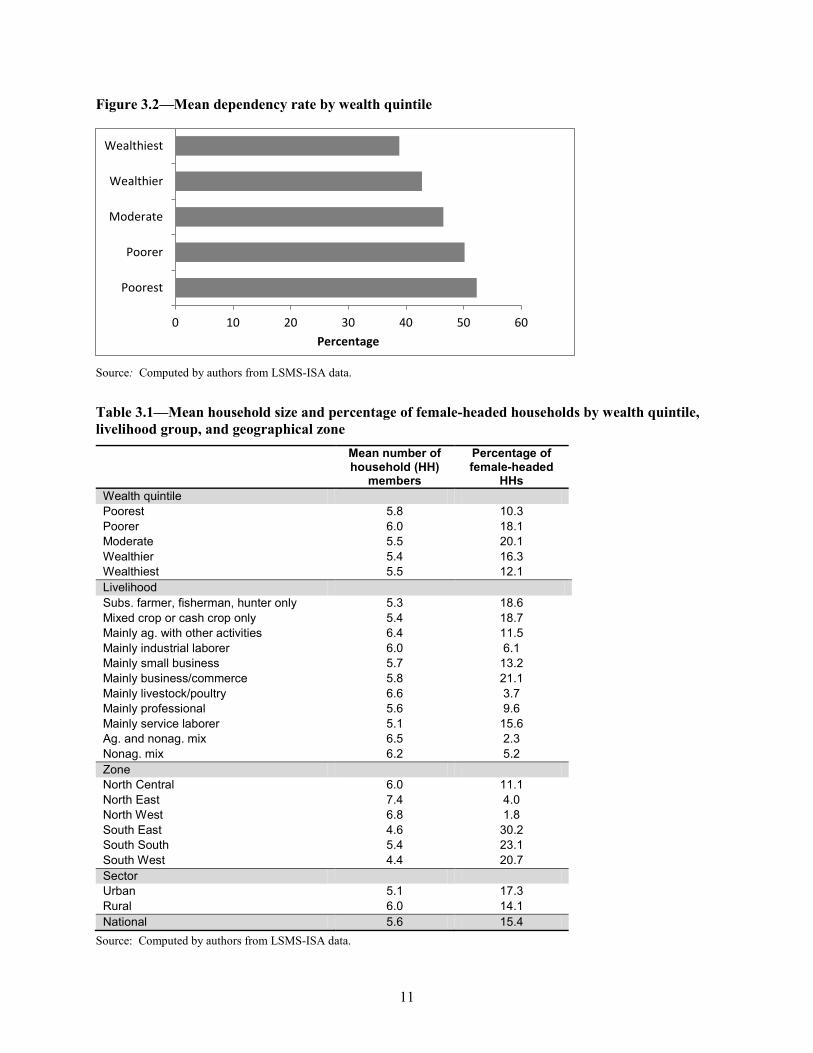
A high percentage of dependents per household reflects the reduced economic means of a household in which too many non–income earners depend on too few workers, a situation that leads to a greater risk of vulnerability if a key income earner becomes incapacitated. Figure 3.2 shows the clear correlation between the percentage of dependents and wealth quintiles. Although there is small variation in household size by wealth quintile (see Table 3.1), the mean percentage of dependents in the wealthiest quintile is 39 percent compared with 52 percent in the poorest wealth group, revealing that poorer households tend to have fewer income earners and a higher number of dependents than wealthier households.
9
11
26
46
8
8
10
23
52
6
0 10 20 30 40 50 60
< 3 years
3-5 years
6-14 years
15-59 years
60+ years
Percentage
Female
Male
11
Figure 3.2—Mean dependency rate by wealth quintile
Source: Computed by authors from LSMS-ISA data.
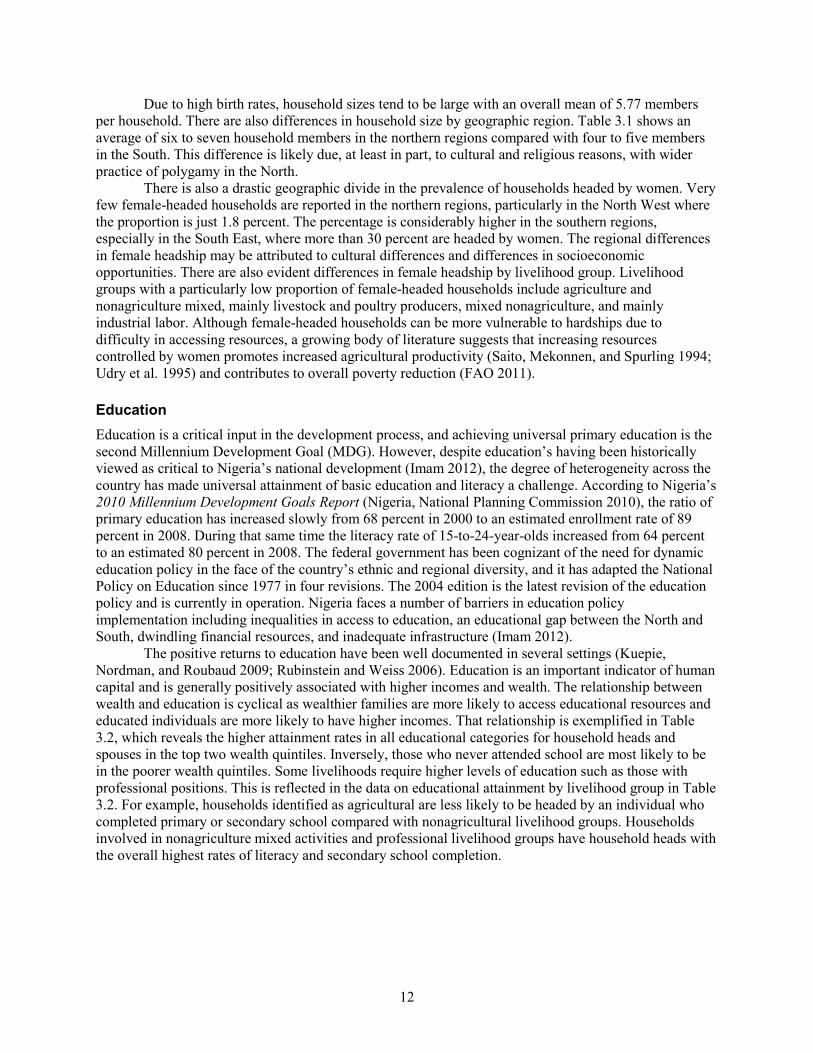
Table 3.1—Mean household size and percentage of female-headed households by wealth quintile, livelihood group, and geographical zone
Mean number of household (HH)
members
Percentage of female-headed
HHs
Wealth quintile Poorest 5.8 10.3 Poorer 6.0 18.1 Moderate 5.5 20.1 Wealthier 5.4 16.3 Wealthiest 5.5 12.1 Livelihood Subs. farmer, fisherman, hunter only 5.3 18.6 Mixed crop or cash crop only 5.4 18.7 Mainly ag. with other activities 6.4 11.5 Mainly industrial laborer 6.0 6.1 Mainly small business 5.7 13.2 Mainly business/commerce 5.8 21.1 Mainly livestock/poultry 6.6 3.7 Mainly professional 5.6 9.6 Mainly service laborer 5.1 15.6 Ag. and nonag. mix 6.5 2.3 Nonag. mix 6.2 5.2 Zone North Central 6.0 11.1 North East 7.4 4.0 North West 6.8 1.8 South East 4.6 30.2 South South 5.4 23.1 South West 4.4 20.7 Sector Urban 5.1 17.3 Rural 6.0 14.1 National 5.6 15.4
Source: Computed by authors from LSMS-ISA data.
0 10 20 30 40 50 60
Poorest
Poorer
Moderate
Wealthier
Wealthiest
Percentage
12
Due to high birth rates, household sizes tend to be large with an overall mean of 5.77 members per household. There are also differences in household size by geographic region. Table 3.1 shows an average of six to seven household members in the northern regions compared with four to five members in the South. This difference is likely due, at least in part, to cultural and religious reasons, with wider practice of polygamy in the North.
There is also a drastic geographic divide in the prevalence of households headed by women. Very few female-headed households are reported in the northern regions, particularly in the North West where the proportion is just 1.8 percent. The percentage is considerably higher in the southern regions, especially in the South East, where more than 30 percent are headed by women. The regional differences in female headship may be attributed to cultural differences and differences in socioeconomic opportunities. There are also evident differences in female headship by livelihood group. Livelihood groups with a particularly low proportion of female-headed households include agriculture and nonagriculture mixed, mainly livestock and poultry producers, mixed nonagriculture, and mainly industrial labor. Although female-headed households can be more vulnerable to hardships due to difficulty in accessing resources, a growing body of literature suggests that increasing resources controlled by women promotes increased agricultural productivity (Saito, Mekonnen, and Spurling 1994; Udry et al. 1995) and contributes to overall poverty reduction (FAO 2011).
Education Education is a critical input in the development process, and achieving universal primary education is the second Millennium Development Goal (MDG). However, despite education’s having been historically viewed as critical to Nigeria’s national development (Imam 2012), the degree of heterogeneity across the country has made universal attainment of basic education and literacy a challenge. According to Nigeria’s 2010 Millennium Development Goals Report (Nigeria, National Planning Commission 2010), the ratio of primary education has increased slowly from 68 percent in 2000 to an estimated enrollment rate of 89 percent in 2008. During that same time the literacy rate of 15-to-24-year-olds increased from 64 percent to an estimated 80 percent in 2008. The federal government has been cognizant of the need for dynamic education policy in the face of the country’s ethnic and regional diversity, and it has adapted the National Policy on Education since 1977 in four revisions. The 2004 edition is the latest revision of the education policy and is currently in operation. Nigeria faces a number of barriers in education policy implementation including inequalities in access to education, an educational gap between the North and South, dwindling financial resources, and inadequate infrastructure (Imam 2012).
The positive returns to education have been well documented in several settings (Kuepie, Nordman, and Roubaud 2009; Rubinstein and Weiss 2006). Education is an important indicator of human capital and is generally positively associated with higher incomes and wealth. The relationship between wealth and education is cyclical as wealthier families are more likely to access educational resources and educated individuals are more likely to have higher incomes. That relationship is exemplified in Table 3.2, which reveals the higher attainment rates in all educational categories for household heads and spouses in the top two wealth quintiles. Inversely, those who never attended school are most likely to be in the poorer wealth quintiles. Some livelihoods require higher levels of education such as those with professional positions. This is reflected in the data on educational attainment by livelihood group in Table 3.2. For example, households identified as agricultural are less likely to be headed by an individual who completed primary or secondary school compared with nonagricultural livelihood groups. Households involved in nonagriculture mixed activities and professional livelihood groups have household heads with the overall highest rates of literacy and secondary school completion.

13
Table 3.2—Education and literacy of household head and spouse (percentage)
Head Spouse
Can
read
an
d w
rite
Nev
er
atte
nded
sc
hool
Com
plet
ed
prim
ary
scho
ol
Can
read
an
d w
rite
Nev
er
atte
nded
sc
hool
Com
plet
ed
prim
ary
scho
ol
Wealth quintile Poorest 38 56 22 26 66 12 Poorer 47 45 36 35 56 21 Moderate 63 30 55 48 42 42 Wealthier 83 14 78 69 21 67 Wealthiest 93 5 92 86 10 87 Livelihood Subsistence farmer, fisher, hunter 51 37 44 40 44 39 Mixed crop or cash crop farmer 43 50 33 35 58 24 Mainly agriculture with other 55 36 46 41 47 36 Mainly industrial laborer 76 20 71 60 32 50 Mainly self-employed artisans 74 22 66 52 44 40 Mainly business/commerce 68 29 59 53 40 45 Mainly livestock production 24 71 3 8 77 2 Mainly professional 85 15 78 71 24 65 Mainly service laborer 79 15 72 68 24 64 Mixed activities 75 19 61 50 39 39 Nonagricultural mixed activities 91 8 85 75 19 75 Region North Central 56 35 54 32 56 32 North East 50 45 40 28 60 23 North West 63 40 33 44 53 18 South East 63 27 59 68 20 68 South South 73 16 74 73 13 78 South West 74 23 72 72 24 73 Sector Urban 79 18 74 71 23 69 Rural 56 38 45 41 50 31 National 65 30 56 51 41 43
Source: Computed by authors from LSMS-ISA data.
At the national level, gender disparity gaps in literacy and educational attainment are not very wide. For example, 77 percent of women aged 15 to 24 are literate compared with 85 percent of men. However, gender disparities in literacy and educational attainment widen once wealth and region are taken into consideration. In addition to the northern regions having lower overall literacy rates than the southern regions, there are also major interregional differences by gender. The literacy rate of women aged 15 to 24 is only 56 percent in the North East region and 59 percent in the North West region, compared with 70 percent and 79 percent for men in the North East and North West, respectively. In contrast, the literacy rates in the South East region are 91 percent and 94 percent for women and men, respectively. The right-hand columns of Table 3.2 can be used to further assess female literacy and completion rates in the different wealth quintiles, livelihood groups, and geographic regions since more than 99 percent of spouses are female.
14
Beyond the geographic divisions in educational attainment, literacy rates and primary school completion rates of household heads and spouses are higher in urban than rural areas. This is expected given that rural populations can face greater barriers in accessing education. Such barriers include poor or nonexistent school infrastructure, poor-quality educational staff, and lower school attendance because of farm obligations, among several others. It is also noteworthy that the gender gap in literacy and educational attainment is higher in rural areas.
Nutrition and Health Health is critical to social and economic development. A high disease burden reduces economic capacity and overall development. The health sector in Nigeria has been characterized by ineffective government policies, fragmented health service delivery, inadequate financing, weak infrastructure, poor distribution of trained health workers, and poor coordination among key stakeholders (Nigeria, Ministry of Health 2009). From 2004 to 2007, the Health Sector Reform Programme sought to address those issues. Consequently the federal Ministry of Health has articulated the policy framework in the National Strategic Development Plan (2009–2015). Under that framework, health plans at the federal, state, and local levels are harmonized as a single policy (National Health Bill of the Federal Republic of Nigeria (SB.50), 2008).
In spite of comprehensive policy efforts, most health indicators in Nigeria remain below the country targets set by the MDGs. Although the child mortality rate has fluctuated over the past two decades, there has been a modest overall reduction from 191 deaths of children under five per 1,000 live births in 1990 to 157 deaths per 1,000 live births in 2008. The leading causes of child deaths in Nigeria include malaria, pneumonia, diarrhea, and malnutrition. There has also been a more than 20 percent reduction in infant mortality over the same time period, from 91 deaths per 1,000 live births in 1990 to 75. The maternal death rate has been reduced by nearly half since 1990 but is still short of the MDG goal. The proportion of births attended by skilled health personnel and antenatal care coverage have also fallen since 1990 (Nigeria, National Planning Commission 2010).
Nutrition indicators are helpful in understanding both caloric and micronutrient deficiencies (WHO 2008), and they are a source of concern in Nigeria as the statistics related to nutrition and anthropometry in Nigeria are generally dire. Data from the 2008 demographic and health surveys for Nigeria (Nigeria, National Population Commission 2008) reveal that more than two out of five (41 percent) children under five were stunted (low height for age) and more than one-tenth (14 percent) were wasted (low weight for height). Those levels of stunting and wasting are considered high by World Health Organization standards.4 In addition, 23 percent of children in this age group were found to be underweight. In addition to those indicators of stunting, wasting, and underweight, young-child-feeding practices are an important indicator of nutrition and overall health since malnutrition during early developmental stages has been shown to have irreversible effects on child development and health in adulthood. Further, undernutrition is strongly associated with lower educational attainment and reduced economic productivity, which have important implications for overall economic development (Cesar et al. 2008). Exclusive breastfeeding during the first six months of life provides children with the essential nutrients required for growth and reduces the risk of infant mortality from diarrheal disease (Kramer and Kakuma 2009).
Table 3.3 presents the percentage of children that exclusively breastfed for the first six months, or if the child was not yet six months old at the time of the interview, the proportion that had been exclusively breastfed since birth. This indicator represents individual children rather than households, but the categorizations of wealth, livelihood, and geographic area are based on household characteristics. Based on these data, it is evident that children from families in the wealthier quintiles are more likely to be exclusively breastfed for the first six months than those in the poorer quintiles. The livelihood groups with obviously lower rates of breastfeeding include subsistence agriculture, agriculture and other
4 See www.who.int/nutgrowthdb/about/introduction/en/index5.html for more information.

15
activities, mainly industrial labor, self-employed, and mixed activities. Children in the South West are far more likely to be exclusively breastfed than children from the North East, North West, or South East. The age at which children start eating complementary foods is another measure to indicate whether exclusive breastfeeding is being practiced during the critical window of growth. Table 3.3 also indicates that the mean age when complementary food is introduced is between four and five months across wealth quintiles, livelihood groups, and geographic areas without wide variation.
Table 3.3—Young-child-feeding practices and vitamin A supplementation
Percentage of children
exclusively breastfed for first
six monthsa (n = 313)
Mean age child started eating
complementary foods (months)
(n = 219)
Percentage of children given
vitamin A supplementation
(n = 1,143)
Wealth quintile Poorest 11 5 37 Poorer 11 5 38 Moderate 15 4 56 Wealthier 14 5 64 Wealthiest 21 5 74 Livelihood Subsistence farmer, fisher, hunter 0 4 27 Mixed crop or cash crop farmer 23 5 46 Mainly agriculture with other 2 5 58 Mainly industrial laborer 2 5 48 Mainly self-employed artisans 8 5 60 Mainly business/commerce 12 5 55 Mainly livestock production 18 4 28 Mainly professional 17 5 71 Mainly service laborer 35 4 69 Mixed activities 7 5 39 Nonagricultural mixed activities 30 6 65 Region North Central 12 4 36 North East 7 5 46 North West 8 5 50 South East 5 4 80 South South 13 4 72 South West 39 5 70 Sector Urban 18 5 69 Rural 12 5 48 National 14 5 51
Source: Computed by authors from LSMS-ISA data. Note: a If child is less than six months old, then exclusively breastfed since birth.
Vitamin A deficiency is common among young children and pregnant women in developing countries and can lead to night blindness, complete blindness, and death. Even mild deficiencies can result in lowered immune response, increasing the risk of infectious diseases. Periodic high-dose vitamin A supplementation is a common preventative intervention given to children under five and lactating women.
16
Table 3.3 indicates that in Nigeria there is clear correlation between vitamin A supplementation and wealth quintiles, with children from families in the wealthier quintiles more likely to receive the supplement. Children in the southern regions are also more likely to receive vitamin A supplementation than children in the northern regions, and those in urban areas are more likely than rural inhabitants.
Access to safe drinking water and improved toilet facilities reduces the risk of contracting disease from contaminated water sources. Diarrheal disease accounted for 15 percent of child mortality worldwide in 2008 and 200,000 deaths of children under five in Nigeria alone (Black et al. 2010). Further, diarrheal disease reduces utilization of nutrients. Thus, use of unimproved drinking water and sanitation facilities can increase the risk of malnutrition and food insecurity, as can use of unimproved refuse disposal methods.5
In Nigeria water delivery services are shared among the three administrative levels of government, an approach that has not been successful in meeting the full demand for water from residential and commercial users. Due to poor infrastructure, many households are forced to purchase water from private vendors, which can be costly, or to draw on open bodies of water, which increases the risk of contracting waterborne disease. In this analysis, unimproved water sources include open bodies of water or those with risk of contamination such as an unprotected spring. Improved water sources include treated water, wells, and protected springs.
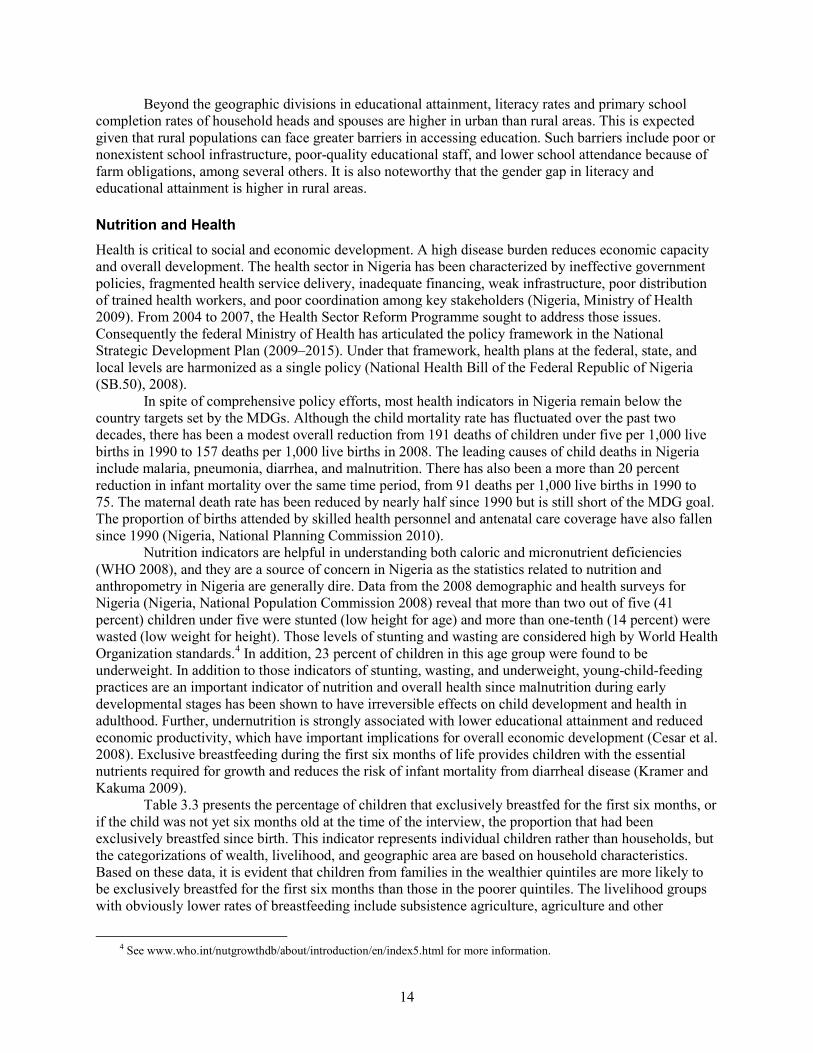
Figure 3.3 illustrates the use of unimproved drinking water, toilet, and refuse disposal by geographic area. Across all three categories, a higher proportion of households use unimproved facilities and disposal methods in the North than in the regions of the South. Similarly, a higher percentage of households from rural areas use unimproved facilities and disposal methods than households in urban areas. The disparity between urban and rural households represented in Figure 3.3 is consistent with the rates quoted by the government’s Water Supply and Sanitation Interim Strategy. However, the document reports that in actuality the urban water supply coverage is considerably lower because of poor maintenance and the rural coverage could be higher than the reported figures since many rural households rely on wells, which represent a safe source of water if properly drilled and maintained (Nigeria Federal Ministry of Water Resources, 2000).
Figure 3.3—Use of unimproved water and sanitation facilities by geographic region
Source: Computed by authors from LSMS-ISA data.
5 Defined as disposal within the compound or refuse dumped in an unauthorized refuse heap or near a water source.
0 50 100 150
North Central
North East
North West
South East
South South
South West
Urban
Rural
Regi
onZo
ne
Percentage
Refuse disposal
Toilet
Drinking water
17
4. VULNERABILITY
Vulnerability can be defined as “the probability of an acute decline in access to food, or consumption, often in reference to some critical value that defines minimal values of human well being” (WFP 2002). Vulnerability influences a household’s behavior and means of coping with its current wealth and livelihood circumstances; it also has an impact on the state of food security at the individual and household levels. Environmental and situational factors, such as regional climactic patterns or national economic trends, bring additional levels of influence that interact with the circumstances of individual households to further affect food security. In this section, we look specifically at asset poverty (defined by the ability, or inability, to accumulate assets), livelihood strategies, food sources, and food expenditure as these vulnerability factors relate to one another, and we analyze the potential effect such factors have on household food security.
Asset Poverty Wealth is a clear factor that can influence household food security. Wealthier households not only tend to have the resources to meet daily household food needs, but also are more likely to have reserves during periods of financial hardship or shock. Further, the poor generally spend a larger share of their income on food, making this group most vulnerable to increased food prices.
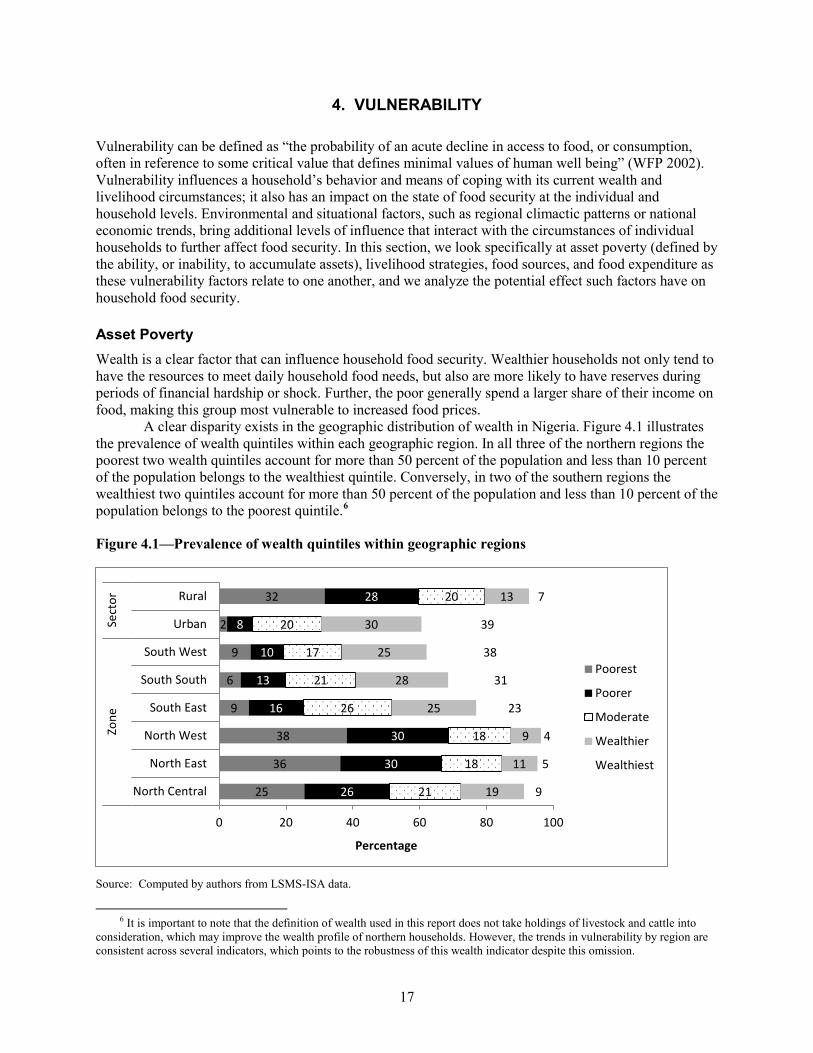
A clear disparity exists in the geographic distribution of wealth in Nigeria. Figure 4.1 illustrates the prevalence of wealth quintiles within each geographic region. In all three of the northern regions the poorest two wealth quintiles account for more than 50 percent of the population and less than 10 percent of the population belongs to the wealthiest quintile. Conversely, in two of the southern regions the wealthiest two quintiles account for more than 50 percent of the population and less than 10 percent of the population belongs to the poorest quintile.6
Figure 4.1—Prevalence of wealth quintiles within geographic regions
Source: Computed by authors from LSMS-ISA data.
6 It is important to note that the definition of wealth used in this report does not take holdings of livestock and cattle into
consideration, which may improve the wealth profile of northern households. However, the trends in vulnerability by region are consistent across several indicators, which points to the robustness of this wealth indicator despite this omission.
25
36
38
9
6
9
2
32
26
30
30
16
13
10
8
28
21
18
18
26
21
17
20
20
19
11
9
25
28
25
30
13
9
5
4
23
31
38
39
7
0 20 40 60 80 100
North Central
North East
North West
South East
South South
South West
Urban
Rural
Zone
Sect
or
Percentage
Poorest
Poorer
Moderate
Wealthier
Wealthiest
18
There is also a stark divide in the distribution of wealth between urban and rural populations. Nearly 40 percent of urban households belong to the wealthiest quintile, but only 7 percent of rural households belong to this quintile. In contrast, only 2 percent of urban households fall into the poorest quintile compared with 32 percent of rural. Since the wealth quintiles were constructed using an asset index, households in urban areas would be expected to score higher because they generally have more access to assets.
Livelihoods A household’s income source can also be a determining factor in vulnerability to food insecurity. For example, subsistence agricultural households may be affected more by climactic events that result in crop failure compared with households that rely on nonagricultural labor for income. On the other hand, poor urban households that do not grow food would likely experience greater food insecurity during a period of high food prices compared with households that depend on agricultural activities.
Table 4.1 shows livelihood groups by wealth quintile. The majority of households that work in agriculture fall in the poorer wealth quintiles. That is not particularly surprising, as the majority of Nigerian agricultural output is produced by smallholder rural farmers.
Table 4.1—Livelihood groups by wealth quintile (percent) Wealth quintiles
Livelihood group Poorest Poorer Moderate Wealthier Wealthiest Subsistence farmer, fisher, hunter 44 33 14 8 1 Mixed crop or cash crop farmer 39 31 19 9 3 Mainly agriculture with other activities 26 30 24 15 5 Mainly industrial laborer 9 20 19 27 25 Mainly self-employed artisans 14 12 29 24 21 Mainly business/commerce 9 17 23 23 28 Mainly livestock productiona 79 18 1 1 0 Mainly professional 9 14 13 23 42 Mainly service laborer 9 11 23 32 27 Mixed activities 21 23 26 21 9 Nonagricultural mixed activities 2 7 10 28 54
Source: Computed by authors from LSMS-ISA data. Note: a The poverty in the livestock production group appears to be extreme, but that is a group that counts wealth in cattle
and not other assets. By the definition of wealth used in this report, they are poor, though they may be rich in cattle.
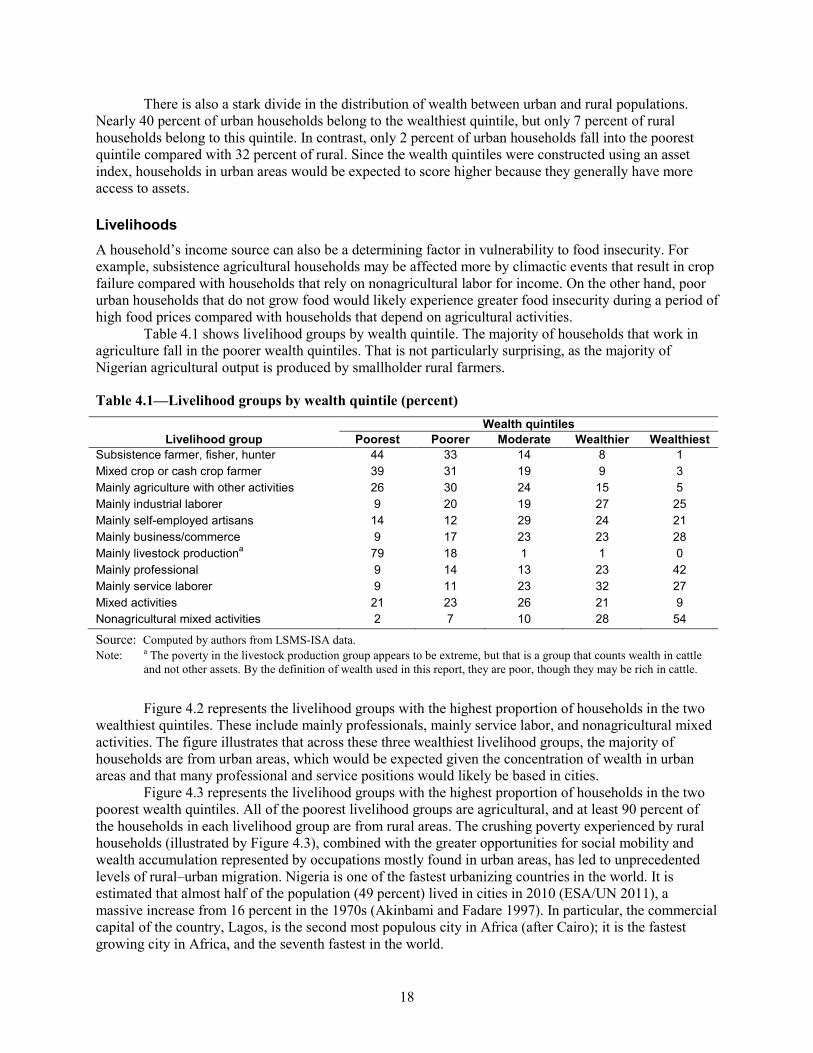
Figure 4.2 represents the livelihood groups with the highest proportion of households in the two wealthiest quintiles. These include mainly professionals, mainly service labor, and nonagricultural mixed activities. The figure illustrates that across these three wealthiest livelihood groups, the majority of households are from urban areas, which would be expected given the concentration of wealth in urban areas and that many professional and service positions would likely be based in cities.
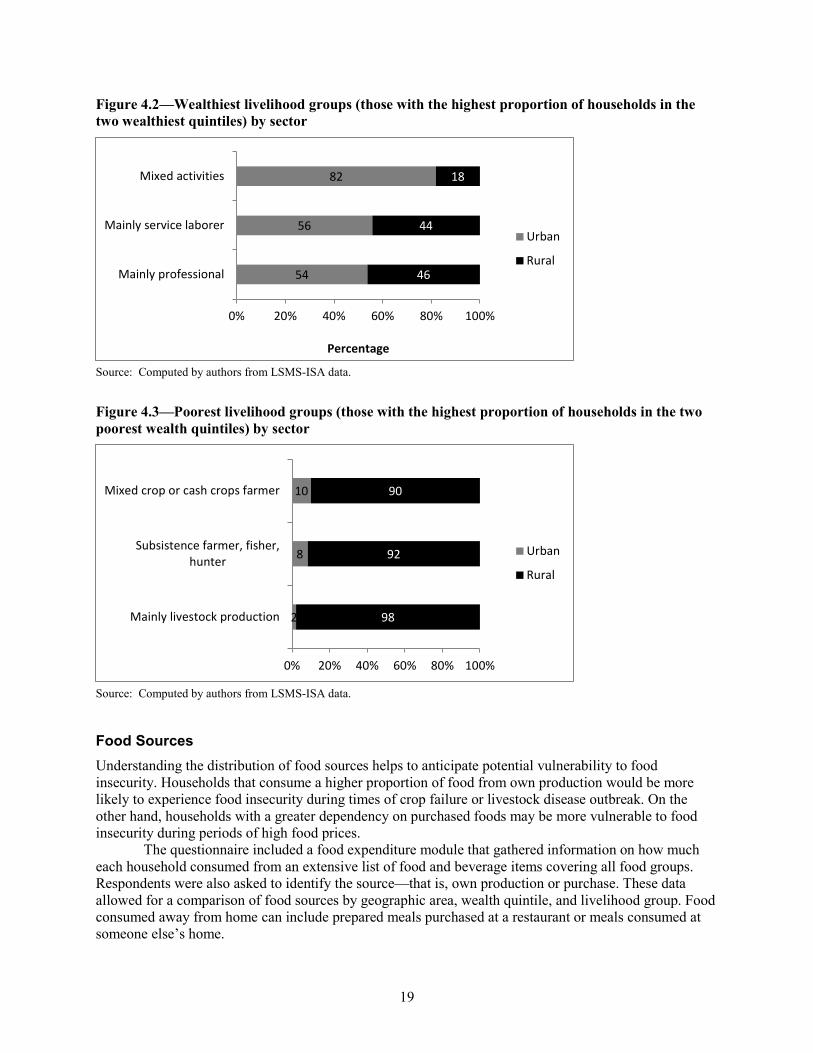
Figure 4.3 represents the livelihood groups with the highest proportion of households in the two poorest wealth quintiles. All of the poorest livelihood groups are agricultural, and at least 90 percent of the households in each livelihood group are from rural areas. The crushing poverty experienced by rural households (illustrated by Figure 4.3), combined with the greater opportunities for social mobility and wealth accumulation represented by occupations mostly found in urban areas, has led to unprecedented levels of rural–urban migration. Nigeria is one of the fastest urbanizing countries in the world. It is estimated that almost half of the population (49 percent) lived in cities in 2010 (ESA/UN 2011), a massive increase from 16 percent in the 1970s (Akinbami and Fadare 1997). In particular, the commercial capital of the country, Lagos, is the second most populous city in Africa (after Cairo); it is the fastest growing city in Africa, and the seventh fastest in the world.
19
Figure 4.2—Wealthiest livelihood groups (those with the highest proportion of households in the two wealthiest quintiles) by sector
Source: Computed by authors from LSMS-ISA data.
Figure 4.3—Poorest livelihood groups (those with the highest proportion of households in the two poorest wealth quintiles) by sector
Source: Computed by authors from LSMS-ISA data.
Food Sources Understanding the distribution of food sources helps to anticipate potential vulnerability to food insecurity. Households that consume a higher proportion of food from own production would be more likely to experience food insecurity during times of crop failure or livestock disease outbreak. On the other hand, households with a greater dependency on purchased foods may be more vulnerable to food insecurity during periods of high food prices.
The questionnaire included a food expenditure module that gathered information on how much each household consumed from an extensive list of food and beverage items covering all food groups. Respondents were also asked to identify the source—that is, own production or purchase. These data allowed for a comparison of food sources by geographic area, wealth quintile, and livelihood group. Food consumed away from home can include prepared meals purchased at a restaurant or meals consumed at someone else’s home.
54
56
82
46
44
18
0% 20% 40% 60% 80% 100%
Mainly professional
Mainly service laborer
Mixed activities
Percentage
Urban
Rural
2
8
10
98
92
90
0% 20% 40% 60% 80% 100%
Mainly livestock production
Subsistence farmer, fisher,hunter
Mixed crop or cash crops farmer
Urban
Rural
20
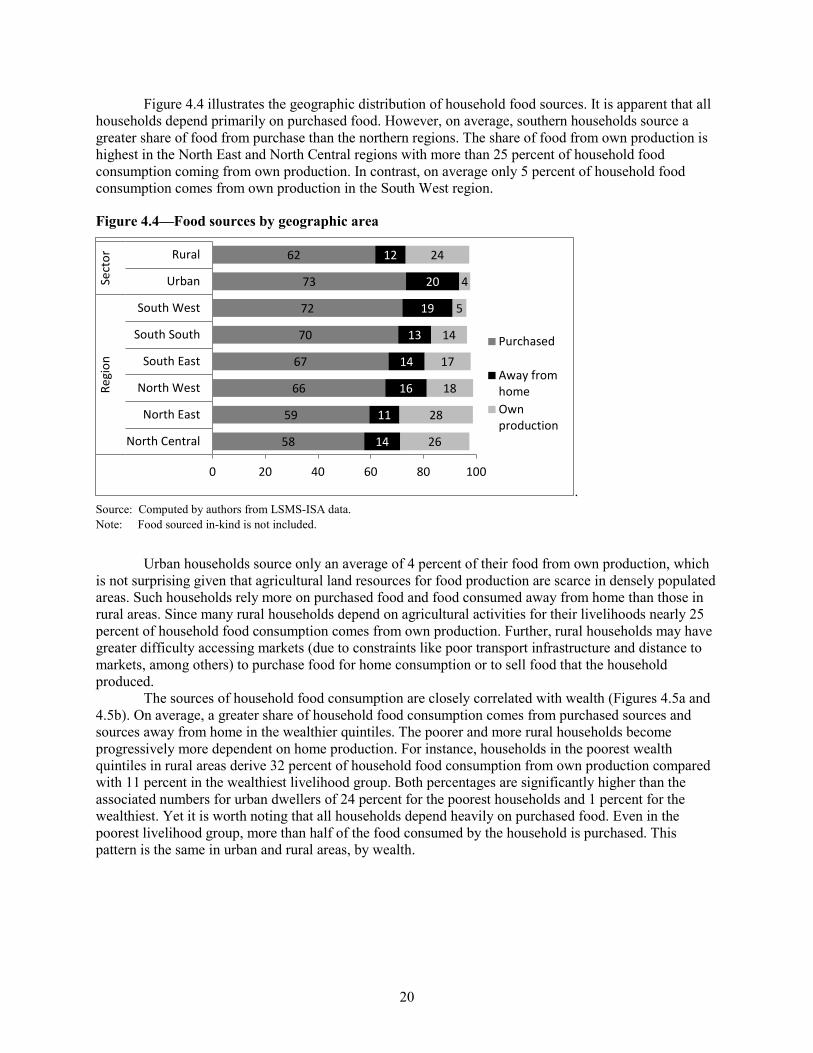
Figure 4.4 illustrates the geographic distribution of household food sources. It is apparent that all households depend primarily on purchased food. However, on average, southern households source a greater share of food from purchase than the northern regions. The share of food from own production is highest in the North East and North Central regions with more than 25 percent of household food consumption coming from own production. In contrast, on average only 5 percent of household food consumption comes from own production in the South West region.
Figure 4.4—Food sources by geographic area
. Source: Computed by authors from LSMS-ISA data. Note: Food sourced in-kind is not included.
Urban households source only an average of 4 percent of their food from own production, which is not surprising given that agricultural land resources for food production are scarce in densely populated areas. Such households rely more on purchased food and food consumed away from home than those in rural areas. Since many rural households depend on agricultural activities for their livelihoods nearly 25 percent of household food consumption comes from own production. Further, rural households may have greater difficulty accessing markets (due to constraints like poor transport infrastructure and distance to markets, among others) to purchase food for home consumption or to sell food that the household produced.
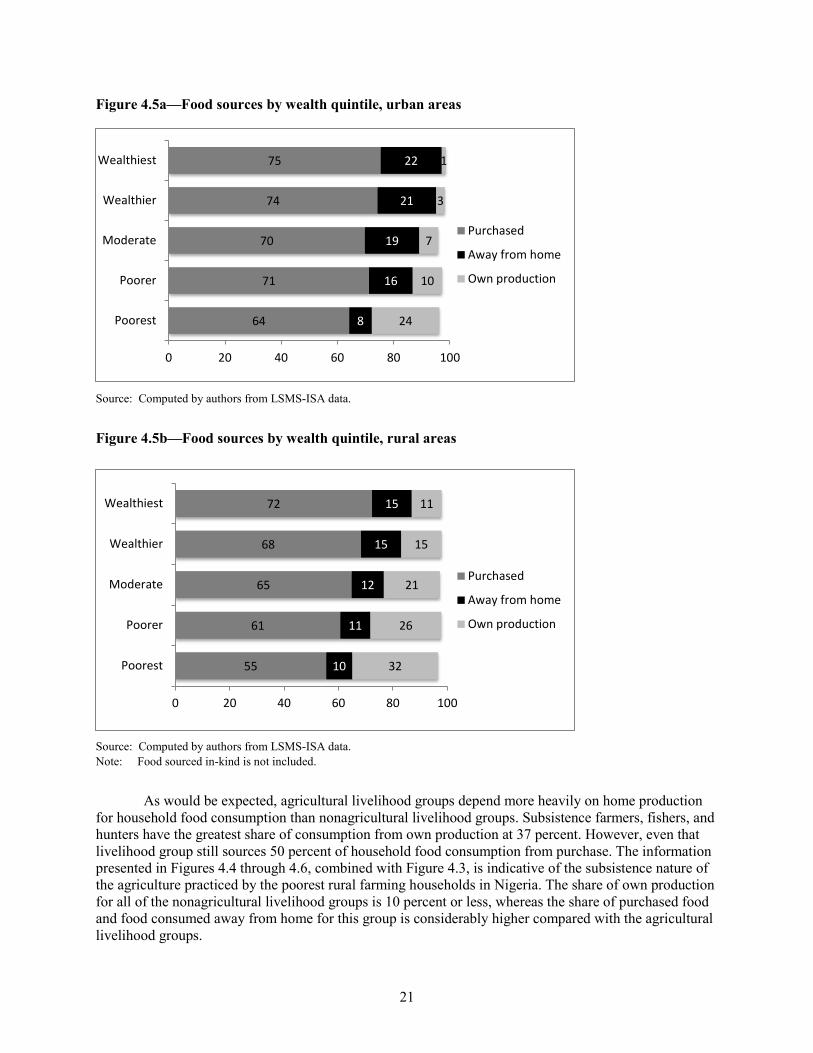
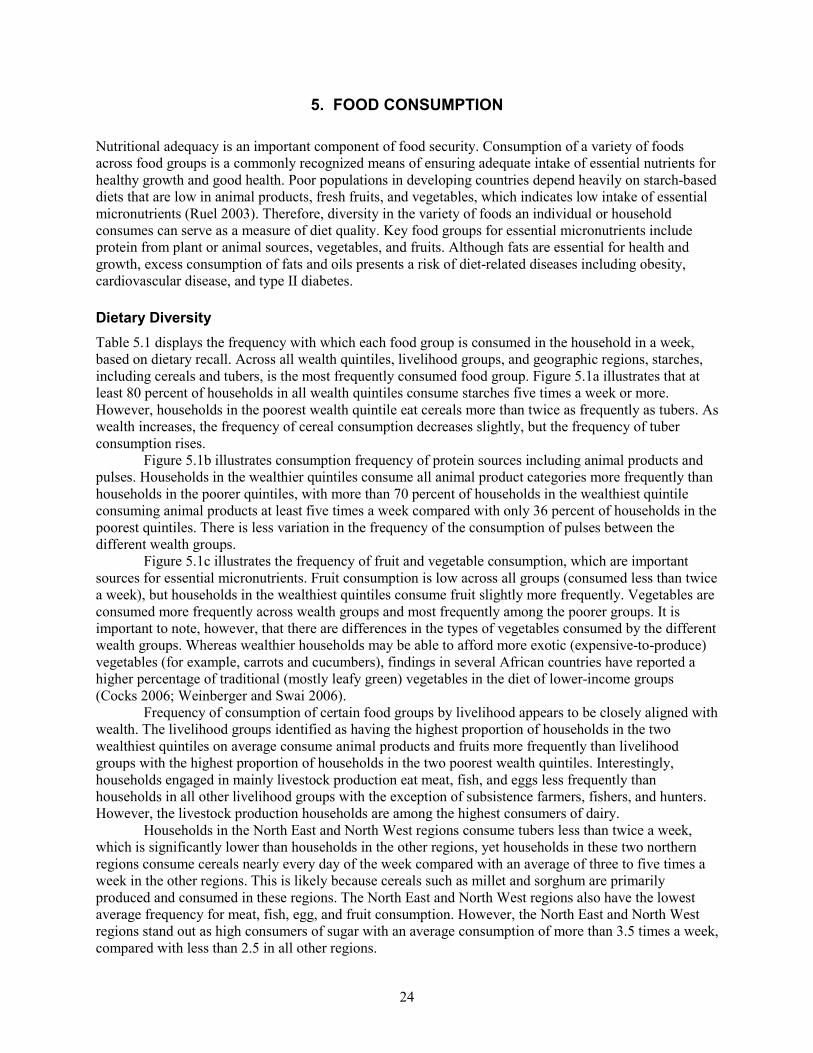
The sources of household food consumption are closely correlated with wealth (Figures 4.5a and 4.5b). On average, a greater share of household food consumption comes from purchased sources and sources away from home in the wealthier quintiles. The poorer and more rural households become progressively more dependent on home production. For instance, households in the poorest wealth quintiles in rural areas derive 32 percent of household food consumption from own production compared with 11 percent in the wealthiest livelihood group. Both percentages are significantly higher than the associated numbers for urban dwellers of 24 percent for the poorest households and 1 percent for the wealthiest. Yet it is worth noting that all households depend heavily on purchased food. Even in the poorest livelihood group, more than half of the food consumed by the household is purchased. This pattern is the same in urban and rural areas, by wealth.
58
59
66
67
70
72
73
62
14
11
16
14
13
19
20
12
26
28
18
17
14
5
4
24
0 20 40 60 80 100
North Central
North East
North West
South East
South South
South West
Urban
Rural
Regi
onSe
ctor
Purchased
Away fromhomeOwnproduction
21
Figure 4.5a—Food sources by wealth quintile, urban areas
Source: Computed by authors from LSMS-ISA data.
Figure 4.5b—Food sources by wealth quintile, rural areas
Source: Computed by authors from LSMS-ISA data. Note: Food sourced in-kind is not included.
As would be expected, agricultural livelihood groups depend more heavily on home production for household food consumption than nonagricultural livelihood groups. Subsistence farmers, fishers, and hunters have the greatest share of consumption from own production at 37 percent. However, even that livelihood group still sources 50 percent of household food consumption from purchase. The information presented in Figures 4.4 through 4.6, combined with Figure 4.3, is indicative of the subsistence nature of the agriculture practiced by the poorest rural farming households in Nigeria. The share of own production for all of the nonagricultural livelihood groups is 10 percent or less, whereas the share of purchased food and food consumed away from home for this group is considerably higher compared with the agricultural livelihood groups.
64
71
70
74
75
8
16
19
21
22
24
10
7
3
1
0 20 40 60 80 100
Poorest
Poorer
Moderate
Wealthier
Wealthiest
Purchased
Away from home
Own production
55
61
65
68
72
10
11
12
15
15
32
26
21
15
11
0 20 40 60 80 100
Poorest
Poorer
Moderate
Wealthier
Wealthiest
Purchased
Away from home
Own production

22
Figure 4.6—Food sources by livelihood group
. Source: Computed by authors from LSMS-ISA data.
Food Expenditure This measures the total value of food available to the household relative to the total value of resources available to it, and is an important indicator of food security vulnerability. A high food expenditure share means that most resources available to the household are devoted to food. The opportunity cost of this resource allocation decision is very high, as these resources could have been devoted to other purposes, even the production of income and wealth for the household. As would be expected, high food expenditure is closely correlated with wealth.
Figure 4.7 illustrates the percentage of households that devoted at least 75 percent of household resources to food in each wealth quintile. In the poorest quintile four in five households (82 percent) allocated at least 75 percent of total household resources to food compared with just 13 percent in the wealthiest quintile. This implies that wealthier households are able to devote resources to building up the asset base of the household instead of to food as poor households are forced to do.
The pattern remains the same when livelihoods are examined (Figure 4.8), as households in the poorer livelihoods devote more of their resources to food than households in the richer livelihoods. For example, more than 70 percent of households in the mainly livestock production and subsistence farmer, fisher, and hunter livelihood groups allocated at least 75 percent of total household income and productive resources to food. Conversely, the livelihood groups with fewer high-food-expenditure households included the three wealthiest livelihood groups identified above. It becomes an unfortunate cycle—the poorer the household, the fewer resources it can devote to building up assets, the more household resources it is obliged to spend on food.
50 59 61
69 70 71
55 70 72
61 76
10 8 10
20 20 17
8 18 20
12 20
37 30
26 10 8 9
36 9 7
24 3
0 50 100
Subsistence farmer, fisher, hunter
Mixed crop or cash crops farmer
Mainly agriculture with other activities
Mainly industrial laborer
Mainly self-employed artisans
Mainly business/commerce
Mainly livestock production
Mainly professional
Mainly service laborer
Mixed activities
Nonagricultural mixed activities
Purchased
Away from home
Own production

23
Figure 4.7—Percentage of households with high food expenditure (> 75% of total household resources) by wealth quintile
Source: Computed by authors from LSMS-ISA data.
Figure 4.8—Percentage of households with high food expenditure (>75% of total household resources) by livelihood group
. Source: Computed by authors from LSMS-ISA data.
Based on the analysis above, it is evident that poor households are the most vulnerable to food insecurity and sustained poverty as more than 80 percent of households in the poorest wealth quintiles devote at least 75 percent of household resources to either purchasing or producing food, making it difficult to build up assets and wealth. This is particularly troubling for households in rural areas and the poorer households in the northern regions that devote very high proportions of household resources to food at the expense of asset and wealth accumulation. These groups of people are more susceptible to sustained food insecurity and poverty.
82
65
46
30
13
0
10
20
30
40
50
60
70
80
90
Poorest Poorer Moderate Wealthier Wealthiest
Perc
ent
71 66 61
40 41 36
78
29 34
54
19
0102030405060708090
Perc
ent
24
5. FOOD CONSUMPTION
Nutritional adequacy is an important component of food security. Consumption of a variety of foods across food groups is a commonly recognized means of ensuring adequate intake of essential nutrients for healthy growth and good health. Poor populations in developing countries depend heavily on starch-based diets that are low in animal products, fresh fruits, and vegetables, which indicates low intake of essential micronutrients (Ruel 2003). Therefore, diversity in the variety of foods an individual or household consumes can serve as a measure of diet quality. Key food groups for essential micronutrients include protein from plant or animal sources, vegetables, and fruits. Although fats are essential for health and growth, excess consumption of fats and oils presents a risk of diet-related diseases including obesity, cardiovascular disease, and type II diabetes.
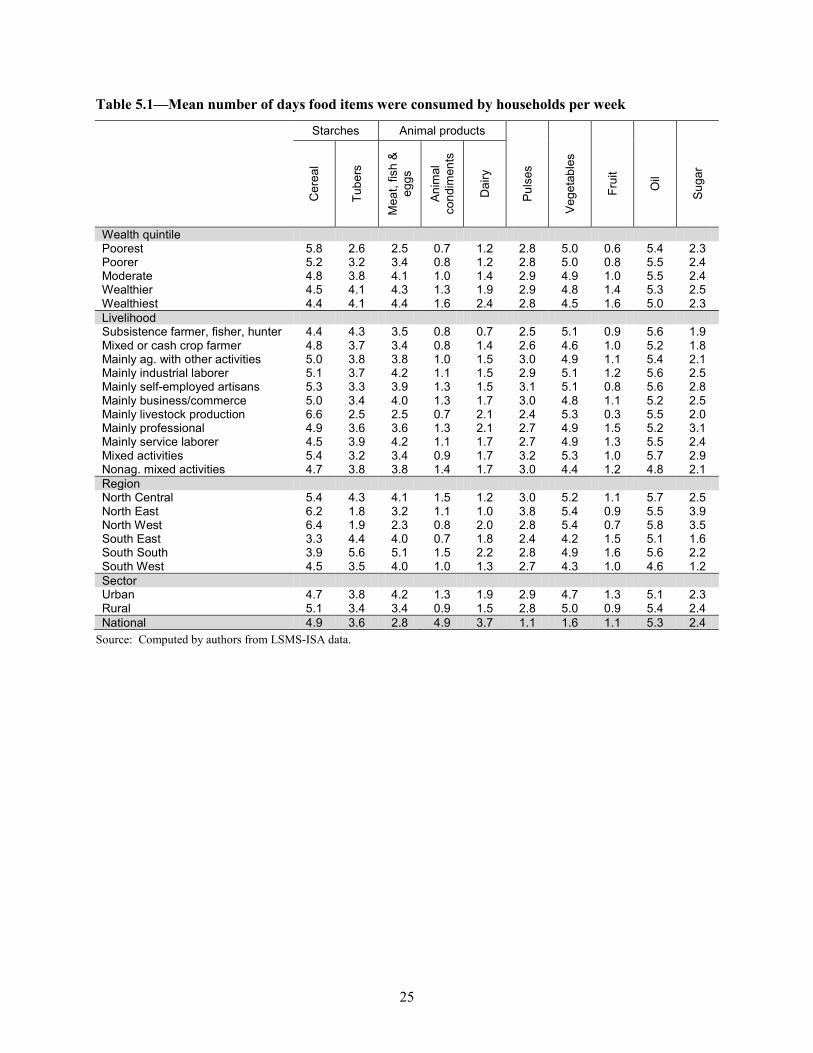
Dietary Diversity Table 5.1 displays the frequency with which each food group is consumed in the household in a week, based on dietary recall. Across all wealth quintiles, livelihood groups, and geographic regions, starches, including cereals and tubers, is the most frequently consumed food group. Figure 5.1a illustrates that at least 80 percent of households in all wealth quintiles consume starches five times a week or more. However, households in the poorest wealth quintile eat cereals more than twice as frequently as tubers. As wealth increases, the frequency of cereal consumption decreases slightly, but the frequency of tuber consumption rises.
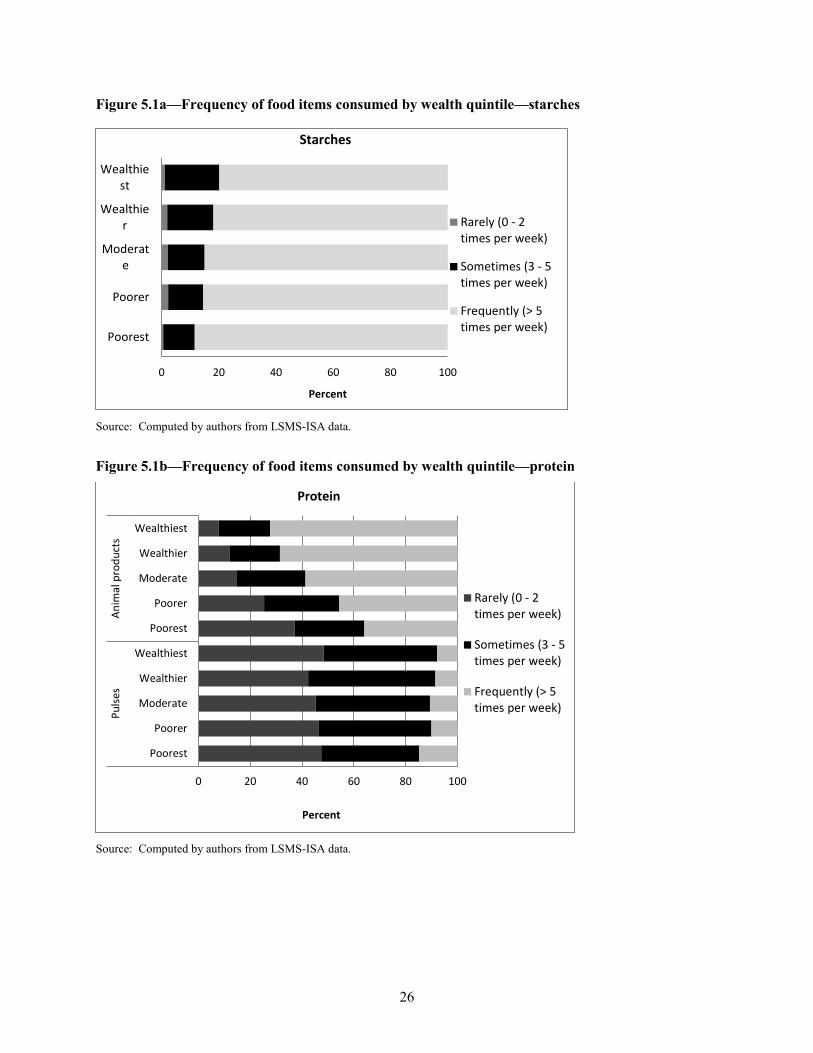
Figure 5.1b illustrates consumption frequency of protein sources including animal products and pulses. Households in the wealthier quintiles consume all animal product categories more frequently than households in the poorer quintiles, with more than 70 percent of households in the wealthiest quintile consuming animal products at least five times a week compared with only 36 percent of households in the poorest quintiles. There is less variation in the frequency of the consumption of pulses between the different wealth groups.
Figure 5.1c illustrates the frequency of fruit and vegetable consumption, which are important sources for essential micronutrients. Fruit consumption is low across all groups (consumed less than twice a week), but households in the wealthiest quintiles consume fruit slightly more frequently. Vegetables are consumed more frequently across wealth groups and most frequently among the poorer groups. It is important to note, however, that there are differences in the types of vegetables consumed by the different wealth groups. Whereas wealthier households may be able to afford more exotic (expensive-to-produce) vegetables (for example, carrots and cucumbers), findings in several African countries have reported a higher percentage of traditional (mostly leafy green) vegetables in the diet of lower-income groups (Cocks 2006; Weinberger and Swai 2006).
Frequency of consumption of certain food groups by livelihood appears to be closely aligned with wealth. The livelihood groups identified as having the highest proportion of households in the two wealthiest quintiles on average consume animal products and fruits more frequently than livelihood groups with the highest proportion of households in the two poorest wealth quintiles. Interestingly, households engaged in mainly livestock production eat meat, fish, and eggs less frequently than households in all other livelihood groups with the exception of subsistence farmers, fishers, and hunters. However, the livestock production households are among the highest consumers of dairy.
Households in the North East and North West regions consume tubers less than twice a week, which is significantly lower than households in the other regions, yet households in these two northern regions consume cereals nearly every day of the week compared with an average of three to five times a week in the other regions. This is likely because cereals such as millet and sorghum are primarily produced and consumed in these regions. The North East and North West regions also have the lowest average frequency for meat, fish, egg, and fruit consumption. However, the North East and North West regions stand out as high consumers of sugar with an average consumption of more than 3.5 times a week, compared with less than 2.5 in all other regions.
25
Table 5.1—Mean number of days food items were consumed by households per week
Starches Animal products
Cer
eal
Tube
rs
Mea
t, fis
h &
eg
gs
Ani
mal
co
ndim
ents
Dai
ry
Pul
ses
Veg
etab
les
Frui
t
Oil
Sug
ar
Wealth quintile Poorest 5.8 2.6 2.5 0.7 1.2 2.8 5.0 0.6 5.4 2.3 Poorer 5.2 3.2 3.4 0.8 1.2 2.8 5.0 0.8 5.5 2.4 Moderate 4.8 3.8 4.1 1.0 1.4 2.9 4.9 1.0 5.5 2.4 Wealthier 4.5 4.1 4.3 1.3 1.9 2.9 4.8 1.4 5.3 2.5 Wealthiest 4.4 4.1 4.4 1.6 2.4 2.8 4.5 1.6 5.0 2.3 Livelihood Subsistence farmer, fisher, hunter 4.4 4.3 3.5 0.8 0.7 2.5 5.1 0.9 5.6 1.9 Mixed or cash crop farmer 4.8 3.7 3.4 0.8 1.4 2.6 4.6 1.0 5.2 1.8 Mainly ag. with other activities 5.0 3.8 3.8 1.0 1.5 3.0 4.9 1.1 5.4 2.1 Mainly industrial laborer 5.1 3.7 4.2 1.1 1.5 2.9 5.1 1.2 5.6 2.5 Mainly self-employed artisans 5.3 3.3 3.9 1.3 1.5 3.1 5.1 0.8 5.6 2.8 Mainly business/commerce 5.0 3.4 4.0 1.3 1.7 3.0 4.8 1.1 5.2 2.5 Mainly livestock production 6.6 2.5 2.5 0.7 2.1 2.4 5.3 0.3 5.5 2.0 Mainly professional 4.9 3.6 3.6 1.3 2.1 2.7 4.9 1.5 5.2 3.1 Mainly service laborer 4.5 3.9 4.2 1.1 1.7 2.7 4.9 1.3 5.5 2.4 Mixed activities 5.4 3.2 3.4 0.9 1.7 3.2 5.3 1.0 5.7 2.9 Nonag. mixed activities 4.7 3.8 3.8 1.4 1.7 3.0 4.4 1.2 4.8 2.1 Region North Central 5.4 4.3 4.1 1.5 1.2 3.0 5.2 1.1 5.7 2.5 North East 6.2 1.8 3.2 1.1 1.0 3.8 5.4 0.9 5.5 3.9 North West 6.4 1.9 2.3 0.8 2.0 2.8 5.4 0.7 5.8 3.5 South East 3.3 4.4 4.0 0.7 1.8 2.4 4.2 1.5 5.1 1.6 South South 3.9 5.6 5.1 1.5 2.2 2.8 4.9 1.6 5.6 2.2 South West 4.5 3.5 4.0 1.0 1.3 2.7 4.3 1.0 4.6 1.2 Sector Urban 4.7 3.8 4.2 1.3 1.9 2.9 4.7 1.3 5.1 2.3 Rural 5.1 3.4 3.4 0.9 1.5 2.8 5.0 0.9 5.4 2.4 National 4.9 3.6 2.8 4.9 3.7 1.1 1.6 1.1 5.3 2.4
Source: Computed by authors from LSMS-ISA data.
26
Figure 5.1a—Frequency of food items consumed by wealth quintile—starches
Source: Computed by authors from LSMS-ISA data.
Figure 5.1b—Frequency of food items consumed by wealth quintile—protein
Source: Computed by authors from LSMS-ISA data.
0 20 40 60 80 100
Poorest
Poorer
Moderate
Wealthier
Wealthiest
Percent
Starches
Rarely (0 - 2times per week)
Sometimes (3 - 5times per week)
Frequently (> 5times per week)
0 20 40 60 80 100
Poorest
Poorer
Moderate
Wealthier
Wealthiest
Poorest
Poorer
Moderate
Wealthier
Wealthiest
Pulse
sAn
imal
pro
duct
s
Protein
Rarely (0 - 2times per week)
Sometimes (3 - 5times per week)
Frequently (> 5times per week)
Percent

27
Figure 5.1c—Frequency of food items consumed by wealth quintile—fruit and vegetables
Source: Computed by authors from LSMS-ISA data.
Based on household consumption data, it is evident that the majority of Nigerians depend on a heavily starch-based diet. Vegetables are also eaten frequently with average household consumption around five times a week across all wealth quintiles, livelihood groups, and regions. This is due to the composition of most meals, where some starchy food (for example, yam, rice, cassava) is consumed in some form with cooked vegetables (usually cooked with oil and spices added). However, fruit consumption is very low across all groups, mostly because fruit availability is seasonal, and very expensive in the lean season. Overall, it appears that wealthier households consume more nutrient-rich foods than poorer households, which means that the poor face greater risk of nutrient deficiencies.
Food Consumption Score Dietary diversity can also serve as a means for measuring food security given the positive relationship between dietary diversity and per capita household caloric availability (Hoddinott and Yohannes 2002). The section on methodology outlines the steps used to develop the FCS.
As would be expected, based on the analysis of individual food groups above, diet quality and quantity improves with wealth. Figure 5.2 illustrates that in the wealthiest quintile only 2 percent of households have poor diets and 13 percent have borderline diets, whereas in the poorest quintile 9 percent and 20 percent have poor and borderline diets, respectively. It is worth noting that although a correlation exists between diet quality and wealth, other factors can affect overall household diet quality, including dietary preferences (heavily influenced by cultural food norms) as well as availability of certain foods.
0 20 40 60 80 100
Poorest
Poorer
Moderate
Wealthier
Wealthiest
Poorest
Poorer
Moderate
Wealthier
Wealthiest
Vege
tabl
esFr
uit
Percent
Fruits and vegetables
Rarely (0 - 2times perweek)Sometimes (3 -5 times perweek)Frequently (> 5times perweek)
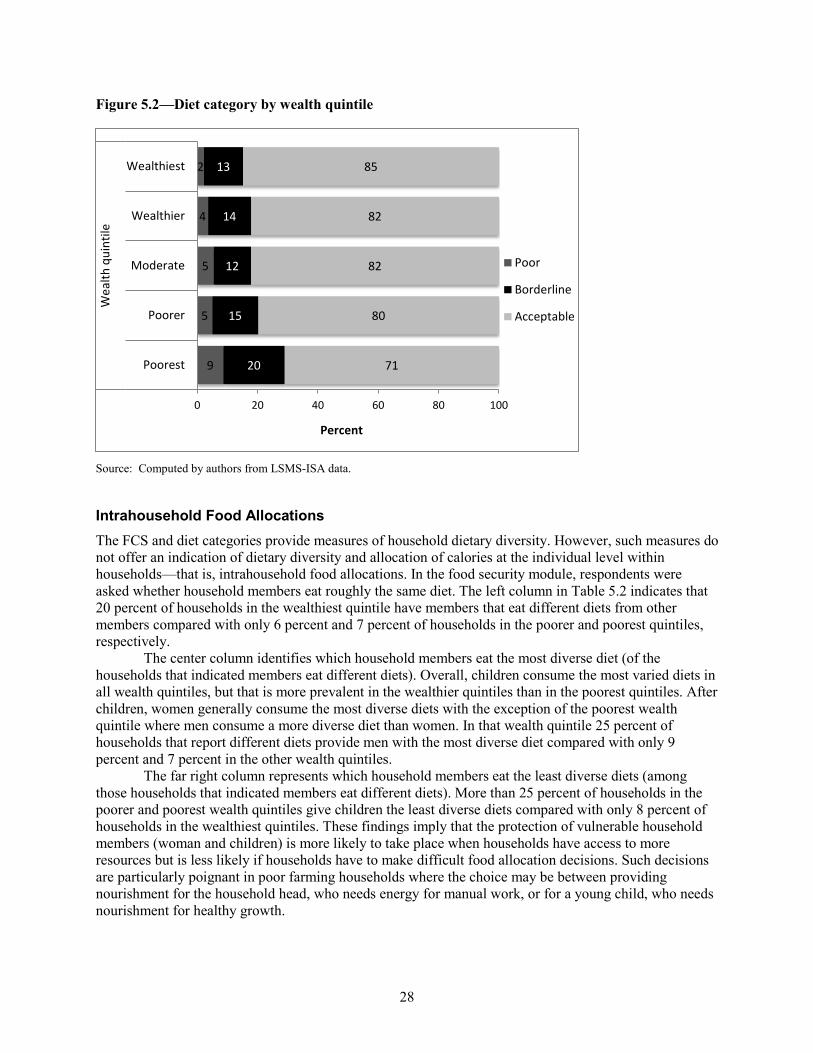
28
Figure 5.2—Diet category by wealth quintile
Source: Computed by authors from LSMS-ISA data.
Intrahousehold Food Allocations The FCS and diet categories provide measures of household dietary diversity. However, such measures do not offer an indication of dietary diversity and allocation of calories at the individual level within households—that is, intrahousehold food allocations. In the food security module, respondents were asked whether household members eat roughly the same diet. The left column in Table 5.2 indicates that 20 percent of households in the wealthiest quintile have members that eat different diets from other members compared with only 6 percent and 7 percent of households in the poorer and poorest quintiles, respectively.
The center column identifies which household members eat the most diverse diet (of the households that indicated members eat different diets). Overall, children consume the most varied diets in all wealth quintiles, but that is more prevalent in the wealthier quintiles than in the poorest quintiles. After children, women generally consume the most diverse diets with the exception of the poorest wealth quintile where men consume a more diverse diet than women. In that wealth quintile 25 percent of households that report different diets provide men with the most diverse diet compared with only 9 percent and 7 percent in the other wealth quintiles.
The far right column represents which household members eat the least diverse diets (among those households that indicated members eat different diets). More than 25 percent of households in the poorer and poorest wealth quintiles give children the least diverse diets compared with only 8 percent of households in the wealthiest quintiles. These findings imply that the protection of vulnerable household members (woman and children) is more likely to take place when households have access to more resources but is less likely if households have to make difficult food allocation decisions. Such decisions are particularly poignant in poor farming households where the choice may be between providing nourishment for the household head, who needs energy for manual work, or for a young child, who needs nourishment for healthy growth.
9
5
5
4
2
20
15
12
14
13
71
80
82
82
85
0 20 40 60 80 100
Poorest
Poorer
Moderate
Wealthier
Wealthiest
Wea
lth q
uint
ile
Percent
Poor
Borderline
Acceptable

29
Intrahousehold food allocation also varies by geographic region. Only 4 percent of households in the North West region have members eating different diets compared with 19 percent in the South West. Across all regions the majority of households provide children with the most diverse diet, followed by women and then men. However, nearly all households in the North East (84 percent) provide children with the most diverse diet compared with less than 50 percent in the South East, where 25 percent of households provide men with the most diverse diet.
Table 5.2—Intrahousehold food allocations by wealth and geographic area Household
members eat different diets (%)
Most diverse diets (n = 460)
Least diverse diets (n = 460)
Men Women Children Men Women Children Wealth quintile Poorest 7 24 11 65 47 26 27 Poorer 6 9 33 57 43 21 36 Moderate 8 9 12 79 69 18 13 Wealthier 12 7 13 80 72 17 11 Wealthiest 20 9 21 70 79 12 8 Zone North Central 11 13 18 70 35 35 31 North East 8 5 11 84 91 3 6 North West 4 19 23 58 72 0 28 South East 6 25 26 49 35 47 18 South South 13 8 15 77 72 15 14 South West 19 7 19 74 80 11 9 Sector Urban 15 8 19 73 79 13 8 Rural 8 13 17 70 51 23 25 National 11 10 18 72 69 16 15
Source: Computed by authors from LSMS-ISA data.
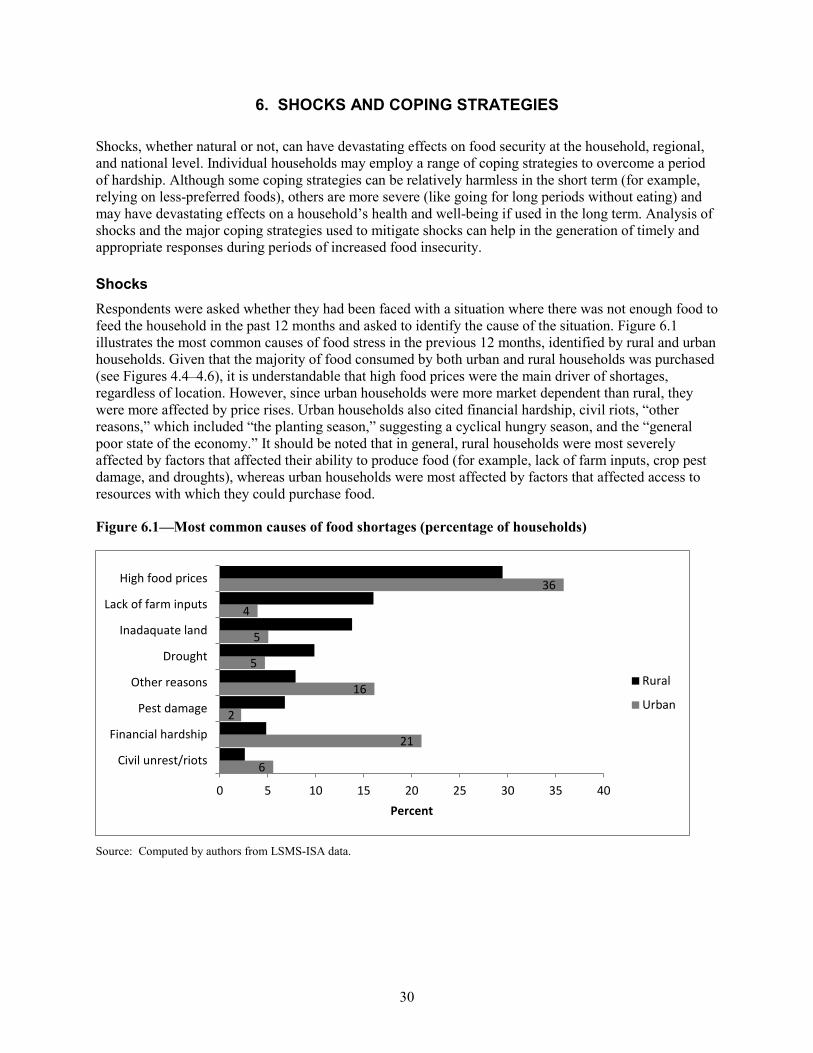
30
6. SHOCKS AND COPING STRATEGIES
Shocks, whether natural or not, can have devastating effects on food security at the household, regional, and national level. Individual households may employ a range of coping strategies to overcome a period of hardship. Although some coping strategies can be relatively harmless in the short term (for example, relying on less-preferred foods), others are more severe (like going for long periods without eating) and may have devastating effects on a household’s health and well-being if used in the long term. Analysis of shocks and the major coping strategies used to mitigate shocks can help in the generation of timely and appropriate responses during periods of increased food insecurity.
Shocks Respondents were asked whether they had been faced with a situation where there was not enough food to feed the household in the past 12 months and asked to identify the cause of the situation. Figure 6.1 illustrates the most common causes of food stress in the previous 12 months, identified by rural and urban households. Given that the majority of food consumed by both urban and rural households was purchased (see Figures 4.4–4.6), it is understandable that high food prices were the main driver of shortages, regardless of location. However, since urban households were more market dependent than rural, they were more affected by price rises. Urban households also cited financial hardship, civil riots, “other reasons,” which included “the planting season,” suggesting a cyclical hungry season, and the “general poor state of the economy.” It should be noted that in general, rural households were most severely affected by factors that affected their ability to produce food (for example, lack of farm inputs, crop pest damage, and droughts), whereas urban households were most affected by factors that affected access to resources with which they could purchase food.
Figure 6.1—Most common causes of food shortages (percentage of households)
Source: Computed by authors from LSMS-ISA data.
6
21
2
16
5
5
4
36
3
5
7
8
10
14
16
29
0 5 10 15 20 25 30 35 40
Civil unrest/riots
Financial hardship
Pest damage
Other reasons
Drought
Inadaquate land
Lack of farm inputs
High food prices
Percent
Rural
Urban
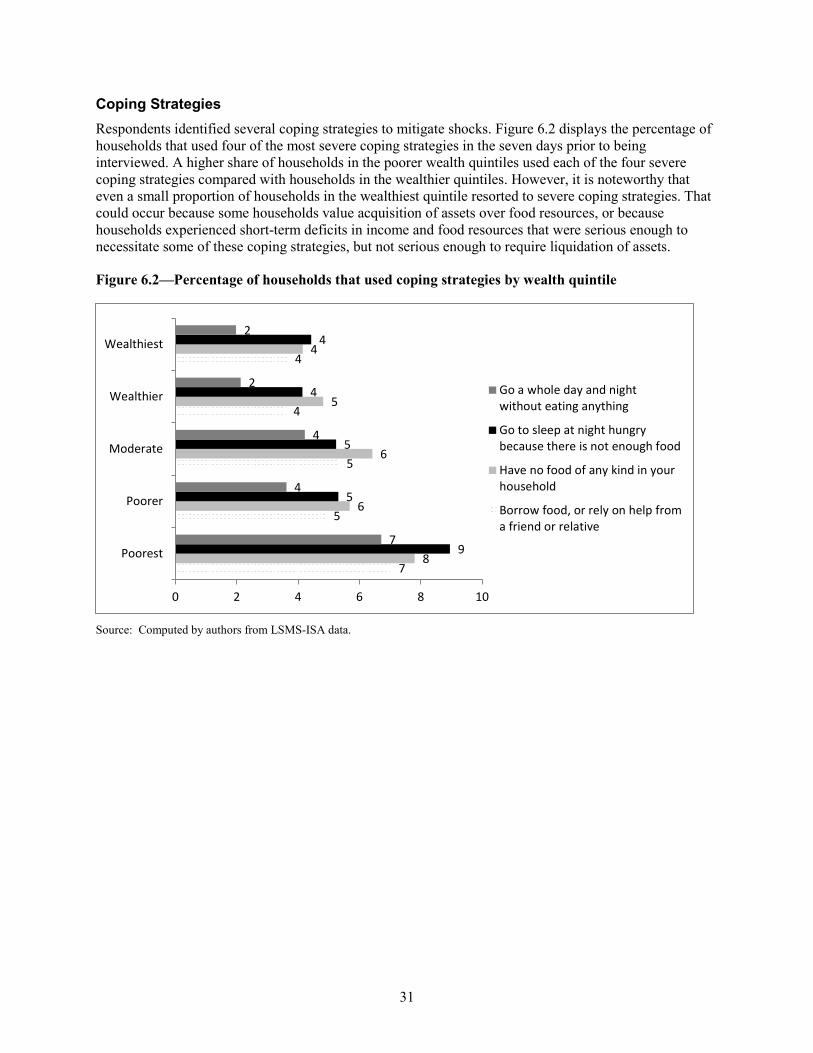
31
Coping Strategies Respondents identified several coping strategies to mitigate shocks. Figure 6.2 displays the percentage of households that used four of the most severe coping strategies in the seven days prior to being interviewed. A higher share of households in the poorer wealth quintiles used each of the four severe coping strategies compared with households in the wealthier quintiles. However, it is noteworthy that even a small proportion of households in the wealthiest quintile resorted to severe coping strategies. That could occur because some households value acquisition of assets over food resources, or because households experienced short-term deficits in income and food resources that were serious enough to necessitate some of these coping strategies, but not serious enough to require liquidation of assets.
Figure 6.2—Percentage of households that used coping strategies by wealth quintile
Source: Computed by authors from LSMS-ISA data.
7
5
5
4
4
8
6
6
5
4
9
5
5
4
4
7
4
4
2
2
0 2 4 6 8 10
Poorest
Poorer
Moderate
Wealthier
Wealthiest
Go a whole day and nightwithout eating anything
Go to sleep at night hungrybecause there is not enough food
Have no food of any kind in yourhousehold
Borrow food, or rely on help froma friend or relative

32
7. CONCLUSIONS AND RECOMMENDATIONS
This 2012 CFSVA was conducted using postharvest data from the LSMS, which means that the results are more positive than they would have been were the data collected during the lean season (postplanting). Despite this, a significant proportion of households surveyed were still found to be vulnerable to food insecurity.
The following recommendations are made based on the findings in this study: • Fund better-quality data collection efforts so that trends in all dimensions of food insecurity
can be tracked. • The study identified a large gender gap in education in rural areas and in some regions of the
country (primarily the northern regions). Several studies in various contexts have found a very strong link between mother’s education and the nutritional status of dependent children (Frost, Forste, and Haas 2005; Wamani et al. 2004). That link makes it imperative that policies that are culturally appropriate be developed to ensure that women are educated enough to be able to make informed choices on their nutrition and health and those of their children.
• This report reveals that the proportion of women who breastfeed exclusively is low among all wealth groups, but particularly among women in the poorer wealth quintiles. This may occur because these women are too undernourished to provide adequate milk for their offspring. They usually supplement with starchy gruels that provide very little for the nutritional needs of the child. Policies may need to be developed to provide targeted food support for pregnant and breastfeeding women, as is done in some developed countries (for example, the Women, Infants, and Children program in the United States). It is also important to expand education programs on the nutritional value of breastfeeding for women with young babies.
• Another major finding is the poor state of hygiene in which many households in both rural and urban areas live. Most households have no proper way to dispose of refuse and also lack access to safe and hygienic sources of water. It is critical that efforts be ramped up to ensure that households have access to safe water as well as hygienic methods to dispose of refuse in order to reduce the incidence of disease.
• In terms of nutrition, most Nigerians, regardless of location or wealth eat a similar starchy diet. However, access to animal-based proteins varies by wealth. Policies that can encourage and increase production and availability of these proteins (particularly eggs and milk) may be necessary to improve the diets of the most vulnerable households. Finally, the study found a huge divide between urban and rural households in terms of access to
resources, living standards, and food security status. We attribute this largely to the fact that most households in rural areas are smallholder agricultural households, with very low productivity. The level of rural poverty has led to unprecedented levels of rural–urban migration, resulting in an aging and undernourished rural farming population. The Agricultural Transformation Agenda7 (ATA) currently being implemented is a step in the right direction as it seeks to provide infrastructure in rural areas, as well as to make agriculture profitable. These efforts need to be intensified and fast-tracked in order to remove agriculture from the list of the poorest livelihoods, as well as to make rural areas attractive to young people who are currently heading for the big city.
7 The ATA is designed to transform the Nigerian agricultural sector by driving income growth, generating employment, and
transforming Nigeria into a leading player in global food markets. The ATA focuses on making agriculture a viable and profitable business for all categories of farmers by promoting private investment in agriculture and encouraging the execution of integrated projects via value-chain processes in order to transform Nigeria into a net exporter of agricultural commodities.

33
REFERENCES
Abbas, I. 2009. “An Overview of Land Cover Changes in Nigeria, 1975.” Journal of Geography and Regional Planning 2 (4): 062–065.
Adedeji, O. H., L. Ibeh, and F. Oyebanji. 2011. “Sustainable Management of Mangrove Coastal Environments in the Niger Delta Region of Nigeria: Role of Remote Sensing and GIS.” Paper presented at the Environmental Management Conference, Federal University of Agriculture, Abeokuta. September 12-15, 2011.
Akinbami, J. F. K., and S. Fadare. 1997. “Strategies for Sustainable Urban and Transport Development in Nigeria.” Transport Policy 4 (4): 237–245.
Akinwale, A. A. 2010. “The Menace of Inadequate Infrastructure in Nigeria.” African Journal on Science, Technology, Innovation, and Development 2 (3): 208–229.
Amnesty International. 2009. Petroleum, Pollution, and Poverty in the Niger Delta. London.
Auty, R. M. (1993). Sustaining Development In Mineral Economies: The Resource Curse Thesis. Psychology Press.
Barrett, C. B. 2002. “Food Security and Food Assistance Programs.” In Handbook of Agricultural Economics, vol. 2, edited by B. Gardner and G. Rausser, 2103–2190. Amsterdam: Elsevier Science.
Black, R. E., S. Cousens, H. L. Johnson, J. E. Lawn, I. Rudan, D. G. Bassani, R. Cibulskis 2010. “Global, Regional, and National Causes of Child Mortality in 2008: A Systematic Analysis.” Lancet 375 (9730): 1969–1987.
Cesar, G. V., L. Adair, C. Fall, P. Hallal, R. Martorell, L. Richter, and H. Sachdev. 2008. “Maternal and Child Undernutrition: Consequences for Adult Health and Human Capital.” Lancet 371 (9609): 340–357.
CIA (Central Intelligence Agency). 2012. World Factbook: Nigeria. www.cia.gov/library/publications/the-world-factbook/geos/ni.html.
Cocks, M. L. 2006. Wild Plant Resources and Cultural Practices in Rural and Urban Households in South Africa: Implications for Bio-cultural Diversity Conservation. Institute of Social and Economic Research, Rhodes University, Grahamstown, South Africa.
Ekong, P. S., E. Ducheyne, T. E. Carpenter, O. A. Owolodun, A. T. Oladokun, L. H. Lombin, and D. Berkvens. 2012. “Spatio-temporal Epidemiology of Highly Pathogenic Avian Influenza (H5N1) Outbreaks in Nigeria, 2006–2008.” Preventive Veterinary Medicine 103(2-3): 170-177
Enete, I. C., and E. Ezenwanji. 2011. “Implications of Climate Variability on Water Resources of Nigeria: A Review.” Journal of Geography and Regional Planning 4 (13): 678–682.
ESA/UN (United Nations, Department of Economic and Social Affairs). 2011. World Urbanization Prospects, the 2011 Revision.
FAO (Food and Agriculture Organization of the United Nations). 2011. The State of Food and Agriculture, 2010–2011: Women in Agriculture—Closing the Gender Gap for Development. Rome.
________. 2002. The State of Food Insecurity in the World, 2001. Rome.
Fasoranti, M. 2006. “A Stochastic Frontier Analysis of Effectiveness of Cassava-Based Cropping Systems in Ondo State, Nigeria.” PhD thesis, Federal University of Technology, Akure.
FMWR. 2000. Water Supply and Sanitation Interim Strategy Note. Federal Ministry of Water Resources (FMWR), Federal Government of Nigeria, Abuja, Nigeria. http://siteresources.worldbank.org/NIGERIAEXTN/Resources/wss_1100.pdf
FEWSNET (Famine Early Warning Systems Network). 2012. Third quarter 2012. www.fews.net/ml/en/info/Pages/fmwkfactors.aspx?l=en&gb=ng&fmwk=factor.
Frost, M. B., R. Forste, and D. W. Haas. 2005. “Maternal Education and Child Nutritional Status in Bolivia: Finding the Links.” Social Science and Medicine 60 (2): 395–407.

34
Giri, C., Ochieng, E., Tieszen, L.L., Zhu, Z., Singh, A., Loveland, T., Masek, J. and Duke, N. 2011. Status and distribution of mangrove forests of the world using earth observation satellite data. Global Ecology and Biogeography. 20(1): 154-159.
Gleick, P. H. 2000. The World’s Water, 2000–2001: The Biennial Report on Freshwater Resources. Washington DC: Island Press:
Hoddinott, J., and Y. Yohannes. 2002. Dietary Diversity as a Food Security Indicator. Food Consumption and Nutrition Division (FCND) Discussion Papers 136. Washington DC: International Food Policy Research Institute (IFPRI)
IFAD (International Fund for Agricultural Development). 2001. “Republic of Nigeria. Country Strategic Opportunities Paper (COSOP).” Paper presented at the “A Framework for Rural Poverty Reduction between Nigeria and IFAD,” Executive Board, 72nd Session, Rome, April 25–26.
________. 2012. Rural Poverty Portal. www.ruralpovertyportal.org/country/statistics/tags/Nigeria.
Imam, H. 2012. “Educational Policy in Nigeria from the Colonial Era to the Post-Independence Period.” Italian Journal of Sociology of Education 1: 181-204
Kramer, M. S., & R. Kakuma. (2009). Optimal duration of exclusive breastfeeding (Review). Cochrane Database of Systematic Reviews 2002, 1:1-19 http://onlinelibrary.wiley.com/doi/10.1002/14651858.CD003517/pdf/standard
Kuepie, M., C. J. Nordman, and F. Roubaud. 2009. “Education and Earnings in Urban West Africa.” Journal of Comparative Economics 37 (3): 491–515.
Liverpool-Tasie, L. S., O. Kuku, and A. Ajibola. 2011. Review of Literature on Agricultural Productivity, Social Capital, and Food Security in Nigeria. Nigeria Strategy Support Program Working Paper 21. Washington, DC: International Food Policy Research Institute.
Megill, D. 2010. Final Sample Design and Estimation Procedures for 2010 Nigeria General Household Panel Survey. National Bureau of Statistics. Abuja, Nigeria.
Mohamed-Saleem, M. 1986. “The Ecology, Vegetation, and Land Use of Subhumid Nigeria.” Paper presented at the . ILCA/NAPRI Symposium of Livestock Systems Research in Nigeria’s Subhumid Zone, Kaduna, Nigeria, October 29–November 2, 1986.
National Health Bill of the Federal Republic of Nigeria (SB.50). 2008. Abuja Nigeria.
NBS (National Bureau of Statistics). 2011. Annual Socio-Economic Report, abstract of the unemployment report in Nigeria. Abuja, Nigeria.
________. 2012a. Nigeria Poverty Profile 2010. Abuja, Nigeria.
________. 2012b. Gross domestic product for Nigeria: 2011 and estimates for Q1–Q2, 2012. Abuja, Nigeria
________. 2012c. GDP for Nigeria, revised 2011 and estimates for Q1–Q3, 2012. Abuja, Nigeria.
Nigeria, Ministry of the Environment. 2001. National Action Programme to Combat Desertification. Abuja, Nigeria.
Nigeria, Ministry of Health. 2009. The National Strategic Health Development Plan Framework, 2009–2015. Health Sector Reform Programme. Abuja.
Nigeria, National Planning Commission. 2010. 2010 Millennium Development Goals Report. Abuja.
Nigeria, National Population Commission. 2008. 2008 Nigeria Demographic and Health Survey Fact Sheet. Abuja.www.measuredhs.com/pubs/pdf/GF15/GF15.pdf.
NISER (Nigerian Institute for Social and Economic Research). 2008. The Global Food Crisis: Impact and Policy Implications in Nigeria. Ibadan, Nigeria.
Obayelu, A. E. 2010. “Classifications of Households into Food Security Status in the North Central Nigeria: An Application of Rasch Measurement Model.” Journal of Agricultural and Biological Sciences 5 (3). 26-41.
35
Orewa, S., and C. Iyanbe. 2009. “Household Food Insecurity in Nigeria: An Assessment of the Present Status of Protein–Energy Malnutrition among Rural and Low-Income Urban Households.” Journal of Applied Sciences Research 5 (10): 1615–1621.
Rubinstein, Y., and Y. Weiss. 2006. “Post Schooling Wage Growth: Investment, Search, and Learning.” In E. A. Hanushek and F. Welch (Eds.). Handbook of the Economics of Education, vol. 1, 1–67. Amsterdam, Holland: Elsevier.
Ruel, M. T. 2003. “Is Dietary Diversity an Indicator of Food Security or Dietary Quality? A Review of Measurement Issues and Research Needs.” Food and Nutrition Bulletin 24 (2): 231–232.
Saito, K. A., H. Mekonnen, and D. Spurling. 1994. Raising the Productivity of Women Farmers in Sub-Saharan Africa. Discussion Paper 230. World Bank Publications.
Sanusi, L. S. 2012. “The Role of Development Finance Institutions in Infrastructure Development: What Nigeria Can Learn from BNDES and Indian Infrastructure Finance Company.” Paper presented at the 3rd ICRC PPP Stakeholders Forum, Lagos, Nigeria, July 18.
Udry, C., J. Hoddinott, H. Alderman, and L. Haddad. 1995. “Gender Differentials in Farm Productivity: Implications for Household Efficiency and Agricultural Policy.” Food Policy 20 (5): 407–423.
UN-HABITAT. 2009. State of the World’s Cities, 2008/2009: Regional Updates: Africa at a Glance. www.unhabitat.org/downloads/docs/presskitsowc2008/regional%20updates%20Africa.pdf.
UNICEF. 2010. At a Glance: Nigeria. www.unicef.org/infobycountry/nigeria_statistics.html.
Wamani, H., T. Tylleskär, A. N. Åstrøm, J. K. Tumwine, and S. Peterson. 2004. “Mothers’ Education but Not Fathers’ Education, Household Assets or Land Ownership Is the Best Predictor of Child Health Inequalities in Rural Uganda.” International Journal for Equity in Health 3 (1): 9.
Weinberger, K., and I. Swai. 2006. “Consumption of Traditional Vegetables in Central and North Eastern Tanzania.” Ecology of Food and Nutrition 45 (2): 87–103.
WFP (World Food Programme). 2002. VAM Standard Analytical Framework. Rome.
WFP (World Food Programme). 2008. Technical Guidance Sheet. Rome. http://documents.wfp.org/stellent/groups/public/documents/manual_guide_proced/wfp197216.pd
WHO (World Health Organization). 2008. Nutrition Landscape Information System: Nigeria Country Profile.
World Bank. 2012. Nigeria Overview. www.worldbank.org/en/country/nigeria/overview.


RECENT IFPRI DISCUSSION PAPERS
For earlier discussion papers, please go to www.ifpri.org/pubs/pubs.htm#dp. All discussion papers can be downloaded free of charge.
1274. Targeting technology to reduce poverty and conserve resources: Experimental delivery of laser land leveling to farmers in Uttar Pradesh, India. Travis J. Lybbert, Nicholas Magnan, David J. Spielman, Anil Bhargava, and Kajal Gulati, 2013.
1273. The logic of adaptive sequential experimentation in policy design. Haipeng Xing and Xiaobo Zhang, 2013.
1272. Dynamics of transformation: insights from an exploratory review of rice farming in the Kpong Irrigation Project. Hiroyuki Takeshima, Kipo Jimah, Shashidhara Kolavalli, Xinshen Diao, and Rebecca Lee Funk, 2013.
1271. Population density, migration, and the returns to human capital and land: insights from Indonesia. Yanyan Liu and Futoshi Yamauchi, 2013.
1270. Reverse-share-tenancy and marshallian inefficiency: Landowners’ bargaining power and sharecroppers’ productivity. Hosaena Ghebru Hagos and Stein T. Holden, 2013.
1269. The child health implications of privatizing Africa’s urban water supply. Katrina Kosec, 2013.
1268. Group lending with heterogeneous types. Li Gan, Manuel A. Hernandez, and Yanyan Liu, 2013.
1267. Typology of farm households and irrigation systems: Some evidence from Nigeria. Hiroyuki Takeshima and Hyacinth Edeh, 2013.
1266. Understanding the role of research in the evolution of fertilizer policies in Malawi. Michael Johnson and Regina Birner, 2013.
1265. The policy landscape of agricultural water management in Pakistan. Noora-Lisa Aberman, Benjamin Wielgosz, Fatima Zaidi, Claudia Ringler, Agha Ali Akram, Andrew Bell, and Maikel Issermann, 2013.
1264. Who talks to whom in African agricultural research information networks?: The Malawi case. Klaus Droppelmann, Mariam A. T. J. Mapila, John Mazunda, Paul Thangata, and Jason Yauney, 2013.
1263. Measuring food policy research capacity: Indicators and typologies. Suresh Chandra Babu and Paul Dorosh, 2013.
1262. Does freer trade really lead to productivity growth?: Evidence from Africa. Lauren Bresnahan, Ian Coxhead, Jeremy Foltz, and Tewodaj Mogues, 2013.
1261. Data needs for gender analysis in agriculture. Cheryl Doss, 2013.
1260. Spillover effects of targeted subsidies: An assessment of fertilizer and improved seed use in Nigeria. Lenis Saweda Liverpool-Tasie and Sheu Salau, 2013
1259. The impact of irrigation on nutrition, health, and gender: A review paper with insights for Africa south of the Sahara. Laia Domenech and Claudia Ringler, 2013.
1258. Assessing the effectiveness of multistakeholder platforms: Agricultural and rural management councils in the Democratic Republic of the Congo. Thaddée Badibanga, Catherine Ragasa, and John Ulimwengu, 2013.
1257. The impact of Oportunidades on human capital and income distribution: A top-down/bottom-up approach. Dario Debowicz and Jennifer Golan, 2013.
1256. Filling the learning gap in program implementation using participatory monitoring and evaluation: Lessons from farmer field schools in Zanzibar. Elias Zerfu and Sindu W. Kebede, 2013.
1255. Agricultural mechanization in Ghana: Is specialization in agricultural mechanization a viable business model?: Nazaire Houssou, Xinshen Diao, Frances Cossar, Shashidhara Kolavalli, Kipo Jimah, and Patrick Aboagye, 2013.
1254. A partial equilibrium model of the Malawi maize commodity market. Mariam A. T. J. Mapila, Johann F. Kirsten, Ferdinand Meyer, and Henry Kankwamba, 2013.
1253. Exchange rate policy and devaluation in Malawi. Karl Pauw, Paul Dorosh, and John Mazunda, 2013.
1252. A regional computable general equilibrium model for Honduras: Modeling exogenous shocks and policy alternatives. Samuel Morley and Valeria Piñeiro, 2013.
1251. Agricultural trade: What matters in the Doha Round? David Laborde and Will Martin, 2013..

INTERNATIONAL FOOD POLICY RESEARCH INSTITUTE
www.ifpri.org
IFPRI HEADQUARTERS 2033 K Street, NW Washington, DC 20006-1002 USA Tel.: +1-202-862-5600 Fax: +1-202-467-4439 Email: [email protected]
IFPRI ABUJA OFFICE No 6/Plot 1413 Ogbagi Street Off Oro-Ago Crescent Cadastral Zone II Garki, Abuja Nigeria +08.03.587.0332 Email: [email protected]