video course: image and resolution enhancement 1dehaan/slides/5_imenh125.pdf · video course: image...
TRANSCRIPT
1Video course: Image and Resolution Enhancement
technische universiteit eindhoven
Video processing
G. de Haan
technische universiteit eindhoven
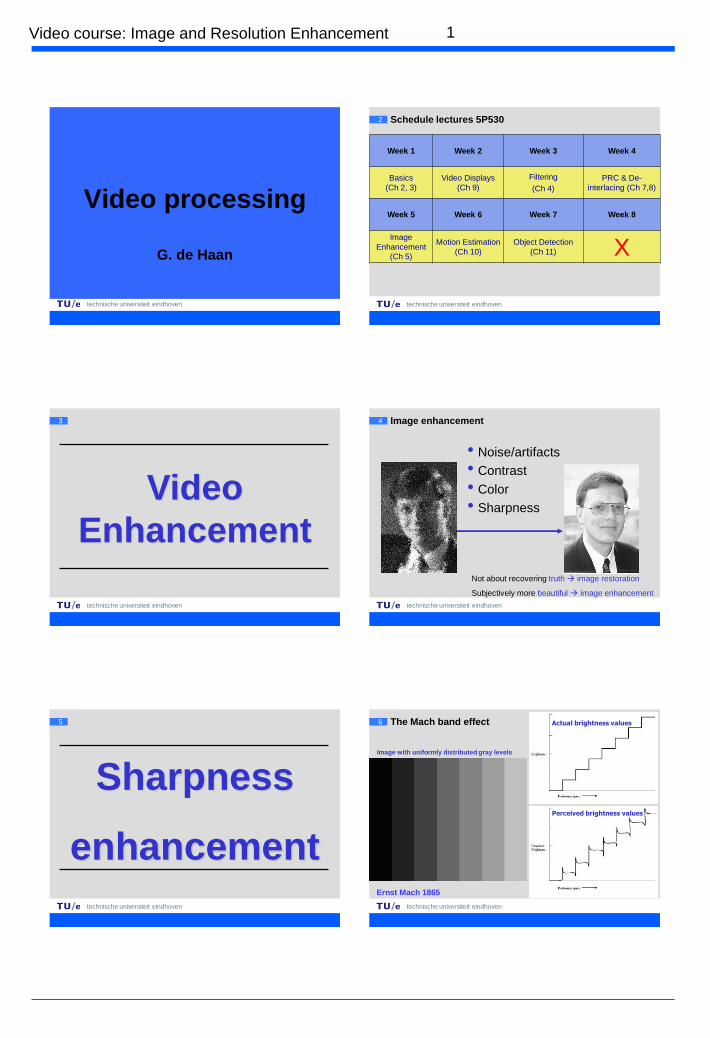
Schedule lectures 5P5302
Week 1 Week 2 Week 3 Week 4
Basics
(Ch 2, 3)
Video Displays
(Ch 9)
Filtering
(Ch 4)
PRC & De-
interlacing (Ch 7,8)
Week 5 Week 6 Week 7 Week 8
Image
Enhancement
(Ch 5)
Motion Estimation
(Ch 10)
Object Detection
(Ch 11) X
technische universiteit eindhoven
3
Video
Enhancement
technische universiteit eindhoven
4 Image enhancement
• Noise/artifacts
• Contrast
• Color
• Sharpness
Not about recovering truth image restoration
Subjectively more beautiful image enhancement
technische universiteit eindhoven
5
Sharpness
enhancement
technische universiteit eindhoven
6
Image with uniformly distributed gray levels
Actual brightness valuesThe Mach band effect
Perceived brightness values
Ernst Mach 1865
2Video course: Image and Resolution Enhancement
technische universiteit eindhoven
7 We have seen it is indeed a band-pass filter
technische universiteit eindhoven
8
se0600.ppt
Related: Luminance perception
technische universiteit eindhoven
9
se0600.ppt
Luminance perception: The proof!
technische universiteit eindhoven
10 Another example…
technische universiteit eindhoven
11
Sharpness
enhancement:
PEAKING
technische universiteit eindhoven
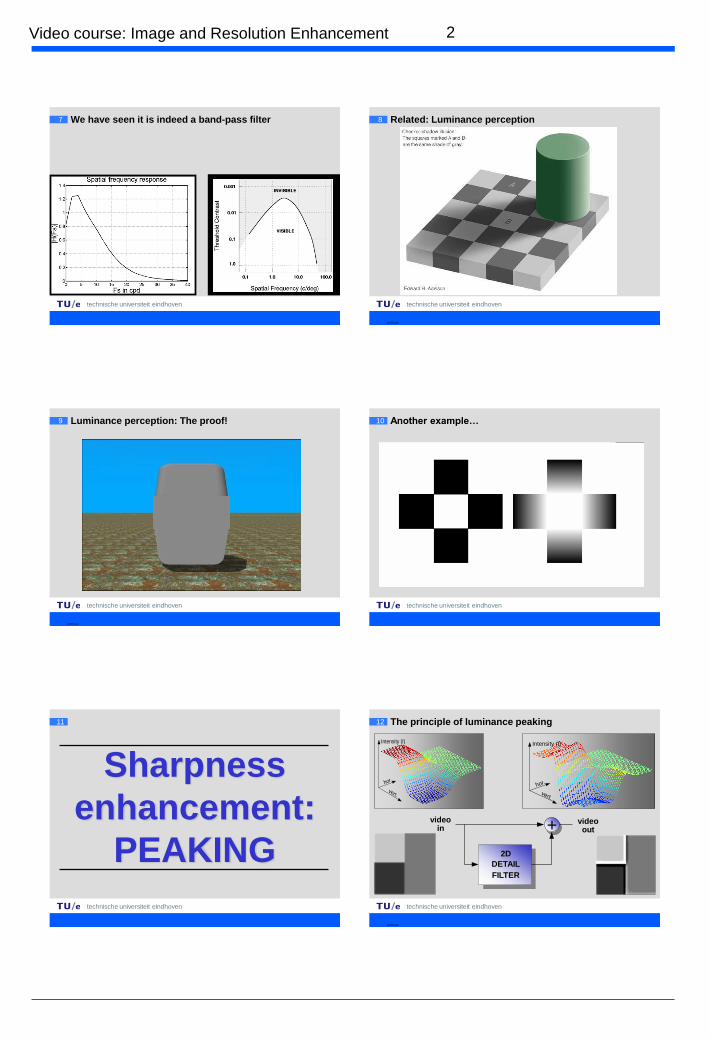
12
se0600.ppt
2D
DETAIL
FILTER
videoin
videoout+
The principle of luminance peaking
Intensity (I)
hor.
vert.
Intensity (I)
hor.
vert.
3Video course: Image and Resolution Enhancement
technische universiteit eindhoven
13 Wheel image 2-D HP filtered
technische universiteit eindhoven
14 Wheel image with 2-D peaking
technische universiteit eindhoven
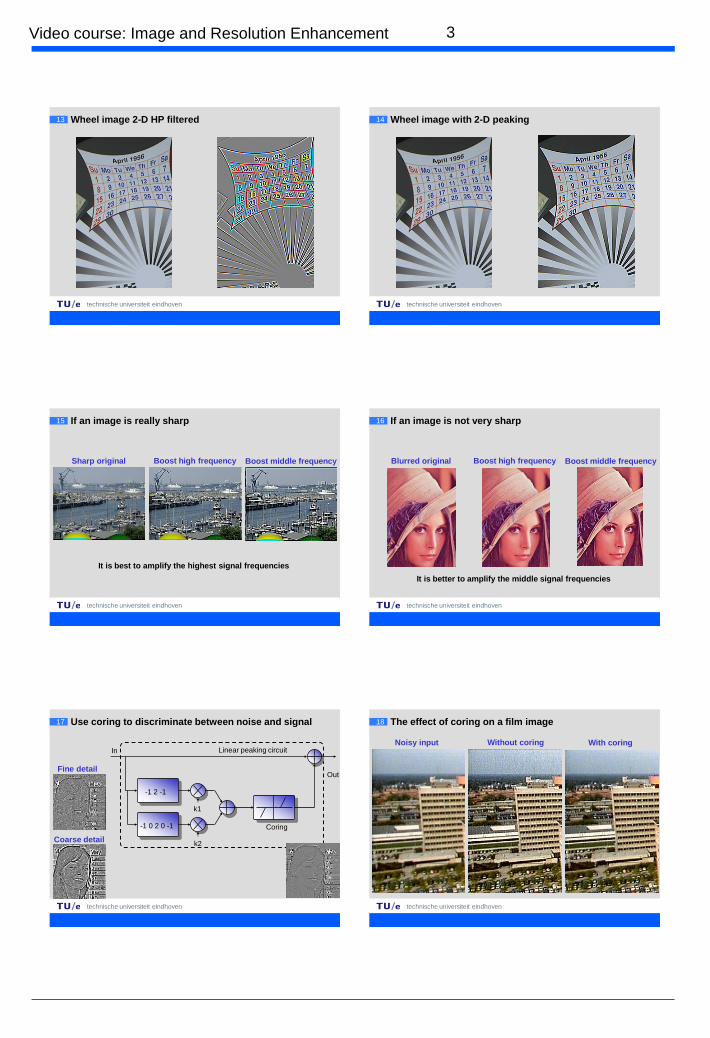
15 If an image is really sharp
Sharp original Boost high frequency Boost middle frequency
It is best to amplify the highest signal frequencies
technische universiteit eindhoven
16 If an image is not very sharp
Blurred original Boost high frequency Boost middle frequency
It is better to amplify the middle signal frequencies
technische universiteit eindhoven
17
In
Out
Coring
Linear peaking circuit
-1 2 -1
-1 0 2 0 -1
k1
k2
Use coring to discriminate between noise and signal
Fine detail
Coarse detail
technische universiteit eindhoven
18 The effect of coring on a film image
Noisy input Without coring With coring
4Video course: Image and Resolution Enhancement
technische universiteit eindhoven
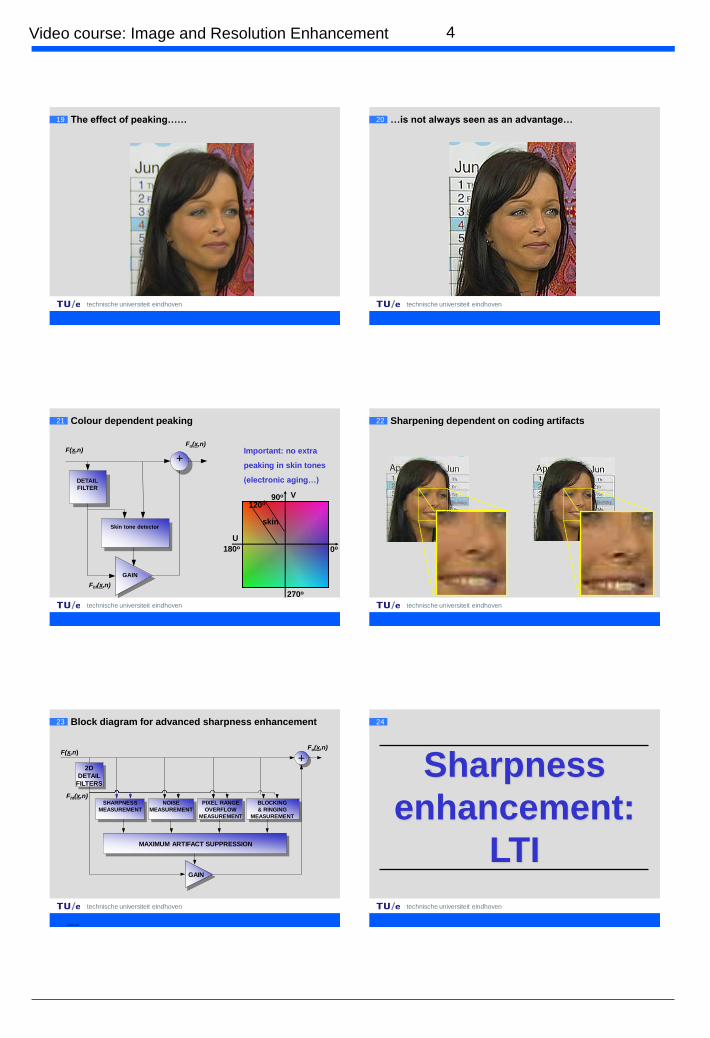
19 The effect of peaking……
technische universiteit eindhoven
20 …is not always seen as an advantage…
technische universiteit eindhoven
21 Colour dependent peaking
DETAIL
FILTER
+
GAIN
Skin tone detector
F(x,n)Fo(x,n)
Fhf(x,n)
Important: no extra
peaking in skin tones
(electronic aging…)
U
V
0o
90o
270o
180o
120o
skin
technische universiteit eindhoven
22 Sharpening dependent on coding artifacts
technische universiteit eindhoven
23
se0600.ppt
2D
DETAILFILTERS
+
SHARPNESS
MEASUREMENT
F(x,n)
Fhf(x,n)
MAXIMUM ARTIFACT SUPPRESSION
GAIN
NOISE
MEASUREMENT
PIXEL RANGE
OVERFLOW
MEASUREMENT
BLOCKING
& RINGING
MEASUREMENT
Block diagram for advanced sharpness enhancement
Fo(x,n)
technische universiteit eindhoven
24
Sharpness
enhancement:
LTI
5Video course: Image and Resolution Enhancement
technische universiteit eindhoven
25
Edge signal
Peaking result
Edge compress
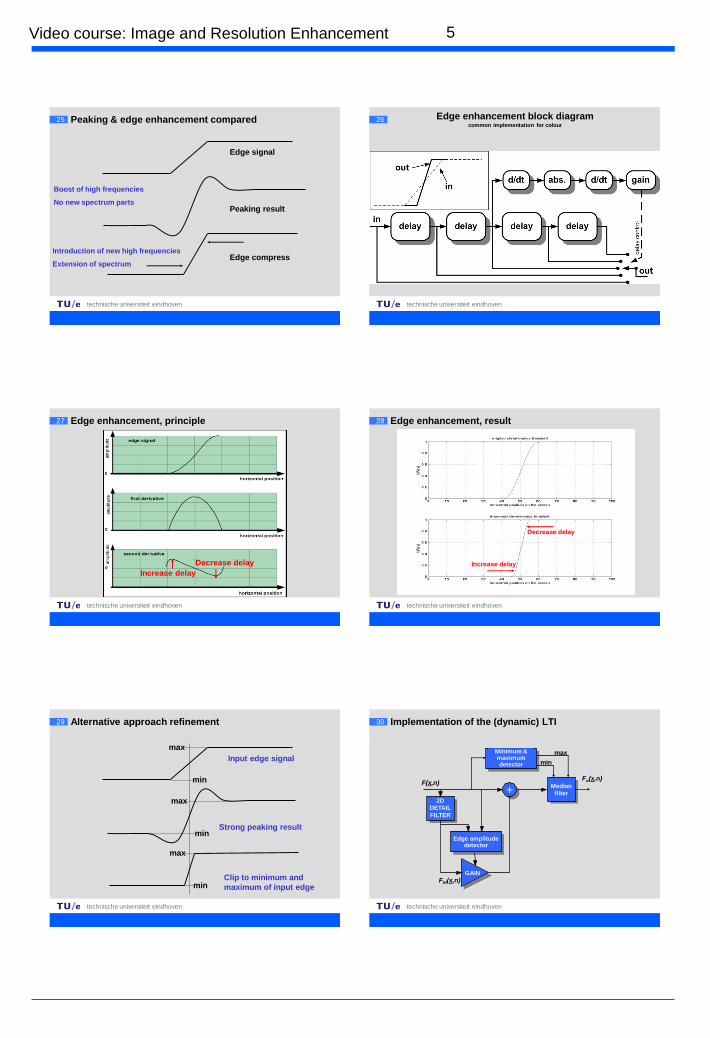
Peaking & edge enhancement compared
Boost of high frequencies
No new spectrum parts
Introduction of new high frequencies
Extension of spectrum
technische universiteit eindhoven
26 Edge enhancement block diagramcommon implementation for colour
technische universiteit eindhoven
27 Edge enhancement, principle
Increase delay
Decrease delay
technische universiteit eindhoven
28 Edge enhancement, result
Increase delay
Decrease delay
technische universiteit eindhoven
29 Alternative approach refinement
Input edge signal
max
min
Strong peaking result
max
min
Clip to minimum and
maximum of input edge
max
min
technische universiteit eindhoven
30 Implementation of the (dynamic) LTI
2D
DETAIL
FILTER
+
GAIN
Edge amplitude detector
F(x,n)Fo(x,n)
Fhf(x,n)
Minimum & maximum detector
Median
filter
max
min
6Video course: Image and Resolution Enhancement
technische universiteit eindhoven
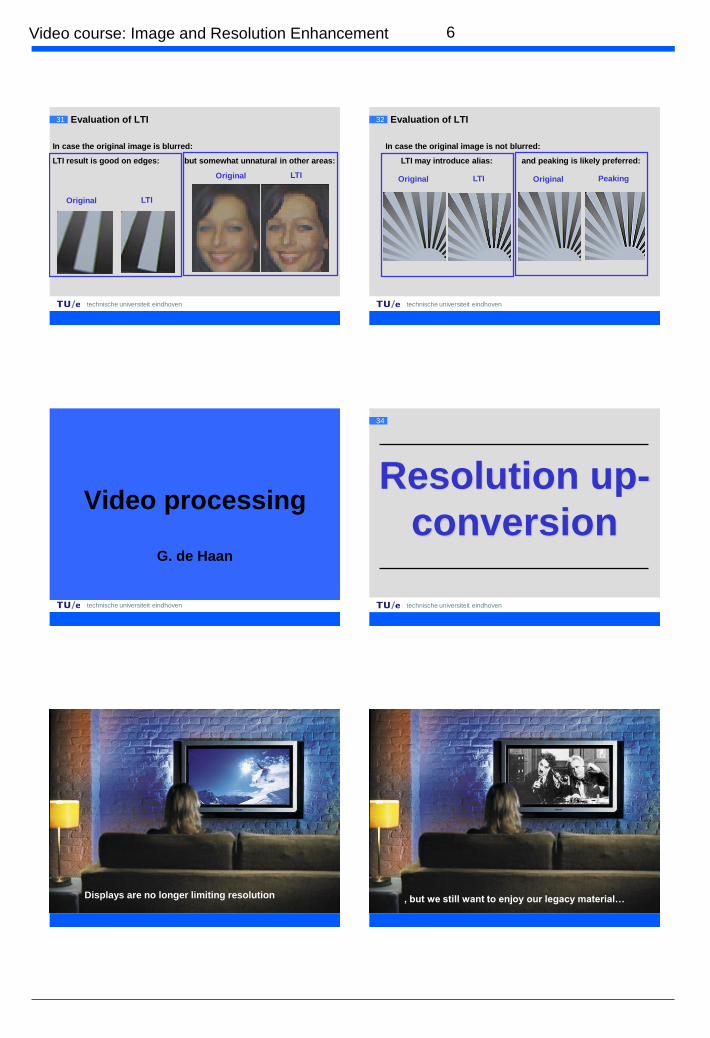
31 Evaluation of LTI
Original LTI
Original LTI
In case the original image is blurred:
LTI result is good on edges: but somewhat unnatural in other areas:
technische universiteit eindhoven
32 Evaluation of LTI
Original LTI Original Peaking
In case the original image is not blurred:
LTI may introduce alias: and peaking is likely preferred:
technische universiteit eindhoven
Video processing
G. de Haan
technische universiteit eindhoven
34
Resolution up-
conversion
technische universiteit eindhoven
35
Displays are no longer limiting resolutiontechnische universiteit eindhoven
36
, but we still want to enjoy our legacy material…
7Video course: Image and Resolution Enhancement
technische universiteit eindhoven
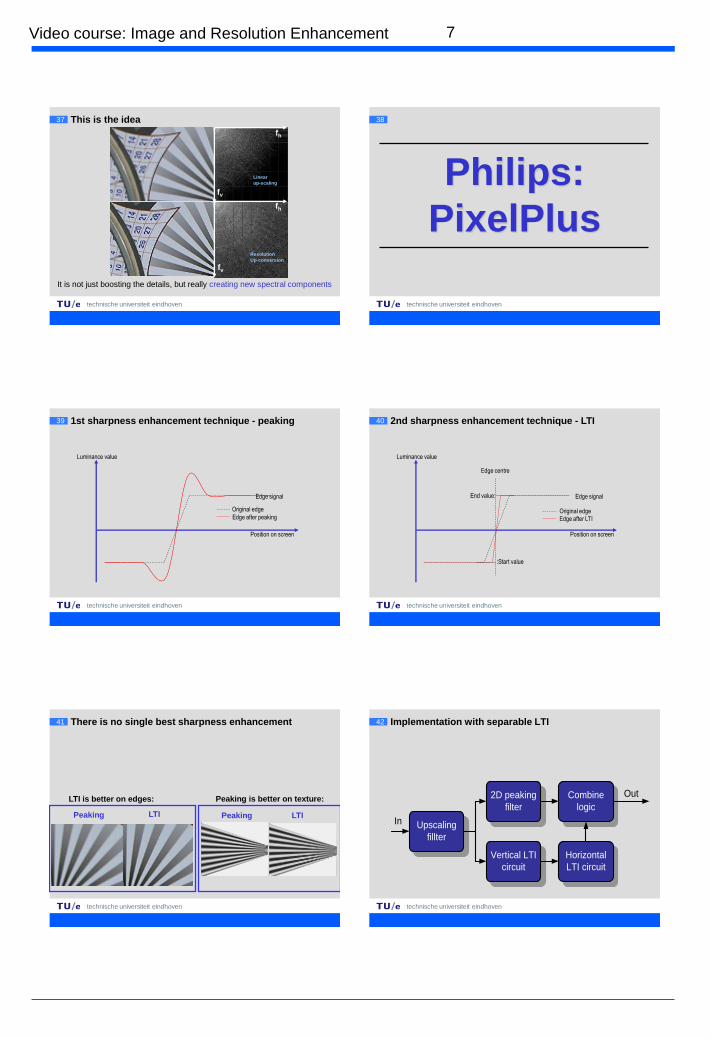
37 This is the idea
It is not just boosting the details, but really creating new spectral components
fh
fh
fv
fv
Linear
up-scaling
Resolution
Up-conversion
technische universiteit eindhoven
38
Philips:
PixelPlus
technische universiteit eindhoven
39
Position on screen
Luminance value
Edge signal
Edge after peaking
Original edge
1st sharpness enhancement technique - peaking
technische universiteit eindhoven
40
Original edgeEdge after LTI
Edge centre
End value:
:Start value
Position on screen
Luminance value
Edge signal
2nd sharpness enhancement technique - LTI
technische universiteit eindhoven
41 There is no single best sharpness enhancement
LTI
LTI is better on edges: Peaking is better on texture:
Peaking LTIPeaking
technische universiteit eindhoven
42 Implementation with separable LTI
2D peaking
filter
Vertical LTI
circuit
Horizontal
LTI circuit
Upscaling
fillter
Combine
logic
In
Out
8Video course: Image and Resolution Enhancement
technische universiteit eindhoven
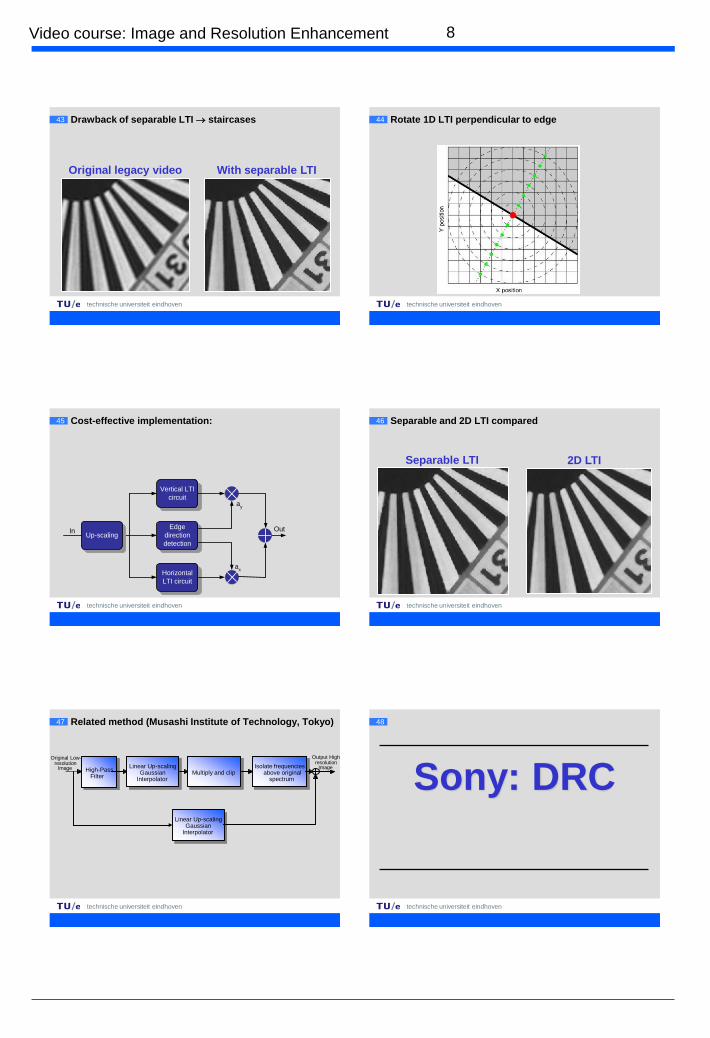
43
With separable LTIOriginal legacy video
Drawback of separable LTI staircases
technische universiteit eindhoven
44 Rotate 1D LTI perpendicular to edge
technische universiteit eindhoven
45 Cost-effective implementation:
Vertical LTI
circuit
Edge
direction
detection
Horizontal
LTI circuit
In Out
ay
ax
Up-scaling
technische universiteit eindhoven
46 Separable and 2D LTI compared
Separable LTI 2D LTI
technische universiteit eindhoven
47 Related method (Musashi Institute of Technology, Tokyo)
High-PassFilter
Linear Up-scalingGaussian
InterpolatorMultiply and clip
Isolate frequenciesabove original
spectrum
Linear Up-scalingGaussian
Interpolator
Original Low-resolution
Image
Output High-resolution
Image
technische universiteit eindhoven
48
Sony: DRC
9Video course: Image and Resolution Enhancement
technische universiteit eindhoven
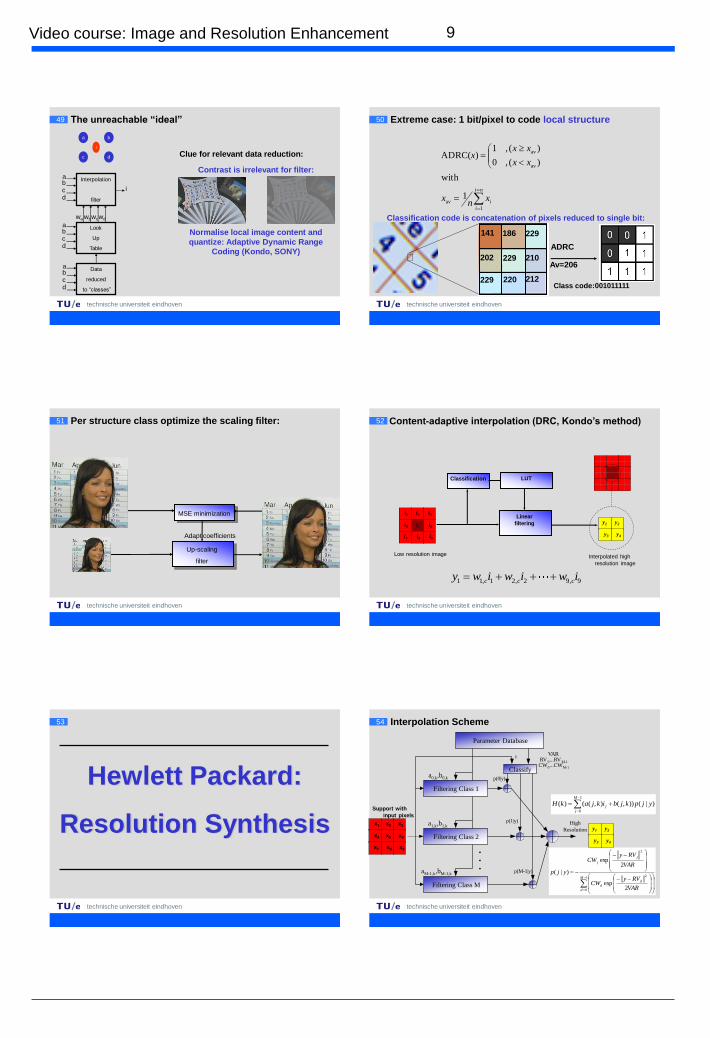
49 The unreachable “ideal”
a
c
b
d
i
abcd
Look
Up
Table
Interpolation
filter
abcd
i
wa wbwcwd
abcd
Data
reduced
to “classes”
Clue for relevant data reduction:
Normalise local image content and
quantize: Adaptive Dynamic Range
Coding (Kondo, SONY)
Contrast is irrelevant for filter:
technische universiteit eindhoven
50 Extreme case: 1 bit/pixel to code local structure
ni
i
ixn
x
xx
xxx
1
av
av
av
1
with
)(,0
)(,1)ADRC(
Classification code is concatenation of pixels reduced to single bit:
141 186
202
229
229
229
210
212220
Av=206
ADRC
Class code:001011111
technische universiteit eindhoven
51 Per structure class optimize the scaling filter:
MSE minimization
Up-scaling
filter
Adapt coefficients
technische universiteit eindhoven
52
i1 i2 i3
i4 i5 i6
i7 i8 i9
y1 y2
y3 y4
1 1, 1 2, 2 9, 9c c cy w i w i w i
Content-adaptive interpolation (DRC, Kondo’s method)
Low resolution image Interpolated high
resolution image
LUTClassification
Linear
filtering
technische universiteit eindhoven
53
Hewlett Packard:
Resolution Synthesis
technische universiteit eindhoven
54 Interpolation Scheme
1
0
)|()),(),(()(M
j
j yjpkjbikjakH
Filtering Class 1
Filtering Class 2
Filtering Class M
Parameter Database
.
.
.
Classify
y
a0,k,b0,k
a1,k,b1,k
aM-1,k,bM-1,k
High
Resolution
p(0|y)
p(1|y)
p(M-1|y)
VARRV 0...RVM-1CW0...CWM-1
1
0
2
2
2exp
2exp
)|(M
d
d
d
j
j
VAR
RVyCW
VAR
RVyCW
yjp
y1 y2
y3 y4
x1 x2 x3
x4 x5 x6
x7 x8 x9
Support with
input pixels
10Video course: Image and Resolution Enhancement
technische universiteit eindhoven
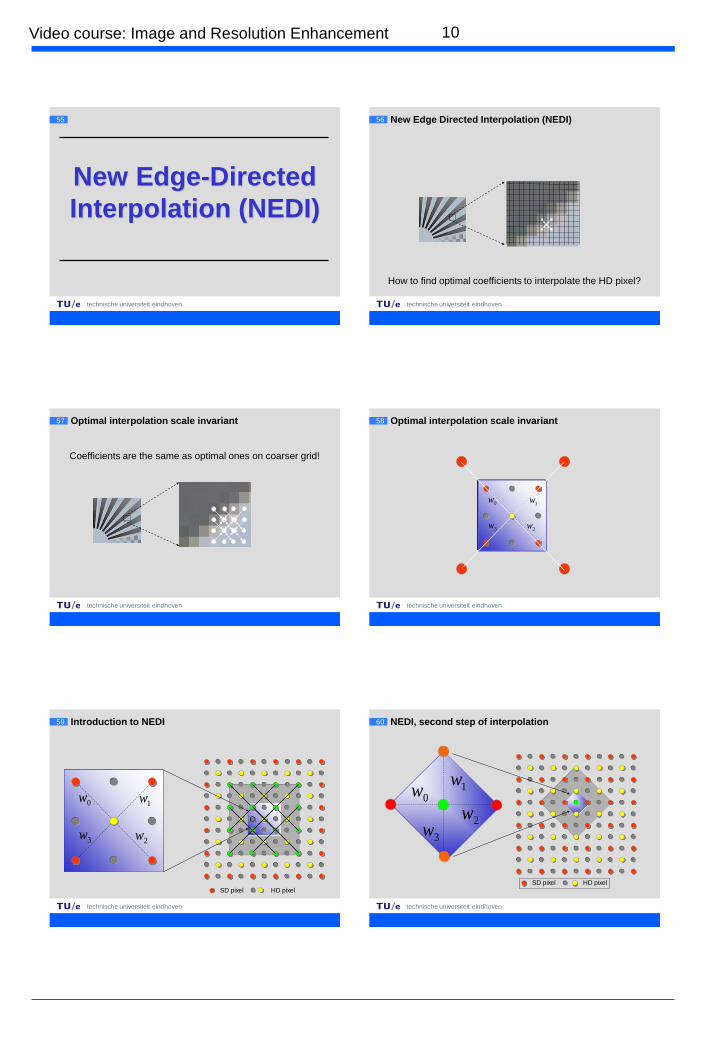
55
New Edge-Directed
Interpolation (NEDI)
technische universiteit eindhoven
56 New Edge Directed Interpolation (NEDI)
How to find optimal coefficients to interpolate the HD pixel?
technische universiteit eindhoven
57 Optimal interpolation scale invariant
Coefficients are the same as optimal ones on coarser grid!
technische universiteit eindhoven
58 Optimal interpolation scale invariant
0w1w
2w3w
technische universiteit eindhoven
59
0w1w
2w3w
SD pixel HD pixel
Introduction to NEDI
technische universiteit eindhoven
60
0w 1w
2w3w
HD pixelSD pixel
NEDI, second step of interpolation
11Video course: Image and Resolution Enhancement
technische universiteit eindhoven
61
Resolution up-conversion
Evaluation
technische universiteit eindhoven
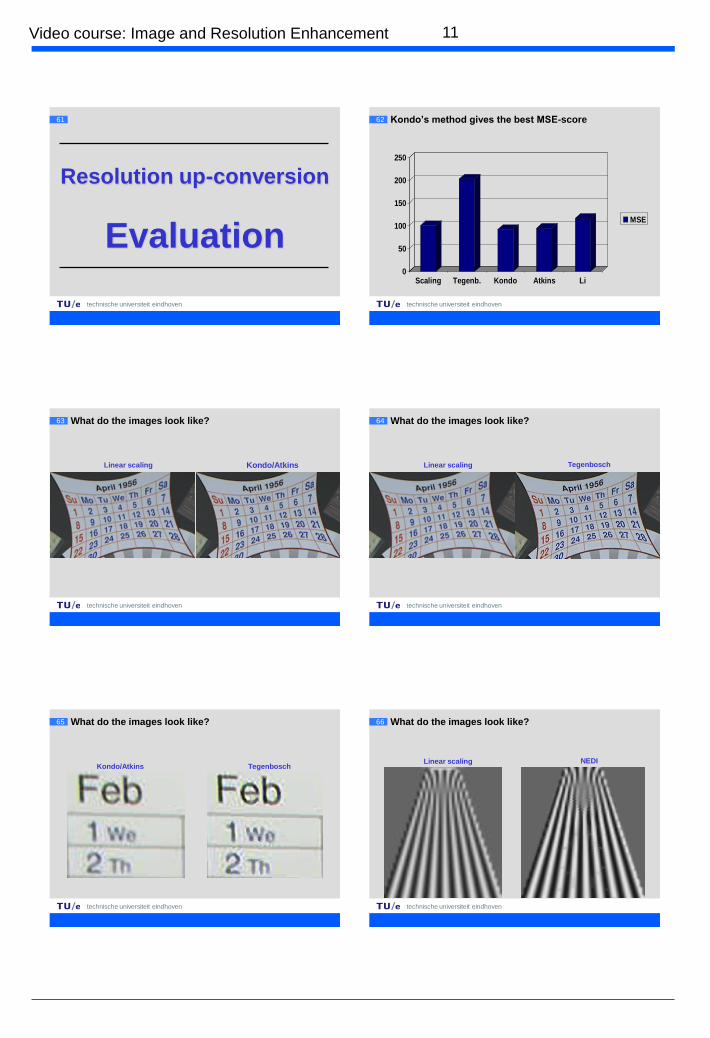
62 Kondo’s method gives the best MSE-score
0
50
100
150
200
250
Scaling Tegenb. Kondo Atkins Li
MSE
technische universiteit eindhoven
63 What do the images look like?
Linear scaling Kondo/Atkins
technische universiteit eindhoven
64 What do the images look like?
TegenboschLinear scaling
technische universiteit eindhoven
65
TegenboschKondo/Atkins
What do the images look like?
technische universiteit eindhoven
66
NEDILinear scaling
What do the images look like?
12Video course: Image and Resolution Enhancement
technische universiteit eindhoven
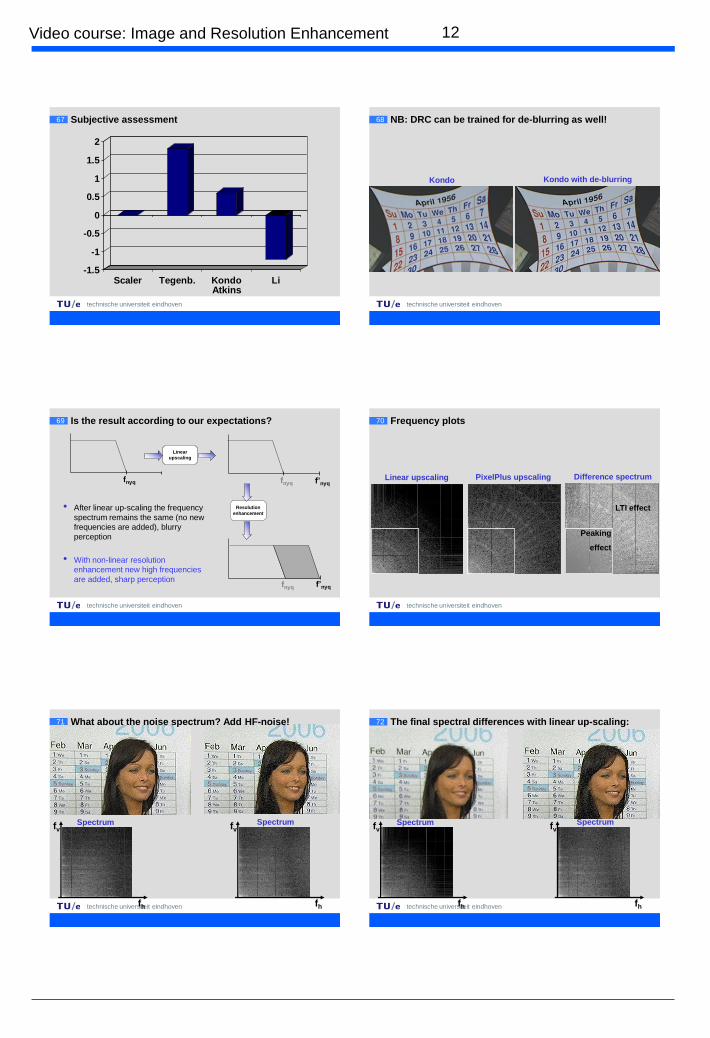
67 Subjective assessment
-1.5
-1
-0.5
0
0.5
1
1.5
2
Scaler Tegenb. Kondo LiAtkins
technische universiteit eindhoven
68 NB: DRC can be trained for de-blurring as well!
Kondo with de-blurringKondo
technische universiteit eindhoven
69 Is the result according to our expectations?
f’nyq
Linear
upscaling
f’nyqfnyqfnyq
Resolution
enhancement
fnyq
• After linear up-scaling the frequency
spectrum remains the same (no new
frequencies are added), blurry
perception
• With non-linear resolution
enhancement new high frequencies
are added, sharp perception
technische universiteit eindhoven
70 Frequency plots
Linear upscaling PixelPlus upscaling Difference spectrum
Peaking
effect
LTI effect
technische universiteit eindhoven
71
PixelPlus upscaling + HF noisePixelPlus upscaling
Spectrum Spectrum
fh
fv
fh
fv
What about the noise spectrum? Add HF-noise!
technische universiteit eindhoven
72 The final spectral differences with linear up-scaling:
PixelPlus upscaling + HF noiseLinear upscaling
SpectrumSpectrum
fh
fv
fh
fv
13Video course: Image and Resolution Enhancement
technische universiteit eindhoven
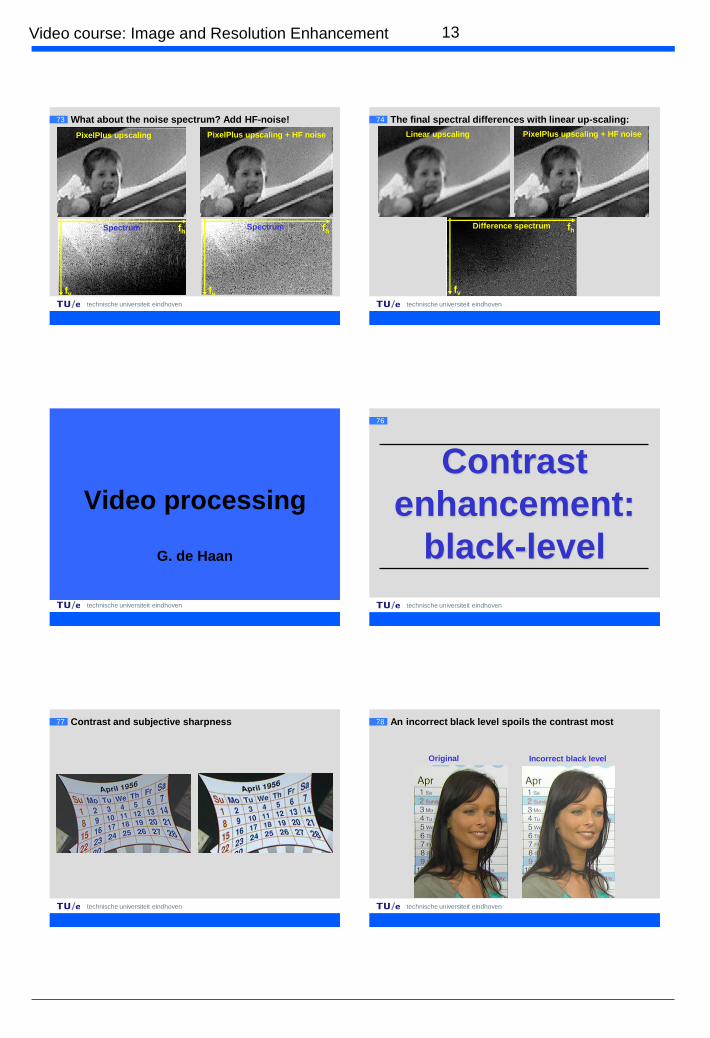
73 What about the noise spectrum? Add HF-noise!
PixelPlus upscaling + HF noisePixelPlus upscaling
Spectrum Spectrumfh
fv
fh
fv
technische universiteit eindhoven
74 The final spectral differences with linear up-scaling:
PixelPlus upscaling + HF noiseLinear upscaling
Difference spectrum fh
fv
technische universiteit eindhoven
Video processing
G. de Haan
technische universiteit eindhoven
76
Contrast
enhancement:
black-level
technische universiteit eindhoven
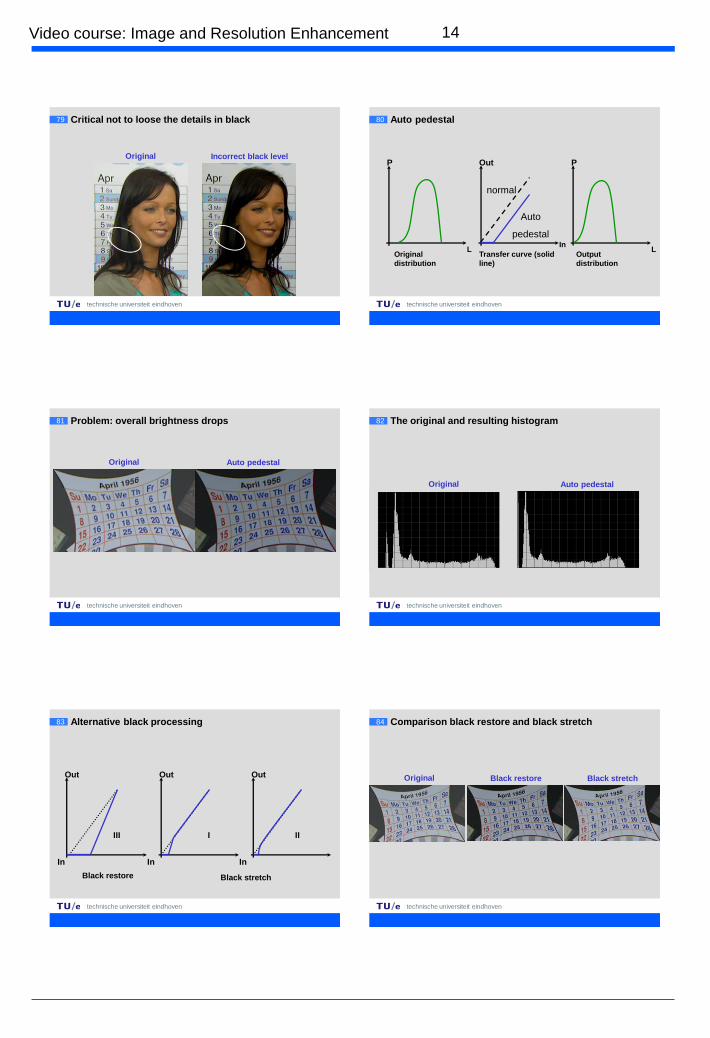
77 Contrast and subjective sharpness
technische universiteit eindhoven
78 An incorrect black level spoils the contrast most
Original Incorrect black level
14Video course: Image and Resolution Enhancement
technische universiteit eindhoven
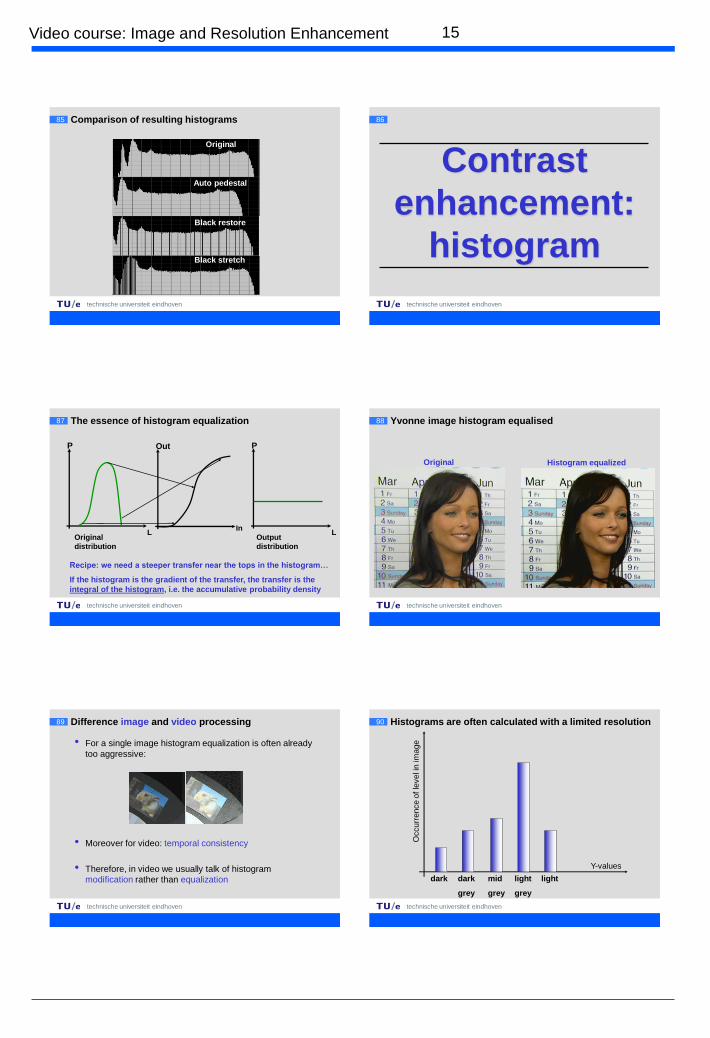
79 Critical not to loose the details in black
Original Incorrect black level
technische universiteit eindhoven
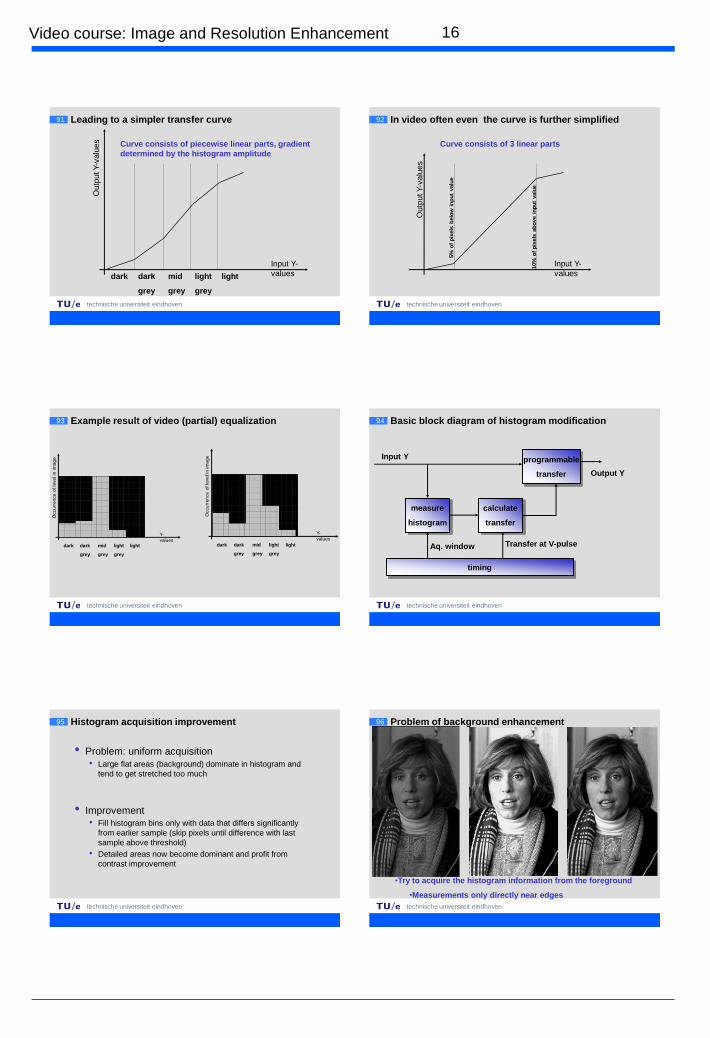
80
Original
distribution
Transfer curve (solid
line)
Output
distribution
P
L
Out
In
P
L
normal
Auto
pedestal
Auto pedestal
technische universiteit eindhoven
81 Problem: overall brightness drops
Original Auto pedestal
technische universiteit eindhoven
82 The original and resulting histogram
Original Auto pedestal
technische universiteit eindhoven
83 Alternative black processing
In
Out
In
III
Black restore
OutOut
In
I II
Black stretch
technische universiteit eindhoven
84 Comparison black restore and black stretch
Original Black restore Black stretch
15Video course: Image and Resolution Enhancement
technische universiteit eindhoven
85 Comparison of resulting histograms
Original
Auto pedestal
Black restore
Black stretch
technische universiteit eindhoven
86
Contrast
enhancement:
histogram
technische universiteit eindhoven
87 The essence of histogram equalization
Original
distribution
Output
distribution
P
L
P
L
Recipe: we need a steeper transfer near the tops in the histogram…
If the histogram is the gradient of the transfer, the transfer is the
integral of the histogram, i.e. the accumulative probability density
Out
In
technische universiteit eindhoven
88 Yvonne image histogram equalised
Original Histogram equalized
technische universiteit eindhoven
89 Difference image and video processing
• For a single image histogram equalization is often already
too aggressive:
• Moreover for video: temporal consistency
• Therefore, in video we usually talk of histogram
modification rather than equalization
technische universiteit eindhoven
90
Occurr
ence o
f le
vel in
im
age
Y-values
Histograms are often calculated with a limited resolution
dark dark
grey
mid
grey
light
grey
light
16Video course: Image and Resolution Enhancement
technische universiteit eindhoven
91
Outp
ut Y-v
alu
es
Input Y-
values
Leading to a simpler transfer curve
dark dark
grey
mid
grey
light
grey
light
Curve consists of piecewise linear parts, gradient
determined by the histogram amplitude
technische universiteit eindhoven
92
Outp
ut Y-v
alu
es
Input Y-
values
In video often even the curve is further simplified
Curve consists of 3 linear parts
5%
of
pix
els
belo
w in
pu
t valu
e
10%
of
pix
els
ab
ove i
np
ut
valu
e
technische universiteit eindhoven
93 Example result of video (partial) equalization
Occu
rren
ce o
f le
vel in
im
ag
e
Y-
valuesdark dark
grey
mid
grey
light
grey
light
Occu
rren
ce o
f le
vel in
im
ag
e
Y-
values
dark dark
grey
mid
grey
light
grey
light
technische universiteit eindhoven
94 Basic block diagram of histogram modification
measure
histogram
calculate
transfer
programmable
transfer
timing
Input Y
Output Y
Transfer at V-pulseAq. window
technische universiteit eindhoven
95 Histogram acquisition improvement
• Problem: uniform acquisition
• Large flat areas (background) dominate in histogram and
tend to get stretched too much
• Improvement
• Fill histogram bins only with data that differs significantly
from earlier sample (skip pixels until difference with last
sample above threshold)
• Detailed areas now become dominant and profit from
contrast improvement
technische universiteit eindhoven
96 Problem of background enhancement
•Try to acquire the histogram information from the foreground
•Measurements only directly near edges
17Video course: Image and Resolution Enhancement
technische universiteit eindhoven
97 Histogram modification of colour images
• Gray scale transforms and histogram modification techniques can be applied by treating a color image as three gray images
• However, independent processing of the colours leads to colour shifts
• The relative colour can be retained by applying the gray scale modification technique to one of the colour channels, and then using the ratios from the original image to find the other colour channel values
technische universiteit eindhoven
98
a) Original poor contrast image b) Histogram equalization based on
the red color band
Histogram equalization of color images
technische universiteit eindhoven
99
c) Histogram equalization based on
the green color band
d) Histogram equalization based on
the blue color band
Note: In this case the red band gives the best results
This will depend on the image and the desired result
Histogram equalization of color images
technische universiteit eindhoven
100 What about the colour?
measure
histogram
calculate
transfer
programmable
transfer
timing
Input Y
Output Y
Transfer at V-pulse
edge
detector
Aq. window
saturation
controlInput U and V Output U and V
ratio
technische universiteit eindhoven
Video processing
G. de Haan
technische universiteit eindhoven
102
Colour
18Video course: Image and Resolution Enhancement
technische universiteit eindhoven
103 Relation wavelength and colour
technische universiteit eindhoven
104
Three types of cones:
L (63%), M (32%) and S (5%)Spectral sensitivity of
rods and cones
S M L
The human eye, perception of colour
We perceive the same colour whenever the different types of cones
are stimulated in the same ratio. The spectrum can then be different!
technische universiteit eindhoven
105
• Used in displays and in
fluorescent lamps
• Based on red, green and blue
primary = RGB-model,
sometimes white added for
improved efficiency (RGBY)
• Primaries defined by
emission of phosphors or
LEDs (lamps, CRT, PDP,
OLED), or colour filters (LCD)
Additive colour mixing
technische universiteit eindhoven
106 What we see with the different cone-types (RGB-system)
Scene
Red, from
the L-cones
Green, from
the M-cones
Blue, from
the S-cones
technische universiteit eindhoven
107 Problem with the R-G-B colour system
• The RGB-colours do not intuitively correspond to our
perception
• We do not recognize the relative strength of the red, green
and blue stimuli
Scene Green
?
technische universiteit eindhoven
108 Hue, Saturation and Hue as intuitive quantities
Hue
Sa
tura
tio
n
Hue
Bri
gh
tne
ss
Fixed (50%) saturation
19Video course: Image and Resolution Enhancement
technische universiteit eindhoven
109 We can do that electronically as well
• We recognize brightness (Intensity), colour tone (Hue),
and colour “strength” (saturation)
• With a matrix operation on the RGB-vector we can convert
to another colour-space
B
G
R
aaa
aaa
aaa
Z
Y
X
.
333231
232221
131211
technische universiteit eindhoven
110 Hue and saturation in the YUV-colour space
Hue
Hue and saturation result from polar
coordinates in the UV-plane
technische universiteit eindhoven
111
inte
nsity
hue
0°
Organising colours
• The HSI (HSV, HSB) method of colour discrimination is closer to how the human brain discriminates colors.
• Hue = colour tone (redness, greenness, etc.) depends on the peak wavelength of light reflected from or transmitted through an object.
• Saturation = purity of the colour (spread of the spectrum) depends on the amount of gray in proportion to the hue - 0% (gray) to 100% (fully saturated).
• Intensity (Value) = Relative lightness or darkness - 0 (black) , 100 (white)
technische universiteit eindhoven
112 Colour spaces compared
H, S, V R, G, B Y, U, V
technische universiteit eindhoven
113
Colour
enhancements
technische universiteit eindhoven
114
The EBU
primaries
PAL/SECAM)
The NTSC
primaries
Area of skin tones
Different primary problem
20Video course: Image and Resolution Enhancement
technische universiteit eindhoven
115
B
G
R
aaa
aaa
aaa
B
G
R
.
'
'
'
333231
232221
131211
Changing primaries
• Newer phosphors lead to less saturated colours
• Matrix correction imperfect due to gamma!
• Optimise for 3 colour points
• skin-tone, white and green most common choice
technische universiteit eindhoven
116 Skin tone correction
• Differential phase errors give colour hue shift (NTSC only)
• Use skin-tone detector
• Change near skin colours in direction of “ideal skin-tone”
• Drawbacks:
• Everybody looks the same
• Pink objects may become “human” tooU
V
compare
Hue correctU
V
Skin U&V
U*
V*0o
90o
270o
180o
120o
technische universiteit eindhoven
117 The effect of skin tone enhancement as intended
Original Skin-tone corrected
technische universiteit eindhoven
118 The effect of skin tone enhancement…
technische universiteit eindhoven
119 Green enhancement
• grass and tree detector
• change colours towards “fresh green”
• risk of over-saturation
• risk of similar processing in studio
compare
saturationU
V
green
U*
V*
208o
U
V
0o
90o
270o
180o
technische universiteit eindhoven
120 The effect of green enhancement
21Video course: Image and Resolution Enhancement
technische universiteit eindhoven
121 The histogram with green enhancement
technische universiteit eindhoven
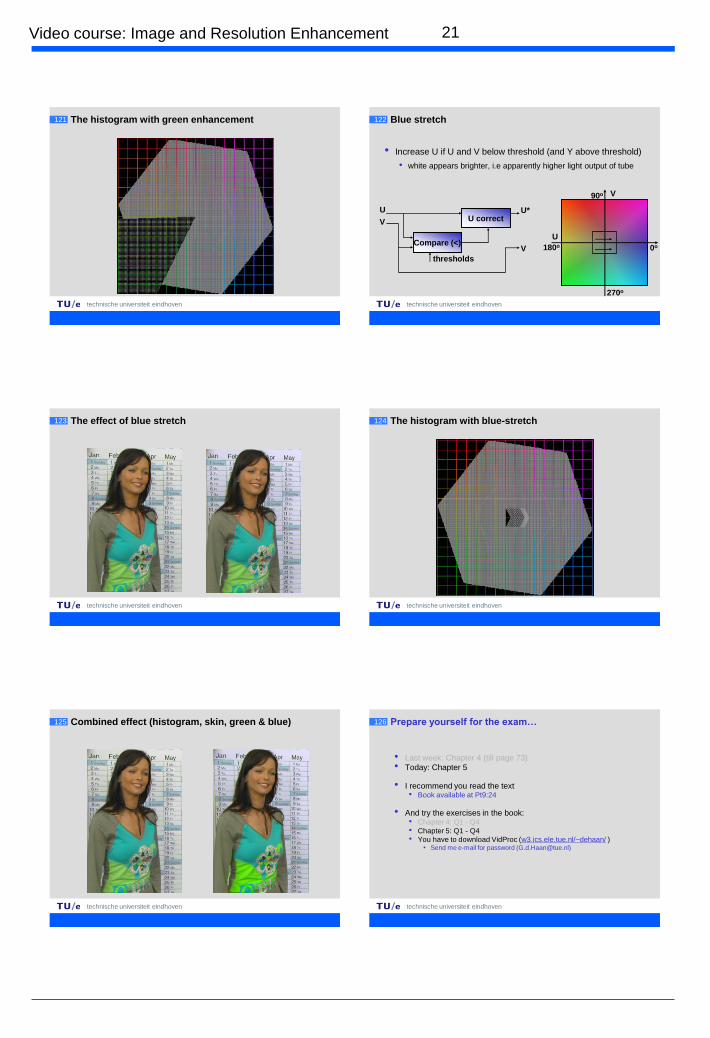
122
U
V
0o
90o
270o
180o
Blue stretch
• Increase U if U and V below threshold (and Y above threshold)
• white appears brighter, i.e apparently higher light output of tube
U correctU
V
thresholds
U*
VCompare (<)
technische universiteit eindhoven
123 The effect of blue stretch
technische universiteit eindhoven
124 The histogram with blue-stretch
technische universiteit eindhoven
125 Combined effect (histogram, skin, green & blue)
technische universiteit eindhoven
126 Prepare yourself for the exam…
• Last week: Chapter 4 (till page 73)
• Today: Chapter 5
• I recommend you read the text• Book available at Pt9:24
• And try the exercises in the book:• Chapter 4: Q1 - Q4
• Chapter 5: Q1 - Q4
• You have to download VidProc (w3.ics.ele.tue.nl/~dehaan/ )• Send me e-mail for password ([email protected])