lncs 5096 - resolution enhancement of pmd range maps
TRANSCRIPT
Resolution Enhancement of PMD Range Maps
A.N. Rajagopalan1, Arnav Bhavsar1, Frank Wallhoff2, and Gerhard Rigoll2
1 Department of Electrical EngineeringIndian Institute of Technology Madras, Chennai 600 036, India
2 Lehrstuhl fur Mensch-Maschine-KommunikationTechnische Universitat Munchen, 80333 Munchen, Germany
{raju,ee04s036}@ee.iitm.ac.in, [email protected], [email protected]
Abstract. Photonic mixer device (PMD) range cameras are becomingpopular as an alternative to algorithmic 3D reconstruction but their maindrawbacks are low-resolution (LR) and noise. Recently, some interest-ing works have stressed on resolution enhancement of PMD range data.These works use high-resolution (HR) CCD images or stereo pairs. Butsuch a system requires complex setup and camera calibration. In con-trast, we propose a super-resolution method through induced cameramotion to create a HR range image from multiple LR range images. Wefollow a Bayesian framework by modeling the original HR range as aMarkov random field (MRF). To handle discontinuities, we propose theuse of an edge-adaptive MRF prior. Since such a prior renders the energyfunction non-convex, we minimize it by graduated non-convexity.
1 Introduction
In contemporary computer vision and multimedia, numerous applications har-ness the information in the 3D shape of a scene. Apart from the conventionalshape from X techniques, in recent years, direct acquisition of 3D shape fromrange sensors has gained importance. Laser range scanners produce high qualityrange maps but their use is currently limited by high cost and long acquisitiontimes [1]. Photonic mixer device (PMD) scanners are less accurate and have adepth resolution of approximately 6 mm. However, they are attractive due totheir cost, speed and simplicity. They are being used in many applications inpattern recognition, computer vision and multimedia [2,3,4].
PMD range scanners work on the basis of time-of-flight principle. The com-plete scene is illuminated using modulated infra-red waves and the reflected lightis received by the PMD sensor. The output signal of the sensor is related to thephase delay between the reflected optical signal and the modulation signals. Theelectro-optic mixing process occurs at every pixel and hence the phase delaymeasurement is carried out at every pixel in the PMD pixel array [4,5,6]. Ap-plications involving 3D visualization, image based rendering, augmented realityetc. require an overall scene representation that differentiates major objects.Similarly, an approximate range map is usually sufficient in applications relatedto scene segmentation, object recognition, video matting, surveillance and robotnavigation [7].
G. Rigoll (Ed.): DAGM 2008, LNCS 5096, pp. 304–313, 2008.c© Springer-Verlag Berlin Heidelberg 2008

Resolution Enhancement of PMD Range Maps 305
A major drawback of PMD scanners is their low spatial range resolution whichis 64 × 48 or at the most 160 × 120 [3,6] pixels. The resultant poor localizationin 3D space inherently restricts the eventual utility of the PMD scanner. Re-cently, many interesting works have addressed the issue of enhancing the spatialresolution of PMD range data so that its scope can be extended to a multitudeof applications. Prasad et al. [8] interpolate the range map and register it witha HR CCD image. However, this smooths the range data and causes loss ofhigh frequencies especially at object discontinuities. An MRF-based energy min-imization framework that uses a range map and a HR CCD image claims betterperformance at discontinuities [9]. Based on the assumption that discontinuitiesin range and image tend to coincide, this approach weights the smoothness termsin the energy function by a gradient measure of the HR intensity image. A fusionof LR PMD range images with a stereo algorithm to produce HR depth maps isproposed in [3], where the data term of the energy function comes from the HRstereo pairs as well as the LR range. The above mentioned works typically use aregistered CCD HR image or a CCD HR stereo pair. However, this necessitatesthe requirement of an elaborate setup and an involved calibration procedure forboth the CCD and the PMD cameras.
In this work, we propose to principally exploit translational camera motion(relative to the object) for super-resolution of PMD range data. Importantly, ourapproach uses only the PMD scanner. Camera motion results in multiple LR im-ages with relative sub-pixel shifts thus effectively yielding a higher sampling rate.These LR range images can be modeled to have been formed by down-samplingsub-pixel shifted versions of the HR range image that is to be estimated. Theuse of multiple images also enhances the ability to reduce noise. Our techniquerequires only image-to-image registration which is much simpler than the compli-cated calibration involving CCD cameras followed in other works. Shifted rangeimages of a 3D scene will ideally tend to produce motion parallax. However,since we capture videos by simple camera translation, the assumption of globalshifts is valid for consecutive or near consecutive LR frames. These global shiftscan be determined by any good sub-pixel registration technique [10].
The problem of estimating high-resolution range data from low-resolutionrange observations is basically ill-posed and prior constraints must be imposed toenforce regularization. We model the original HR range image by a discontinuity-adaptive MRF (DAMRF) prior. This model not only regularizes the solutionbut also enables depth discontinuities to be preserved effectively. The solu-tion that we seek is the maximum a posteriori (MAP) estimate of the HRrange image given the LR range images. The DAMRF prior renders the re-sultant cost function non-convex. To avoid local minima problems, we use grad-uated non-convexity (GNC) to arrive at the MAP estimate of the super-resolvedrange image.
Section 2 explains the relationship between HR and LR range data. Insection 3, we propose a MAP-MRF framework to solve for the HR range data.Section 4 discusses optimization using the GNC algorithm tailored to our prob-lem. This is followed by results and conclusions in sections 5 and 6, respectively.

306 A.N. Rajagopalan et al.
2 LR-HR Relationship of Range Data
We move the camera relative to the object and capture several frames of low-resolution range data. Suppose we have N relatively shifted low-resolution data[y1, y2, ..., yN ] of size N1 × N2 from the PMD range scanner. These LR obser-vations can be modeled to have been generated from a high-resolution rangeimage x of size L1 × L2 by warping followed by down-sampling (by a factor ofL1N1
× L2N2
). Down-sampling is caused by averaging of L1N1
× L2N2
pixels. In Fig. 1,we show an example of down-sampling by 2 along both the spatial dimensions.Each pixel of LR1 (the first range image) is formed by averaging of four pixels
Fig. 1. The formation of LR observations from the HR range image
in the reference HR range image. Similarly, each pixel in LR2 to LR4 (second tofourth range image) is formed by averaging four pixels in the HR image whenthe reference HR image is shifted by one pixel in each direction. Thus, the pixelsin the LR images carry unique information about different regions in the HRimage effectively resulting in a higher sampling rate to enable super-resolution[11]. The use of multiple range images also facilitates to average noise effects.
The above process can be expressed mathematically as
yi = DWix + ηi (1)
Here, yi is the lexicographically arranged ith LR observation and D and Wi aredown-sampling and warping matrices, respectively, that produce yi from the HRrange image x. The term ηi represents noise. Equation (1) can be expressed inscalar form as
yi(n1, n2) =L1,L2∑
l1,l2=1
d(n1, n2, l1, l2)·x(θ1i, θ2i) + ηi(n1, n2) (2)
where d(n1, n2, l1, l2) is the element of the D matrix that maps the (l1, l2)th
pixel in HR image x(θ1i, θ2i) to the (n1, n2)th pixel in the ith LR image. The

Resolution Enhancement of PMD Range Maps 307
transformations θ1i and θ2i are the warping transformations that are encoded inthe matrix Wi. For a translating camera, equation (2) simplifies to
yi(n1, n2) =L1,L2∑
l1,l2=1
d(n1, n2, l1, l2)·x(l1− δ1i, l2− δ2i) + ηi(n1, n2) (3)
where δ1i and δ2i are the shifts in the x and y directions, respectively.From the above model, we observe that we require the Wi matrices that de-
note warping at high resolution. Since we consider only translational motion, wecan compute the HR shifts by simply multiplying the LR shifts by the resolu-tion factor. We compute the LR shifts using the well-known sub-pixel motionestimation algorithm proposed in [10].
3 Regularization Using MRF
Having discussed the formation of shifted LR images and estimation of theirspatial shifts, we now address the problem of deriving the super-resolved (SR)range data x given observations y1, y2, ... yN. We propose to solve for themaximum a posteriori (MAP) estimate of x within a Bayesian framework. LetY1, Y2, ... Yn be the random fields associated with the observations y1, y2, ...yn and let X be the random field associated with the SR range map. We wishto estimate x such that
x = maxx
P (X = x|Y1 = y1...Yn = yn) (4)
Using Bayes rule, the above equation can be written as
x = maxx
P (Y1 = y1...Yn = yn|X = x) · P (X = x) (5)
Solving for x is clearly an ill-posed problem due to the down-sampling and warp-ing operators, and due to the presence of noise [12,13]. We need to incorporateconstraints on the solution through a suitably chosen prior.
The first term in the product on the right-hand side of the equation (5) isthe likelihood term that arises from the image formation model. From equation(1), assuming a pin hole camera model and considering the noise to be additivewhite Gaussian with variance σ2, we have
P (Y1 = y1...Yn = yn|X = x) =1
(2πσ2)N1N2exp
(−
N∑
i=1
‖yi − DWix‖2
2σ2
)(6)
We model the prior probability P (X = x) for the SR range image by a Markovrandom field. MRF modeling provides a natural way to embed constraints on thesolution. The Markovianity property implies that the label at a pixel dependsonly on its neighborhood i.e., only neighboring labels have interactions with oneanother. This property is quite natural in the sense that the range value at a

308 A.N. Rajagopalan et al.
particular pixel does not depend on the range values of pixels that are locatedfar away from it. Due to the MRF - Gibbs equivalence [14], the prior probabilityof X can be expressed in analytical form as
P (X = x) = K exp
(−
∑
c∈Cx
V xc (x)
)(7)
Here, V xc (x) is the potential function and c is called a clique which is a subset of
the MRF neighborhood. The potential function captures the manner in whichneighboring pixels interact. For details on MRF, refer to [15]. From equations(6) and (7), we can rewrite equation (5) as
x = minx
(n∑
i=1
‖yi − DWix‖2
2σ2+
∑
c∈Cx
V xc (x)
)(8)
The MAP - MRF framework results in an energy minimization formulation toestimate the SR range data x, where the cost function is the bracketed term inequation (8). The first term in the cost is the data term. It measures how closelythe transformed (warped and down-sampled) x compares with the observations.The form of the second term is crucial for a good solution. It is usually known asthe smoothness term in image super-resolution works [16]. This is because thepotential function usually has the form V x
c (x) = (x(i, j)−x(p, q))2 where pixels(p, q) belong to the neighborhood of (i, j). But this form of the potential functiontends to select solutions that are smooth and results in loss of discontinuities andhigh frequencies which one would typically wish to preserve in the HR image.
We propose to use a discontinuity adaptive MRF (DAMRF) prior model forx in which the degree of interaction between pixels can be adjusted adaptivelyin order to preserve discontinuities. Li [15] suggests some models for DAMRFclique potentials. In this work, we use the potential function
V xc (x) = γ − γe−(x(i,j)−x(p,q))2/γ (9)
which is shown in Fig. 2(a). It is convex in the band Bγ = (−√γ/2,
√γ/2)
and the value of γ controls the shape of the function. Thus, choosing a largevalue of γ makes the function convex. Beyond Bγ , the cost of the prior tends tosaturate as the difference between the pixel values increases. Hence, unlike thequadratic prior, the cost for a sudden change is not excessively high which allowsdiscontinuities to be preserved in the solution. For the first-order MRF that wemake use of in this work, the exact expression for the prior term in equation (7)is given by
∑
c∈CV x
c (x) =L1∑
i=1
L2∑
j=1
4 ∗ γ − γ exp{−[x(i, j) − x(i, j − 1)]2/γ}
−γ exp{−[x(i, j) − x(i, j + 1)]2/γ} − γ exp{−[x(i, j) − x(i − 1, j)]2/γ}−γ exp{−[x(i, j) − x(i + 1, j)]2/γ} (10)

Resolution Enhancement of PMD Range Maps 309
(a) (b)
Fig. 2. (a) DAMRF clique potential function. (b) Graphical representation of GNC.
4 Energy Minimization: Graduated Non-convexity
Due to the non-convex nature of the DAMRF prior, the overall energy functionin equation (8) becomes non-convex. Hence, minimization to obtain the MAPestimate of x becomes non-trivial in the sense that traditional local gradient-based techniques cannot be used as they can get trapped in local minima.
We minimize the energy using a deterministic annealing technique known asgraduated non-convexity (GNC) [15,17]. The idea behind GNC is graphicallyillustrated in Fig. 2(b). It (initially) starts with a convex cost function by choos-ing a large value of γ and finds the minimum using simple gradient-descent. Thisvalue is then used as the initial estimate for the next iteration but now with asmaller γ. This step is iterated, reducing γ in each iteration. As shown in thefigure, the lower curve symbolizes the energy function at an earlier iteration andthe successive upper curves denote the energy functions at successive iterations.Note that the function non-convexity increases as the iterations progress. Thevertical arrows denote that the located minimum of the previous iteration isconsidered as the initial state for the next iteration. The slant arrows depictconvergence to the nearest minimum in each iteration.
The proposed algorithm for range super-resolution is summarized on the nextpage. We note that a basic requirement for GNC is computation of the gradientof the cost. From equations (8) and (10), the gradient at the kth iteration is
grad(k) =1σ2
n∑
i=1
WTi DT (DWix − yi) + λG(k) (11)
where λ is a smoothness parameter and the gradient G(n) at (p, q) is given by
G(k)(p, q) = 2[x(p, q) − x(p, q − 1)] exp{−[x(p, q) − x(p, q − 1)]2/γ} +2[x(p, q) − x(p, q + 1)] exp{−[x(p, q) − x(p, q + 1)]2/γ} +2[x(p, q) − x(p − 1, q)] exp{−[x(p, q) − x(p − 1, q)]2/γ} +
2[x(p, q) − x(p + 1, q)] exp{−[x(p, q) − x(p + 1, q)]2/γ} (12)
310 A.N. Rajagopalan et al.
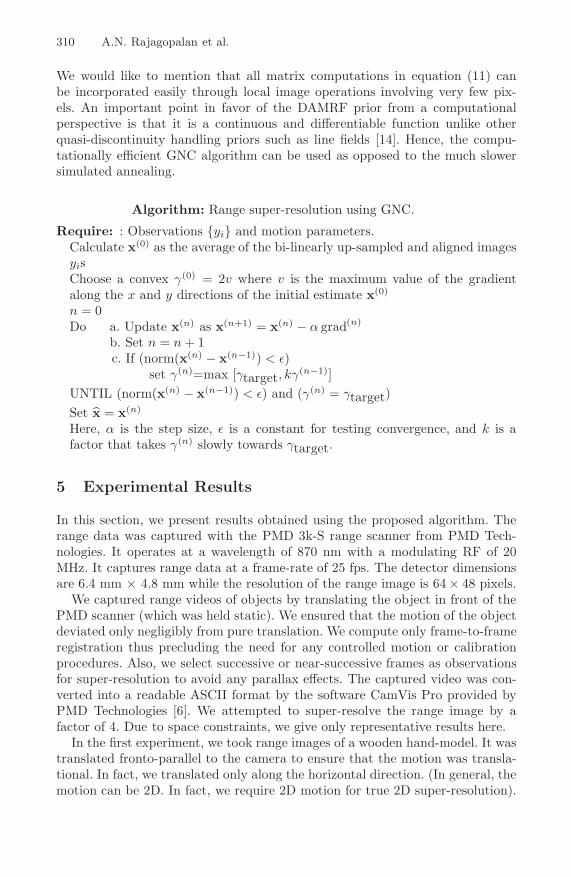
We would like to mention that all matrix computations in equation (11) canbe incorporated easily through local image operations involving very few pix-els. An important point in favor of the DAMRF prior from a computationalperspective is that it is a continuous and differentiable function unlike otherquasi-discontinuity handling priors such as line fields [14]. Hence, the compu-tationally efficient GNC algorithm can be used as opposed to the much slowersimulated annealing.
Algorithm: Range super-resolution using GNC.
Require: : Observations {yi} and motion parameters.Calculate x(0) as the average of the bi-linearly up-sampled and aligned imagesyisChoose a convex γ(0) = 2v where v is the maximum value of the gradientalong the x and y directions of the initial estimate x(0)
n = 0Do a. Update x(n) as x(n+1) = x(n) − α grad(n)
b. Set n = n + 1c. If (norm(x(n) − x(n−1)) < ε)
set γ(n)=max [γtarget, kγ(n−1)]UNTIL (norm(x(n) − x(n−1)) < ε) and (γ(n) = γtarget)Set x = x(n)
Here, α is the step size, ε is a constant for testing convergence, and k is afactor that takes γ(n) slowly towards γtarget.
5 Experimental Results
In this section, we present results obtained using the proposed algorithm. Therange data was captured with the PMD 3k-S range scanner from PMD Tech-nologies. It operates at a wavelength of 870 nm with a modulating RF of 20MHz. It captures range data at a frame-rate of 25 fps. The detector dimensionsare 6.4 mm × 4.8 mm while the resolution of the range image is 64× 48 pixels.
We captured range videos of objects by translating the object in front of thePMD scanner (which was held static). We ensured that the motion of the objectdeviated only negligibly from pure translation. We compute only frame-to-frameregistration thus precluding the need for any controlled motion or calibrationprocedures. Also, we select successive or near-successive frames as observationsfor super-resolution to avoid any parallax effects. The captured video was con-verted into a readable ASCII format by the software CamVis Pro provided byPMD Technologies [6]. We attempted to super-resolve the range image by afactor of 4. Due to space constraints, we give only representative results here.
In the first experiment, we took range images of a wooden hand-model. It wastranslated fronto-parallel to the camera to ensure that the motion was transla-tional. In fact, we translated only along the horizontal direction. (In general, themotion can be 2D. In fact, we require 2D motion for true 2D super-resolution).

Resolution Enhancement of PMD Range Maps 311
Several frames of range data were captured and one of the low resolution depthmaps is shown in Fig. 3(a). In order to perform super-resolution by a factorof 4, we selected a total of 8 frames from the range data set which were near-consecutive. Ideally, one would need 16 observations to upsample by a factorof 4. But since the motion is 1D in our example, we considered only 8 frames.These frames were then fed to the algorithm in [10] and the motion parametersfor each frame was estimated. (As expected, the motion module gave negligi-ble displacement along the vertical direction for this data set). The estimatedmotion parameters were then fed to the proposed GNC-based super-resolutionalgorithm. The initial value of γ was chosen as 1000 while γtarget was taken as1 with k = 0.9. The initial estimate of the super-resolved image was obtainedby averaging the bilinearly up-sampled and aligned low resolution observations.The values of λ and α were chosen as 0.01 and 6, respectively.
The GNC algorithm was run with the above parameters and the correspond-ing output (when super-resolved by a factor of 4) is given in Fig. 3(b). Whencompared with Fig. 3(a) in which the spatial localization of the range map ofPMD is not good, we note that our output is significantly better. The contoursof the hand are clearly discernible after performing super-resolution. In particu-lar, note how well the thumb has been reconstructed in Fig. 3(b). We also triedbicubic interpolation of the low-resolution depth map but it suffers from the ef-fect of range data bleeding into the background due to smoothing. This is to beexpected since the low-resolution range map of PMD itself is not well-localizedin space.
05
1015
2025
3035
0
10
20
30
40
50
0
1000
2000
020
4060
80100
120140
0
50
100
150
200
0
1000
2000
(a) (b)
Fig. 3. Wooden hand-model. (a) Low-resolution range data. (b) Super-resolved rangemap using the proposed method.
In the next experiment, we took images of the Alpha Rex robot. The robotwas translated horizontally and the range data was recorded over many frames.We again chose 8 frames from this data set and attempted super-resolution by afactor of 4 using the proposed method. One of the low resolution frames is shownin Fig. 4(a). Even though one can make out the shape of the robot, the spatialextent of the robot is difficult to gauge due to poor spatial resolution of the range

312 A.N. Rajagopalan et al.
05
1015
2025
3035
40
0
10
20
30
40
50
010002000
0
50
100
150
0
50
100
150
200
0500
10001500
(a) (b)
Fig. 4. Alpha Rex robot. (a) Low-resolution range map. (b) Super-resolved range out-put of our method.
map from PMD. The bleeding effect is very much evident in the figure. (Pleasesee the pdf file which has a color-coded version of the plot). In the output of theproposed method shown in Fig. 4(b) the edges of the robot are well-preservedand the localization is also very good due to improved spatial resolution. Thenoise level is comparatively much lower. The arms and elbow of the robot comeout clearly, especially the right palm region. Note the wedge-shaped thighs andthe holes in the legs which are difficult to infer from Fig. 4(a). The shape of thehead emerges in its true shape. Also, the proposed algorithm correctly bringsout the outline of the (slender) neck of the robot which appears smeared inFig. 4(a).
Our method takes a few minutes to run on a 1 GHz Athlon PC with 64 MBRAM (for a non-optimized Matlab code). There is enough scope to increase thespeed multi-fold by resorting to an efficient implementation in C on a fastermachine.
6 Conclusions
In this paper, we proposed a new method for super-resolution of range datacaptured from a low-resolution PMD camera that (unlike previous works) avoidsthe need for cumbersome camera calibration. An edge-preserving MRF priorwas used to adaptively retain discontinuities. We used GNC for non-convexoptimization and showed results on real data to demonstrate the effectiveness ofour technique. We are currently investigating fusion of range and intensity data.We are also working on extending our method to more general motion of therange sensor.
Acknowledgments
The first author gratefully acknowledges support from the Humboldt Founda-tion, Germany. The work was supported in part within the DFG excellence

Resolution Enhancement of PMD Range Maps 313
initiative research cluster Cognition for Technical Systems - CoTeSys (visit web-site www.cotesys.org).
References
1. Kil, Y., Mederos, B., Amenta, N.: Laser scanner super-resolution. In: EurographicsSymposium on Point-Based Graphics, pp. 9–16 (2006)
2. Ghobadi, S., Hartmann, K., Weihs, W., Netramai, C.: Detection and classificationof moving objects - stereo or time-of-flight images. In: International Conference onComputational Intelligence and Security, pp. 11–16 (2006)
3. Hahne, U., Alexa, M.: Combining time-of-flight depth and stereo images withoutaccurate extrinsic calibration. In: International Workshop on Dynamic 3D Imaging,pp. 1–8 (2007)
4. Beder, C., Bartczak, B., Koch, R.: A comparison of PMD-cameras and stereo-vision for the task of surface reconstruction using patchlets. In: IEEE InternationalConference Computer Vision and Pattern Recognition, pp. 1–8 (2007)
5. Reulke, R.: Combination of distance data with high resolution images. In: ISPRSCommission V Symposium Image Engineering and Vision Metrology, pp. 1-6 (2006)
6. http://www.pmdtec.com
7. Wallhoff, F., Ruß, M., Rigoll, G., Gobel, J., Diehl, H.: Improved image segmen-tation using photonic mixer devices. In: Proceedings IEEE Intl. Conf. on ImageProcessing, vol. VI, pp. 53–56 (2007)
8. Prasad, T., Hartmann, K., Weihs, W., Ghobadi, S., Sluiter, A.: First steps inenhancing 3D vision technique using 2D/3D sensors. In: Computer Vision WinterWorkshop, pp. 82–86 (2006)
9. Huhle, B., Fleck, S., Schilling, A.: Integrating 3D time-of-flight camera data andhigh resolution images for 3DTV applications. In: 3DTV-Conference, pp. 1–4(2008)
10. Irani, M., Peleg, S.: Improving resolution by image registration. Graphical Modelsand Image Processing 53(3), 231–239 (1991)
11. Park, S.C., Park, M.K., Kang, M.G.: Super-resolution image reconstruction: Atechnical overview. IEEE Signal Processing Magazine 16(3), 21–36 (2003)
12. Farsiu, S., Robinson, D., Elad, M., Milanfar, P.: Fast and robust super-resolution.In: IEEE International Conference on Image Processing, pp. 14–17 (2003)
13. Rav-Acha, A., Zomet, A., Peleg, S.: Robust super resolution. In: IEEE InternationalConference on Computer Vision and Pattern Recognition, pp. 645–650 (2001)
14. Geman, S., Geman, D.: Stochastic relaxation, Gibbs distribution and the Bayesianrestoration of images. IEEE Transactions on Pattern Analysis and Machine Intel-ligence 6(6), 721–741 (1984)
15. Li, S.Z.: Markov random field modeling in computer vision. Springer, Tokyo (1995)16. Suresh, K., Rajagopalan, A.N.: Robust and computationally efficient super-
resolution algorithm. Journal of the Optical Society of America - A 24(4), 984–992(2007)
17. Blake, A., Zisserman, A.: Visual reconstruction. The MIT Press, Cambridge (1987)