vfa.vic.gov.au€¦ · web viewi was an attendee at this year’s central zone (tacc) workshop at...
TRANSCRIPT

Public submissions on the 2019/20 Central Zone Abalone Total Allowable Commercial Catch (TACC)
Submitter SubmissionJohn O’Neill I was an attendee at this year’s Central Zone (TACC) workshop at Hastings. I fully support the total allowable catch that was arrived at
but feel the reduction was not enough and I also believe that if the chairman had allowed a vote on the options put forward the meeting would have supported a larger reduction. I think Ian Cartwright is a particularly good independent chairman and few would have put up with the behaviour of one totally disruptive participant who seemed determined to railroad every positive proposal put forward.It was obvious to me that there was majority support for greater quota reductions and increased takeable size limits which indicates that most present are concerned about the health and sustainability of the resource. Somehow we did not address the size limit increase issue and nothing was done about it. As I see it size increases are a no brainer. Bigger fish weigh more therefore we will be taking less of them to catch the quota and at least some (estimate 50%) will have bread twice. This equates to less fish taken (more left to breed) plus more breeding by the whole abalone population.There are a couple of things that can be done that will help with next year’s meeting. Make the completion of a daily reef report a condition of the Access Licence. No reports no entitlement to dive. I think there would also be a benefit if Fisheries were to circulate a document to Divers asking for their thoughts on each individual reef that they have dived that year and have the responses tabled at the meeting before any discussion.I would hate to see anybody other than the very diplomatic Ian Cartwright chairing the meeting. If we didn’t have someone as tactful as Ian at the helm it would almost certainly turn into a huge dog fight.I would like to make further comment to my submission forwarded yesterday.I honestly believe that the current margin between the Target and the Upper and Lower limits being a total of 15% each way are excessive and are definitely not in a range that is conducive to achieving the longer term health and sustainability of the abalone resource. We know there are divers fishing right up to the Upper Limit and this is putting too much pressure on a resource that we also know is currently struggling to maintain the current level of quota take. I would like to see the upper and lower limits of 15% Above and Below Targets abolished and for what is now the Thresholds at 7.5% be set as the upper limit.I don’t accept the excuse, what if multiple boats work that reef on the same day when it is close to the limit. There is an element in the diver group that are just looking for an excuse to push the boundaries. Nobody has to go there, how about a bit of good will towards the reef and not go there when it is close to the target rather than risk going over. It can be done and it is only lack of the will to comply that is the problem.
Rob Loats (VRFISH) Thank you for providing VRFish the opportunity to comment on the 2019/20 Draft Further Abalone Quota Order (FAQO) and proposed Fisheries (Central Abalone Zone) Notice. VRFish would also like to express appreciation for inclusion of recreational fishing representation in the stock assessment and TACC setting process.VRFish on behalf of Victoria’s recreational fishers is committed to ensuring the rebuilding of Victoria’s Central Zone abalone stocks. In
1

Submitter Submissionthis vein, VRFish supports the proposed FAQO and Fisheries Notice and the reduction of the TACC. We are satisfied that the stock assessment and TACC setting process is sufficiently robust, and the proposed TACC go some way in helping rebuild stocks in line with objectives under the current management plan. We commend the commercial sector for their commitment towards rebuilding abalone stocks through an evidence-based and precautionary approach.We would like to take this opportunity to express that recreational fishers are presently unsatisfied with the restrictions placed on access to the fishery under the Fisheries (Recreational Abalone Open Days) Notice 2018. In the interests of enhancing the quality of recreational fishing and reflecting the needs and expectations of recreational fishers to be able to access the fishery when it is most convenient, VRFish looks forwarding to reviewing the current arrangements and finding a solution that meets both the needs of recreational abalone fishers and the ongoing sustainable management of the fishery.
Darvin Hansen The key points I would like to get across are: I endorse the results that the TACC setting meeting arrived at. Although where I would personally set the catch targets was often different to the mediated outcome, “that’s life”, and par for
the course with such meetings. I do think the outcomes were relatively good overall, and in no SMU would I say that a lower catch target was arrived at than what I would like or be comfortable with. (I still think the catch targets are too high at Philip Island, Back Beaches, and Shipwreck Coast by about 5t in each, and Prom Eastside and Cliffy Group are likely being overharvested but that can wait to be fixed, FWIW.)
I am more than happy with Ian’s chairing of the meeting, and I think he stuck to the TOR for both FRAG and TACC setting meetings. I would struggle to think how one might do a better job of conveying all the information and facilitating the discussion as he did.
The FRAG/TACC setting process is an iterative process; it will get better over time and one can’t expect it to be perfect at the beginning. One also has to understand that there are practicalities with input – the majority of divers will not show up, but those who care will.
Part of the job of the attendees is to weigh all the evidence according to likely reliability in their own mind. I view the FIS as supplemental information, and also as supplemental diver opinions of those who show up. I think we can act like adults to the extent that contested information such as FIS data can be shown, people can air their views as to its validity, and people can make up their own minds. Personally until really shown otherwise, I think that the information is likely valid but some would prefer to move the goal posts.
I would make the point that a catch cut is not in itself a bad thing; the real issue is biomass decline and whether a catch cut has sufficiently gotten under the level of catch where the SMU can rebuild.
I think it’s useful to get an indication of the current level of depletion of the fishery by looking at historical catch averages in different SMU, and this also gives an idea of where those SMUs might be rebuilt to. I do this by averaging the 25 consecutive highest years of abalone catch, as it is quite hard to find a scenario of an area fished with a fishing pattern that will give such a result that would over-
2

Submitter Submissionestimate the MSY. I used VFA data to calculate these averages.
Shannon Hurley (VNPA) The Victorian National Parks Association (VNPA) thanks the Victorian Fisheries Authority for the opportunity to comment on the draft Further Abalone Quota Orders (FAQOs) and associated draft Fisheries Notices for the 2019/20 commercial abalone fishing season.The VNPA is a leading community conservation organisation and has been advocating for the protection of Victoria’s biodiversity for over 60 years.The Abalone Fishery is one of Victoria’s main and highly valuable fisheries. Given their importance, it is critical they are managed based incorporating ecological sustainable principles, at an ecosystem-wide level, and not a single species approach.Given many of the biological processes and ecological relationships are not well understood, we question whether the current recommended Total Allowable Commercial Catches (TACC) will be enough to sustain the fishery in the long-term, considering the imminent impacts.Imminent impacts likely to impact the fishery include climate change and sea urchin invasions from warming waters, which could provide direct competition with the abalone fishery.In our view, it is important that these threats are factored into the decision making process in setting the TACC for the central and western zones.The reduction of the TACC for blacklip abalone in the central zone and additional management requirements for greenlip are welcome, however even the FRDC lists the central zone blacklip fishery as transitional depleting and greenlip as overfished.Feedback from the western zone workshop summary states:“…..this is still a recovering fishery and a cautious approach should be taken”Given this, we question the need to increase TACC from 70 to 73.2 tonnes for blacklip abalone in the western zone, and if greenlip TACC should be reviewed for decrease, and additionally considering ecosystem impacts likely to impact on the fishery.We reiterate the need for a cautious and ecosystem-based approach. We note that the primary management objective to rebuild the abalone resource to ensure sustainability economic productivity, and suggest it should also include one that ensures ecological sustainability and production.Thank you again for the opportunity to express our views. Please do not hesitate to contact me for further information.
Tony DeDomenico (AVCZ)
AV(CZ) TACC Submission for the 2019/20 Fishing Season
The implementation of the Draft Abalone Harvest Strategy for the Central Zone 2019/20 season presents a unique opportunity for AV(CZ) and VFA to work together to achieve responsible outcomes for the abalone resource in the Central Zone and for the broader abalone industry invested in utilising that resource.
This report provides a background summary of the Draft Harvest Strategy and how it applies to the 2019/20 fishing season, identifies the current condition of the SMUs, catches and anecdotal evidence and finally provides recommendations for the 2019/20 fishing season.
3

Submitter Submission
Summary Points of the Draft Harvest Strategy
The following summary has been provided as the Harvest Strategy is referred to throughout this report as are performance indicators, reference points and catch control rules.
The Harvest Strategy (HS) uses Nominal (Unstandardised) catch per unit effort (CPUE) from commercial catch and effort logbook information as a long term and short term indicator of legal biomass (Primary Indicator).
The harvest strategy is designed to provide a level of consistency and predictability in optimum target catch ranges (for each SMU) and avoid large annual changes.
The proposed annual TACC is determined using an annual stock assessment process and a set of catch control rules applied to three performance indicators. The three performance indicators are combined to give an overall trend of biomass (i.e. increasing, stable or decreasing).
Performance Indicators
1. Primary Indicator: long term biomass trend measured using the four-year gradient CPUE.2. Secondary Indicator: short term biomass trend measured using a three year CPUE ratio.3. Depending on the zone, the tertiary indicator is:
a) Pre-recruit trend using the standardised average count of abalone from the fishery independent surveys (FIS) in the size range of the current legal minimum length (LML) to 20 mm below LML.
b) Fishing mortality measured using the mean weight converted from commercial catch length measurements.
Additional performance indicators are used in the assessment of the fishery. These do not result in explicit catch range adjustments, they are used to provide a more comprehensive picture of the status of the fishery and trends over time during the stock assessment meetings. The additional performance indicators include:
1. Commercial diver observations
2. Commercial weight composition and logger data
3. Fishery independent survey data
Catch Control Rules
The catch control rules are predetermined and applied based on the most recent CPUE result and length of time that CPUE has been in one of three categories. The three categories are: below the limit reference point (red), between the limit and threshold reference point (orange) and above the threshold reference point (green). The reference point values (kg/hr) are
4

Submitter Submissionpresented in Table 1.
There are two catch control rules that control the annual change in the optimal target (OT). When CPUE is above the threshold reference point, the first catch control rule (CCR #1) will apply. That is, the
maximum change in the OT for the first two years is 115%. If CPUE remains above the threshold reference point for more than two consecutive years, then the maximum change in the OT can increase to 125%.
If CPUE is between the limit and threshold reference point for more than five consecutive years the second (more severe) catch rule (CCR #2) is applied to improve the status of the fishery, otherwise the first catch control rule (CCR #1) applies.
When CPUE is below the limit reference point, the second catch rule will always apply. The fishery is closed and a structured fishing program implemented if CPUE remains below the limit reference point for more than two years.
Target Reference Points
Target reference point (green line)The target reference point defines the level or value of an indicator that is considered ideal or desirable and in this harvest strategy is the target point for rebuilding and then maintaining the legal biomass.The target reference point is the maximum value of the 1989-2015 series, rounded down to the nearest 10 kg/h.For example: the maximum value is 116 kg/hr so this is rounded down to 110kg/hr. Threshold reference point (orange line)
The threshold reference point in this harvest strategy represents a value above which recruitment should be maintained and which legal biomass should not fall below.The threshold reference point is the minimum value of the 1989-2015 series, rounded up to the nearest 10 kg/h.For example: the minimum value is 72 kg/hr so this is rounded up to 80kg/hr.Limit reference point (red line)The limit reference point acts like a safety measure as it establishes the point at which there is significant risk to the sustainability of the stock.In this harvest strategy the limit reference point is calculated from the minimum value of the 1989-2015 series. The limit value is 2/3 of the minimum value, rounded up to the nearest 10 kg/h.For example: the minimum value is 72 kg/hr so 2/3 x 72 = 48 kg/hr which is then rounded up to 50kg/hr.
Table 1. Indicates the reference points (kg/hr) for each SMU in the Central Zone.
5

Submitter SubmissionZone Spatial Management Limit Threshold Target
Unit (SMU) Reference Reference Point Reference
Point Point
Kilcunda 50 70 110
Phillip Island 50 70 110
Port Phillip Bay 20 30 70
Prom Eastside 40 50 80
Prom Westside 50 70 100
Shipwreck Coast 40 60 130
Surfcoast 40 60 70
Back Beaches 50 70 100
6

Submitter Submission
Cape Liptrap 40 60 120
Cape Otway 50 70 100
Cliffy Group 40 60 110
Flinders 50 70 100
Changes in Catch Per Unit Effort (CPUE) across CZ SMU’s
The table below (Table 2.) identifies increases or decreases in CPUE from 2017 and 2018 at the SMU level. The table presents Standardised (Stnd) CPUE, catch data that has been standardised to account for variability in diver behaviour etc and is not considered as a Primary Indicator in the HS. Unstandardised (Unstd) catch data is also presented, Unstandardised data is the raw data and the Primary Indicator used in the HS. CPUE figures across the majority of SMUs in the CZ have increased from 2017 to 2018 and as such the HS recommendation is for incremental increases in quota for those SMUs. Those SMUs with a reduced Unstd CPUE are identified and explained below.
Table 2. Comparisons of Standardised and Unstandardised CPUE from 2017 and 2018.2017 CPUE 2018 CPUE
2018 Quota Stnd Unstd Stnd Unstd
SMU target (t)
7

Submitter SubmissionShipwreck 28.7 100 117 95 123
Cape Otway 52.3 68 73 74 84
Surfcoast 1.4 72 95 60 73
Back Beaches 65 73 81 68 75
Flinders 30 57 61 56 60
Phillip Island 40 63 76 60 68
Kilcunda 12.1 55 66 59 67
Cape Liptrap 12.5 63 76 64 81
Prom Westside 20 58 62 59 66
Prom Eastside 7 50 52 58 59
Cliffy Group 5 74 78 76 82
Shipwreck SMU
Whilst Shipwreck SMU is indicating that the Stnd CPUE has decreased from 100kg/hr in 2017 to 95kg/hr in 2018, the Unstd CPUE has increased. Furthermore, anecdotal evidence (diver reports), suggests that the SMU has responded well to recent size limit increases and biomass in general is improving. As indicated in Figure 1. Nominal CPUE is increasing and is well above the Threshold reference point. Considering current projections and existing management arrangements, the Nominal CPUE is likely to exceed the Target Reference Point at some point in the future, noting that catches have been increasing since 2014, as presented in Figure 2.
8

Submitter Submission
Figure 1. Nominal CPUE (kg/hr) for Shipwreck Coast SMU
Figure 2. Shipwreck Coast SMU catch history.
Surfcoast SMU
9

Submitter SubmissionCPUE figures (Stnd and Unstd) for the Surfcoast SMU suggest that CPUE has decreased, however the Nominal CPUE is well above the Target reference point (Figure 3.). Furthermore the quota allocated to this SMU is minor and is fished by a few individuals with access dictated by weather. It should also be noted that the catch in the Surfcoast SMU has been variable since 2016 (Figure 4.)
Figure 3. Nominal CPUE (kg/hr) for Surfcoast SMU
10

Submitter Submission
Figure 4. Surfcoast SMU catch history.
Back Beaches SMUStandardised and Unstandardised CPUE have decreased from 2017 to 2018. There has been a 23% decrease in Unstandardised CPUE from 95kg/hr in 2017 to 73kg/hr in 2018 and is approaching the Threshold Reference Point established in the HS strategy set at 70kg/hr (Figure 3.). CPUE has been declining since 2015, anecdotal evidence suggests that divers are swimming more and doing more drops. Should the CPUE fall below the Threshold reference point for more than five consecutive years the second (more severe) catch rule is applied to improve the status of the fishery.
11

Submitter Submission
Figure 3. Nominal CPUE (kg/hr) for Back Beaches SMU.
Figure 4. Back Beaches SMU catch history.Flinders SMU
The decrease in Standardised and Unstandardised CPUE from 2017 to 2018 is negligible (1kg/hr) and catches have
12

Submitter Submissionremained relatively consistent since 2016 (Figure 6.) . Despite this, the Unstandardised CPUE of 60kg/hr is below the Threshold reference point and CPUE has been declining since 2014 (Figure 5). If the trend in CPUE continues, it is possible that without intervention, the Limit reference point could be reached within five years.
A per the HS recommendations, if the CPUE is between the limit and threshold reference point for more than five consecutive years (CPUE has been below the threshold reference point for three consecutive years), the second (more severe) catch rule is applied to improve the status of the fishery1.
Figure 5. Nominal CPUE (kg/hr) for Flinders SMU.
13

Submitter Submission
Figure 6. Flinders SMU catch history.
Phillip Island SMU
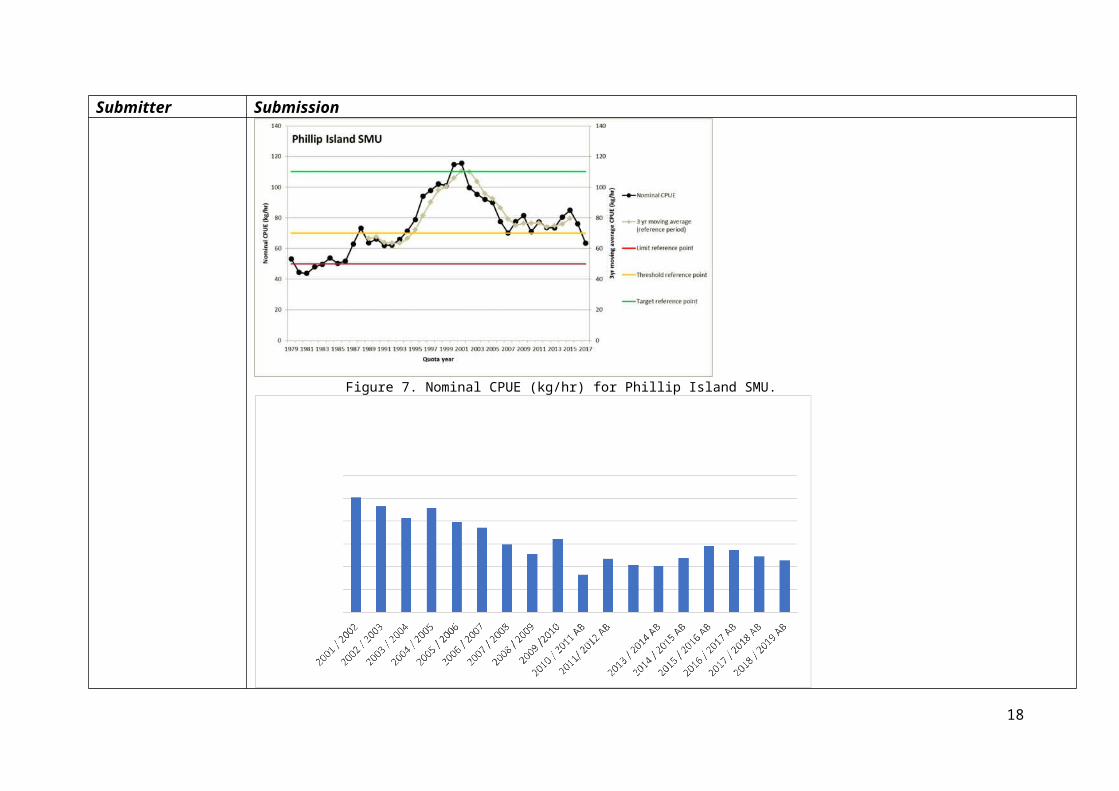
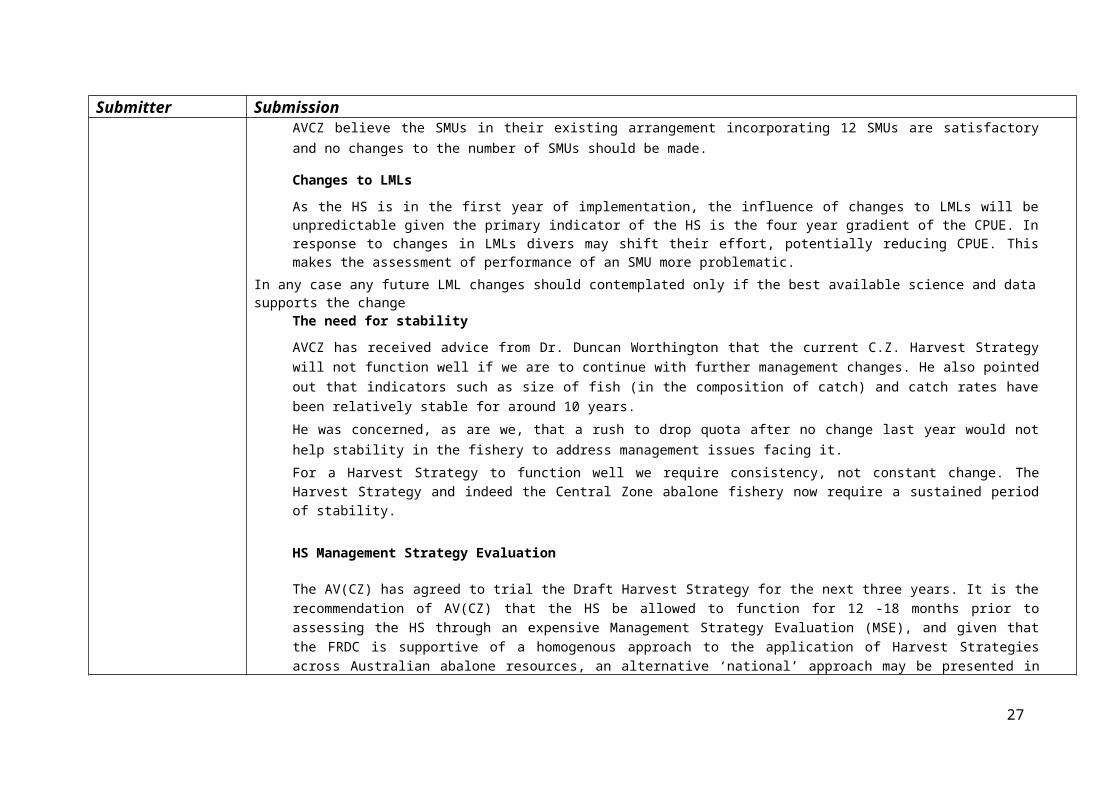
The Un-standardised CPUE has declined 11%, from 76kg/hr in 2017 to 68kg/hr in 2018. The CPUE has fallen below the Threshold reference point of 70kg/hr, should this trend continue for more than five consecutive years the second (more severe) catch rule is applied to improve the status of the fishery. Anecdotal evidence suggests that whilst catch rates have decreased in the SMU (as identified in Figure 8), the same amount of fish are being extracted from the SMU, but from a smaller area.
14

Submitter Submission
Figure 7. Nominal CPUE (kg/hr) for Phillip Island SMU.
15

Submitter SubmissionFigure 8. Phillip Island SMU catch history
Prom East-side SMUStandard and Unstd CPUE has increased in the Prom Eastside SMU by 16% and 13% respectively. With Unstd CPUE increasing from 52kg/hr in 2017 to 59kg/hr in 2018, as reflected in Figure 9. Anecdotal evidence suggests that the SMU is fishing well, this is further reflected in the catch history for the SMU which indicates that catches have remained relatively stable since 2014 (Figure 10.).
Figure 9. Nominal CPUE (kg/hr) for Prom Eastside SMU.
16

Submitter Submission
Figure 10. Prom Eastside SMU catch history.
The Need for Harvest Strategies
The following is an excerpt from the DEDJTR consultation document titledHarvest Strategy for the Victorian Blacklip Abalone Fishery:Harvest Strategies provide formal and structured frameworks that guide fishery management decision-making processes and assist in achieving fisheries management objectives by ensuring that managers, fishers and other stakeholders understand and document how they will respond to various desirable and undesirable fishery conditions before they occur and therefore avoid ad-hoc decision-making. They bring together all of the key elements and management functions used to make decisions about the level of fishing activity that should be applied to a fish stock or a management unit to maximise the likelihood of achieving ecological, economic and social sustainability.Harvest strategies are widely used internationally and throughout Australian fisheries management jurisdictions and represent a best-practice approach to fisheries management decision-making (Sloan et al 2014).
The following is an excerpt from Rationale for setting the 2018/19 abalone total allowable commercial catches written
17
Submitter Submissionby the Executive Director of Fisheries Victoria, Travis Dowling:Abalone Victoria [Central Zone] and the VFA are continuing to work together to improve management arrangements for the fishery. A Fishery Resource Advisory Group is now meeting four times a year and a draft harvest strategy framework has been developed. I anticipate that the new harvest strategy will be implemented for the 2019/2020 commercial abalone fishing season. No change has been made to the TACC this year while these new management arrangements are being finalised.
Harvest Strategy Recommendations for Central Zone
The Harvest Strategy (HS) provided three possible scenarios for adjustments to the quota for each SMU based on the Primary Indicator (Unstandardised CPUE on a four year rolling average).
It should also be noted that the increases and decreases have been adjusted up to the nearest tonne (t), with the exception of the Shipwreck Coast SMU which has been rounded to zero.
The application and implication of these outcomes is presented in Table 3. BelowTable 3. Harvest Strategy recommendations for quota levels for CZ SMUs for the 2019/20 season (all figures are expressed in (t)). AVCZ Recommendations are in the highlighted columns
(a) Quota Increase
2018 5% 10% 15%
Figures have been rounded up to Adjusted Quota Targets
Adjusted Quota Targets rounded upSMU
LML (mm) Quota
increase in increase increase
Target quota in quota in quota
the nearest (t)
(no rounding)
to the nearest (t)
Shipwreck 125 28.7 1.435 2.87 4.305 2 3 5 30.15 31.57 33.005 30.7 31.7 33.7
Cape Otway 123 52.3 2.615 5.23 7.845 3 6 8 54.915 57.53 60.145 55.3 58.3 60.3
18

Submitter SubmissionKilcunda 110/115 12.1 0.625 1.21 1.815 1 2 2 12.725 13.31 13.915 13.1 14.1 14.1
Cape Liptrap 105/110 12.5 0.625 1.25 1.85 1 2 2 13.125 13.75 14.375 13.5 14.5 14.5
Prom Westside 115/120 20 1 2 3 1 2 3 21 22 23 21 22 23
Cliffy Group 110 5 0.25 0.5 0.75 1 1 1 5.25 5.5 5.75 6 6 6
Prom Eastside 110 7 0.35 0.7 1.05 1 1 2 7.35 7.7 8.05 6 8 9
SMU
2018 5% 0% 5%
Figures have been rounded to the Adjusted Quota Targets
Adjusted Quota Targets rounded
LML (mm) Quota Reduction increase increase
target (t) in Quota in Quota in Quota
nearest (t)
(no rounding)
to the nearest (t)
Surfcoast 110 1.4 ‐0.07 0 0.07 0 0 0 1.33 1.4 1.47 1.4 1.4 1.4
(b) Quota Decrease
SMU 2018 5% 10% 15% Figures have been rounded up to
Adjusted Quota Targets Adjusted Quota Targets rounded up
LML Quota reduction reduction reduction
19

Submitter Submission(mm)
Target in quota in quota in quota
the nearest (t)
(no rounding)
to the nearest (t)
Back Beaches 117 65 ‐3.25 ‐6.5 ‐9.5 ‐4 ‐7 ‐10 61.75 58.5 55.25 61 58 55
Flinders 110 30 ‐1.5 ‐3 ‐4.5 ‐2 ‐3 ‐5 28.5 27 25.5 28 27 25
Phillip Island 110 40 ‐2 ‐4 ‐6 ‐2 ‐4 ‐6 ‐2 ‐4 ‐6 38 36 34
Adoption of HS Recommendations
AVCZ has agreed to adopt the recommendations of the Draft Harvest Strategy.
It is our recommendation that the Higher Level (+/-15%) option (as highlighted in table 3) be adopted as we believe it achieves the most favourable distribution of effort across the Central Zone.This option provides slightly larger decreases in quota targets to the Phillip Island, Flinders and Back Beaches SMUs, and slightly larger increases to the better performing SMUs. All three options produce a very similar total TACC.
The greater part of the shift of effort would be to the Shipwreck and Cape Otway SMUs which we believe improves the distribution of effort across the zone.
Table 4. Net change in SMUs and Total TACCSMU SMU 2019/20 Quota Targets
Adjustments
20

Submitter Submission
Shipwreck 5 33.7
Cape Otway 8 60.3
Kilcunda 2 14.1
Cape Liptrap 2 14.5
Prom Westside 3 23
Cliffy Group 1 6
PromEastside 2 9
Surfcoast 0 1.4
Port Phillip Bay 0 0
Back Beaches ‐10 55
Flinders ‐5 25
Phillip Island ‐6 34
TACC TOTAL 276
Port Phillip Bay
AVCZ recommends retaining the status quo of zero allocation to the Port Phillip Bay SMU, noting that this SMU is not closed to fishing.
21

Submitter SubmissionWe encourage divers to visit Port Phillip bay for exploratory, market driven or other reasons. We envisage only a small amount of effort is likely to be focused on this SMU. Any fishing effort will of course give us further insights into the state of the resource and the ecology of the bay. It would also result is slightly less effort to one or more of the other SMUs.
Distribution of Effort within SMUs.
As well as the improved zonal distribution of effort outlined above, AVCZ believes there is a need to achieve better distribution of effort between the eastern side (east of Port Phillip Bay) and the western side (west of Port Phillip Bay) of the central zone.It is evident that a substantial amount of effort has moved away from the Cape Otway and Apollo Bay areas. As west coast divers have either retired or moved away from the area, much of that effort has gone to the Back Beaches to Phillip Island area.For a more thorough explanation of this shift of effort see the Southern Shellfish submission (annexure a).AVCZ is currently investigating available options to ensure a balanced spread of effort between the eastern and western sides of our zone.
Changes to SMUs
The Central Zone has been exposed to considerable changes to the management of the abalone resource over a number of years. Including changes to legal minimum lengths (LMLs) and adjustments to quota levels at the zonal and SMU scale. These changes make it difficult to examine changes in the overall health of the resource and subsequently interpret trends in the data.It is the view of AVCZ, that changes to the number of SMUs, will negatively influence the outputs of the HS (skewing CPUE), that may or may not be accounted for in the HS. When initially proposed there was some support within Industry for a reduction in the number of SMU’s, however over time support has fallen away to virtually nil. Many consider it a step backwards in regard in fine scale management, and simply poor resource management.AVCZ believe the SMUs in their existing arrangement incorporating 12 SMUs are satisfactory and no changes to the number of SMUs should be made.
Changes to LMLs
As the HS is in the first year of implementation, the influence of changes to LMLs will be unpredictable given the primary indicator of the HS is the four year gradient of the CPUE. In response to changes in LMLs divers may shift their effort, potentially reducing CPUE. This makes the assessment of performance of an SMU more problematic.
In any case any future LML changes should contemplated only if the best available science and data supports the changeThe need for stability
AVCZ has received advice from Dr. Duncan Worthington that the current C.Z. Harvest Strategy will not function well if we are to continue with further management changes. He also pointed out that indicators such as size of fish (in the composition of
22

Submitter Submissioncatch) and catch rates have been relatively stable for around 10 years.He was concerned, as are we, that a rush to drop quota after no change last year would not help stability in the fishery to address management issues facing it.For a Harvest Strategy to function well we require consistency, not constant change. The Harvest Strategy and indeed the Central Zone abalone fishery now require a sustained period of stability.
HS Management Strategy Evaluation
The AV(CZ) has agreed to trial the Draft Harvest Strategy for the next three years. It is the recommendation of AV(CZ) that the HS be allowed to function for 12 -18 months prior to assessing the HS through an expensive Management Strategy Evaluation (MSE), and given that the FRDC is supportive of a homogenous approach to the application of Harvest Strategies across Australian abalone resources, an alternative ‘national’ approach may be presented in due course.
Abalone Data Logger Program
AVCZ now operates one of the most comprehensive GPS data logger programs in any abalone fishery worldwide. This follows the initial development of loggers in the Central Zone of Victoria in the late 1990s, in direct response to the challenges of inadequate abundance survey data.Due to the ongoing issues with abundance survey data in Victoria as highlighted by independent reviews, the extensive AVCZ logger database now provides some of the only spatially and temporally detailed data about the commercially fished stock and its trends through time. Most abalone fisheries around Australia have already directly incorporated logger data into management decision making, and most are looking to develop coverage and use of the logger data more strongly in formal Harvest Strategies. The extensive AVCZ logger database should be used now and into the future, as a key component of decision making in the CZ fishery as it is in the WZ.AVCZ utilises three types of data loggers. We have achieved close to 100% coverage with the Boat (GPS) loggers, and the Diver (depth and temperature) loggers, and around 25% coverage with the shell measuring loggers. With the recent purchase of six new shell measuring loggers, we are about to increase that coverage.
Stock Abundance Surveys
It is no secret that AVCZ and the VADA before us, have consistently held the view that the Stock Abundance Surveys in their current form are not capable of providing reliable indicators necessary for use in stock assessments or the TACC setting process.The science group working for the Abalone Working Group (AWG) included two eminent independent scientists (Dr. Cathy Dichmont and Dr Duncan Worthington). In their report to the AWG titled Discussion Points For The Victorian Abalone
23

Submitter SubmissionHarvest Strategy Meeting May 2017: Some Options, Dr Dichmont summarised the following:There are no consistent relationships among the possible indicators investigated at the scale of SMUs, and so no clear secondary indicators that can be consistently used at the scale of SMU to contribute to the assessment in the HS. Indeed, there seems to be great variability in trends and significance of the relationships with the different indicators against Recruits or CPUE by SMU. This would be required to develop some empirical harvest control rules using primary and secondary indicators across the board. No clear trigger levels are shown either i.e. some cut off point above or below which there is a clear break from previous relationships.Dr Antony Hart also reviewed the abalone Abundance Surveys in Victoria and in his report recommended a complete re-design to make them fit for purpose.Dr. Harts Independent review of the abundance Surveys, and Dr. Dichmont’s report (science advisors report to the HS working group), recommended significant changes in survey design that should be implemented immediately.These changes have not been implemented. This leads to the in-escapable conclusion that great care must be taken in interpreting any changes indicated by the current surveys, particularly that they should NOT be used as indicators of short-term change as there is NO evidence that they can be used in this way.For around two years now AVCZ has been pushing for the re-design of the FIS.
This is also the position of the Abalone Sub Committee (AIC) of Seafood Industry Victoria.Industry had previously engaged Dr. Worthington to provide options for
re-design of the surveys. We have been in receipt of that work for well over 18 months now and are ready and prepared to be involved in the re-design process.The recommended re-design would make stock abundance surveys a valuable tool providing genuine secondary indicators for future use in Harvest Strategies and the TACC setting process.
VFA Stock Assessment
As outlined above, the VFA stock assessment utilises data from the stock abundance surveys to establish indicators of short- term change. This is precisely what the Independent scientists working for the HS working group have advised the surveys should not be used for. It is apparent that there are no reliable indicators in existence at present that give reliable information on numbers or trends of pre-recruits or recruits.The Stock assessment also utilises the highest catch rates ever achieved over a short period of time (around 2003) in the history of the fishery, as a benchmark to compare recent catches to. This long-term trend is of no use in establishing how the fishery is performing in recent years.
No-one knows what the conditions were around 2003, which created such high catch rates, but this phenomenon occurred in abalone fisheries Australia wide
There is a great likelihood that we may never see this phenomenon again. This long term CPUE trend is presented as a %
24

Submitter Submissiondrop in CPUE, and will probably ever only produce a trend skewed to the negative, even when the biomass is increasing. It is therefore of no use in the TACC setting process.AVCZ considers the Short term trend in CPUE in the VFA stock assessment to be the only valid indicator used. The Harvest Strategy also utilises the short term(4 year rolling average) as a primary indicator, which really makes the current form of stock assessment redundant.AVCZ considers a number of the indicators utilised in the stock assessment to be flawed.
Summary of Main Points and Recommendations
The adoption of Harvest Strategies are the way of the future for fisheries throughout Australia and the World and represent a best practice approach to fisheries Management decision making.
The recommendations of the Harvest Strategy (HS) should be adopted by VFA
The higher level +/- 15% option in the HS should be adopted when setting Quota Targets for the 11 SMUs dealt with in the HS, as this option creates a better balanced spread of effort across the Central Zone.
The Port Phillip Bay SMU should retain the status quo of zero target, noting the bay is still open to fishing. AVCZ encourages divers to visit the bay as we can gain valuable catch information in relation to the state of the resource and the ecology.
Consistent with outcomes of the harvest Strategy the total TACC for the Central Zone should be set at 276 tonnes
AVCZ to assess further measures to ensure better balanced fishing effort across the C.Z.
The current SMU arrangements incorporating 12 SMUs should be retained as reducing the number is seen as poor resource management.
Any future changes to LMLs must be based on science and data.
Harvest Strategy will not function well under continued management changes such as (but not limited to) LML changes
The Central Zone Abalone fishery above all now needs a sustained period of stability, which is necessary to enable the harvest strategy to function as designed.
Expensive Management Strategy Evaluation should not be undertaken until the HS has functioned for at least 12 to 18 months and until more is known on the outcomes of FRDC’s support for an alternative National approach to the application of HS across Australian abalone resources.
The first Abalone data loggers were developed here in the Central Zone in the late 1990s, and AVCZ is totally committed to
25

Submitter Submissionutilising the data for better decision making into the future
AVCZ now operates one of the most comprehensive GPS data logger programs in any abalone fishery worldwide
AVCZ is supported by eminent scientists in the view that there are no indicators provided by the Abundance Surveys or any other source that give reliable indicators of Pre-recruits or Recruits.
Independent reviews by eminent scientists have recommended significant changes in the Abundance Survey design that should be implemented immediately, but have not been implemented.
Industry has previously engaged Dr Duncan Worthington to recommend options for the re-design of the Stock Abundance Surveys.
AVCZ is well prepared and keen to be involved in the process of re-design of the Stock Abundance Surveys.
AVCZ believe a number of the indicators used in VFA Stock assessment to be seriously flawed and should not be used in the TACC setting process.
Draft Fisheries (Central Abalone Zone) Notice 2019We refer to email of 23rd January that provided the draft Fisheries (Central Abalone Zone) Notice2019 that sets out commercial size limits and implementation of area closures.While AV(CZ) supports the draft Fisheries Notice in principle we have two concerns, set out below.1. The timing of closing marine waters once the declared upper limit for a spatial managementunit has been reached or exceeded.We have ongoing concerns about the actual timing of a closure and while we have beenassured that it will be at the end of a fishing day we would like to see this position reflected inthe Fisheries Notice and thus we ask for the definition of closed waters to be amended to:“closed waters” means the marine waters within a spatial management unit for which theupper limit has been reached or exceeded, as recorded by AQMS at the end of a fishing day,and as specified in Column 3 of Schedule 3”;2. As the TACC review has not been completed, the upper limit data stipulated in the draft noticemay be subject to change after all submissions have been considered.Thank you for the opportunity to comment on the draft Fisheries Notice and we look forward to your
comments on our proposed amendment and possible changes to upper limit data.
26
27