veterinary medical diagnostic program - ohrc 2015 necropsy annual report.pdf · this report...
TRANSCRIPT


1
Veterinary Medical Diagnostic Program
Supported by: The Oklahoma Horse Racing Commission (OHRC) Conducted by: The Oklahoma Animal Disease Diagnostic Laboratory (OADDL) Center for Veterinary Health Sciences Oklahoma State University Reporting Period: January 1, 2015 through December 31, 2015
Introduction This report summarizes the case submissions and diagnostic findings of the Veterinary
Medical Diagnostic Program for the period starting January 1, 2015 and ending
December 31, 2015.
The Veterinary Medical Diagnostic Program, initiated in 1997, serves to: 1) investigate
and document the types of injuries sustained by horses involved in horse racing and in
race training related activities on racetracks that fall under OHRC jurisdiction; 2)
monitor this population of migrating horses for the presence of any epizootic disease(s)
that may pose a threat to Oklahoma’s horse industry; and 3) evaluate the overall effects
of all other aspects (including diet and stress) of racing and race training on the health
and well-being of Oklahoma’s racehorses. This program is the result of an alliance
formed between the Oklahoma Horse Racing Commission (OHRC) and the Oklahoma
Animal Disease Diagnostic Laboratory (OADDL).
OADDL receives the remains of all horses that die or must be humanely euthanized at
any of the Oklahoma racetracks under jurisdiction of the OHRC for comprehensive
necropsy evaluation. Results of necropsy examination are reported to the OHRC office
in Oklahoma City with a copy sent to the Official OHRC Veterinarian at the submitting
racetrack. The necropsy examination includes: 1) a complete necropsy and gross
examination of the carcass including microscopic examination of tissues (histopathology)
if necessary; 2) a thorough examination of all injuries, including an analysis of pre-
existing conditions that may relate to the occurrence of the injury; 3) microbiology
testing in cases where infectious diseases are suspect; and 4) toxicology testing as
dictated by the OHRC.
For the calendar year 2015, a total of fifty-four (54) horses were submitted to OADDL
under the Veterinary Medical Diagnostic Program. Eight (8) animals died and forty-six
(46) animals were humanely euthanized, see Table 1 (next page). A summary of
OADDL’s necropsy findings follow. For the remainder of this report individual tracks are
identified by initials: Remington Park (RP), Fair Meadows Tulsa (FMT) and Will Rogers
Downs (WRD). Individual necropsy reports have all been previously submitted to the
commission.

Table 1: Total Equine Mortality
R
DIED 6
EUTHANIZED 29
TOTAL 35
Submissions:
The total number of horses from Oklahoma racetracks submitted to OADDL
2015 is presented in Chart 1 below
horse over-all with reduction in
2015.
Monthly Distribution of Submission Table 2 (below) represents the distribution of submissions from each racetrack, sorted by
month. The monthly fluctuation of cases most likely coincides with the number of
racing days and training activity
March and October with similar numbers submitted in May
Table 2: Monthly Distribution of Necropsy Submissions for 20
Jan Feb Mar Apr
RP 0 1 7 5
FMT 0 0 0 0
WRD 0 0 1 1
Total 0 1 8 6
41
53
7370
2004 2005 2006 2007
Chart 1: Total OHRC:OADDL Submissions
2
Table 1: Total Equine Mortality – 2015
RP FMT WRD TOTAL
6 1 1 8
29 9 8 46
35 10 9 54
horses from Oklahoma racetracks submitted to OADDL
in Chart 1 below. The total number of submissions went down one
all with reduction in submissions from RP and WRD and increase at FMT in
ly Distribution of Submission:
represents the distribution of submissions from each racetrack, sorted by
month. The monthly fluctuation of cases most likely coincides with the number of
racing days and training activity. During 2015 the peak months for submission w
with similar numbers submitted in May.
: Monthly Distribution of Necropsy Submissions for 2015
Apr May Jun Jul Aug Sep Oct
6 0 0 4 3 3
0 6 4 0 0 0
1 0 0 0 1 5
7 6 4 4 4 8
61 60
78
70
78
60
2007 2008 2009 2010 2011 2012 2013 2014
Chart 1: Total OHRC:OADDL Submissions 2004 - 2015
TOTAL
horses from Oklahoma racetracks submitted to OADDL from 2004-
The total number of submissions went down one
and WRD and increase at FMT in
represents the distribution of submissions from each racetrack, sorted by
month. The monthly fluctuation of cases most likely coincides with the number of
for submission were
Nov Dec Total
5 1 35
0 0 10
0 0 9
5 1 54
55 54
2014 2015
Chart 1: Total OHRC:OADDL Submissions

3
Table 3 (below) shows the monthly submissions by horse breed. During this reporting
period, Quarter Horse (QH) and Thoroughbred (TB) submissions accounted for 91%
(49/54) of the animals submitted. Peak submission months were noted in Sprint Breeds
in March, May and October. The fall sprint breed peak was a new finding in 2015.
There was a submission peak for Thoroughbred (TB) animals in November, however the
peak number was 5 and reduced from 7 (September) in 2014.
Table 3: Monthly Distribution of Necropsy Submissions by Breed for 2015 Breed Jan Feb Mar Apr May Jun Jul Aug Sep Oct Nov Dec Total TB 0 0 1 1 1 1 1 4 2 3 5 1 20 QH 0 1 7 3 6 4 2 0 1 5 0 0 29
Paint 0 0 0 2 0 1 0 0 1 0 0 0 4 Appaloosa 0 0 0 0 0 0 1 0 0 0 0 0 1 Total 0 1 8 6 7 6 4 4 4 8 5 1 54
Gender and Breed of Horse:
The Breed distribution of necropsy case
submissions to OADDL for 2015 is presented in
Table 4 to the left. Quarter Horse submissions
were 9 more than for Thoroughbred breed, with
four Paints and one Appaloosa submitted. Chart
2 (below) displays submission number and
breed for the previous 5-years.
0
5
10
15
20
25
30
35
40
45
50
2011 2012 2013 2014 2015
Chart 2: Submission and Breed 2011-2015
Thoroughbred Quarter Horse Paint Appaloosa
Table 4: Submission by Breed 2015
Number of Horses
Thoroughbred 20
Quarter Horse 29
Paint 4
Appaloosa 1
Total 54
4
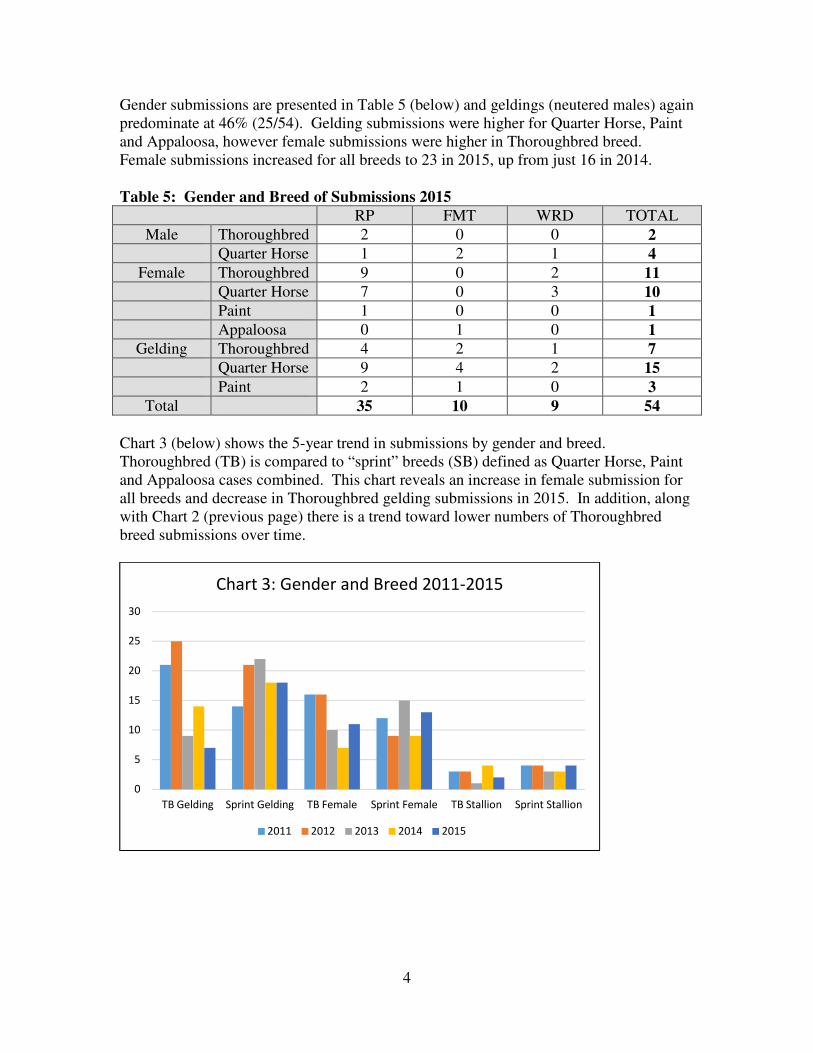
Gender submissions are presented in Table 5 (below) and geldings (neutered males) again
predominate at 46% (25/54). Gelding submissions were higher for Quarter Horse, Paint
and Appaloosa, however female submissions were higher in Thoroughbred breed.
Female submissions increased for all breeds to 23 in 2015, up from just 16 in 2014.
Table 5: Gender and Breed of Submissions 2015 RP FMT WRD TOTAL
Male Thoroughbred 2 0 0 2 Quarter Horse 1 2 1 4
Female Thoroughbred 9 0 2 11 Quarter Horse 7 0 3 10 Paint 1 0 0 1 Appaloosa 0 1 0 1
Gelding Thoroughbred 4 2 1 7 Quarter Horse 9 4 2 15 Paint 2 1 0 3
Total 35 10 9 54 Chart 3 (below) shows the 5-year trend in submissions by gender and breed.
Thoroughbred (TB) is compared to “sprint” breeds (SB) defined as Quarter Horse, Paint
and Appaloosa cases combined. This chart reveals an increase in female submission for
all breeds and decrease in Thoroughbred gelding submissions in 2015. In addition, along
with Chart 2 (previous page) there is a trend toward lower numbers of Thoroughbred
breed submissions over time.
0
5
10
15
20
25
30
TB Gelding Sprint Gelding TB Female Sprint Female TB Stallion Sprint Stallion
Chart 3: Gender and Breed 2011-2015
2011 2012 2013 2014 2015

5
The distribution of racehorse submissions arranged by age, breed and track during 2015
is shown in Table 6 (below). Our Oklahoma data continues to report the highest age for
submission to be 2-year old animals and “sprint” breeds accounted for 80% (20/25) of the
two year old animals. The 10 year old and 20 year animals submitted (*) were both in
use as pony horses, and not entered in race competition. In 2015, the number of 2 year
old submissions increased, 3 year olds decreased and other age groups remained
somewhat constant.
Table 6: Age of Horse and Breed 2015.
RP FMT WRD Total
Two year old Thoroughbred 5 0 0 5
Quarter Horse 11 3 5 19
Paint 1 0 0 1
Three year old Thoroughbred 1 1 0 2
Quarter Horse 1 2 1 4
Paint 1 0 0 1
Four year old Thoroughbred 4 0 1 5
Quarter Horse 2 0 0 2
Five year old Thoroughbred 3 0 2 5
Quarter Horse 1 1 0 2
Six year old Thoroughbred 2 1 0 3
Paint 0 1 0 1
Appaloosa 0 1 0 1
Seven year old
Quarter Horse 1 0 0 1
Ten year old Paint
Pony Horse
1* 0 0 1
Twenty year old
Quarter Horse Pony Horse
1* 0 0 1
Total 35 10 9 54

6
Fatal Event by Age (in years): Table 7: Fatal Event by Age (years) 2015
This section describes the fatal event
(determined by OHRC history and
OADDL necropsy) as compared to
age of the horse. The categories
included are animals injured during
racing, routine training, accidents and
those dying of non-exercise or
“natural” disease conditions
(combined). This data is presented
for 2015 in Table 7 to the left.
Slightly less than one-half (44%) of
the two-year-old fatalities were
associated with training or non-
exercise/accidents. Racing fatality rates for 2-year old sprint breed horses were also
below 1 per 1000 starters at all three Oklahoma tracks (RP=0.69, FMT=0.46,
WRD=0.38) in 2015. State-wide, a majority 59% (32/54), of fatalities were submitted
from race day or race-related conditions. Lower numbers of training fatalities in
Oklahoma reflect the large number of animals that train off-site of OHRC facilities. In
2015 compared to 2014: race day cases were decreased by 8, training cases increased by
2, and non-exercise cases increased by 5.
Fatal Event by Breed: Fatal event categories by breed during 2015 is presented in Table 8 (below). All breeds
reported highest fatalities for racing, but this may represent a bias in the current necropsy
program. Race day mortality remains the primary submission to the OADDL:OHRC
necropsy program, 32/54 (59%) of submissions. More than half of the submissions for
Thoroughbred, Quarter Horse and Paint breeds were associated with race day conditions.
Table 8: Fatal Event by Breed 2015:
Breed Racing Training Non-
exercise Total
Thoroughbred 12 4 4 20
Quarter Horse 17 6 6 29
Paint 3 0 1 4
Appaloosa 0 0 1 1
Total 32 10 12 54
Age Racing Training Non-
exercise Total
2 14 7 4 25
3 5 1 1 7
4 3 1 3 7
5 6 0 1 7
6 4 0 1 5
7 0 1 0 1
10 0 0 1 1
20 0 0 1 1
Total 32 10 12 54

7
A 5-year summary Chart 4 is included below and depicts consistent reduction in race day
fatality for “sprint” breeds (SB) over 3 years and Thoroughbreds (TB) over 5 years.
Management changes implemented since 2013 include: pre-race Veterinary inspection,
banning front toe grabs on Thoroughbreds and renovation of track surfaces at RP and
FMT. Increases in SB training and non-exercise (Non-ex) submissions were noted in
2015.
Complete tabulation of category of death and breed by Track is presented in Table 9 on
the next page:
0
5
10
15
20
25
30
35
TB Racing SB Racing TB Training SB Training TB Non-ex SB Non-ex
Chart 4: TB and SB Fatality Event 2011-2015
2011 2012 2013 2014 2015

8
Table 9: Fatal event by breed and track 2015. RP FMT WRD Total RACE DAY Thoroughbred 8 2 2 12 Quarter Horse 7 5 5 17 Paint 2 1 0 3 Before Race Thoroughbred 1 0 1 2
(after finish or) During Race Thoroughbred 5 2 1 8
Quarter Horse 7 5 3 15
Paint 2 1 0 3
Finished Race Thoroughbred 2 0 0 2
Quarter Horse 0 0 2 2
TRAINING Thoroughbred 3 0 1 4 Quarter Horse 4 1 1 6 Non-Exercise Thoroughbred 4 0 0 4 Quarter Horse 6 0 0 6 Paint 1 0 0 1 Appaloosa 0 1 0 1
TOTAL 35 10 9 54
All of race day deaths in 2015 were at or around time of race. Two Thoroughbred
animals were euthanized prior to the race due to cranial trauma and pelvic fracture; one
occurred in the Paddock and one at the Starting Gate. Four animals died or were
euthanized following a race; one was a vertebral injury, one a forelimb injury, and two
were cases of acute collapse (one EIPH and one internal hemorrhage). Training fatality
cases increased to 10 in 2015 from 8 in 2014 and non-exercise fatalities almost doubled
from 7 to 12 in 2015. The non-exercise cases will be more completely described later in
this report.
GOAL 1: INVESTIGATE AND DOCUMENT TYPES OF INJURIES: Distribution of Fatal Activity and Track: Table 10: Fatal Activity by Track - 2015
TRACK Racing Training Non-exercise Total
RP 17 7 11 35
FMT 8 1 1 10
WRD 7 2 0 9
Total 32 10 12 54

9
Table 10 (previous page) reports a summary of activity for case fatalities for each of the
three submitting tracks. Table 11, below, further separates the total fatalities in a
different manner based on final necropsy analysis. Cause of death is divided into
categories of natural disease states (non-exercise related and accidents), cases of exercise
induced pulmonary hemorrhage (EIPH) and finally conditions involving musculoskeletal
injury.
Table 11: Cause of Death by Track - 2015
RP FMT WRD Total
Natural Disease/Non-Exercise/Accident 11 1 0 12
EIPH (bleeder on RACE DAY) 1 0 0 1
Musculoskeletal Injury 23 9 9 41
Racing: 16 8 7 31
Training: 7 1 2 10
Total 35 10 9 54
In 2015, 76% (41/54) of the submissions were related to musculoskeletal system injury
sustained during racing or training. Racing and training musculoskeletal injuries
decreased at RP and increased at FMT and WRD in 2015.
Exercise Induced Pulmonary Hemorrhage: Exercise induced pulmonary hemorrhage (EIPH has been reported since early history in
the horse and research efforts remain directed at the underlying pathophysiology,
treatment and management of this condition. The condition is typically not reported as
an “injury” in most jurisdictions since the majority of these cases are not fatal.
Identification systems for “bleeders” are in place in Oklahoma. During 2015 there was
only one submission where EIPH was confirmed as the cause of death on race day. The
case was a 6 year old Thoroughbred gelding running in a 6-furlong Claiming Race at RP
in October.
Musculoskeletal Injury: As seen in Table 11, the majority of the total fatalities were related to musculoskeletal
disorders, essentially unchanged from 2003. Table 12 (next page) displays the
distribution of limb injuries sustained by animals during racing or training, pre-race
injuries but excludes EIPH horses and accidents which involved the skeleton. This data
is also segregated by breed, track and limb in 2015. Forelimb injuries were nearly
equally distributed between right and left in 2015. Bilateral forelimb injury increased by
one case to 5 in 2015, and all were in Quarter Horses. Injuries to hind limbs were 3 in
2015, the same as in 2014, however all were in right hind. Injuries to locations other than
the limbs increased to 8 in 2015, from 6 in 2014

10
Table 12: Limb injury by breed and racing/training 2015. RP FMT WRD TOTAL
Sum Race Train Race Train Race Train Race Train Right Front 12
TB 4 1 0 0 0 0 4 1 5
QH 3 0 2 0 0 1 5 1 6
Paint 1 0 0 0 0 0 1 0 1
Left Front 13 TB 1 2 2 0 0 1 3 3 6
QH 1 1 1 1 3 0 5 2 7
Bilateral Front 5 QH 2 1 1 0 1 0 4 1 5
Right Hind 3 TB 0 0 0 0 1 0 1 0 1
Paint 1 0 1 0 0 0 2 0 2
Other 8
TB 2 0 0 0 2 0 4 0 4
QH 1 2 1 0 0 0 2 2 4
TOTAL 16 7 8 1 7 2 31 10 41 Musculoskeletal Disorder – All Racing or Training Injuries: The complete reporting of injury site is included in Table 13 (next page). Breed is
distributed by Thoroughbred (TB) and Sprint breeds (Quarter Horse, Paint, Appaloosa)
designated “SB.” Surveys and research in other racing jurisdictions have reported
increased injury to the front limbs and identified injuries to the distal limbs (distal to the
carpus) as the most common injury in the racing equine athlete. This table includes race
and training injuries, pre-race injury and EIPH but excludes accidents involving the
limbs. The EIPH case in 2015 did not sustain musculoskeletal injury. Multiple injury
sites were noted at necropsy in some carpal and fetlock cases; where the primary bone
fracture was not definitively identified.

11
Table 13: All Fatal Injuries during Racing or Training & Track 2015
Injury RP FMT WRD Total Sum
TB SB TB SB TB SB TB SB
Carpal Fracture: 3 5 0 1 0 4 3 10 13
Fetlock Failure: 2 2 2 2 1 0 5 4 9
Front: 2 2 2 1 1 0
Hind: 0 0 0 1 0 0
Cannon (Metacarpus): 0 2 0 1 1 0 1 3 4
Front (MCIII): 0 2 0 1 0 0
Hind (MTIII): 0 0 0 0 1 0
Vertebrae (T(1)L S(3)): 0 2 0 1 0 1 0 4 4
Scapula: 0 0 0 2 0 1 0 3 3
Humerus: 2 0 0 0 0 0 2 0 2
Iliac Artery Rupture: 1 1 0 0 0 0 1 1 2
First phalanx (P1 front): 1 0 0 0 0 0 1 0 1
Pelvis (Ilium): 1 0 0 0 0 0 1 0 1
Flexor Tendon Laceration: 0 1 0 0 0 0 0 1 1
Skull: 0 0 0 0 1 0 1 0 1
E.I.P.H. 1 0 0 0 0 0 1 0 1
Total 11 13 2 7 3 6 16 26 42
Distal forelimb injuries accounted for 64% (27/42) of total fatal musculoskeletal injuries
in 2014. A change in 2015 was an increase in carpal joint injury cases, which
outnumbered fetlock/phalanx joint injuries. Distal limb injury location for the
OHRC:OADDL program is presented in Chart 5 (next page) for 2007-2015. Fractures of
cannon bones and skull were reduced in 2015 from 2014; while fractures of scapula and
humerus increased by 1 animal in 2015. The number of vertebral fractures identified
stayed constant at four cases and all were sprint breeds in 2015; however one of these
was thoracic location not lumbo-sacral.

12
Continued monitoring of limb injuries is important for Commission Veterinarians, Track
Veterinarians, Track Management and Track Superintendent to improve and ensure a safe
racing environment. The increased occurrence of carpal joint injuries in 2015 could be
utilized for the remainder of 2016 race meets.
GOAL 2: MONITOR FOR EPIZOOTIC DISEASE: In Table 11 from page 9, there were 12/54 (22%) of submitted fatal cases reported due to
non-exercise related activities, natural diseases and accidents. This type of fatal
submission nearly doubled in 2015, up from only 7 submissions in 2014. These animals
include cases with potential infectious or communicable disease important to all animals
competing, training or residing in the racetrack environment. Table 14 (next page)
documents these cases based on final necropsy analysis at OADDL.
0
5
10
15
20
25
30
2007 2008 2009 2010 2011 2012 2013 2014 2015
Chart 5:
Oklahoma Fatal Distal Limb Injury Site
2007 - 2015
Fetlock/Phalanx Carpus Cannon

13
Table 14: Non-Exercise, Natural Disease, Accident -2015 Track Signalment Description Accidents: RP 5Y;QH;Geld. Electrocution; stray voltage-horse walker Died
RP 2Y;TB;Male Down under partition of van; vertebral
fracture
Euth.
Intestinal: RP 4Y;QH;Geld. Small intestine torsion Died
RP 20Y;QH;Geld. Right colon displacement; endotoxemia Euth.
RP 3Y;QH;Geld. Gastric rupture and peritonitis Died
RP 2Y;QH;Female Persistent colic & reflux; severe gastric
ulceration
Euth.
Respiratory: RP 4Y;TB;Female Chronic abscess, pharynx/larynx; fistulous
tracts
Euth.
RP 2Y;TB;Female Chronic pleuropneumonia; Klebsiella
pneumonia
Euth.
Musculoskeletal: RP 2Y;QH;Female Clinical signs & histopathology - wobbler Euth.
FMT 6Y;AP;Female Malignant Edema, neck; Clostridium novyi Died
RP 10Y;PT;Geld. Found in stall; fracture of tibia Euth.
RP 4Y;TB;Female Found in stall; skull fracture Euth.
In 2015 one non-exercise submission came from FMT, while the other 11 were from RP.
Six were Quarter Horses, four were Thoroughbreds and one Paint and Appaloosa were
submitted. Five were geldings, six were female and one was an intact male stallion.
Four of these cases involved the gastrointestinal system and specific findings are
summarized in the table. Intestinal disorders or colic symptoms are a common disorder
affecting many equine populations. No cases of diarrhea were submitted in 2015, and no
Salmonella sp were isolated. Four of the cases were musculoskeletal system injury. Two
were animals found in their stall with fractures and the reports were forwarded to OHRC.
One animal had clinical signs suggestive of cervical vertebral disease and necropsy
confirmed histologic evidence of spinal cord compression. The final musculoskeletal
case was one of malignant edema affecting the neck/pectoral muscles. Clostridium novyi
bacteria were identified. This disease is seen in horses, most commonly secondary to
penetrating wounds. Only two cases associated with respiratory system disease were
received in 2015. One was a very chronic upper respiratory disease case and the other a
chronic pleuritis case. An alpha-Streptococcus (not Strangles) bacteria was isolated from
the former and classic Klebsiella pneumonia bacteria from the latter case. Screening
representative cases for Equine Herpes Virus-1 (EHM), West Nile Virus and Eastern
Equine Encephalitis were all negative in 2015. Two accident cases submitted were a
stray-voltage electrocution of a 5 year old Quarter Horse and Van/Trailer accident of a 2
year old Thoroughbred.

14
The disease surveillance emphasis for the cooperative OADDL:OHRC program is vital to
the Oklahoma racing industry. Monitoring for potential infectious diseases will continue
in 2016 submissions.
Drug Testing (TOXICOLOGY):
Since the initiation of the cooperative OADDL:OHRC Diagnostic Program, some
toxicology analysis has been performed, at the request of the OHRC. Samples including
urine, eye fluid and synovial fluid are harvested and retained according to OADDL
policy, and toxicology remains available on all cases at the request of OHRC.
Supplemental toxicology was performed on two animals in 2015. A 2 year old Quarter
horse filly had eye fluid that was suspicious for Clenbuterol, Dexamethasone and
Phenylbutazone and a 5 year old Thoroughbred filly with synovial fluid analysis
revealing: Phenylbutazone <1µg/mL; Clenbuterol<5pg/mL; Methocarbamol≈0.3ηg/mL
and Dexamethasone≈72pg/mL. Both cases forwarded were from Remington Park.
Results were reported to the OHRC for interpretation.
GOAL 3: OVERALL RACEHORSE HEALTH:
The overall health and well-being of the Oklahoma racehorse population remains a stated
goal of the joint OADDL:OHRC Program. Of particular interest is the hoof
anatomy/morphology/angle and shoeing characteristics of the equine population. This
examination is attempted on all submissions, including non-exercise related deaths and
pony horse animals. Table 15 (next page) displays the hoof/shoeing data compiled
during the 2015 time period. The abnormalities are quantitated for 2015 and also
reported by breed (rather than track).

15
Hoof Anatomy/Shoe Characteristics: Table 15: Hoof Anatomy and Horse Shoe Characteristics - 2015 TB SB TOTAL
Toe Grabs:
Front=None 14 3 17
Front < 5mm 6 20 26
Front > 5mm 0 11 11
Hind < 5mm 1 3 4
Hind > 5mm 7 20 27
Hind Shoes Not Examined: 11 11 22
Barefooted Hind: 0 1 1
Toe/Heel Length Normal 7 11 18
Long toe/low heel Mild 7 11 18
Moderate 4 9 13
Marked 1 2 3
Not reported 1 1 2
Under-run heels Normal 10 14 24
Mild 4 9 13
Moderate 3 9 12
Marked 2 0 2
Not reported 1 2 3
Over-grown/need re-set 1 5 6
Abnormal
Growth/Symmetry/Imbalance
0 5 5
Squared toe/Dubbed Toe 3 2 5
Rim Pads 2 0 2
Full sole pad/cushion 0 2 2
Corrective shoes 0 1 1
A concerted effort was made to record the hoof morphology and shoeing characteristics
on all horses submitted under the OADDL:OHRC Program in 2015. Long toe grabs were
present on front feet of 11 animals in 2015, all were in Sprint Breeds and this was the
same number reported in 2014. The majority of toe grabs on hind shoes were again long
(>5mm). Hind shoes were not examined however on 22 animals in 2015. Over-all there
were 68% (37/54) set of front hooves evaluated as “normal” or “mild” with respect to toe
length and heel length, improvement from 2014 (53%). Abnormal hooves, corrective
shoes, pads and squared or dubbed off toes were reduced from 2014. There were six
animals with front hooves that were long, over-grown, with worn shoes or loose nails in
need of reset examined in 2015.
16
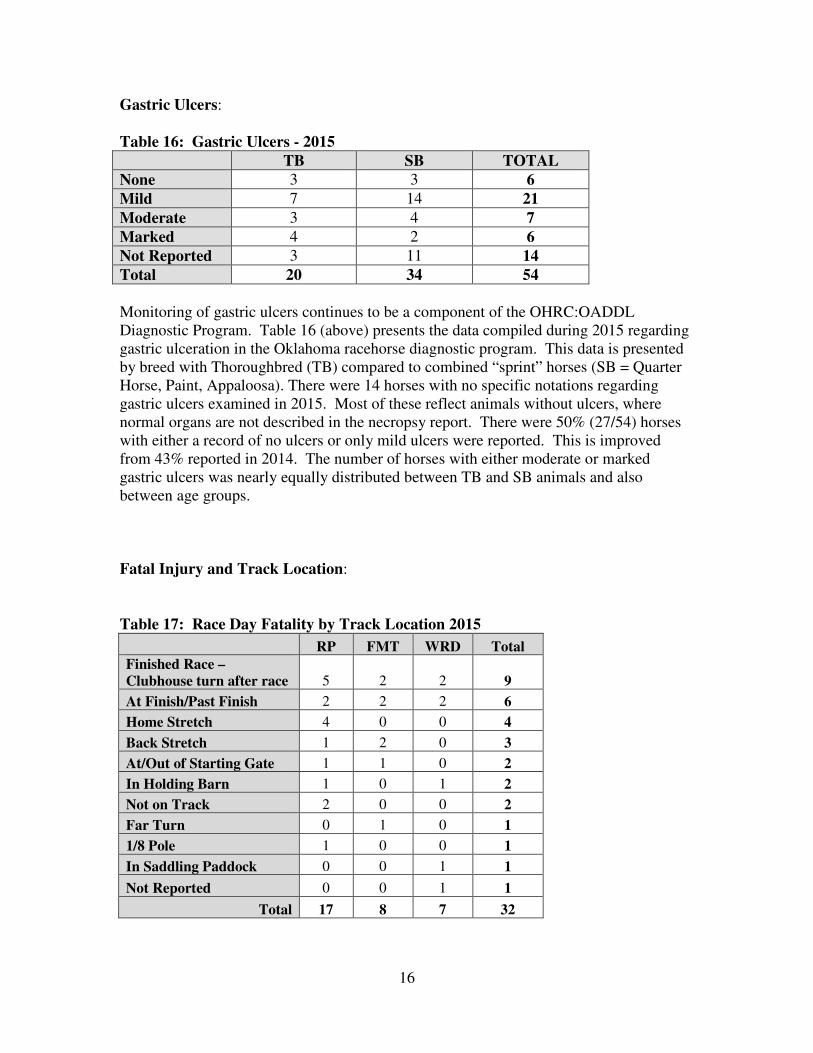
Gastric Ulcers:
Table 16: Gastric Ulcers - 2015 TB SB TOTAL None 3 3 6 Mild 7 14 21
Moderate 3 4 7 Marked 4 2 6 Not Reported 3 11 14 Total 20 34 54
Monitoring of gastric ulcers continues to be a component of the OHRC:OADDL
Diagnostic Program. Table 16 (above) presents the data compiled during 2015 regarding
gastric ulceration in the Oklahoma racehorse diagnostic program. This data is presented
by breed with Thoroughbred (TB) compared to combined “sprint” horses (SB = Quarter
Horse, Paint, Appaloosa). There were 14 horses with no specific notations regarding
gastric ulcers examined in 2015. Most of these reflect animals without ulcers, where
normal organs are not described in the necropsy report. There were 50% (27/54) horses
with either a record of no ulcers or only mild ulcers were reported. This is improved
from 43% reported in 2014. The number of horses with either moderate or marked
gastric ulcers was nearly equally distributed between TB and SB animals and also
between age groups.
Fatal Injury and Track Location:
Table 17: Race Day Fatality by Track Location 2015
RP FMT WRD Total
Finished Race – Clubhouse turn after race 5 2 2 9
At Finish/Past Finish 2 2 2 6
Home Stretch 4 0 0 4
Back Stretch 1 2 0 3
At/Out of Starting Gate 1 1 0 2
In Holding Barn 1 0 1 2
Not on Track 2 0 0 2
Far Turn 0 1 0 1
1/8 Pole 1 0 0 1
In Saddling Paddock 0 0 1 1
Not Reported 0 0 1 1
Total 17 8 7 32

17
The reporting of location on a racetrack where a catastrophic injury occurs to a racehorse
has been utilized by several racing jurisdictions to improve overall safety for equine
competitors. This data is compiled as part of the cooperative OADDL:OHRC diagnostic
program but is also reliant upon submission of this data from Commission licensed
personnel and includes the EIPH case. The 2015 data for track location is included in
this report as Table 17 (previous page) and includes only race day deaths. This data was
not provided on only one submission form in 2015, as we instituted a new re-designed
submission form. The new form allowed diagrammatic representation for submitting
Veterinarians. The new form went into use May of 2015, so there is some transition in
this information in 2015. The majority of submissions report injuries at or past the finish
and also well past the finish in the clubhouse turn following a race, 47% (15/32).
Unfortunately, the reporting is not standardized between regulatory officials, and remains
difficult to interpret. In addition, this location may indicate the point that an animal is
pulled up or identified and not the exact location of the injury in some cases. More in-
depth analysis and standard reporting of track location will continue to be an objective of
this program.
Race Fatality and Class of Race: Table 18: Race Day Fatality by Class of Race & Breed – 2015 RP FMT WRD Total TOTAL TB SB TB SB TB SB TB SB
Allowance Claiming 1 0 0 0 0 0 1 0 1
Maiden claiming 0 0 0 2 1 3 1 5 6
Claiming: 4 1 1 2 0 0 5 3 8
$0-4999 0 0 0 0 0 0 0 0
$5000-7499 2 0 1 2 0 0 3 2
$7500-9999 0 0 0 0 1 0 1 0
$10,000-19,999 3 1 0 2 0 3 3 6
$20,000-up 0 0 0 0 0 0 0 0
Futurity/Derby Trial 0 4 0 1 0 0 0 5 5
Allowance 2 0 0 0 0 1 2 1 3
Stakes 0 0 0 0 1 0 1 0 1
Maiden Race 1 4 1 1 0 1 2 6 8
Total 8 9 2 6 2 5 12 20 32

18
The 32 race day fatality cases (including EIPH & pre-race cases) are displayed with
respect to class of race in Table 18 (previous page). Claiming race information includes
claiming price, and also shows subdivision for Maiden Claiming and Allowance Optional
Claiming races. In 2015, there were 15 Claiming race fatalities and 9 fatalities from
Allowance, Stakes or Futurity/Derby and 8 Maiden races. The distribution of race class
for Oklahoma submissions from 2011 to 2015 is included in Chart 6 below. Of note is
the over-all reduction in all cases submitted in 2015.
Race Fatality and Distance of Race:
The Oklahoma Quarter Horse Racing Association (OQHRA) and Thoroughbred Racing
Association of Oklahoma (TRAO) provided Incompass information for 2015 regarding
number of horses starting at different distances. Tables 19a and 19b (following page)
contain the total number of race fatalities submitted to OADDL in relation to race
distance and surface. These tables include Pre-Race fatalities (1 TB RP, 1 TB WRD) but
excludes EIPH (TB RP), total number of 31 animals. Separate tables include
Thoroughbred (Table 19a) and Sprint Breeds (Table 19b). This raw data is summarized
for the State of Oklahoma in the far right column and all columns include calculation of
total fatalities per 1000 starters.
0
5
10
15
20
25
30
35
2011 2012 2013 2014 2015
Chart 6: Oklahoma Fatal Submission
and Class of Race
2011 - 2015
Claiming Race Allowance, Stakes, Derby/Futurity Maiden

19
Table 19a: Thoroughbred Race Day Fatality, Number of Starters, Distance 2015:
Race Distance
RP FMT WRD Total
#Fatal #Start
Fatal per 1000 Starters
#Fatal
#Start Fatal
per 1000 Starters
#Fatal
#Start Fatal
per 1000 Starters
#Fatal
#Start Fatal
per 1000 Starters
Races on DIRT 3 fur 1 13 76.92 0 - - 0 - - 1 13 76.92
4 fur 0 - - 0 287 - 0 - - 0 287 -
5 fur 0 205 - 0 - - 0 199 - 0 404 -
5-1/2 fur 1 896 1.12 0 61 - 1 535 1.87 2 1492 1.34
6 fur 0 1225 - 1 338 2.96 1 559 1.79 2 2122 0.942
6-1/2 fur 1 409 2.44 0 123 - 0 - - 1 532 1.88
7 fur 0 241 - 0 - - 0 - - 0 241 -
1 mile 1 783 1.28 1 208 4.81 0 657 - 2 1648 1.21
1mi70yds 0 607 - 0 - - 0 73 - 0 680 -
1-1/6 mi 0 116 - 0 - - 0 7 - 0 123 -
1-1/8 mi 0 30 - 0 - - 0 - - 0 30 -
1-3/16 mi 0 - - 0 - - 0 7 - 0 7 -
Total dirt 4 4525 0.884 2 1017 1.97 2 2037 0.982 8 7579 1.06
Races on TURF
5 fur 0 199 - 0 199 -
7-1/2 fur 2 223 8.97 2 223 8.97
1 mile 1 387 2.58 1 387 2.58
1-1/16 mi 0 139 - 0 139 -
1-1/8 mi 0 16 - 0 16 -
Total turf 3 964 3.11 3 964 3.11
Table 19b: Sprint Breed Race Day Fatality, Number of Starters, Distance 2015:
Race Distance in yards
RP FMT WRD Total
#Fatal #Start Fatal
per 1000 Starters
#Fatal #Start Fatal
per 1000 Starters
#Fatal #Start Fatal
per 1000 Starters
#Fatal
#Start Fatal
per 1000 Starters
110 0 9 - 0 0 - 0 76 - 0 85 -
220 0 0 - 0 10 - 0 96 - 0 106 -
250 1 593 1.69 2 511 3.91 0 349 - 3 1453 2.06
300 1 905 1.10 2 553 3.62 1 693 1.44 4 2151 1.86
330 3 465 6.45 0 215 - 2 313 6.39 5 993 5.04
350 3 1403 2.14 1 567 1.76 1 710 1.41 5 2680 1.86
400 0 513 - 0 0 - 1 226 4.42 1 739 1.35
440 0 217 - 0 0 - 0 101 - 0 318 -
550 0 97 - 0 0 - 0 104 - 0 201 -
870 1 195 5.13 1 155 6.45 0 186 - 2 536 3.73
Total 9 4397 2.05 6 2011 2.98 5 2854 1.75 20 9262 2.16

20
Chronic Musculoskeletal Lesions: Complete identification of pre-existing or chronic changes in the musculoskeletal system
continues to be documented in the OADDL:OHRC diagnostic program. This analysis
was completed on most animals submitted, regardless of history in 2015. There were 15
fatal race day or training cases submitted in which significant pre-existing or chronic
joint/bone lesions were present, the same as in 2014. Twelve of these cases were
musculoskeletal injury cases and also race day fatalities. Of these race day cases, pre-
existing significant arthritis was identified in 11, with multiple joints affected in 7 cases.
More severe chronic pre-existing lesions were noted in 6 contralateral and 2 ipsilateral
sites. Significant bone chips along joint margins were present in 7 cases, chronic
synovitis in 6 cases, chronic suspensory ligament damage in 2 cases and chronic flexor
tendon damage in 1 case. The other three submissions included the gastric
rupture/peritonitis case, malignant edema case and chondritis/pharyngitis case. All three
of these cases had chronic arthritis with bone chips and subchondral sclerosis of distal
cannon bone, chronic synovitis and cartilage score lines. One of these animals also had a
large cartilage defect. The 15 cases included: 7 Quarter Horses, 6 Thoroughbred, 1 Paint
and 1 Appaloosa. There were three 2-year old, two 3-year old, two 4-year old, three 5-
year old, and five 6-year old animals in this group. Submissions came from RP (8), FMT
(5) and WRD (2). Peak months of submission for cases with significant chronic lesions
were June and October with 3 each, followed by May, July, August and November with 2
each and 1 submission was received in September.
Final reports were issued to OHRC on individual cases regarding pre-existing lesions and
other conditions preceding death. Review of these cases by OHRC or submitting Track
officials is part of the usefulness of the necropsy program.

21
SUMMARY: Table 20: Number of Musculoskeletal Fatalities per Number of Race Days Catastrophic
Musculoskeletal
Fatality
Number of
RACE DAYS
Catastrophic
Musculoskeletal
Fatality per Race
Day
TOTAL 2007 46 265 0.174 2008 39 265 0.147 2009 40 238 0.168 2010 51 211 0.242 2011 44 211 0.208 2012 45 211 0.213 2013 45 211 0.213 2014 40 209 0.191 2015 31 209 0.148
Remington Park 2007 14 119 0.118
2008 16 117 0.137
2009 23 117 0.197
2010 22 117 0.188
2011 21 117 0.179
2012 26 117 0.222
2013 21 117 0.179
2014 26 117 0.222
2015 16 117 0.137
Fair Meadows Tulsa 2007 11 34 0.324
2008 15 34 0.441
2009 3 34 0.088
2010 15 34 0.441
2011 9 34 0.265
2012 8 34 0.235
2013 11 34 0.323
2014 6 34 0.176
2015 8 34 0.235
Will Rogers Downs 2007 5 42 0.119
2008 3 44 0.068
2009 6 44 0.136
2010 14 60 0.233
2011 14 60 0.233
2012 11 60 0.183
2013 13 60 0.217
2014 8 58 0.138
2015 7 58 0.121

22
Table 20 (previous page), presents musculoskeletal fatality per racing day for Oklahoma
tracks from 2007 to 2015. This value was reduced State-wide again in 2015 calendar
year to 0.148, continuing a trend in improvement since 2013. Conclusions from the 2015
year-end report indicate that Oklahoma racetracks remain an active and an improved
environment for equine athletes. During 2015, there were 31 race day musculoskeletal
fatalities and 1 EIPH race day fatality. Vertebral fractures (4) in Quarter Horses were
again noted however lumbo-sacral site was reduced by 1 to three. Carpal joint fractures
outnumbered fetlock/phalanx fractures for the first time. The total number of cases
submitted was reduced, number of Thoroughbred animals reduced and number of non-
exercise cases submitted increased in 2015.
The number of starters by breed was provided by OQHRA and TRAO in 2015, and is
presented below in Table 21. For all breeds and tracks, the number of horses starting in
races decreased in 2015.
Table 21: Number of Starters by Breed and Track 2015 Breed RP FMT WRD Total
Thoroughbred 5489 1017 2037 8543
Sprint Breeds Total 4397 2011 2854 9262 Quarter Horse 3765 1546 2375 7686
Paint 544 384 392 1320
Appaloosa 88 81 87 256
Total 9886 3028 4891 17805
This information allows calculation of Catastrophic Musculoskeletal Injury Index (CMI),
a more traditional manner of comparing injury statistics. CMI is calculated as the
number of Fatal Catastrophic Musculoskeletal Injuries per 1000 horses starting to race.
The information is presented in table form below, Table 22, segregated by breed (TB &
SB), race track and State-wide total.
Table 22: CMI by Breed and Track 2015: RP FMT WRD TOTAL
Number Musculoskeletal Fatality during RACE:
Thoroughbred 7 2 2 11
Sprint Breeds 9 6 5 20
Total: 16 8 7 31
Total number of STARTERS:
Thoroughbred 5489 1017 2037 8543
Sprint Breeds 4397 2011 2854 9262
Total: 9886 3028 4891 17805
CMI “index” – number per 1000 starters
Thoroughbred 1.28 1.97 0.981 1.29
Sprint Breeds 2.05 2.98 1.75 2.16
TOTAL 1.62 2.64 1.43 1.74

23
The CMI is an attempt to correlate with what is reported in other jurisdictions, a five year
Oklahoma summary appears in Table 23 (below). We are fortunate in Oklahoma to have
cooperation between breed associations, regulatory associations, practicing veterinarians
and diagnosticians in performing analysis. The number of “starters” per race will remain
critical in determining any further factors regarding over-all racing safety. Nationwide
statistics reported a CMI index of 1.62 for Thoroughbreds (Jockey Club EID March
2016). Table 23 demonstrates Oklahoma remains in line with this figure with a “State-
wide” Thoroughbred index of 1.29 and State-wide total index of 1.74. This value is the
lowest since 2011 and indicates improvement of fatal injury rate.
There are many factors which may be associated with the State-wide decrease, such as
the institution of “pre-race” veterinary examinations, banning of long toe grabs in
Thoroughbred horses and significant track surface renovations. Oklahoma is unique in
that we have nearly equal numbers of both Thoroughbreds and Sprint Breeds competing.
Table 23: CMI by Breed and Track 2011 – 2015. TB SB Total
Remington Park
2011 1.98 1.71 1.86
2012 2.90 1.94 2.45
2013 1.84 2.18 2.00
2014 1.77 2.76 2.24
2015 1.28 2.05 1.62
Fair Meadows Tulsa
2011 2.98 2.23 2.51
2012 1.58 2.32 2.05
2013 1.58 4.53 3.38
2014 1.64 2.04 1.89
2015 1.97 2.98 2.64
Will Rogers Downs
2011 2.30 2.19 2.24
2012 1.39 2.21 1.82
2013 1.58 3.10 2.39
2014 0.43 2.12 1.36
2015 0.981 1.75 1.43
State TOTAL
2011 2.20 1.97 2.08
2012 2.30 2.10 2.20
2013 1.73 2.92 2.34
2014 1.42 2.43 1.94
2015 1.29 2.16 1.74

24
The Oklahoma Animal Disease Diagnostic Laboratory remains proud to be included as
an integral part of the Veterinary Medical Diagnostic Program in cooperation with the
Oklahoma Horse Racing Commission. The OADDL remains committed to
accomplishing the goals outlined for this project and pleased to support the important
racing and equine industries of the state.
Respectfully submitted,
Dr. Grant B. Rezabek
Oklahoma Animal Disease Diagnostic Laboratory
ACKNOWLEDGEMENT:
A special thanks is expressed to representatives of OQHRA and TRAO who cooperated
to contribute the end of meet data and to personnel at OADDL who assist in data
collection:
1. Accredited Oklahoma-Bred Development Program
2. Debbie Schauf & Justin Rihard: Oklahoma Quarter Horse Racing Association.
3. Danielle Barber: Thoroughbred Racing Association of Oklahoma.
4. Ashley Jarrett, Shauni Windle: OSU/CVHS/OADDL
Scheduled Presentation: Race Horse Pathology: AAVLD Annual Meeting
F. Uzal, L. Kennedy, M. Scollay, G. Rezabek
Sunday October 16, 2016
Greensboro, NC