very fast and direct capillary zone electrophoresis method for the determination of creatinine and...
TRANSCRIPT

Analytica Chimica Acta 521 (2004) 53–59
Very fast and direct capillary zone electrophoresis method for thedetermination of creatinine and creatine in human urine
J. Rodrıgueza,∗, J.J. Berzasa, G. Castañedaa, N. Morab, M.J. Rodrıguezb
a Department of Analytical Chemistry and Foods Technology, Univ. de Castilla-La Mancha, Avenida Camilo Jose Cela 10, Ciudad Real 13071, Spainb Department of Analytical Chemistry, University of Extremadura, Badajoz, Spain
Received 4 March 2004; received in revised form 24 May 2004; accepted 24 May 2004
Available online 28 July 2004
Abstract
A capillary zone electrophoresis (CZE) method was investigated for the determination of creatinine and creatine in human urine by using afused-silica capillary (75�m ID × 30 cm total length, 10 cm effective length). The separation was performed using an hydrodynamic injectiontime of 3 s (0.5 psi), a voltage of−15 kV and a 60 mM phosphoric buffer solution at pH 2.2 as electrolyte separation. Under these conditions,the analysis takes less than 2.7 min. A linear response over the 3.0–120 mg L−1 concentration range was investigated for compounds. Adilution of the sample (water:urine) was the only step necessary before the electrophoresis analysis. Detection limits of 0.7 and 1.3 mg L−1
for creatinine and creatine (S/N = 3) were obtained. The developed method is easy, rapid and sensitive and has been applied to determinecreatinine and creatine in different human urine samples.© 2004 Elsevier B.V. All rights reserved.
Keywords:CZE; Creatinine; Creatine; Human urine
1. Introduction
Diabetic nephropathy (DN) is a serious complication ofdiabetes mellitus[1]. However, when DN was diagnosed bythe classical methods, little could be done to prevent the pro-gressive downhill course to renal failure. It would be moresignificant, therefore, if DN could be detected at an evenearlier stage, so that intervention could reverse the process.Nonprotein nitrogen compounds, including creatinine andcreatine could serve as markers for renal function. Creatineis one of the good indicators of the glomerular filtration rateof the kidneys, and creatinine is the major inactive break-down product of creatine and has no function in the body,it is simply excreted in urine, which is why it is monitoredclinically as a marker of kidney function[2]. Creatine is syn-thesized in the body, and its main dietary source is red meat.
Creatine has recently achieved great popularity as anergogenic aid[3]. Creatine is converted to phosphocre-atine in muscle in a reversible reaction with adenosine
∗ Corresponding author. Fax:+34-926-295318.E-mail address:[email protected] (J. Rodrıguez).
triphosphate (ATP), facilitated by creatine kinase[4]. Whenmuscle contractions deplete the immediate supply of ATP,the phosphocreatine can rephosphorylate ADP to replenishthe supply of ATP. The study of the uptake of creatine asa result of creatine supplementation, a practice increasinglycommon among bodybuilders and athletes, has lead to aneed to measure urinary creatine concentration.
The structures of creatine and creatinine are shown inFig. 1.
Numerous methods for the assay of these markers havebeen reported, such as FIA methods[5,6], by using biosen-sors [7], high-performance liquid chromatography[8–11]and capillary electrophoresis. The first two types of methodsare limited due to the slow speed of analysis, the inability totest for multiple markers at one time, non-specificity for theanalyte of interest and the consumption of large amounts ofreagents and samples. On the other hand, the HPLC meth-ods have relatively long analysis times the consume largeamounts of solvents. However, capillary electrophoresistechniques, in many cases, have higher resolution, greaterefficiency and smaller sample volumes[1].
There are a few articles reporting the determination ofcreatine and creatinine. Some include separations from
0003-2670/$ – see front matter © 2004 Elsevier B.V. All rights reserved.doi:10.1016/j.aca.2004.05.058

54 J. Rodrıguez et al. / Analytica Chimica Acta 521 (2004) 53–59
NH
N
CH3
NH
O
Creatinine
O
OHNNH
NH2
CH3
Creatine
Fig. 1. Structures of creatinine and creatine.
other compounds. Yan et al.[12] employ sodium cholateat phosphate buffer pH 7.4 with voltage of 30 kV in thedetermination of urea, uric acid, creatine and creatinine.Burke et al. [13] make the determination by MEKC toobut using 150 mM SDS in a 30 mM phosphate buffer pH6, in this method creatinine and creatine were separated in6 min without interferences. A novel capillary electrophore-sis chip-based detection system is described by Wang andChatrathi et al.[14]. Capillary zone electrophoresis havealso been applied[1,15]. Kong et al. proposed a methodfor determining creatinine, creatine, urea and uric acid.The separation was achieved in 25 mM phosphate bufferpH 3.45; the separation takes less than 15 min and it wasapplied to urine and plasma samples.
In this paper, we propose a very rapid and easy methodusing capillary zone electrophoresis (CZE) to determine cre-atine and creatinine in urine without any treatment of the bi-ological sample. The separation take less than 2.5 min. Themethod is very short and sensitive enough to do this deter-mination in human urine without the use of surfactants.
2. Materials and methods
2.1. Materials
All solvents and reagents were of analytical-reagent gradeunless indicated otherwise. Creatinine and creatine were ob-tained from Sigma. Standard solutions were prepared withdeionized water (Milli-Q quality) and stored at 4◦C.
Diluted solutions of urine were prepared daily by dilut-ing freshly collected human urine with purified water. Onemilliliter of urine was 10 times diluted using purified waterin a calibrated flask.
Triethanolamine solution was obtained from Fluka, Bio-chemika.
Buffer solutions were prepared by dissolving an the ad-equate quantity of H3PO4 in deionized water and then ad-justing with NaOH solution to the required pH.
The set of separation vials was changed after six runs.
2.2. Apparatus and operating conditions
A Beckman P/ACE System MDQ (Fullerton, CA, USA)equipped with a diode-array detector was used. Beckmancapillary electrophoresis software controlled the system.Separation was carried out on a 30 cm long (10 cm to the de-tector, short way)× 75�m ID fused-silica capillary housedin a cartridge with a detector window 100�m × 800�m.The wavelength selected for the electropherograms was205 nm. The capillary was conditioned prior to its use byrising with 0.5 M NaOH for 20 min, water for 10 min andfinally phosphate buffer.
As the human urine samples contain creatinine and cre-atine, in each case the urine was analyzed after a dilution1:10 (v/v) with Milli-Q grade water.
The capillary was flushed between injections for 2 minwith NaOH 0.1 min and 4 min with electrolyte.
Electrophoretic separation was performed using as run-ning buffer a 60 mM phosphoric buffer solution at pH 2.2,an hydrodynamic injection time of 3 s (0.5 psi) and a volt-age of−15 kV (reversed polarity mode). Under the selectedconditions the current was around−108�A. The electro-pherograms were recorded at 205 nm. Duplicate injectionsof the solutions were performed and average-corrected peakareas (CPA) (area/migration time) were used for quantitativeanalysis. The data generated from the first two injections ofa sequence were not used on account of the necessary equi-libration of the system.
3. Results and discussion
The effect of pH of the running electrolyte had a signif-icant impact on the ionization of the acidic silanols of thecapillary wall and the electrophoretic mobility of the com-pounds studied. The buffer tested was phosphate (60 mM)and it was found that at pH 2 the migration times are shorterbut the creatinine peak is overlapped with an unknown sec-ond peak. On the other hand at pH 3 the electrophoretic mo-bility decreases and the migration time for creatinine was4.5 min. For this reason, after analyzing the effect of pH inthis interval range a pH 2.2 was selected.
At these low pH values our analytes are found before themigration time of EOF; this fact shows that creatinine andcreatine are cationic forms.
The effect of the composition of the separation electrolytewas studied by using the same pH value with the same ionicstrength (50 mM) but different media. Besides phosphatebuffer, an acetate and perchlorate buffer were tested but thehighest signals and best peak shapes were found using phos-phate buffer.
In order to try to obtain symmetric and sharper peaks,a phosphate buffer (60 mM) was prepared, the pH was ad-justed to 2.2 by addition of TEA (triethanolamine), and theseparation was made as previously by applying−15 kV us-ing a hydrodynamic injection of 3 s (0.5 psi), but no better

J. Rodrıguez et al. / Analytica Chimica Acta 521 (2004) 53–59 55
0.0 1.0 2.0 3
Migration Time(min)
0
20000
40000
AU
with TEA without TEA
Cre
atin
ine
Cre
atin
e
.0
Fig. 2. Influence of the addition of triethanolamine (TEA). Operating conditions: 60 mM of phosphate buffer,−15 kV of voltage, 3 s injection time (0.5 psi).
behavior by addition of TEA of the peaks of creatinine andcreatine was found, as it is possible to see inFig. 2.
The effect of the concentration of phosphate buffer solu-tion (20–70 mM) on the migration time of the compounds
AU
0.0 1.0 2.0 3.0
Migration Time (min)
0
10000
20000
30000
40000
60 m
M
40 m
M
20 m
M
Fig. 3. Influence of phosphate buffer concentration over a urine sample after the dilution process. Operating conditions: 60 mM of phosphate buffer,−15 kV of voltage, 3 s injection time (0.5 psi). Migration order: creatinine, unknown compound and creatine.
and the shape of the peaks was studied (Fig. 3). Whenthe concentration of buffer increases the migration time de-creases and the peaks become sharper. More than 60 mMwas not used due to the high current density (to 70 mM of

56 J. Rodrıguez et al. / Analytica Chimica Acta 521 (2004) 53–59
0.0 1.0 2.0 3.0
Migration Time (min)
0
20000
40000
60000
AU 3s
10s
___
- - -
1.8s
5s
___
- - -
Fig. 4. Influence of amount of sample injected (injection time and pressure apply) over a urine sample after the dilution process. Operating conditions:60 mM of phosphate buffer,−15 kV of voltage, 3 s injection time (0.5 psi). Migration order: creatinine, unknown compound and creatine.
phosphate buffer concentration correspond−124�A). Thebuffer concentration of 60 mM was thus considered to beoptimal.
Sample components from the diluted urine can becomeadsorbed onto the capillary surface and change the effectivecharge on the wall. So, in order to prevent this effect thecapillary is flushed between injections for 2 min with NaOH0.1 M and then 4 min with separation electrolyte in order toobtain an stable EOF (electroosmotic flow). Minor times ofthe washing step give worse electropherograms.
In order to decrease the detection limits in urine, the injec-tion time was varied between 0.6 and 10 s at 0.5 psi (1 psi=6894.76 Pa), and it was found that up to 0.5 psi and 3 sthe peak became higher, but if we continued increasing theinjected sample quantity the electrophoretic peaks becamedouble (as it is possible to observe inFig. 4).
Then it was selected as optimum an injection conditionof 0.5 psi during 3 s.
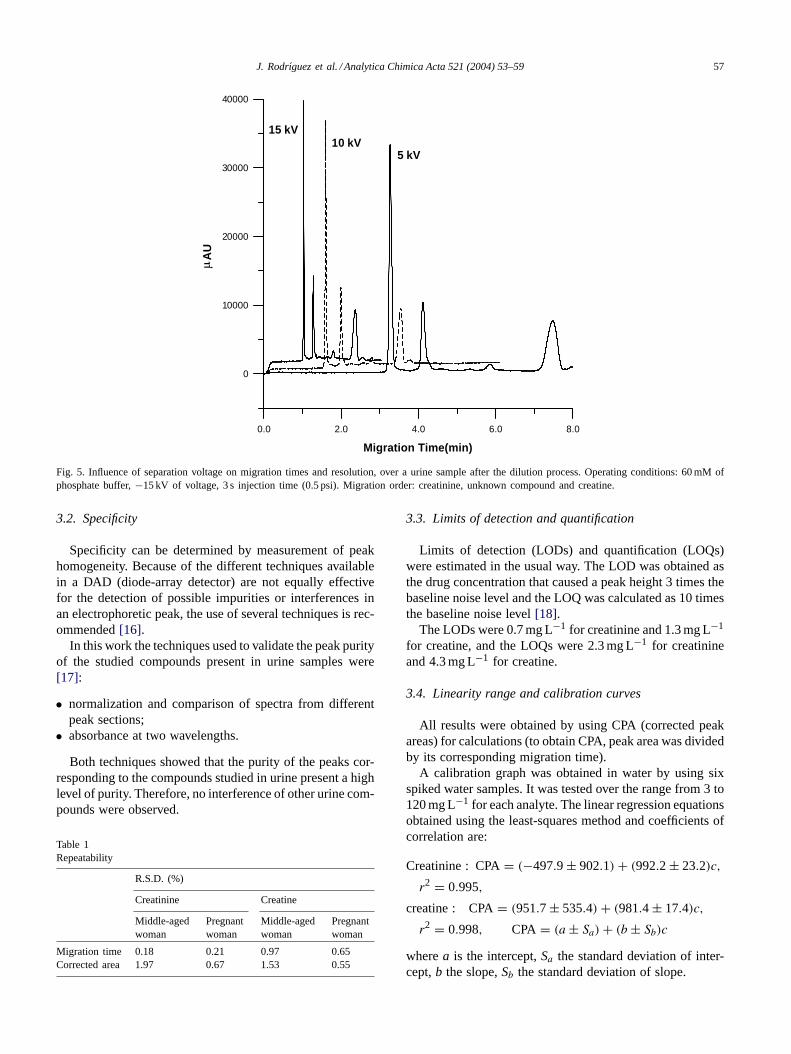
The effect of varying the voltage from−5 to −20 kVwas investigated (Fig. 5). A potential of−15 kV yielded thebest compromise in terms of run time, current generated andefficiency of separation. As consequence, this potential wasused in subsequent stages of method development.
Selected conditions. From the studies carried out before,the procedure summarized below was convenient to separatecreatinine and creatine in diluted urine samples:
• separation electrolyte: 60 mM phosphate buffer pH 2.2;• voltage: −15 kV (reverse polarity mode), current:
−108�A;
• capillary: fused-silica 30 cm long (10 cm to the detector,short way)× 75�m ID;
• injection: hydrodynamic, 3 s (0.5 psi) (reverse polaritymode);
• detection wavelength: 205 nm.
Under these conditions, the migration times were 1.0 and2.4 min for creatinine and creatine, respectively.
In all cases the urine samples were diluted with deionizedwater (a dilution of urine:water (1:10) was the only stepnecessary before the electrophoresis analysis).
3.1. Quantitative aspects
3.1.1. PrecisionTwo different urine samples (from a middle-aged woman
and a pregnant woman) were analyzed (eight repetition ofeach one). The precision of the proposed method is ex-pressed in terms of relative standard deviation (R.S.D.). Thereproducibility was evaluated between-day using the urinefrom the middle-aged woman. The results showed that therepeatability for every component in each day is satisfactory.In terms of reproducibility, the comparison of the standarddeviations with the Fisher test did not provide any signifi-cant difference between both days series, for a significancelevel of 0.05.
The repeatability of the migration times and correctedpeak area were good in both cases, with a %R.S.D. less than2% in all cases (Table 1).
J. Rodrıguez et al. / Analytica Chimica Acta 521 (2004) 53–59 57
0.0 2.0 4.0 6.0 8.0
Migration Time(min)
0
10000
20000
30000
40000
AU
15 kV10 kV
5 kV
Fig. 5. Influence of separation voltage on migration times and resolution, over a urine sample after the dilution process. Operating conditions: 60 mMofphosphate buffer,−15 kV of voltage, 3 s injection time (0.5 psi). Migration order: creatinine, unknown compound and creatine.
3.2. Specificity
Specificity can be determined by measurement of peakhomogeneity. Because of the different techniques availablein a DAD (diode-array detector) are not equally effectivefor the detection of possible impurities or interferences inan electrophoretic peak, the use of several techniques is rec-ommended[16].
In this work the techniques used to validate the peak purityof the studied compounds present in urine samples were[17]:
• normalization and comparison of spectra from differentpeak sections;
• absorbance at two wavelengths.
Both techniques showed that the purity of the peaks cor-responding to the compounds studied in urine present a highlevel of purity. Therefore, no interference of other urine com-pounds were observed.
Table 1Repeatability
R.S.D. (%)
Creatinine Creatine
Middle-agedwoman
Pregnantwoman
Middle-agedwoman
Pregnantwoman
Migration time 0.18 0.21 0.97 0.65Corrected area 1.97 0.67 1.53 0.55
3.3. Limits of detection and quantification
Limits of detection (LODs) and quantification (LOQs)were estimated in the usual way. The LOD was obtained asthe drug concentration that caused a peak height 3 times thebaseline noise level and the LOQ was calculated as 10 timesthe baseline noise level[18].
The LODs were 0.7 mg L−1 for creatinine and 1.3 mg L−1
for creatine, and the LOQs were 2.3 mg L−1 for creatinineand 4.3 mg L−1 for creatine.
3.4. Linearity range and calibration curves
All results were obtained by using CPA (corrected peakareas) for calculations (to obtain CPA, peak area was dividedby its corresponding migration time).
A calibration graph was obtained in water by using sixspiked water samples. It was tested over the range from 3 to120 mg L−1 for each analyte. The linear regression equationsobtained using the least-squares method and coefficients ofcorrelation are:
Creatinine : CPA= (−497.9 ± 902.1) + (992.2 ± 23.2)c,
r2 = 0.995,
creatine : CPA= (951.7 ± 535.4) + (981.4 ± 17.4)c,
r2 = 0.998, CPA = (a ± Sa) + (b ± Sb)c
wherea is the intercept,Sa the standard deviation of inter-cept,b the slope,Sb the standard deviation of slope.

58 J. Rodrıguez et al. / Analytica Chimica Acta 521 (2004) 53–59
AU
0.0 1.0 2.0 3.0
Migration Time (min)
0
20000
40000
60000Creatinine
Creatine
Fig. 6. CZE electropherogram of creatinine and creatine in urine sample with the final selected conditions. Migration order: creatinine, unknown compoundand creatine.
After that, and with the object to know if it is possibleto determine the concentration of creatinine and creatinein an urine sample by using directly this calibration graphobtaining with the water samples spiked or if it is necessaryto apply the standard addition method to each urine sample,a mixture of several human urine samples was analyzed bystandard addition.
The slopes of both graphs (aqueous medium and stan-dard addition over a diluted urine samples) were compared.First of all the variances of both data groups were comparedand it was found no significant differences between them.Then it was possible to compare the slopes and it was foundno significant differences between the slopes of both lineargraphs (aqueous and urine medium). A significance level of0.05 was used. Thus it is possible to determine creatinineand creatine in human urine sample by applying directly thecalibration graph in water.
3.5. Applications
In order to apply the proposed method, six different typesof urine samples (middle aged woman, middle aged man,sportive young man, boy, girl and pregnant woman) were an-alyzed. Two samples of each type of urine were analysed induplicate. The concentration of creatinine and creatine weredetermine after dilution with water and the values obtainedfor each original urine samples are presented inTable 2.
In order to compare the obtained results by the use ofthe calibration graph, the addition standard method was alsoapplied over three of the urine samples analyzed, the resultsobtained have totally satisfactory.
An electropherogram of an urine sample (from the middleaged women) is presented inFig. 6.
Urine creatinine levels can be used as a screening test toevaluate kidney function. Normal values are highly depen-dent on the age and lean body mass of the person the urine isbeing collected from. Urine creatinine values may thereforebe quite variable and can range from 300 to 1300 mg L−1,as can be seen inTable 2except to the sportive young man,
Table 2Determination of creatinine and creatine in different urine samples
Type of urine sample Concentration in originalurine sample (mg L−1)
Creatinine Creatine
Girl 896 397Boy 1179 392Sportive young man
(with urea problems)a2042 Not detected
Middle aged woman 614 890Middle aged man 554 75Pregnant woman 1050 406
a For this sample, a dilution factor of 50 was necessary (1.0 mL ofurine was 50 times diluted with purified water).

J. Rodrıguez et al. / Analytica Chimica Acta 521 (2004) 53–59 59
due to the exercise may caused increased creatinine clear-ance and also his high urea level. (For this analysis a 25 mLdilution factor was applied.) Also the glomerular filtrationrate is substantially increased in pregnant women (see preg-nant woman in the mentioned table). Creatine levels are ofthe same order of magnitude as creatinine levels only whensubjects have recently ingested creatine, while somewhat el-evated urinary creatine concentrations in non-supplementingsubjects can be an indication of a degenerative disease ofthe muscle (see the high level of creatine in middle agedwoman in the table, may be due to her main dietary sourceis red meat).
4. Conclusions
In this work, a fast and direct capillary zone electrophore-sis method for the determination of creatinine and creatinein human urine sample is described. The proposed method isfaster than those previously proposed. The parameters cal-culated for this method are satisfactory.
Acknowledgements
The authors are grateful to the DGES of the Minis-terio de Educación y Ciencia (project BQU 2001-1190)and to the Junta de Extremadura for the financialsupport.
References
[1] Y. Kong, N. Zheng, Z. Zhang, R. Gao, J. Chromatogr. A 987 (2003)477–483.
[2] A.D. Baines, Disorders of the kidney and urinary tract, in: A.G.Gornall (Ed.), Applied Biochemistry of Clinical Disorders, 2nd ed.,JB Lippincott, Philadelphia, PA, 1986, pp. 139–171.
[3] W.J. Kramer, J.S. Volek, Clin. Sports Med. 18 (1999) 651.[4] G. Zubay, Biochemistry, Wm.C. Brown, Dubuque, IA, 1998, p. 39.[5] T. Yao, K. Kotegawa, Anal. Chim. Acta 462 (2) (2002) 283–291.[6] G. Del Campo, A. Irastorza, J. Alfonso-Casado, Fresen. J. Anal.
Chem. 352 (6) (1995) 557–561.[7] R.J. Stefan, R.G. Bokretsion, J.F. Van-Staden, H.Y. Aboul-Enein,
Talanta 60 (6) (2003) 1223–1228.[8] T. Seki, Y. Orita, K. Yamaji, A. Shinoda, J. Pharm. Biomed. Anal.
15 (1997) 1621–1626.[9] P. Ellerbe, A. Cohen, M.J. Weleh, V.E. White, Anal. Chem. 62 (1990)
2173–2177.[10] G. Werner, V. Schneider, J. Emmet, J. Chromatogr. 525 (1990) 265–
275.[11] S.D. Yang, J.M. Xu, L. Yang, Y.N. Ma, F. Bai, J. Liq. Chromatogr.
12 (1989) 1791–1807.[12] S.L. Yan, P.Z. Lin, M.W. Hsiao, J. Chromatogr. Sci. 37 (2) (1999)
45–50.[13] D.G. Burke, P.G. MacLean, R.A. Walker, P.J. Dewar, T.
Smith-Palmer, J. Chromatogr. B 732 (1999) 479–485.[14] J. Wang, M.P. Chatrathi, Anal. Chem. 75 (3) (2003) 525–529.[15] E.A. Clark, J.C. Fanguy, C.S. Henry, J. Pharm. Biomed. Anal. 25
(2001) 795–801.[16] H. Farbe, A. LeBris, M.D.J. Blanchin, J. Chromatogr. A 697 (1–2)
(1995) 81–88.[17] L. Huber, Applications of Diode-array Experience, vol. 12,
Hewlett-Packard Publication, 1989, p. 5953[18] K.D. Altria, Chromatographia 35 (3–4) (1993) 177–182.