vernon county community food assessment - veda: vernon economic
TRANSCRIPT
1 | P a g e
VERNON COUNTYVERNON COUNTYVERNON COUNTYVERNON COUNTY, WISCONSIN, WISCONSIN, WISCONSIN, WISCONSIN COMMUNITY FOOD ASSESSMENTCOMMUNITY FOOD ASSESSMENTCOMMUNITY FOOD ASSESSMENTCOMMUNITY FOOD ASSESSMENT
LINKING FARMERS AND LINKING FARMERS AND LINKING FARMERS AND LINKING FARMERS AND
COMMUNITY FOR SUSTAINABILITYCOMMUNITY FOR SUSTAINABILITYCOMMUNITY FOR SUSTAINABILITYCOMMUNITY FOR SUSTAINABILITY
FOOD & FARM INITIATIVEFOOD & FARM INITIATIVEFOOD & FARM INITIATIVEFOOD & FARM INITIATIVE
2 | P a g e
This report was an 18-month process from start to finish that would not have been possible
without the dedicated volunteer efforts of the Valley Stewardship Network Food & Farm
Initiative Steering Committee Members. The researchers and authors of this report include:
Jessica Luhning, VSN Projects Coordinator
Sara Martinez
Dani Lind
Becky Comeau
Lori Harms
Suzie Howe
Bob Goonin

3 | P a g e
TABLE OF CONTENTSTABLE OF CONTENTSTABLE OF CONTENTSTABLE OF CONTENTS
I. Introduction…………………………………………………………………………………………................. 5 a. Background b. Assessment Goals c. Partner Organizations
i. Steering Committee ii. Advisory Commitee
II. A Profile of Vernon County............................................................................................ 10
a. Summary b. Environmental, Agricultural & Cultural Perspective c. Socio-Economic Demographics d. Poverty Profile
III. A Regional Profile of Agriculture................................................................................. 24
a. History of Agriculture i. Overview
1. 1884 “History of Vernon County, Wisconsin” 2. 1981 Vernon County Farmland Preservation Plan
ii. Coon Creek Watershed iii. Cheesemaking
b. Agriculture Today i. 2007 Census of Agriculture, Vernon County Profile ii. Ken Meter Rural Economic Study
c. A Profile of Agriculture Entrepreneurship i. Organic Valley ii. Westby Creamery iii. Keewaydin Farm iv. Harmony Valley Farm v. Amish Community Farm
IV. A Profile of Food Resources......................................................................................... 63
a. Farmers Markets b. Community Gardens c. Charitable Food Programs
i. Senior Meal Sites ii. Food Pantries iii. Food Stamp/Foodshare iv. WIC
d. Grocery & Retail Food Outlets e. Restaurants f. Community Supported Agriculture
V. A Profile of the Local School Food System................................................................. 72
a. Food Services

4 | P a g e
i. School Meal Programs b. Vernon County Farm to School Program
VI. Vernon County Community Food Assessment Conclusions.................................. 75 APPENDIX A: Basic Steps of a Community Food Assessment.................................... 83 APPENDIX B: Community Members Who Assisted With Initial CFA Project Planning and Development………………………………………………………................................ 85 APPENDIX C: Community Food Assessment Methodology....................................... 86 ATTACHMENTS Farmer and Vendor Surveys – A Contribution of the Department of Rural Sociology, UW-Madison; Crawford County Extension and Valley Stewardship Network
1. An Evaluation of Food & Culture Tourism: Food Vendor Perspectives on Local Food
Networks in Southwestern Wisconsin 2. An Evaluation of Food & Culture Tourism: Fresh Food Production for Local Food
Networks in Southwestern Wisconsin

5 | P a g e
CHAPTER ICHAPTER ICHAPTER ICHAPTER I
INTRODUCTIONINTRODUCTIONINTRODUCTIONINTRODUCTION
I. BACKGROUND
II. ASSESSMENT GOALS
III. LEAD ORGANIZATION
IV. PARTNER ORGANIZATIONS
a. STEERING COMMITTEE
b.ADVISORY COMMITTEE
1. BACKGROUND1. BACKGROUND1. BACKGROUND1. BACKGROUND
In the fall of 2007, the Valley Stewardship
Network formed the Food & Farm Initiative
to respond to local food security issues. The
VSN Food & Farm Initiative has the potential
to: provide healthful, nutritious food to local
schools, institutions, and low-income families;
facilitate the growth of viable, community-
based food businesses; link consumers with
local farmers; encourage and grant incentives
to those practicing sustainable farming methods; and most notably to build shared
understanding and trust among local food and farm stakeholders.
The mission of the Food & Farm Initiative (FFI) is to encourage the development of a
sustainable, equitable local food system by:
• Engaging, educating and mobilizing a broad network of county residents;
• Improving access to healthy, locally produced foods for all members of the
community, especially the low-income population;
• Strengthening the economic viability of regional agriculture; and
• Addressing market barriers for local producers.
To date, the FFI has been largely funded by the Organic Valley Family of Farms Employee
and Farmer Profit Sharing Program and donations received from VSN members. The
Vernon County CFA is a comprehensive, community-based planning project involving a
diverse group of food security stakeholders. For the 18 month duration of Vernon County’s
Community Food Assessment, Steering Committee members have been engaged in a process
of simultaneously examining our local food system and actively participating in food-
security related projects.
Community Food Security: “A food system in
which all community residents are able to obtain a
safe, culturally appropriate, nutritionally-sound diet
through an economically and environmentally
sustainable food system that promotes community
self-reliance and social justice.”
World Hunger Year World Hunger Year World Hunger Year World Hunger Year –––– Food Security Learning Food Security Learning Food Security Learning Food Security Learning CenterCenterCenterCenter
6 | P a g e
II. ASSESSMENT GOALSII. ASSESSMENT GOALSII. ASSESSMENT GOALSII. ASSESSMENT GOALS
The purpose of this community food assessment -
Linking Farmers and Community for Sustainability – is
to evaluate local food security assets,
opportunities, and needs and to identify strategies
relating to community food security in Vernon
County. The CFA will serve as a foundation for
stakeholders to identify programs, projects,
policies and partnerships to meet the aforementioned goals of a sustainable food and farm
system. See Appendix A for an outline of the basic steps of a community food assessment.
Goals of the Community FGoals of the Community FGoals of the Community FGoals of the Community Food Assessment include:ood Assessment include:ood Assessment include:ood Assessment include:
• Identify resources and needs regarding a) the local food system, b) underserved
populations, and c) key stakeholders;
• Strengthen links between existing food system groups;
• Promote community learning and participation through the community food
assessment; and
• Use the results of the community food assessment to plan effective Community Food
Projects.1
II.II.II.II. LEAD ORGANIZATIONLEAD ORGANIZATIONLEAD ORGANIZATIONLEAD ORGANIZATION
The Valley Stewardship Network (VSN) is a community-based, not-for-profit 501(c)3
organization that promotes stewardship and connects communities throughout the Greater
Kickapoo Valley Region in southwest Wisconsin. The primary mission of the Valley
Stewardship Network is to promote a balance between a healthy environment and strong
communities. VSN works to encourage positive land use patterns, sustainable agriculture,
community food security, water quality monitoring and communication and coordination
among various agency and nonprofit organizations throughout the watershed.
1 In an effort to not “reinvent the wheel”, this community food assessment’s goals where greatly influenced by a number of other community food assessments, especially those outlined in the Growing Partners of Southwest Colorado Community Food Assessment. http://www.sustainableswcolorado.org/cfa.htm
Community Food Assessment: “A
collaborative process that examines a
broad range of food-related issues
and resources in order to improve the
local food system.”
Community Food Security CoalitionCommunity Food Security CoalitionCommunity Food Security CoalitionCommunity Food Security Coalition
Community Food System: “A sustainable community food system is a collaborative
network that integrates sustainable food production, processing, distribution,
consumption and waste management in order to enhance the environmental, economic
and social health of a particular place.”
UC Sustainable Agriculture Research and Education ProgramUC Sustainable Agriculture Research and Education ProgramUC Sustainable Agriculture Research and Education ProgramUC Sustainable Agriculture Research and Education Program

7 | P a g e
III. PARTNER ORGANIZATIONSIII. PARTNER ORGANIZATIONSIII. PARTNER ORGANIZATIONSIII. PARTNER ORGANIZATIONS
Key Collaborators:Key Collaborators:Key Collaborators:Key Collaborators:
Viroqua Food Co-op (VFC)
VFC is centrally located and provides Vernon County’s residents with organic and locally
produced food items. VFC works to promote the long-term health of individuals and the
environment. VFC strives to be an active partner in the Vernon County community by
recognizing that practicing good business citizenship supports the mission of the Co-op.
VFC has played a lead role in ensuring food security in times of crisis. For example, VFC
contributed volunteers and substantial food donations to the August 2007 and June 2008
Flood Relief, Viola Tornado Relief, and Hurricane Katrina Disaster Relief. VFC staff
members are actively involved in the VSN Food & Farm Initiative and serve on the advisory
and steering committees.
Vernon Economic Development Association, Inc. (VEDA)
VEDA is a non-profit 501(c) 3 organization, formed in January of 2006 to serve a region
whose economy and culture are largely agricultural. VEDA’s mission is to create economic
wealth and prosperity while preserving our rural Vernon County lifestyle. The
organization’s strategic plan to build a stronger economy includes specific objectives to:
support the development of new businesses and foster the retention and expansion of
existing businesses; and to coordinate the efforts of local, county, state, and regional
organizations towards common goals. The director serves on the advisory committee for FFI.
She also participates in regional planning efforts to provide technical assistance to support
businesses that provide or market local food. In addition, VEDA helps coordinate tourism
efforts to promote local food and agricultural based activities or events.
Crossroads Resource Center (CRC)
CRC has worked on community capacity building efforts since 1972, primarily in low-income
and rural communities. CRC's role is to create tools that community groups can use to attain
greater self-determination. The organization focuses now on farm and food systems,
sustainability, and systems evaluation. CRC also has prior experience in inner-city business
development. Ken Meter is the president of CRC.
• Ken Meter’s relevant experience:
Creator of "Finding Food in Farm Country" studies, which have been adopted in 38
regions in 18 states, have transformed the discussion of farm and food economics, and
launched a national discussion on local foods as economic development. Ken has
made over 150 presentations nationally on local food systems, including 2 keynote
presentations for Rep. Collin Peterson, chair of U.S. House Agriculture Committee,

8 | P a g e
keynote for the Upper Midwest Organic Growers Conference, and food summits in
Hawaii, Virginia, Washington state, Oregon, Kansas, and many others.
In addition to our key collaborators, an nine member CFA Project advisory committee and a
seven member CFA Project steering committee were formed to assist with project design,
planning and implementation. The primary role of the steering committee was to guide the
efforts of the CFA project. This entails determining assessment purposes and goals, planning
and conducting research, evaluating findings and developing recommendations for follow-up
actions as well as incorporating community input. (Appendix B includes a list of those
community members present when the CFA mission was developed.)
TABLE I. STEERING COMMITTEE
NameNameNameName Organization/AffiliationOrganization/AffiliationOrganization/AffiliationOrganization/Affiliation
Sara Martinez Family & Children’s Center
Dani Lind Viroqua Food Coop
Therese Laurdan Weston A. Price Foundation
Home Green Home
Becky Comeau Community Member
Small Produce Farmer
Bob Goonin Organic Valley Family of Farms
Small Produce Farmer
Lori Harms Family Farm Defenders
Suzie Howe Family & Children’s Center
Like the steering committee, members of the advisory committee represent various
stakeholder groups of the local food system. Advisors have offered their support and input
when needed as we work through the community food assessment process and beyond.
TABLE II. ADVISORY COMMITTEE
NameNameNameName Organization/AffiliationOrganization/AffiliationOrganization/AffiliationOrganization/Affiliation
Kelly Jacobs Vernon County Land & Water Conservation
Department – County Conservationist
Tim Rehbein UW-Agriculture Extension Agent for Vernon
County
Dave McClurg Vernon County Farm Bureau President
Local Crop & Beef Farmer
Paul Peterson Farm Bureau District Representative
Darin Von Ruden Wisconsin Farmers Union District Representative
Organic Dairy Farmer
Marilyn Volden Viroqua Area Schools Food Service Director
Organic Dairy Farmer
Lynn Chakoian Vernon County Planning Commission Chair

9 | P a g e
Sue Noble Vernon Economic Development Association
Executive Director
Jan Rasikas Viroqua Food Coop General Manager

10 | P a g e
CHAPTER IICHAPTER IICHAPTER IICHAPTER II
A PROFILE OF VERNON COUNTYA PROFILE OF VERNON COUNTYA PROFILE OF VERNON COUNTYA PROFILE OF VERNON COUNTY
1. SUMMARY
2. ENVIRONMENTAL, AGRICULTURAL & CULTURAL PERSPECTIVE
3. SOCIO-ECONOMIC DEMOGRAPHICS
4. POVERTY PROFILE
I. SUMMARYI. SUMMARYI. SUMMARYI. SUMMARY
Vernon County is located in the heart of the
Driftless Area in southwest Wisconsin. Vernon
County is known for its diverse landscape of
lush valleys, forested hills and cold-water
streams. The climate and fertile soils of
southwest Wisconsin have historically yielded
and embraced a variety of food crops and
livestock breeds. Simply stated, farming and
food production has been a major economic
mainstay and way of life for the people of the
Driftless Area since the 1840’s when European
settlers abandoned the mining of lead and put the plow to work instead.
Vernon County has three major communities, the City of Viroqua (county seat, population
4,3352), the City of Westby and the City of Hillsboro. In addition, there are nine villages
(Chaseburg, Coon Valley, De Soto, Genoa, La Farge, Ontario, Readstown, Stoddard and
Viola) and seven unincorporated communities (Bloomingdale, Esofea, Liberty Pole,
Redmound, Retreat, Romance and Victory).
PopulationPopulationPopulationPopulation
In 2007, Vernon County’s population was 29,5303. According to the 2000 Census the median
age was 39.1 years. Of the total population, males comprised 49% and females comprised 51%.
The average household size was 2.55. Between 1960 and 2000, Vernon County averaged 4.75%
annual growth, with most of the growth occurring between 1990 and 2000.4
2 US Census QuickFacts 2000; Vernon County, Wisconsin 3 Demographic Services Center, Wisconsin Department of Administration, October, 2005
4 Mississippi Region Planning Commission 2007 Vernon County Profile

11 | P a g e
LandLandLandLand
Vernon County encompasses 795 square miles (roughly 523,000 acres) and is bisected by the
beautiful Kickapoo River Valley. Vernon County land use statistics are as follows5:
• 95.2% Private Lands (Residential, Commercial, Undeveloped, etc.)
o 55.56% Agricultural Lands
o 32.15% Forest Lands (Private & Public combined)
o 10.49% Other Private Lands
• 2.83% State Lands
• .67% Federal Lands
• .49% County Lands
• .81% Other Public Lands
County OverviewCounty OverviewCounty OverviewCounty Overview
The following text was taken from the Vernon County Comprehensive Planning Committee’s
Summary of Themes from the Summer 2008 County-wide Listening Sessions.
Regionalism in Vernon County is built into the landscape: steep topography, rivers, soil
resources, cities and villages. These barriers and attractions are often reinforced by
transportation infrastructure that keeps areas isolated, or pulls citizens to other cities and
counties. As a result we have a very diverse base of world-views and social/cultural groups
that need to be understood as we plan for the whole county.
Mississippi River
Vernon County’s western edge is the Mississippi River Valley that offers a rich mixture of
natural beauty, wildlife and plants from the bluffs down to the wildlife refuge and fish
5 2008 Vernon County Tax Assessment Roll

12 | P a g e
hatchery. Highway 35 facilitates travel north (La Crosse) and south (Prairie du Chien) that
provide the major centers for jobs and commerce.
Prime Agricultural Lands
Inland from the Mississippi River is a region of prime agricultural soil (50% is Class I or II
by NRCS definitions.) This area stretches east from the bluffs to the US Highway 14
corridor. The prime agriculture designation forms a patchwork because of our steep slopes,
and this land is productive beyond the mapped boundaries if there is good stewardship and
use of conservation practices. Viroqua provides a hub of commercial activity, but often
mailing address location or school district identity forms the basis for cultural affiliations
that subdivide this large region. These rural communities tend to be tightly knit—neighbors
help each other, people regularly gather at a local bar or restaurant, and there is a pride in
being self-sufficient at the very local level. Protection of land for agricultural use was a
strong message from this group.
Cities
The Cities of Viroqua and Westby form another distinct region in the county. Residents of
these more centrally located cities expressed concern over natural resource protection. The
vast majority wanted land-use controls and zoning county-wide. This attitude provides a
contrast with the rural areas of the county that were more divided on this issue. Non-city
residents often wanted the effects of land use regulation/zoning, but weren’t uncomfortable
with the implementation of regulation that would make it possible.
Kickapoo Valley
Further east is the Kickapoo Valley region of the
county. This unique culture and landscape results from
the physical characteristics of the river valley (trout
fishing, scenic beauty, historic flooding) and the
history that resulted in the development of the
Kickapoo Reserve. The valley was represented in a
single listening session and found a focus on protection
of area natural resources rather than a concern about
preservation of agriculture. Residents discussed eco-
tourism opportunities – in particular a specialized agri-
tourism that allows visitors to experience farm work
and rural scenery on small farms. This is an area of the
county with plentiful Amish farms that could be
regarded as agri-tourism in place.
Vernon County

13 | P a g e
Hillsboro region
The eastern part of the county is the rural Hillsboro and City of Hillsboro region that, being
on the edge of the county, orients to the Interstate Highway to the north and US Highway
80 south to Richland Center. This directs the focus of commerce/jobs away from Vernon
County and to adjoining counties. Residents expressed interest in redirecting that out-
migration and attracting new residents to the Hillsboro area. In addition, residents expresses
the need to cultivating a diverse economy (manufacturing, tourism and agriculture) that
would provide family-supporting jobs so the youth can stay and new people would relocate
locally.
II. ENVIRONMENTAL, AGRICUII. ENVIRONMENTAL, AGRICUII. ENVIRONMENTAL, AGRICUII. ENVIRONMENTAL, AGRICULTURAL & CULTURAL PERSPECTIVELTURAL & CULTURAL PERSPECTIVELTURAL & CULTURAL PERSPECTIVELTURAL & CULTURAL PERSPECTIVE
The following text was taken from the Trout Unlimited 1999 Kickapoo Watershed Conservation Plan.
Chapter 1: A Place Worth Protecting: A Brief History of the Kickapoo, A Land and People Chapter 1: A Place Worth Protecting: A Brief History of the Kickapoo, A Land and People Chapter 1: A Place Worth Protecting: A Brief History of the Kickapoo, A Land and People Chapter 1: A Place Worth Protecting: A Brief History of the Kickapoo, A Land and People
Shaped by a RiverShaped by a RiverShaped by a RiverShaped by a River
Rivers connect people and places across a landscape. They also connect people in those places
over time. People have always built communities and farmed near rivers to sustain
themselves on the life-giving water, to move from here to there, for better or worse to
remove waste and harness its power, and to play and refresh the soul. Rivers help shape the
landscape as well as the people and communities that live near them and, in turn, those who
live there shape and change the rivers and landscape.
Native People in the KickapooNative People in the KickapooNative People in the KickapooNative People in the Kickapoo
We know that people have been coming to the Kickapoo for well over 12,000 years. Paleo-
Indians arrived first, probably to hunt mastodon, wooly mammoth and caribou that were
plentiful near the edge of the retreating glaciers. The Kickapoo River Watershed nestled in
the heart of the Coulee Region of southwest Wisconsin, was spared the massive leveling
force of the most recent set of glaciers about 10,000 years ago. Unlike most of Wisconsin
which has thousands of lakes scattered across the landscape – footprints of the retreating ice
floes, the Coulee region has hundreds of miles of streams that flow down the steep hills into
the numerous valleys.
As the climate changed and the mammoth and mastodon became extinct, the early
inhabitants adapted to a hunting and gathering lifestyle in a period known as the Archaic.
They would gather in large groups along the Wisconsin and Mississippi rivers during the
summers and then disperse again in small bands during the winter where they sought refuge
in rock shelters that dot the Kickapoo landscape. The appearance of the landscape is
determined in large part by its geology. Several strata of sandstone and dolomite limestone
formed by ancient oceans underlie the 725 square mile Kickapoo watershed. Some of these
14 | P a g e
layers have fractures and caves, or form the overhanging cliffs, where the Archaic people
found shelter.
There is evidence of early forms of agriculture, pottery making and burial of the dead in
mounds during the Early Woodland Phase which began about 2500 years ago. Southern
Wisconsin eventually became the center of the Effigy Mound Culture where conical, linear,
or animal shaped mounds were built to bury the dead. The upper Kickapoo valley is the
northernmost extent of this area. One of the largest effigy mounds ever discovered in the
state was found near present day Viola. The eagle shaped mound stretches 450 feet from
wing tip to wing tip. Many mounds have since been destroyed but a few remain as
reminders of those who came before, helped shape and were shaped by the Kickapoo. The
Oneota came over 1000 years ago. They practiced agriculture and were more sedentary than
the groups that preceded them. By 1635, John Nicolet found bands of Sioux living east of the
Mississippi. These mobile groups traded with the Winnebago who lived farther east. Today
the Winnebago are better known as the Ho-Chunk.
The Kickapoo felt the effects of the most recent newcomers, European settlers, even before
they arrived in the area. Many Algonquin speaking tribes migrated to Wisconsin after being
displaced from their territories in the East. Pressure came from both settlers and the Iroquois
confederacy. During the 1700s many of these groups had to relocate frequently. Always on
the move, the Kickapoo tribe was first noted by French trappers in 1728 living near the
confluence of the Wisconsin and Mississippi rivers. The name Kickapoo, which means “he
who goes here and then there,” was appropriate for the long path of both the highly mobile
tribe and the sinuous river. The Kickapoo, Miami, and Mascouten people explored and
hunted for fur and game in the Kickapoo area. The Algonquin tribes continued to be
displaced and eventually left the area. By 1810 the Ho-Chunk occupied the area from Lake
Winnebago to Prairie du Chien, but eventually lost most of their tribal lands in a series of
treaties, the last signed in 1837. They traded meat, corn, and sugar with the early settlers and
there are settler accounts of a village along the West Fork and mainstem of the Kickapoo.
Many cultural and historical sites remain along the Kickapoo River to document the heritage
of the Ho-Chunk.
Europeans Arrive in the RegionEuropeans Arrive in the RegionEuropeans Arrive in the RegionEuropeans Arrive in the Region
It would be impossible to say with any certainty how the Kickapoo River and surrounding
landscape appeared 12,000 years ago, or even 1,000 years ago. We do know, however, how it
looked when Europeans first arrived. The first Europeans who came to this area were French
fur trappers in the 1700s who searched the rivers and streams in search of beaver and other
animals. The French dubbed this area the Coulee region from the French word “couler”
which means to flow – an obvious reference to the hundreds of miles of streams found here.
In the time after the fur trade, the area remained largely uninhabited by Europeans until the

15 | P a g e
1830s, except for a few criminals seeking refuge in the remote valleys. J.T. Sterling began his
exploration of the area in 1832 and saw great potential for the land. He documented Native
American villages, rich forests, prairies, and streams. Oak savannas with some prairies
dominated the western part of the watershed and pine forest and sugar maple, basswood and
white ash were predominant on the eastern side. The river acted as a firebreak, stopping the
fires that maintained the savanna. The tributary streams that feed the Kickapoo were
narrow, deep, extremely stable, and full of brook trout. Rainwater infiltrated the soil almost
completely, so severe flooding was extremely rare.
The forests drew the first European settlers to the area. The Kickapoo River was used to
transport the logs and power the sawmills. Gays Mills, the first settlement north of
Wauzeka, was founded in 1840 and located near the sawmill. Most of the other communities
founded around that time, including Ontario, LaFarge, and Soldiers Grove, were also located
near mills. By the late 1800s, so great was the influx of people who hoped to harvest the rich
timber resources the period was called “The Little Klondike,” after the Alaskan gold rush of
the same era. The settlers outlasted the virgin timber, which was almost completely gone by
the 1920s, and they began to farm the cleared land.
European Settlers and their AgricultureEuropean Settlers and their AgricultureEuropean Settlers and their AgricultureEuropean Settlers and their Agriculture
Many settlers came from northern Europe where they grew wheat, so it became the first
major crop grown in the region, although the soils are not particularly well suited for wheat.
Furthermore, the traditional practice of plowing straight up and downs hills proved
devastating to the land in this area. Southwest Wisconsin gets over 30 inches of rain a year,
much of it falling during intense spring and summer storms. That is more than 3 times the
normal rainfall on wheat fields in Scandinavia. Once the protective sod layer was broken on
cropped land the ground was susceptible to erosion from rain and wind. Indeed, the erosion
from the fields was extreme and wheat farming rapidly gave way to dairy farms. Dairy
farms dominated the landscape and by 1939 over 98% of the land in the watershed was grazed
or cropped. Early cropping practices continued to be plagued by severe soil erosion. Scientists
estimate that enough soil washed from the ridge tops into the valleys of the Kickapoo
watershed to cover an area over 52 square miles with more than a foot of soil. Heavy grazing
compacted the soils, particularly on the hillsides, so when rain fell it could not infiltrate the
ground and slowly release back into the streams. Aldo Leopold described the water moving
off the land “like rain off a tin roof.”
The radical change on the landscape from prairie and forest to all crop and grazing land
brought some dire unintended consequences. Most wildlife habitat was gone. Rainwater no
longer infiltrated the ground as it fell and flooding became a serious problem. During the
spring snowmelt and summer storms large amounts of water would rush down the steep
valleys. The flooding would create massive gullies, carry away tons of rich topsoil off of

16 | P a g e
cropland, and frequently wreck homes and farms in its path. The towns along the river,
including La Farge, Soldiers Grove, and Gays Mills were repeatedly flooded out in a series of
major floods in 1907, 1912, 1917, 1935, 1951, 1956, 1961, 1965, 1978, 1992, 2007, 2008.
The flooding and erosion also took its toll on the area streams. Massive amounts of sediment
would accumulate in the streams raising the level of the streambeds. Much more of the water
feeding the streams came from rain running off the landscape, rather than from cold springs.
Many springs and small streams dried up. Larger streams grew warmer, wider, and slower as
they tried to cut a new course down through the tons of fine sediment. During major flood
events, the streams would sometimes change course cutting new swaths through farm fields.
Most of the streams became completely unsuitable for the brook trout native to the area, as
well as for the brown trout that had been introduced by Europeans. They were replaced in
most areas by carp, suckers, catfish, bullheads, and few bass. In 1958, a state fisheries biologist
wrote of the fishery in the Kickapoo region:
The … region’s streams are in extremely poor shape because of
watershed management problems. And it is probable that the habitat
conditions will continue to be degraded. Because of this fact, it is also
likely that trout fishing may practically disappear in the future.
A Healing LandscapeA Healing LandscapeA Healing LandscapeA Healing Landscape
Early land use practices took their toll on the landscape, streams, and livelihoods of local
people. Fortunately, the 1930s saw the beginning of a proud conservation legacy that
continues today. The first Soil Conservation Service (SCS) watershed project started in 1933
in Coon Valley just over the ridge. The SCS with assistance from University of Wisconsin
and many Civilian Conservation Corps crews helped landowners install contour strips on
cropland, stabilize eroding gullies and stream banks, and foster reforestation on steep slopes.
Those practices not only stemmed the severe soil loss, but also created the characteristic
appearance of the landscape that is still evident today - forested slopes, contour strips on the
ridges, and pastures in the valleys. Local and state agencies, landowners, and sports clubs
continue the tradition of implementing soil conservation practices.
The hills make for a breathtaking landscape, but they also limit the amount of productive
land on farms. Farms in the Kickapoo Watershed are smaller than farms in the rest of the
state. In Vernon County, for instance, the average farm size is 177 acres compared to the state
average of 228 acres.6 Farming has never been an easy living in this region. During the 1960s,
agriculture in the region fell on harder times and it was difficult to compete with the larger,
more productive farms to the south and west in Wisconsin. By the late 1970s, after years of
6 Acreage numbers are representative of 1999.

17 | P a g e
decline, a significant number of small farms went out of business and much of the land
became reforested, particularly in the more southern, steeper areas of the watershed. Many
farms in those areas have since been sold to people looking for recreational land. Agriculture
still dominates the northern portion of the watershed where the land is less steep, easier to
cultivate, and the farm size is slightly larger.
Flooding continued to plague the area, however. From the 1930s up until the 1970s, large
dams were seen as the solution to stop severe and frequent flooding. In 1962 Congress
formally authorized a $38 million federal dam project in La Farge. The initial plan was later
revised to include a lake, which brought promises of tourism development and an economic
boost to the area. The Corps of Engineers acquired nearly 9,000 acres of land and displaced
over 100 families within the project area. For a variety of reasons, many of which were
environmental issues, the dam project was suspended in 1975 even though $18 million had
been spent, a lakeside road built, and part of the dam structure was already in place. The area
economy was further hurt by this federal abandonment, and local resentment of government
was understandably high. However, as the land lay fallow, natural vegetation reestablished,
and water quality improved. The slow healing processes that were occurring throughout the
watershed were magnified in the project area and the ecological results were dramatic.
Community Conservation Consultants, with the help of local residents, wrote the original
proposal for the Kickapoo Reserve in 1992. With assistance from the University and the
State, a local citizen advisory group was formed to try and resolve the long-standing “dam-
land” issue. They recommended the creation of a “Kickapoo Valley Reserve,” managed by a
local-state board to help protect the river’s headwaters and attract tourism to the region.
Federal legislation transferring the land to the State of Wisconsin passed in 1996. The State
passed accompanying legislation to form a local management board. The land is now
managed by a the local Reserve Board with joint representation by the State of Wisconsin
and the Ho-Chunk Nation.
The cumulative effects of improved land management on both agricultural and recreational
lands are responsible for the improving health of the rivers and streams of the Kickapoo
Valley. Soil erosion off the land and sedimentation in the streams has decreased
significantly. Also the amount of rainwater and snowmelt infiltrating the groundwater
system has increased, recharging the springs and seeps that keep the streams constantly
running cold. According to flow data from a gauging station operated by the U.S. Geological
Survey on the Kickapoo River, instantaneous peak flows (high flows after a rain storm)
declined an average of 1.3 percent annually from 1961 to 1990, while base groundwater flows
increased. Since the 1970s there has been noticeable improvement in the health of the
streams. Less sediment and pollution are entering the streams, stream flows are less flashy
after rain events, and water temperatures are cooler.
18 | P a g e
Though the water quality improved dramatically, the changing land uses that brought about
improved water quality have not healed the damage done to the stream banks, and cover for
fish to hide and rest was limited. In the 1960s, the DNR began a program of streambank
restoration and developed a structure to install that creates an artificial undercut bank,
excellent cover for trout. By the early 1980s, DNR fisheries staff noticed brown trout
reproducing successfully in some area streams, an extremely encouraging sign considering
the dire predictions made in the 1950s. The health of the fishery improved and anglers began
to discover the area. About the same time, other tourists came in greater numbers to canoe,
hunt, snowmobile, camp, or just enjoy the scenery in the Kickapoo. Recreational tourism has
brought new potential for economic development to the local communities. This is a
welcome prospect for a region that has only about half the average per capita income of the
rest of the state, making it one of the economically poorest areas.
The Kickapoo TodayThe Kickapoo TodayThe Kickapoo TodayThe Kickapoo Today
Today there are approximately 25,000 people who live in the watershed. The total population
hasn’t changed much since 1900. There are 16 incorporated communities (2 cities and 14
villages), which range in size from 4,000 in Viroqua to less than 200 in Steuben, though most
live in the rural areas. People in the watershed earn their livings primarily in farming, the
service industry, factories, or by working for the government. It is worth mentioning that
there is a significant population of Amish whom now live in the area. Relative newcomers,
the Amish have been moving into the area since the mid-1960s. The largest Amish
community in the state of Wisconsin is located between Cashton and Ontario. The vast
majority of land in the watershed is in private ownership with the major exception of the
12,000 acres that make up the Kickapoo Valley Reserve and adjacent Wildcat Mountain State
Park.
Finally, a small but growing portion of the population is absentee homeowners who use their
property for recreation and vacations. Agriculture is still the dominant land use and
foundation for the local economy, but recreation is becoming an increasingly important part
of the local economy. It is also, once again, changing the appearance of the landscape.
Recreational property owners tend to purchase forested land, but they also tend to buy
smaller parcels. The patchwork of land owners that covers the landscape is tending towards
smaller and smaller units. This ownership trend could be good or bad for the watershed – it
depends on how people decide to manage their land. Watershed conditions are generally
good, but there are still significant areas that need improvement. The area is facing new
challenges, particularly with changing agricultural practices, increasing second home
development, and other land use changes. If not undertaken wisely, these land use changes
could easily reverse decades of environmental healing. Therefore, the local communities
should be encouraged to be proactive and plan wisely for these changes. People are
increasingly aware that land use, the health of the streams, the quality of life, and economic

19 | P a g e
benefits are interrelated. Hopefully this plan will help provide a framework for taking
positive action to protect those things they value and guide positive change in the watershed.
III. SOCIOIII. SOCIOIII. SOCIOIII. SOCIO----ECONOMIC DEMOGRAPHICSECONOMIC DEMOGRAPHICSECONOMIC DEMOGRAPHICSECONOMIC DEMOGRAPHICS
The following text was taken from the 2007 Vernon County Workforce Profile, a document prepared
by the Office of Economic Advisors at the Wisconsin Department of Workforce Development.
WorkWorkWorkWork----force Profileforce Profileforce Profileforce Profile
The population in Vernon County totaled 29,530 on January 1, 2007 after adding over 130 new
residents during 2006 and posting an increase since Census 2000 of 1,474 new residents. The
5.3 percent increase from 2000 ranked 34th highest among the state’s 72 counties, matching
the increase in the state but lagging growth in nation.
All but five of the county’s 33 municipalities added residents since 2000 with the greatest loss
occurring in the City of Hillsboro. The majority of municipalities, however, added residents
and increases in the five largest accounted for over one-third of the total increase in the
county.
Vernon County’s total population is increasing from both natural causes (births minus
deaths) and net-migration (more individuals moving into the county than leaving). Since
2000 births out-numbered deaths by 679 while net-migration added 795 residents.
Adding new residents from natural causes is helping to keep the median age in the county in
check, but at 39.7 years it is still higher than 35 other counties in the state and higher than the
state median age of 37.6 years. Although the county’s median age has dropped in the last
three years, it remains a bit higher than the median age of 39.4 years in 2000.
The median age is poised to increase, however, as a large share of the county’s population
advances toward the older age groups. The bottom chart shows the shift in population
projected over the next 25 years. By 2030 roughly 28 percent of Vernon County’s population
will have celebrated their 60th birthday. In contrast, in 2005, slightly better than 21% of the
population was aged 60 years or older.
Also in 2005, roughly 30 percent of the population was less than 20 years old. Although
projections do show an increase in the number of residents in this younger group, from 8,560
in 2005 to 9,270 in 2030, the group will shrink proportionately to 27 percent of the county’s
population. The population will be a bit more evenly distributed among the age groups in
2030 as the ratio of young to old increases.

20 | P a g e
Most of the shift in population is due to the dominance of the baby boomer population, who
numbered 7,965, or 27 percent of the total population, in 2000 and were 36 to 54 years old. By
2030, they are older and although their numbers will drop to 6,415, they will still comprise 19
percent of the total population.
Of more immediacy are the roughly 6,460 baby boomers currently in the labor force, who by
2020, even with an increasing desire to remain engaged in the workforce, will reduce the
number of hours they work, leave their current job for self-employment or change of scenery,
and eventually, retire. Even with greater participation their numbers will decline to less than
5,800 by 2020. Not only will boomers leave the workforce but the population to replace them
is diminishing.
EmploymentEmploymentEmploymentEmployment
In Vernon County, education and healthcare
provide both the greatest number of jobs and the
largest portion of the county’s wages. The list of
largest employers has three employers related to
health care and two school districts. This is also
apparent in the list of the prominent industries with
educational services listed as the largest employing
industry, and all four healthcare and social assistance industries within the top 10.
The prominence of healthcare on both these lists reflects the fact that healthcare employment
is the state’s fastest and largest growing employment base and will remain so for the
foreseeable future. It is a demand-driven industry fueled by, and increasingly needed by, an
aging population.
It is not unusual for school districts and government to be included among the largest
employers in a county as well as among prominent employing industries. Government and
public schools serve a large segment of the county’s population resulting in a large
concentration of employment with a single or few employers.
Nevertheless, Vernon County has remained true to Wisconsin's agricultural heritage.
Economic analysis by the UW Extension notes that Vernon is one of Wisconsin’s counties
with a stronger than state average presence in agricultural activity—estimating that more
than 40 percent of all economic activity in the county is directly linked to agriculture.
Vernon County appears on a number of top 100 county lists (national rankings) from the
U.S. Census of Agriculture, including number of farms in a county.
Vernon County Food System FactsVernon County Food System FactsVernon County Food System FactsVernon County Food System Facts
40% of all Economic Activity is directly linked to Agriculture.
Top 100 Nationally

21 | P a g e
The list of largest employers in the county
includes two firms (CROPP & Tri-State
Breeders) with clear and present ties to
agriculture. Numerous other employers in
Vernon County have direct ties to agricultural
activity.
Vernon County’s economy as a whole has
benefited from, and capitalized on, the rapid growth in organic farming. The American
market for organically grown food amounted to $1 billion in 1994, and $13 billion in 2003.
Increased consumer awareness of food safety issues and environmental concerns has
contributed to the growth in organic farming over the last few years.
IncomeIncomeIncomeIncome
The industries in a county, and the occupations of workers employed by businesses in those
industries, provide the primary income component of the county’s total personal income
(TPI). Workers’ wages from Vernon County employers comprise roughly 44 percent of net
earnings, which also include earnings of self-employed individuals and proprietors.
Additionally, net earnings includes wages from over one-third of the county’s workers who
travel out of the county for jobs.
Net earnings comprise 62.9 percent of TPI in Vernon County, low when compared to other
counties and less than the 69 percent TPI in both the nation and state. The share of TPI
from net earnings in Vernon County ranks 48th, lowest among Wisconsin’s 72 counties. This
is significant since net earnings provide the stimulus for growth in per capita personal
income; much more so than the two other major components of TPI, property income
(dividends, interest, rent) and personal transfer payments.
Property income comprises 16.7 percent of TPI in Vernon County while transfer receipts
make-up 20.4 percent. Transfer receipts are a much greater share of TPI in the county than in
the nation, 15 percent, or state, 14 percent.
Transfer receipts are, for the most part, payments made under Medicare and Medicaid
(together they comprise 39% of transfer receipts) and Social Security (43% of transfer
receipts). Generally, these payments are stagnant although they do include a cost-of living
component. The primary recipients, especially of social security and Medicare, are residents
aged 65 years or more; and, in Vernon County, that includes nearly one in five residents.
NationNationNationNational & County Food System Factsal & County Food System Factsal & County Food System Factsal & County Food System Facts
The market for organically grown food
increased from $1 Billion in 1994 to $13
Billion in 2003.
Vernon County has the largest number of
organic farms per capita in the United
States.

22 | P a g e
With roughly 20 percent of the population living on fixed, and presumably reduced, income;
and average annual wages well below state wages; it follows that overall per capita personal
income (PCPI) would lag below state PCPI. Per capita personal income, which is the result
of dividing total personal income by total population, is also impacted by a young population
with little or no income.
PCPI in Vernon County in 2005 was $23,108, only 70 percent of Wisconsin’s PCPI of
$33,278 and 67 percent of $34,471 for the nation. Lower PCPI in non-metropolitan counties of
the state and nation is common. The primary reason is that the corporate and business offices
that employ workers in professional and technical occupations with higher wages tend to
locate in metropolitan areas rather than rural areas. The PCPI in Wisconsin’s metro areas
was $35,203 compared with PCPI in nonmetropolitan areas of $28,254.
Since 2004, PCPI in Vernon County increased 2.1 percent, compared with an increase of 3.7
percent in the state and 4.2 percent in the nation, and the increase of 20.1 percent over the 5-
year period was better than in the larger geographies.
TourismTourismTourismTourism
In 2007, tourist spending resulted in $45.9 million in Vernon County, which was equal to
0.36% of total tourism expenditures in the State of Wisconsin. Tourist spending peaks
during the months of June-August, providing 42% ($19.4 million) of the total yearly tourism
expenditures. Out of 72 counties in Wisconsin, Vernon County ranks 56th in total tourism
expenditures.7
IV. POVERTY PROFILEIV. POVERTY PROFILEIV. POVERTY PROFILEIV. POVERTY PROFILE
Between 1990 and 2000 the number of people
living in poverty in Vernon County has
declined from 15.8% in 1990 to 14.3% in 2000.
Even though poverty levels are declining, it’s
essential to investigate the issue of poverty
when attempting to understand food security. Community food insecurity is closely linked
to poverty. One startling statistic recently announced by the Wisconsin Council on Children
and Families states that Wisconsin currently ranks first in growth in poverty8, which, among
other issues, poses serious threats to child development. However, community
characteristics, economic assistance policies and the availability and use of public and private
7 Wisconsin Department of Tourism. “The Economic Impact of Expenditures by Travelers on Wisconsin Calendar Year 2007: County by County Report. April 2008. 8 Wisconsin Council on Children and Families. “Wisconsin Ranks First in Growth in Poverty: Census Bureau Reports” Press Release, August 30, 2005.
Food Security: “When all people at all times
have access to sufficient, safe, nutritious food to
maintain a healthy and active life.”
World Health OrganizationWorld Health OrganizationWorld Health OrganizationWorld Health Organization

23 | P a g e
resources also play an important role in measuring food insecurity. The following statistics
begin to explain the issue of food insecurity as it relates to poverty in Vernon County.
• In 20079, more than 4 out of 5 (82%) of the respondents in a Vernon County Low-
Income Household Needs Assessment Survey had a yearly household income of
$21,462 or less.
• In 200510, 15.8% of Vernon County’s population lived in poverty.
• In 200511, the Vernon County child poverty rate was 25.5% compared to the Wisconsin
child poverty rate of 14.9%.
• In 200812, 38% of the public school students in Vernon County were eligible for free
and reduced rate lunches.
• In 200713, an average of 1,518 Vernon County residents were monthly Foodshare (food
stamp) recipients compared to 686 in 2000.
9 Jones, Grace, Teadt, S. and Roth, C. CouleeCap. 2007 CouleeCap Needs Assessment for Crawford, La Crosse, Monroe and Vernon Counties. 10 Jones, Grace. “The Face of Poverty in the Coulee Region.” CouleeCap. June 2008. 11 Jones, Grace. “The Face of Poverty in the Coulee Region.” CouleeCap. June 2008. 12 Wisconsin Department of Public Institutions (http://dpi.wi.gov/fnsl/progstat.html) 13 Wisconsin Department of Health and Family Services Foodshare Data (http://dhfs.wisconsin.gov)

24 | P a g e
CHAPTER CHAPTER CHAPTER CHAPTER IIIIIIIIIIII
A REGIONAL PROFILE OF AGRICULTUREA REGIONAL PROFILE OF AGRICULTUREA REGIONAL PROFILE OF AGRICULTUREA REGIONAL PROFILE OF AGRICULTURE
5. HISTORY OF AGRICULTURE
i. Overview
i. 1884 “History of Vernon County, Wisconsin” excerpt
ii. 1981 Vernon County Farmland Preservation Plan excerpt
ii. Coon Creek Watershed
iii. Cheesemaking
6. AGRICULTURE TODAY
i. 2007 Census of Agriculture, Vernon County Profile
ii. Ken Meter Rural Economic Study
7. A PROFILE OF AGRICULTURAL ENTREPRENEURSHIP
i. Organic Valley
ii. Westby Creamery
iii. Keewaydin Organics
iv. Harmony Valley Farm
v. Amish Community Farm
I. I. I. I. HISTORY OF AGRICULTUREHISTORY OF AGRICULTUREHISTORY OF AGRICULTUREHISTORY OF AGRICULTURE
a.a.a.a. OverviewOverviewOverviewOverview
The following text was taken from the 1884 book “History of Vernon County, Wisconsin” published
by Union Publishing Company in Springfield, Illinois.
AGRICULTURE AGRICULTURE AGRICULTURE AGRICULTURE AND THE AGRICULTURAL SOCIETY AND THE AGRICULTURAL SOCIETY AND THE AGRICULTURAL SOCIETY AND THE AGRICULTURAL SOCIETY
As Vernon county consists of timber land, oak openings and prairie, it is now, and was
originally, settled by farmers almost exclusively. As yet, manufactories may be said to be
practically unknown. The farming interests are paramount to all others and doubtless will be
for generations to come. There are no pineries or great lakes on its borders and the
Mississippi is only available, so far as the county is concerned, to aid in transporting to
market its surplus farming products. That manufactories will rise up, upon the introduction
of greater railway facilities, is certain, but that they will overshadow the farming interests of
Vernon county before the ending of a century from this time or even longer, is exceedingly
doubtful.
The Chicago Tribune had this to say, in 1861, of Vernon (then Bad Ax) county:
25 | P a g e
"Of this county nearly one-third is prairie, quite rolling and very rich. I do not
know where I have ever seen any prairie soil that looks richer, or that bears heavier
wheat. It is a rich black, vegetable mould, of a clayey texture and basis, and such as
has been tested seems to be enduring and wears well. Near one-third is oak opening or
ridge land, covered with oak undergrowth or grubs. These ridges are quite broad in
many places, furnishing good locations for farms. There has been opened up many
ridge farms. The land where cultivated appears to be a clayey loam—a good wheat
soil, and which has so far turned out excellent crops of wheat.”
The balance of the country is covered with heavy timber—oak being the predominating kind.
This timber is valuable because of its nearness to good prairie, and the land is as good, even
better for corn. Though the timber is heavy, the land is easily tilled, owing probably to the
fact that the roots of the trees lie deep in the ground, which admits of the soil being plowed
close to the stumps. Taken as a whole there is scarcely an acre of waste land in this county.
Though somewhat rough, its slopes and hillsides admit of cultivation nearly to the top.
Such parts of this county as are unfit for the plough are most admirably adapted to the
rearing of sheep. In fact, to my mind, much of northwestern Wisconsin is admirably adapted
to sheep husbandry.
The population of this county is 11,500. In 1855, it numbered a little over 4,000. La Crosse was
then about 4,000, as was Monroe, lying east of La Crosse. These latter have had the benefit of
railroads to stimulate their growth. La Crosse being possessed of much good farming lands
and several small villages, as well as the City of La Crosse, numbers 13,500, while Monroe,
with a smart village or two, with more poor land, has but 8,400. To my mind Bad Ax has
more than kept pace with her neighbors, considering her secluded position.
There is estimated to be in this county this year, at least 1,000,000 bushels of surplus wheat
seeking a market. Of pork, there will be enough for home consumption, and possibly a little
for sale. Cattle and sheep are beginning to receive attention, and but a few years will elapse
before the hill-sides will be covered with large herds of lowing cattle and flocks of bleat-ins
sheep.
Some attention is being paid to fruit. Here and there were to be seen newly set orchards. In
time, after the trees have become acclimated it is my impression that the hillsides, and
especially the northern slopes of Bad Ax county will be covered with orchards heavily laden
with rich and luscious fruit.
The numerous streams in this county furnish ample water power, which combined with its
excellent timber, will supply numerous openings for the employment of capital in

26 | P a g e
manufacturing agricultural implements, and also for the purpose of building mills, to flour
their own wheat.
The people of this county look forward with no small degree of interest to the day when they
shall be favored with railroad facilities such as will place them on an equal footing with their
more favored neighbors."
VERNON COUNTY VERNON COUNTY VERNON COUNTY VERNON COUNTY AGRICULTURAL SOCIETYAGRICULTURAL SOCIETYAGRICULTURAL SOCIETYAGRICULTURAL SOCIETY
Bad Ax County Agricultural Society was organized and chartered April 11, 1857. The society
in 1859 had seventy members, each paying an initiation fee of one dollar, and an equal sum
per annum. The payment of ten dollars instituted a life membership. Other modes of
obtaining funds were from admission fees into the fair grounds. The society possessed in real
estate ten acres of land enclosed with a board fence seven feet high, and valued at $8800. Here
an exhibition is held annually, when $100 are paid for premiums, the largest being $5 for the
best address; a similar sum, each, for the best stallion and best acre of wheat, and $4 for the
best bull. The library then consisted of forty-seven volumes, worth $1100. Since the fair of
1857 there was, up to 1859, a great improvement in domestic animals and an increase in crops.
The desire for agricultural knowledge had become general.
In 1883 the society was in excellent financial condition. The fair grounds were located about a
quarter of a mile west of the court house. They embraced about fifteen acres of land, valued
at about $30 per acre. They were well supplied with buildings, and well fenced. The old $10
life membership fee had been abolished, and the by-laws provided that will pay for a
membership, and each member should buy a $1 family ticket each year." There were $300 in
the treasury of the society in 1883.
In 1883 the officers of the society were: President, F. K. Van Wagoner; secretary, O. B.
Wyman; treasurer, E. Powell; vice-presidents, H. H. Morgan, of Wheatland; P. J. Jrody, of
Clinton; J. H. Stevenson, of Harmony. Executive committee, E. A. Stark, of Viroqua,
chairman; E. Tilton, of Viroqua; John M. Vance, of Sterling; Edward Minshall, of Viroqua;
and F. W. Alexander, of Franklin.
At the last fair held at Viroqua, in September, 1883, the whole number of entries was 503. The
total receipts from the sale of tickets were $696; receipts from entrance fees were §174.00;
from stand licenses, $153.50; from rent of ground, etc., $24.60. Total receipts, $1,048.70.
The following text was taken from the September 1981 Vernon County, Wisconsin Farmland
Preservation Plan, Volume 2: Background Report.

27 | P a g e
HISTORY OF AGRICULTURAL PRODUCTION IN VERNON COUNTHISTORY OF AGRICULTURAL PRODUCTION IN VERNON COUNTHISTORY OF AGRICULTURAL PRODUCTION IN VERNON COUNTHISTORY OF AGRICULTURAL PRODUCTION IN VERNON COUNTYYYY
Agriculture settlement of Vernon County began in the 1840’s and 1850’s. In these early years
the County raised wheat, corn, oats and potatoes. Thirty bushels of wheat to the acre, or
fifty bushels of oats per acre were considered average crops. The early demand for
agricultural products came from the Military and Indian Departments, the fur trade and
particularly from the lumber trade which created a demand in excess of [the] supply of
agricultural products. With the advent of steamboat transportation on the Mississippi, the
County became a wheat exporting area. In 1861, 1 million bushels of wheat were marketed.
The construction of the La Crosse and Milwaukee Railroad in 1879 enhanced the wheat
export capabilities of the area. By the 1870’s, Vernon County was the most specialized wheat
area in the state, and it continued to hold that position until wheat ceased to be an important
crop in Wisconsin.
In 1880, there were a few small cheese factories in Vernon County. In the 1880’s and the
1890’s there was a gradual increase in dairying. The large increase in dairying took place after
1910, and dairying has continued to be the primary type of agriculture since that date. Vernon
County gained particular fame as an outstanding butter producing area, although it produced
a full mix of dairy products. By 1952, Vernon County produced 6.3 million pounds of butter
and 8.5 million pounds of cheese.
In 1979, dairy products represented 66% of the total cash receipts from agriculture in the
County. Dairy products were followed by meat animals (17%) and field crops (13%).
Since the 1880’s, tobacco has been an important specialty crop in the County. At its peak
during the 1950’s, tobacco constituted 15% of the gross farm income in the County.
FARM CHARACTERISTICFARM CHARACTERISTICFARM CHARACTERISTICFARM CHARACTERISTICS AND AGRICULTURAL LAND USES AND AGRICULTURAL LAND USES AND AGRICULTURAL LAND USES AND AGRICULTURAL LAND USE
Vernon County has been experiencing most of the
same trends in farm size and agricultural land usage
as other rural counties. According to the U.S. Census
of Agriculture, during the past two decades there has
been a gradual but steady decline in the number of
farming units and a gradual increase in the average
size of farming units.
At both ends of the spectrum of farm size, two
different trends appear to be occurring. The high
production farms are tending toward larger acreage,
more capital investments, and increasingly scientific [i.e. industrialized] methods of
production. At the other end of the production spectrum the number of hobby farms has
increased. Hobby farms are often owned by absentee landowners or recent arrivals to the
Family Farm: “An operation in which most
decisions are made by family members
actively engaged in the farm operation.
A mid-sized family farm is defined as: 1)
small commercial farms with annual sales of
$50,000-$99,999; and 2) moderate-sized
commercial farms with annual sales of
$100,000-$249,999.”
Economic Research Service, Economic Research Service, Economic Research Service, Economic Research Service, U.S. Dept. of AgricultureU.S. Dept. of AgricultureU.S. Dept. of AgricultureU.S. Dept. of Agriculture
28 | P a g e
County from more urban areas. They typically have smaller acreages and lower yields than
production farms. The average sized family-owned farm appears to the type of farming unit
which is most threatened by changes in farm ownership and economic factors.
The overall land in farms has declined according to statistics published by both the U.S.
Department of Agriculture and the Wisconsin Department of Agriculture. Both sets of
statistics suggest that there has been a conversion of agricultural land to non-agricultural use
in nearly every town in the County. The reasons for the loss of farmland vary from town to
town. In the Kickapoo Valley, public acquisition for the proposed La Farge Dam project
removed acreages in Stark and Whitestown from private farm ownership. Private
acquisition of scenic land for recreation and speculation has also caused a loss in farmland in
the Kickapoo Valley. During the years 1967-73 when the dam and recreational reservoir were
actively being planned and public land acquired, land speculation caused land prices in the
Kickapoo watershed to increase 150 percent. In the western part of the County, particularly
the towns along the Mississippi River, private acquisition for residential and recreation use
has been the primary cause of farmland loss. Non-farm residential use has also increased in
the vicinity of Westby and Viroqua.
COSTS OF AGRICULTURAL PRODUCTIONCOSTS OF AGRICULTURAL PRODUCTIONCOSTS OF AGRICULTURAL PRODUCTIONCOSTS OF AGRICULTURAL PRODUCTION
The economics of agricultural production have been a major factor influencing the type of
agricultural production and the characteristics of farming units. In particular, the high costs
of farming have fueled the trend to larger, more capital intensive operations. As the costs of
production have increased dramatically, smaller farmers have been forced to sell their land to
larger operators or else to non-farm users. In some parts of the County, this has helped spur
the amount of non-farm speculative and recreational investment in farmland.
Although the market value of agricultural products sold has increased over 150% during the
past decade, the costs of production have increased at an even faster rate.
At the same time that the economics of agricultural production have forced many smaller
farmers into an unstable economic situation, the value of farmland has risen dramatically, so
that the incentive to sell the farm is created by the high prices a farmer can receive for
farmland. Although the value of farmland peaked several years ago and there is a temporary
dip in land values, it is expected that the land inflation will continue to be a factor which
encourages farmland conversions.
The Wisconsin Farmland Preservation Act was passed by the Wisconsin legislature in the
expectation that the bill would provide some property tax relief to farmers, thus mitigating
one element of the economic squeeze on the farming industry.

29 | P a g e
b.b.b.b. Coon Creek WatershedCoon Creek WatershedCoon Creek WatershedCoon Creek Watershed
The following photo and text was taken from the Vernon County Land Water Conservation
Department website.
The Coon Creek Watershed: A Success Story of Cooperative ConservationThe Coon Creek Watershed: A Success Story of Cooperative ConservationThe Coon Creek Watershed: A Success Story of Cooperative ConservationThe Coon Creek Watershed: A Success Story of Cooperative Conservation
One of the world's most remarkable series of conservation events has taken place in the
Coon Creek Watershed in southwestern Wisconsin. This transformation happened through
the first large-scale erosion control demonstration project in the US.
Originally a pristine woodland a century and a half ago, the area suffered ruinous agricultural
degradation through early farming practices. Farm income failed not only because of the
depression, but because productivity of the land was washed down the Mississippi.
This aerial photograph appeared in the December 1995 issue of the
National Geographic© magazine. The ridge pictured in the photo is
located in the Coon Creek Watershed in Vernon County.
In the early part of the century, damaging floods occurred every two or three years because of
the poor condition of the upland woods and cropland. Average soil loss was 10 to 20 times
higher than could sustain soil productivity. Upland silts literally filled the floodplains.
In Coon Valley, up to 13 feet of silt have filled low-lying valleys. You can see the thick layer
of silt along streams where the water current has eaten away at the streambank. At least one
old mill has been buried under the silt. The topsoil eroding from the hillsides not only
affected the valleys in the Coon Creek area, but made its way to the Mississippi River and on
into the Gulf of Mexico.

30 | P a g e
"Coon Valley is one of a thousand farm communities, which through the abuse of its originally rich
soil, has not only filled the national dinner pail…but has created the Mississippi flood problem, the
navigation problem, the overproduction problem, and the problem of its own future continuity."
(From Aldo Leopold's essay "Coon Valley: An Adventure in Cooperative Conservation" 1935)
Due to the efforts of a multi-disciplinary group of pioneering conservationists, a few farmers
willing to risk a new way of farming, and the newly created Civilian Conservation Corps
(CCC), conservation planners used the degree of land slope to separate land use. Relatively
flat bottomland and land sloping from 2-20% was usually cropland or pasture. Slopes from
8% to20% were put into contour strips. The 20-30% land was fenced for pasture by the CCC
crews, and the steeper land was used for woods. These same guidelines were used on ridges
to separate land use.
Today, conservation practices have reduced valley sediments 94% since the 1930s, and
restored farmland productivity. Most woods are ungrazed and managed, flooding has been
greatly reduced, wildlife is more abundant, and trout fishing in the area is unmatched in the
Midwest.
The upstream branch of Coon Creek, Timber Coulee, is now the most heavily fished trout
stream in Wisconsin and also the most productive. This is because upland soil conservation
work has reduced erosion and is allowing more rainfall to infiltrate into the soil, improving
spring flow and providing better water quality. With upland conservation practices slowing
runoff, it now takes a very hard rain to cause excessive flooding in the valley.
The woods have never been this thick before. After the glaciers, the Native Americans
burned back the trees to encourage forbs and grasses for deer and other grazers. Early settlers
grazed cattle and burned the woods in the spring. The Coon Creek project discouraged
grazing and burning. The result is the first natural stand of mature trees in probably 10,000
years. About 44% of the watershed is now forested. Ungrazed hillside woods can absorb
rainfall at the rate of 17 inches per hour without runoff occurring.
Wildlife numbers have also increased. One of the reasons is the habitat created along the
edge of the woods by shrubs, which the early conservation plans encouraged. Another reason
for the increase in wildlife is due to additional wetlands along the creek.
This conservation ethic continues today, with creative partnering and a commitment to
preserve and enhance existing natural resources.

31 | P a g e
b.b.b.b. ChChChCheesemakingeesemakingeesemakingeesemaking
Researched and written by Sara Martinez, Food & Farm Initiative Steering Committee Member
It’s hard not to picture Wisconsin’s landscape without its patchwork of family dairy farms.
The truth is that the early days of homesteading and agriculture in Wisconsin, especially in
the Driftless Area, were distinctly characterized by intensive wheat production. Until the
late 1860s, Wisconsin’s wheat crop was ranked third in the nation. Wheat production then
declined due to soil exhaustion, devastating chinch bug infestations, and reduced prices that
largely resulted from the opening of large areas of prairie in Minnesota and the Dakotas. 1111
(p.154) The same climate and soil that had produced large wheat crops were ideal for forage
crops, and the land that was unsuitable for cultivation was good for pasturing livestock. By
1904 a majority of farmers across the state had chosen an alternative to monocultural wheat
cropping that capitalized on these conditions, dairying. 2 2 2 2 (p. 134) The growth of commercial
cheese production, which aggregates milk from multiple herds and results in a relatively
durable and easily transportable food, thereby providing steady income for farmers, played a
pivotal role establishing Wisconsin’s identity as “Dairyland”. In the decades between the
Civil War and the turn of the century, cheese was fast becoming the state’s best-known and
economically significant value-added food product.
To preserve excess milk, some local farm families had previously made farmstead cheese and
butter for their own consumption. But commercial cheesemaking required significant
knowledge and skill, and it was practiced by only a handful of farmers. Cheese traveled
relatively well and spreading railroad transportation opened markets for Wisconsin dairy
farmers. 2222 (p. 132) New Yorkers and European immigrants were influential in the
development of the state’s value-added dairy product industry. They brought with them
butter-making and cheese-making traditions as well as experience with the establishment of
community cheese factories and creameries. 1 (p.154) It is well-known that the rise of dairy
farming and predominance of value-added dairy production in Wisconsin was also promoted
and supported by the University of Wisconsin. The University’s Dairy School opened in
1887. Butter and cheese-maker training and licensing were instituted as part of the program.
In 1890, University of Wisconsin Professor Stephen Babcock created the standardized test
for measuring butterfat in milk. The test permitted rapid and accurate grading of milk at
markets, discouraged adulteration and thinning, and made the testing of an individual cow’s
milk practical, providing a standardized way of paying farmers for their milk. 1111 (p. 155) The
public education system benefitted local independent businessman and Viroqua Dairy
owner, Forest O’Connor, who enrolled in the University of Wisconsin Dairy Short Course
in the late 1920’s. He emerged from the course with knowledge and confidence which was to
shape his professional career. 3333 (Booklet’s Introduction) In turn, O’Connor’s successful
creamery business and others like it contributed to the area’s economic life.
32 | P a g e
“Ontario is one of the many Kickapoo Valley villages that has a creamery with a capacity of
6,000 pounds of milk per day and we were informed that within a radius of six miles of that
village that five cheese factories were located,” documented the authors of The Kickapoo
Valley: The Gem of Wisconsin in 1896. 4444 (p. 59) In 1922, there were over 2,800 cheese
factories in the entire state. 5555 Well into the 1930’s, Vernon County was dotted with cheese
factories and creameries, which served their numerous farmer patrons and provided job
security for the individuals and families who operated the plants. Sometimes the creameries
made butter and cheese and sometimes the terms milk plants and creameries were
synonymous. In any case, the cheese factories and creameries bore responsibility for
controlling sanitation, producing quality foods, as well as marketing. They also competed to
be able to assure farmers a good price and maintain their patron numbers. Floyd Burt, who
ran Bud Cheese Factory for more than 46 years, explained in Jerry Apps’ Cheese: The
Making of a Wisconsin Tradition, “It was up to the cheese-maker to make a quality product
or it would not sell. We always stressed quality cheese rather than quantity.” 6666 (p.57)
Creameries and cheese factories were an essential component of the rural infrastructure
supporting small-scale farming. Viroqua Co-op Creamery, for example, bought milk from
900 farmers in the 1930’s. For the most part, the creamery produced butter for the Chicago
market. Like other patrons of cheese factories and creameries throughout the countryside,
Viroqua Co-op Creamery’s dairy farmers formed long lines daily, waiting to deliver their
fresh product in 10 gallon cans by wagon and later by truck. 7777 (p.345) Vernon County’s
official total for dairy plants and canneries in 1939 was forty. 8888 (p. 26) “Vernon County is an
important producer of cheese,” articulated the same document published in 1946 by the
Wisconsin Crop and Livestock Reporting Service, United States Department of Agriculture,
and Wisconsin Department of Agriculture. In 1945, county farmers and cheese factories put
out 7,470,000 pounds of cheese. 8888 (p.49)
Consolidation of milk processing facilities and the decline in the number of dairy farms
began after World War II and accelerated during the next two decades. By 1945, there were
about 1,500 cheese factories and an unknown number of creameries in Wisconsin. 5555 Viroqua
Co-op Creamery’s employment peaked in the early 1960’s at 32, plus 15 contracted milk
haulers. The late 1960’s brought a significant decline in the use of milk cans with the wide-
spread application of pipelines, bulk tanks, and improved roads for larger trucks. Viroqua Co-
op Creamery merged with Hiawatha Valley Creamery of Sparta in 1967 and the two later
became part of Golden Guernsey out of Milwaukee. 7777 (p. 345) Westby Cooperative
Creamery’s patrons stopped using cans by 1969. 9 9 9 9 However, the use of canned milk was not
all that uncommon in Vernon County in the 1970’s. In a 1981 publication written by Bill
Werth of University of Wisconsin-Extension, he observed that the use of cans was
continuing to decrease as more farmers managed to purchase bulk tanks as a necessary part of
doing business with the modernizing and increasingly fewer commercial dairy processors. 10101010

33 | P a g e
Today there are approximately 115 cheese factories in Wisconsin. 5555 The 2009 Vernon County
Community Food Assessment counts seven cheesemaking facilities or other dairy processors
that operate in Vernon County. There are at least three others close to its borders. Several
are cooperatives. All include specialty cheesemaking as an important piece of their business.
One cheese plant accepts milk in cans. A few utilize goats’ and sheep’s milk rather than or in
combination with cows’ milk. Farmstead cheesemakers, producers who make cheese from
milk produced on their farms, are included among Vernon County’s cheese factories.
Besides specialty cheese varieties and Wisconsin mainstays like Cheddar and Colby,
consumers can also enjoy artisan, organic, rGBH-free, and raw milk cheeses from Vernon
County. The fine quality of Vernon County cheeses is recognized by food cooperatives and
food specialty shops. This is evidenced by their inclusion in local foods and gourmet
inventories across the state and as far away as the Twin Cities and Chicago. Even though
the days of a community cheese factory or creamery in every township are over, local
cooperatives and independent agricultural entrepreneurs are finding ways to serve area
farmers and meet consumer demand for quality cheeses.
There is a need for more research in this important area of local food and farm history as the
stories of many cheese factories and creameries which once operated in and around the
county are not documented. The accompanying list and map of cheese factories and
creameries that currently operate or once operated in Vernon County and on its borders is a
humble attempt to show how food processors were once generously dispersed throughout the
county, playing an essential role in the area’s agriculture.
Number of cheese factories in Wisconsin 5555 (p.22)
1870 -- 90
1880 -- 700
1890 -- 1,149
1905 -- 1,518
1922 -- 2,807
1938 -- 1,917
1950 -- 1,279
1960 -- 798
1980 -- 334
1995 -- 142
2008 -- 115

34 | P a g e
TABLE III: LOCAL CHEESE FACTORY LIST
# on # on # on # on
MapMapMapMap
Cheese Factory or Cheese Factory or Cheese Factory or Cheese Factory or
Creamery NameCreamery NameCreamery NameCreamery Name
LocationLocationLocationLocation Year Year Year Year
OpenedOpenedOpenedOpened
Year Year Year Year
ClosedClosedClosedClosed
NotesNotesNotesNotes
1 Avalanche Cheese
Factory
Avalanche before
1924
2 Bloomingdale
Creamery
Blooming-dale,
Clinton Twp.
3 Brush Hollow
Cheese Factory
Viola, Webster
Twp., N of 82
1912 1978 newpaper
reported that
closure was
attributed by
owner to a DNR
issue related to
indequate septic;
building still there
4 Bud Cheese Factory Bud 1939 1986 milk rights sold to
AMPI; Viroqua
Whey Products
took 25,000 #/day
and local pig
farmers took
5,000-7,000# of
whey/day
5 Carr Valley La Valle, Sauk Co. Circa
1900
open cow, goat, and
sheep dairy
products
6 Chaseburg Co-op
Creamery
Chaseburg 1905 1991: expanded
from 80 local
farms to 700
farms in 5 states
7 Coon Valley Co-op
Creamery
Coon
Valley

35 | P a g e
# on # on # on # on
MapMapMapMap
Cheese Factory or Cheese Factory or Cheese Factory or Cheese Factory or
Creamery NameCreamery NameCreamery NameCreamery Name
LocationLocationLocationLocation Year Year Year Year
OpenedOpenedOpenedOpened
Year Year Year Year
ClosedClosedClosedClosed
NotesNotesNotesNotes
8 CROPP Co-op
(Organic Valley)
Chaseburg open butter and other
9 CROPP Co-op La Farge open milk,
cut/wrap/shred
10 De Soto Creamery De Soto
11 Debelo Greenwood Twp.,
Sect. 15
12 Dilly Dilly, Forest Twp.
Sect. 36
existed before
Warner Creek
Cheese Factory
13 Elk Creek on U, Richland Co.
14 Fargo Franklin Twp. at
82 and 27
15 Ferryville Creamery Crawford Co.
16 Folsom Cheese
Factory
Franklin Township original building
burned down in
1993, was closed
before that
17 Foremost Farms Hillsboro 2003
18 Genoa Genoa
19 Green Creek
Farmers’ Cheese
Factory
Yuba before
1924
20 Greenwood Greenwood Twp.,
Sect. 31, Hwy C
Last run by Emil
Kaukl
21 Hidden Springs Westby 2006 open sheep’s milk
cheese--see
website

36 | P a g e
# on # on # on # on
MapMapMapMap
Cheese Factory or Cheese Factory or Cheese Factory or Cheese Factory or
Creamery NameCreamery NameCreamery NameCreamery Name
LocationLocationLocationLocation Year Year Year Year
OpenedOpenedOpenedOpened
Year Year Year Year
ClosedClosedClosedClosed
NotesNotesNotesNotes
22 Hillsboro Creamery Hillsboro before
1924
23 La Farge Cheese,
Inc.
La Farge sold to AMPI,
then site to
CROPP
24 Liberty Viola-Liberty before
1924
25 Liberty Pole Cheese
Factory
Liberty Pole 1903-06 1991 was Liberty Pole
Dairy Products
1975-91; in 1981
95% of whey went
to Milk
Specialties in
Boscobel
26 Lower Weister
Cheese Company
Pott’s Corners,
Stark Twp., Cty P
before
1924
27 Manning Cheese
Factory
Kickapoo Twp.,
between
Readstown and
Liberty (S)
28 Middle Ridge Cheese
Factory
Middle Ridge, La
Crosse Co.
1902 1971
29 Mid-Port Cheese
Factory
La Crosse Co. 1971 merger of Middle
Ridge and
Portland Cheese
Factories; started
with 92 patrons

37 | P a g e
# on # on # on # on
MapMapMapMap
Cheese Factory or Cheese Factory or Cheese Factory or Cheese Factory or
Creamery NameCreamery NameCreamery NameCreamery Name
LocationLocationLocationLocation Year Year Year Year
OpenedOpenedOpenedOpened
Year Year Year Year
ClosedClosedClosedClosed
NotesNotesNotesNotes
30 Mt. Sterling Cheese
Co-op
Mt. Sterling,
Crawford Co.
1976 open goat milk dairy
products; started
as SW WI Dairy
Goat Producers
Co-op
31 Mt. Tabor Forest Twp.., Sect.
11, Hwy V
32 Muncie Union Twp., Sect.
35
33 Newry Dairy and
Creamery
Newry
34 Nordic Creamery Westby, farm near
Esofea--cheese is
currently made in
Plain, Sauk Co.
2007 open goat’s and cow’s
milk cheeses; Al
Bekkum is the
former head
cheesemaker and
buttermaker of
Mt. Sterling Goat
Cheese
Cooperative;
currently using
Cedar Grove
Cheese Plant in
Plain to produce
small batch,
artisan cheeses
35 Northwood Wonewoc before
1924
36 Old Country Cheese SE of Cashton 1983 open see website; has
tours; 230 Amish
producers, uses
fresh can milk

38 | P a g e
# on # on # on # on
MapMapMapMap
Cheese Factory or Cheese Factory or Cheese Factory or Cheese Factory or
Creamery NameCreamery NameCreamery NameCreamery Name
LocationLocationLocationLocation Year Year Year Year
OpenedOpenedOpenedOpened
Year Year Year Year
ClosedClosedClosedClosed
NotesNotesNotesNotes
37 Ontario Creamery Ontario
38 Otter Creek Cheese
Company
Ottervale,
Webster Twp.,
Sect. 14, Hwy D, 2
mi. N of 82
before
1924
39 Pasture Pride Cheese SE of Cashton 1982-3 open over 250 patrons;
Amish-founded
40 Pine River Richland County,
close to Hillsboro
41 Pleasant Ridge
Cheese Factory
Hamburg
Township
So. part of Twp.?
42 Portland Cheese
Factory
Portland, Monroe
Co.
1969 destroyed by fire
in 1969; merged
with Middle
Ridge Cheese
Factory in 1971
43 Readstown
Creamery
Readstown circa
1906
1988 founded as a
cooperative;
closed during
Depression--
bought and
reopened circa
1934 by Larson
Family

39 | P a g e
# on # on # on # on
MapMapMapMap
Cheese Factory or Cheese Factory or Cheese Factory or Cheese Factory or
Creamery NameCreamery NameCreamery NameCreamery Name
LocationLocationLocationLocation Year Year Year Year
OpenedOpenedOpenedOpened
Year Year Year Year
ClosedClosedClosedClosed
NotesNotesNotesNotes
44 Redmound Cheese
Factory
Redmound small amount of
cheese was sold
locally--most
went to Dairy
State brand in
Monroe; Donald
Green then
Winnie
Holverson
Cheesemakers
45 Retreat Creamery Retreat
46 Rockton Creamery
Company
Rockton before
1924
47 Romance Cheese
Factory
Romance in
1940’s
48 Ross Cheese and
Butter Company
Viola-Ross
Sect. 5, Liberty
Twp.
before
1924
49 Section 22 Co-op
Cheese
Company/Fariview
Cheese Factory
La Farge, Stark
Twp., Sect. 22
1919 Schmidt Bros. of
La Farge was
warehouse and
distrbutor for
Eastern Vernon
Co., including
Sect. 22
50 South Bear Creek
Coop Cheese
Association
La Farge, Sect. 35,
Hwy D and MM
before
1924

40 | P a g e
# on # on # on # on
MapMapMapMap
Cheese Factory or Cheese Factory or Cheese Factory or Cheese Factory or
Creamery NameCreamery NameCreamery NameCreamery Name
LocationLocationLocationLocation Year Year Year Year
OpenedOpenedOpenedOpened
Year Year Year Year
ClosedClosedClosedClosed
NotesNotesNotesNotes
51 Star Valley Star Valley,
Northern
Crawford County,
between Mt.
Sterling and Rising
Sun
52 Star Valley Cheese
Association
La Farge, Stark
Twp., Sect. 9, Old
131, near Reserve
before
1924
53 Stoddard Cheese
Factory
Stoddard early
1950’s
54 Sugar Grove Cheese
and Creamery
Company
Soldier’s Grove,
Kickapoo Twp.,
Sect. 13, on P
before
1924
Building now a
residence
55 Towerville Utica Twp.,
Crawford Co.
56 Trippville Hillsboro Twp.,
Sect. 8,
Cty F
57 Viroqua Co-op
Creamery
Viroqua 1904 1967 in 1967 merged
with Hiawatha
Valley in Sparta;
butter was
primary product--
also cheese and
powdered milk
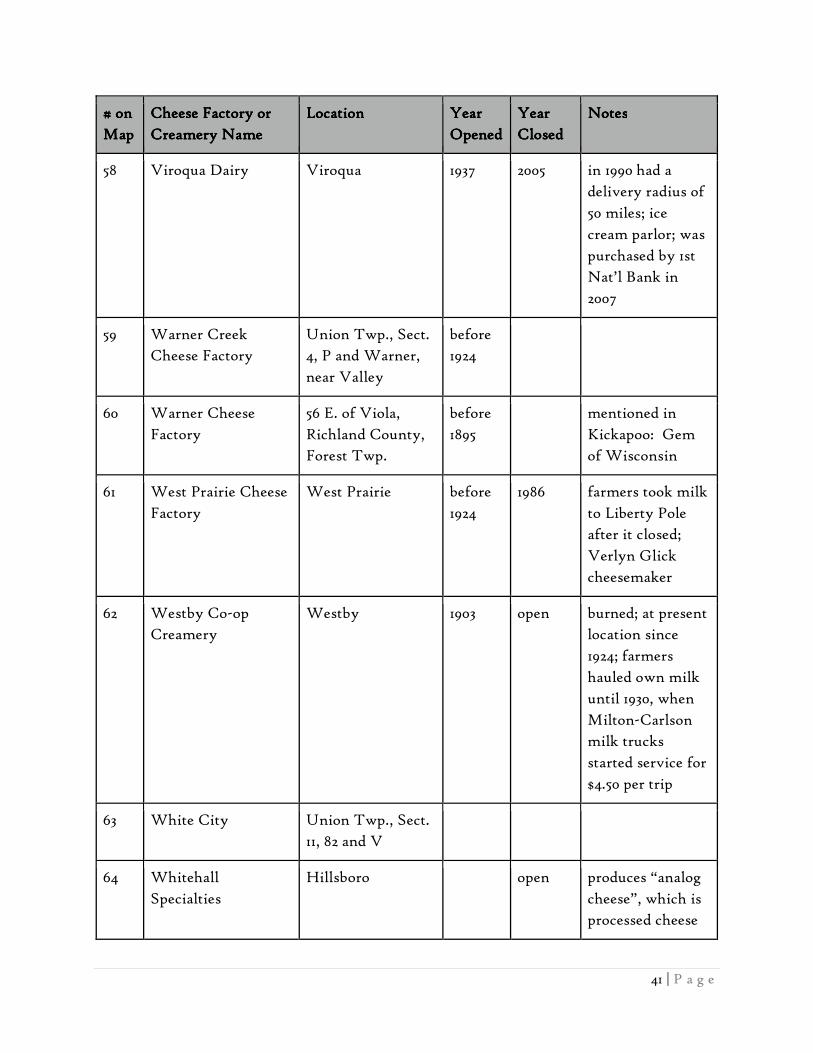
41 | P a g e
# on # on # on # on
MapMapMapMap
Cheese Factory or Cheese Factory or Cheese Factory or Cheese Factory or
Creamery NameCreamery NameCreamery NameCreamery Name
LocationLocationLocationLocation Year Year Year Year
OpenedOpenedOpenedOpened
Year Year Year Year
ClosedClosedClosedClosed
NotesNotesNotesNotes
58 Viroqua Dairy Viroqua 1937 2005 in 1990 had a
delivery radius of
50 miles; ice
cream parlor; was
purchased by 1st
Nat’l Bank in
2007
59 Warner Creek
Cheese Factory
Union Twp., Sect.
4, P and Warner,
near Valley
before
1924
60 Warner Cheese
Factory
56 E. of Viola,
Richland County,
Forest Twp.
before
1895
mentioned in
Kickapoo: Gem
of Wisconsin
61 West Prairie Cheese
Factory
West Prairie before
1924
1986 farmers took milk
to Liberty Pole
after it closed;
Verlyn Glick
cheesemaker
62 Westby Co-op
Creamery
Westby 1903 open burned; at present
location since
1924; farmers
hauled own milk
until 1930, when
Milton-Carlson
milk trucks
started service for
$4.50 per trip
63 White City Union Twp., Sect.
11, 82 and V
64 Whitehall
Specialties
Hillsboro open produces “analog
cheese”, which is
processed cheese
42 | P a g e
Sources:
1. Wisconsin History Highlights: Delving into the Past . By Jon Kasparek, Bobbie Malone,
and Erica Shock. Published by Wisconsin Historical Society Press. (2004)
2. Wisconsin: The Story of the Badger State. By Norman K. Risjord. Published by
Wisconsin Tales and Trails. (1995)
3. The Kickapoo Valley: The Gem of Wisconsin By Gertrude Frazier and Rose B. Poff.
Originally published in 1896. Reprinted by United Graphics for Friends of the Kickapoo
Valley Reserve. (2007)
4. Wisconsin Milk Marketing Board.
http://www.eatwisconsincheese.com/wisconsin/history_of_wisconsin_cheese.aspx. (2009)
5. Cheese: The Making of a Wisconsin Tradition By Jerry Apps. Published by Amherst
Press. (1998)
6. Viroqua Dairy: 1937-Present By Elizabeth O’Connor Steinbrenner. Self-published. (1999)
7. Viroqua’s Main Street History (1846-1996) Researched by Vic and Donna Navrstad.
Published by Vernon County Historical Society and New New Past Press, Inc. (2004)
8. Vernon County Agriculture: County Agricultural Statistics Series, Wisconsin. By
Wisconsin Crop and Livestock Reporting Service, U.S. Department of Agriculture, and
Wisconsin Department of Agriculture. (1946)
9. Wisconsin's Westby, 'Little Creamery That Could,' Marks 100th Anniversary.
http://findarticles.com/p/articles/mi_m0KFU/is_5_70/ai_110264926. (Sept.-Oct. 2003)
10. “Another Look at Vernon County Agriculture”. By Bill Werth. University of
Wisconsin-Extension. (1981)
Sources for Cheese Factory and Creamery List include: Vernon County Museum’s News-
clipping and Photo Collection “Cheese Factories”; Brad Steinmetz; John Sime; Chris
Larson; Dick Stillwell; Del Rae Wolfe; Biennial Report of the Dairy and Food
Commissioner of Wisconsin, 1924.
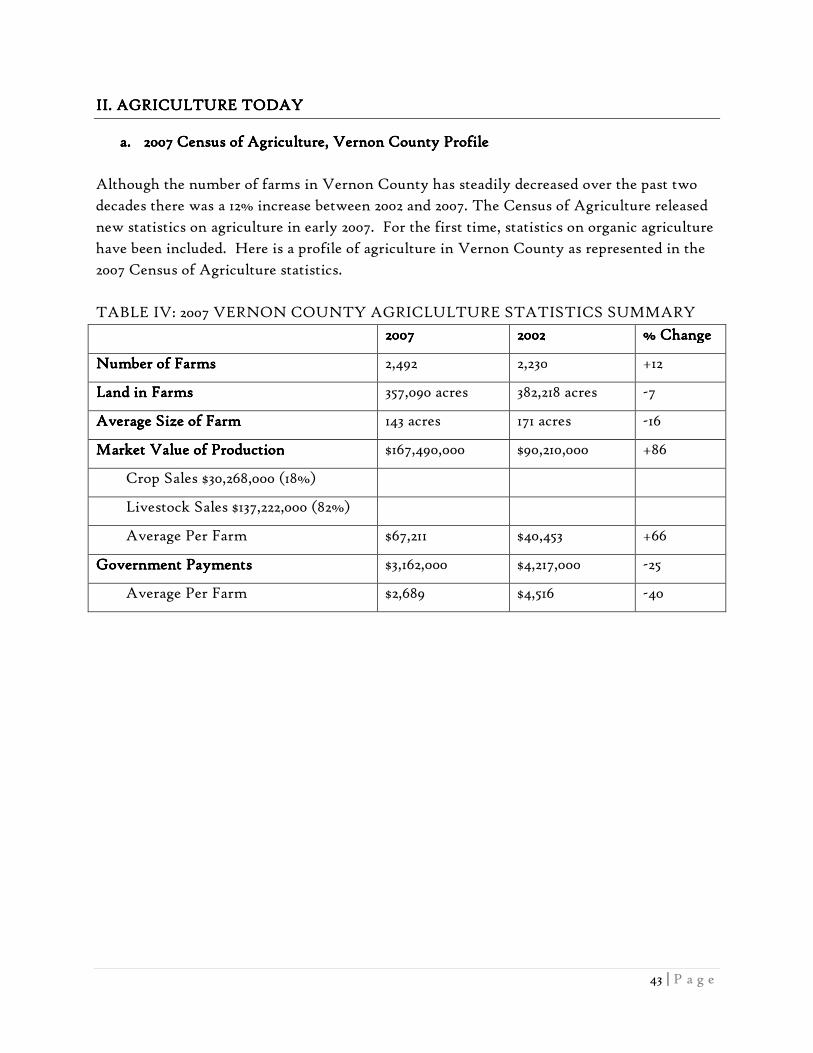
43 | P a g e
II. AGRICULTURE TODAYII. AGRICULTURE TODAYII. AGRICULTURE TODAYII. AGRICULTURE TODAY
a.a.a.a. 2007 Census of Agriculture, Vernon County Profile2007 Census of Agriculture, Vernon County Profile2007 Census of Agriculture, Vernon County Profile2007 Census of Agriculture, Vernon County Profile
Although the number of farms in Vernon County has steadily decreased over the past two
decades there was a 12% increase between 2002 and 2007. The Census of Agriculture released
new statistics on agriculture in early 2007. For the first time, statistics on organic agriculture
have been included. Here is a profile of agriculture in Vernon County as represented in the
2007 Census of Agriculture statistics.
TABLE IV: 2007 VERNON COUNTY AGRICLULTURE STATISTICS SUMMARY
2007200720072007 2002200220022002 % Change% Change% Change% Change
Number of FarmsNumber of FarmsNumber of FarmsNumber of Farms 2,492 2,230 +12
Land in FarmsLand in FarmsLand in FarmsLand in Farms 357,090 acres 382,218 acres -7
Average Size of FarmAverage Size of FarmAverage Size of FarmAverage Size of Farm 143 acres 171 acres -16
Market Value of ProductionMarket Value of ProductionMarket Value of ProductionMarket Value of Production $167,490,000 $90,210,000 +86
Crop Sales $30,268,000 (18%)
Livestock Sales $137,222,000 (82%)
Average Per Farm $67,211 $40,453 +66
Government PaymentsGovernment PaymentsGovernment PaymentsGovernment Payments $3,162,000 $4,217,000 -25
Average Per Farm $2,689 $4,516 -40

44 | P a g e
Cropland, 52.63%
Woodland, 28.87%
Other Uses, 5.15%
Pasture, 13.35%
Land in Farmsby Type of Land
Cropland
Woodland
Other Uses
Pasture
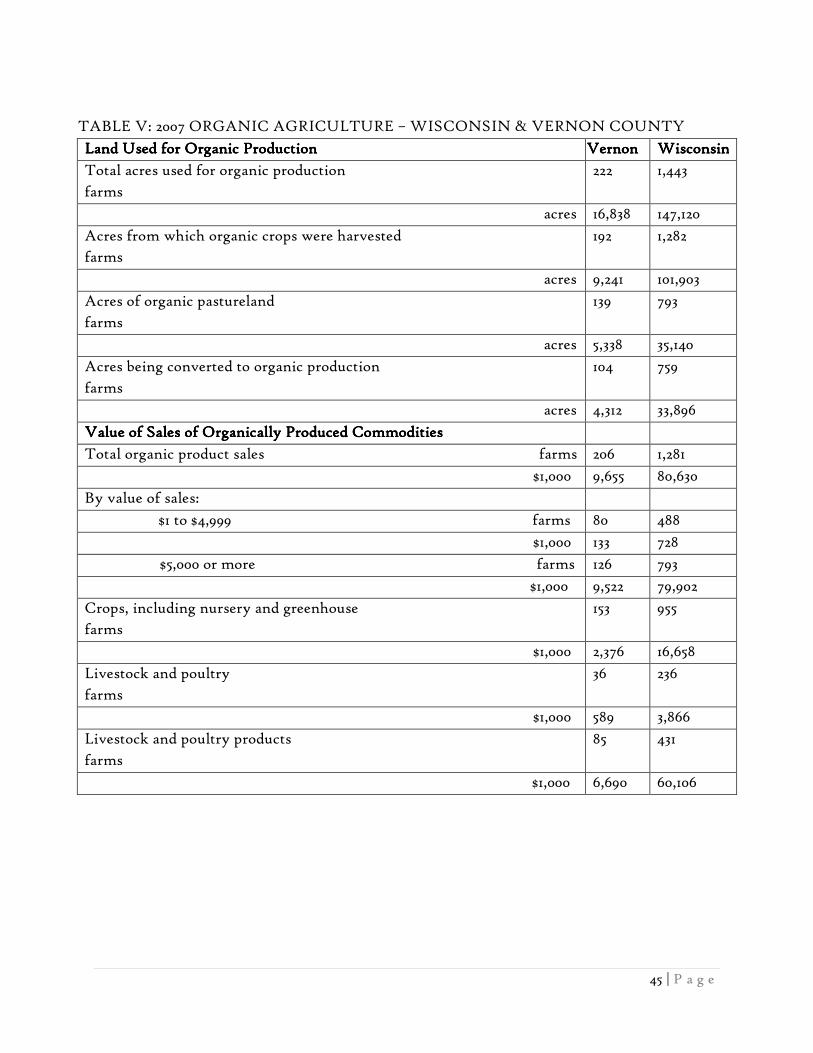
45 | P a g e
TABLE V: 2007 ORGANIC AGRICULTURE – WISCONSIN & VERNON COUNTY
Land Used for Organic ProductionLand Used for Organic ProductionLand Used for Organic ProductionLand Used for Organic Production VernonVernonVernonVernon WisconsinWisconsinWisconsinWisconsin
Total acres used for organic production
farms
222 1,443
acres 16,838 147,120
Acres from which organic crops were harvested
farms
192 1,282
acres 9,241 101,903
Acres of organic pastureland
farms
139 793
acres 5,338 35,140
Acres being converted to organic production
farms
104 759
acres 4,312 33,896
Value of Sales of Organically Produced CommoditiesValue of Sales of Organically Produced CommoditiesValue of Sales of Organically Produced CommoditiesValue of Sales of Organically Produced Commodities
Total organic product sales farms 206 1,281
$1,000 9,655 80,630
By value of sales:
$1 to $4,999 farms 80 488
$1,000 133 728
$5,000 or more farms 126 793
$1,000 9,522 79,902
Crops, including nursery and greenhouse
farms
153 955
$1,000 2,376 16,658
Livestock and poultry
farms
36 236
$1,000 589 3,866
Livestock and poultry products
farms
85 431
$1,000 6,690 60,106

46 | P a g e
b.b.b.b. Ken Meter Rural Economic StudyKen Meter Rural Economic StudyKen Meter Rural Economic StudyKen Meter Rural Economic Study
The following is an excerpt from Ken Meter’s
“Southwest Wisconsin Local Farm & Food
Economy” Study produced for the Valley
Stewardship Network.
SouthweSouthweSouthweSouthwest Wisconsinst Wisconsinst Wisconsinst Wisconsin Local Farm & Food Local Farm & Food Local Farm & Food Local Farm & Food
EconomyEconomyEconomyEconomy
Highlights of a data compilation
By Ken Meter, Crossroads Resource Center
(Minneapolis) for Valley Stewardship Network
October 24, 2008
This study covers Crawford, Monroe, Richland, &
Vernon Counties
Southwest WiscSouthwest WiscSouthwest WiscSouthwest Wisconsin region (Bureau of Economic Analysis, 2006)onsin region (Bureau of Economic Analysis, 2006)onsin region (Bureau of Economic Analysis, 2006)onsin region (Bureau of Economic Analysis, 2006)
106,559 residents receive $2.7 billion of income annually. Population is rising at about the
same rate as the state as a whole. Real personal income has doubled since 1969.
The region's farms (U.S. AgricultThe region's farms (U.S. AgricultThe region's farms (U.S. AgricultThe region's farms (U.S. Agricultural Census, 2002)ural Census, 2002)ural Census, 2002)ural Census, 2002)14141414
Land:
• 6,804 farms. This is 9% of Wisconsin's total.
• 3,108 (46%) farms are between 50 and 179 acres.
• 228 (3%) farms are less than 50 acres.
• 101 (1.5%) farms are 1,000 acres or more.
• Average farm size is 183 acres, 90% of the state average.
• The region has 1.2 million acres of land in farms.
• This amounts to 8% of the state's farmland.
• 496,000 acres of harvested cropland.
• 168 farms (2%) have a total of 6,342 acres of irrigated land.
• Average value of land and buildings per farm is $346,000. This is 75% of the state average.
Sales:
• $287 million of crops and livestock sold (2002). This is a decline of 7% from 1997.
• $68 million of crops sold (24% of sales).
14 The Food & Farm Initiative Steering Committee is working to update this report with 2007 Census of Agriculture Statistics.

47 | P a g e
• $218 million of livestock and products sold (76% of sales).
• The number of farms/ranches selling livestock, poultry and related products decreased 7%
from 1997 to 2002 (4,540 to 3,510), while the amount of livestock products sold fell 23%.
• 3,952 (58%) of the region’s farms sold less than $10,000 of products in 2002.
• 2,372 farms (34%) sold less than $1,000.
• 744 farms (11%) sold more than $100,000 of products.
• 85% of farm sales are made by 20% of farms, which sell more than $50,000 of products.
• 53% of the region’s farms (3,600 of 6,804) reported net losses in 2002.
• 48% of the region’s farmers collected a combined total of $14.7 million of federal
commodity support payments.
Dairy & Cattle:
• 3,862 (57%) ranches and farms hold an inventory of 230,000 cattle.
• The region holds 77,000 dairy cows, and 27,000 beef cattle.
• 1,581 farms sold $151 million of dairy products.
• This is a 28% decline in the number of farms (2,197 in 1997) and a 12% decline in sales
($172 million in 1997).
• 4,022 (68%) farms produce 793,000 tons of forage crops (hay, etc.) on 239,000 acres.
• 24% of region farms raise corn for silage.
• 102,000 cattle were sold in 2002 from 3,031 farms for total sales of $58 million.
• This is a 21% increase from 1997 sales of $48 million.
• The number of farms selling cattle fell 28% from 4,232 farms in 1997.
Other livestock & animal products:
• Hog and pig sales fell 86% from $10 million in 1997 to $1.4 million in 2002.
• The number of farms selling hogs and pigs fell 29% from 316 in 1997 to 225 in 2002.
• 237 farms sold $656,000 of sheep, lambs, and goats.
• 284 farms raise poultry, up 21% from 235 in 1997.
• Poultry sales total $1.3 million, up 17% from $1.1 million in 1997.
• 292 farms sold $1 million of horses in 2002.
Grains & oilseeds
• 2,745 (40%) farms raise corn.
• 29% of the region’s harvested cropland is devoted to corn.
• The region produces 20 million bushels of corn.
• 784 farms raise soybeans.
Vegetables & Fruits (some farmers state that Ag Census data does not fully represent fruit
production):
• 129 farms work 857 acres to raise vegetables.

48 | P a g e
• 31 farms raise 2,700 hundredweight of potatoes.
• The region has 92 farms with a total of 1,309 acres of orchards.
Tobacco
• 126 farms raise tobacco on 257 acres. This is 28% of the state’s tobacco farms, and 17% of
state acreage.
• Total production in the region is 570,000 pounds.
• Vernon County is the largest tobacco producing county in the region, with 78% of the
region’s production.
Direct and organic sales:
• 382 farms sell $2.1 million of food directly to consumers. This is a 9% rise in the number of
farms (352 in 1997) selling direct, and a 63% increase in direct sales from 1997 to 2002.
• Direct sales total 0.8% of total all farm sales, compared with a national average of 0.5%.
• 133 region farms sold organic foods ($4.9 million in sales). Vernon County was the regional
leader in organic sales, with $3.6 million.
Balance of Cash Receipts and Production Costs (BEA):Balance of Cash Receipts and Production Costs (BEA):Balance of Cash Receipts and Production Costs (BEA):Balance of Cash Receipts and Production Costs (BEA):
Southwest Wisconsin Region ranchers and farmers sell $386 million of food commodities per
year (average per year for the 13 years 1994-2006), spending $419 million to raise them, for an
average loss of $33 million each year. Note that these sales figures compiled by the BEA are
far higher than cash receipts recorded by the USDA Agriculture Census (above).
Overall, farm producers have lost $429 million since 1994. Farmers have earned a surplus only
one of the past 13 years. Nevertheless, 53% of the region's farms and ranches reported that
they lost money in 2002 (Ag Census). Southwest Wisconsin Region farmers and ranchers
earned $232 million less by selling commodities in 1969 than they earned in 2006 (in 2006
dollars).
Farmers and ranchers earn another $42 million per year of farm-related income — primarily
custom work, and rental income (thirteen-year average for 1994-2006). Federal farm support
payments are relatively small, averaging $21 million per year for the entire region for the
years 1994-2006. Forty-eight of the region’s farms collect federal subsidies.
Loss of income from livestock and dairy products is one of the key reasons for the decline of
the region’s farm economy. Farmers earned $624 million from selling livestock and products
in 1979; this had fallen to $289 million by 2006, a decline of more than half.

49 | P a g e
The region's consumers:The region's consumers:The region's consumers:The region's consumers:
Southwest Wisconsin Region consumers spend $231 million buying food each year, including
$131 million for home use. Most all of this food is produced outside the region. $2.1 million of
food products (one percent of consumer demand and 0.1% of farm cash receipts) are sold by
farmers directly to consumers.
Estimated change in net assets for all region households combined was a loss of $126 million
in 2006 (BLS).
Farm and food economy summary:Farm and food economy summary:Farm and food economy summary:Farm and food economy summary:
Farmers lose $33 million each year producing food commodities, and spend $135 million
buying inputs from external suppliers, for a total loss of $168 million to the region.
Meanwhile, consumers spend $208 million
buying food from outside. Thus, total loss to
the region is $376 million of potential wealth
each year. This loss amounts to 97% of the
value of all food commodities raised in the
region, and is also well more than the
amount needed to feed all residents.
If the region’s consumers purchased 25% of their food directly from farmers, it would
produce $33 million of new farm income each year — enough to offset current farm
production losses.
Southwest Wisconsin Region: markets for food eaten at home (2006):Southwest Wisconsin Region: markets for food eaten at home (2006):Southwest Wisconsin Region: markets for food eaten at home (2006):Southwest Wisconsin Region: markets for food eaten at home (2006):
millions
Meats, poultry, fish, and eggs $ 30
Fruits & vegetables 21
Cereals and bakery products 17
Dairy products 15
“Other,” incl. sweets, fats, & oils 48
County Highlights from the 2002County Highlights from the 2002County Highlights from the 2002County Highlights from the 200215151515 Agriculture Census:Agriculture Census:Agriculture Census:Agriculture Census:
Crawford CountyCrawford CountyCrawford CountyCrawford County
1,278 farms in 2002, up 12 percent from 1997.
15 The Food & Farm Initiative Steering Committee is working to update this report with 2007 Census of Agriculture Statistics.
Southwest Wisconsin Southwest Wisconsin Southwest Wisconsin Southwest Wisconsin Food System FactFood System FactFood System FactFood System Fact
Southwest Wisconsin (Monroe, Richland,
Vernon & Crawford Counties) loose a total of
$376 million every year due to current
commodity-driven agriculture methods and
food purchases from outside the region.

50 | P a g e
Government payments rose 61% from 1997 to 2002, to $3.2 million.
70% of the county’s 1,278 farms are 50 to 499 acres in size.
County farms sold $42 million of farm products in 2002, up 2% from 1997.
68% of county farm sales are livestock and products.
Most important farm product was dairy, with $18 million in sales.
$8.6 million of cattle and calves were sold by county farms.
$1 million of hogs and pigs were sold.
Crawford County ranks 9th in Wisconsin for fruit sales, with $3.2 million.
County farms sold $232,000 of vegetables.
41,000 acres of county farmland were devoted to raising forage crops.
Crawford has an inventory of 38,000 cattle.
Crawford County is the eight-largest goat-producing county in the state.
Monroe CountyMonroe CountyMonroe CountyMonroe County
1,938 farms in 2002, up slightly from 1997.
Government payments increased 103 percent from 1997 to 2002, to $4.2 million.
Nearly half of county farms are 50-179 acres.
Of the $103 million in farm products sold by county farms, 75% involved sales of livestock or
animal products.
Dairy products are the largest single item, with $53 million sold — half of county farm sales.
$20 million of cattle and calves are sold.
Monroe County ranks second in Wisconsin for fruit sales, selling $16 million.
$9 million of grains were sold.
The county ranks third in horse inventory.
Monroe County ranks 6th in Wisconsin in broiler chicken inventory.
Inventory of cattle and calves is 72,000.
68,000 acres of county land are devoted to forage crops.
Richland CountyRichland CountyRichland CountyRichland County
1,358 farms in 2002, up 6 percent from 1997.
Nearly half of county farms are between 50-179 acres.
Market value of farm production fell 18 percent from 1997 to 2002.
82% of farm sales are livestock and related products (including dairy).
Dairy sales total $30 million, 59% of total farm sales.
Cattle and calf sales total $9 million.
Grain sales total $6 million.
County farms sell $685,000 of fruit.
Vegetable sales are not reported by USDA to protect confidentiality.
Government payments increased 69 percent to $3 million.
Inventory of cattle and calves, including dairy animals, is 44,982.

51 | P a g e
Hog & pig sales are not reported, but the county is 9th-largest producer in Wisconsin.
50,800 acres of land are devoted to forage crops.
Corn for grain is planted on 25,600 acres.
Vernon CountyVernon CountyVernon CountyVernon County
2,230 farms in 2002, down 5 percent from 1997.
Market value of farm sales declined 5 percent from 1997 – 2002, to $90 million.
Livestock and dairy sales totaled $72 million, or 80 percent of county farm sales.
Dairy sales total $49 million, or 54% of county farm sales.
Sales of cattle and calves total $20 million.
Grain sales total $11.7 million.
$704,000 of vegetables are sold by Vernon County farms
Government payments rose 78% from 1997 to 2002.
Vernon County ranks third in Wisconsin for tobacco production.
The county ranks fourth in the state for horse production, and sixth for sheep and goats.
Vernon County is the seventh largest producer of hay and forage crops in the state, with
78,000 acres.
49,000 acres of county land are devoted to corn for grain, and 21,000 to soybeans.
State of WisconsinState of WisconsinState of WisconsinState of Wisconsin
The state has 77,131 farms, three percent less than 1997.
Nearly 30,000 of these farms (38%) are 50- 179 acres.
Farm product sales total $5.6 billion, down 3% from 1997.
70% of all farm sales are livestock and dairy products.
Government payments increased 65% from 1997 to 2002, to $247 million.
Wisconsin ranks 8th in the U.S. for livestock and products.
The state has 704,513 acres of corn for silage, the most of any state in the nation.
Wisconsin ranks first in the U.S. for “other” animals (other than cattle, pigs, sheep, goats,
horses).
The state ranks 2nd in acreage devoted to vegetable production, with 253,000 acres.
Sales of vegetables total $341 million, eighth in the nation.
Milk sales total $2.6 billion, second-largest in the U.S.
Wisconsin ranks 4th in the nation for acreage of forage crops.
Christmas tree sales total $23 million, sixth-largest in U.S.
The state ranks 8th in the U.S. for acres devoted to corn for grain.
Wisconsin has the ninth-largest inventory of cattle and calves in the U.S.
Sales of grains total $893 million.
Cattle and calf sales total $835 million.

52 | P a g e
Top 25 farm productTop 25 farm productTop 25 farm productTop 25 farm products in Wisconsin in 2006 [USDA Economic Research Service]s in Wisconsin in 2006 [USDA Economic Research Service]s in Wisconsin in 2006 [USDA Economic Research Service]s in Wisconsin in 2006 [USDA Economic Research Service]
$ millions$ millions$ millions$ millions
1 Dairy products $3,075
2 Cattle and calves 937
3 Corn 789
4 Soybeans 275
5 Greenhouse/nursery 245
6 Potatoes 212
7 Cranberries 143
8 Hay 130
9 Hogs 110
10 Broilers 66
11 Wheat 63
12 Corn, sweet 53
13 Chicken eggs 45
14 Beans, snap 37
15 Apples 22
16 Peas, green 16
17 Oats 10
18 Cabbage 8
19 Aquaculture 7
20 Honey 7
21 Cucumbers 6
22 Carrots 6
23 Strawberries 6
24 Onions 5
Note: Turkeys are also among the top 25 farm products in Wisconsin, but sales are not reported by
ERS to protect confidentiality.
Key data sources:
Bureau of Economic Analysis data on farm production balance
http://www.bea.doc.gov/bea/regional/reis/.com
Food consumption estimates from Bureau of Labor Statistics Consumer Expenditure Survey
http://www.bls.gov/cex/home.htm
U.S. Census of Agriculture
http://www.nass.usda.gov/census/.com
USDA/Economic Research Service food consumption data:
http://www.ers.usda.gov/data/foodconsumption/.com
53 | P a g e
USDA/ Economic Research Service farm income data:
http://ers.usda.gov/Data/FarmIncome/finfidmu.htm
For more information:
To see results from Finding Food in Farm Country studies in other regions of the U.S.:
http://www.crcworks.org/locales.html
To read the original Finding Food in Farm Country study from Southeast Minnesota (written
for the Experiment in Rural Cooperation): http://www.crcworks.org/ff.pdf
To view a PowerPoint presented in March, 2008, by Ken Meter at Rep. Collin Peterson’s (D-
MN) Minnesota agricultural forum, called the “Home Grown Economy”:
http://www.crcworks.org/crcppts/petersonkm08.pdf
To get a brief list of essential food facts, many of which are cited in the presentation above,
http://www.crcworks.org/foodmarkets.pdf
To link to further analysis of farm and food economies in the U.S.:
http://www.crcworks.org/econ.html
III. III. III. III. PROFILEPROFILEPROFILEPROFILESSSS OF AGRICULTURE ENTREPRENEURSHIPOF AGRICULTURE ENTREPRENEURSHIPOF AGRICULTURE ENTREPRENEURSHIPOF AGRICULTURE ENTREPRENEURSHIP
Organic Valley
Westby Creamery Cooperative
Keewaydin Organics
Harmony Valley Farm
Amish Community Farm
ORGANIC VALLEY FAMILY OF FARMSORGANIC VALLEY FAMILY OF FARMSORGANIC VALLEY FAMILY OF FARMSORGANIC VALLEY FAMILY OF FARMS
Staying Ture to a Cooperative’s RootsStaying Ture to a Cooperative’s RootsStaying Ture to a Cooperative’s RootsStaying Ture to a Cooperative’s Roots
(Reprinted with permission of Organic Valley)
Organic Valley began in 1988 with a group of
Wisconsin farmers who shared a love of the
land and a belief that a new, sustainable
approach to agriculture was needed in order for
family farms and rural communities to survive.
Frustrated by the loss of nearly 2,000 family
farms each week and the staggering number
threatened with extinction, these farmers set out to create a solution: organic agriculture.
With this mission in mind, the farmers formed CROPP Cooperative (Cooperative Regions
of Organic Producer Pools), which today is the largest organic farming cooperative in North
America with more than 1,300 farmer-owners in 32 states and one Canadian province. In
Vernon CountyVernon CountyVernon CountyVernon County Food System FactFood System FactFood System FactFood System Fact
CROPP Cooperative (Organic Valley
Family of Farms) is the largest organic
farming cooperative in North America.

54 | P a g e
addition to providing farmers a way to stay in business, organic agriculture fulfilled their
vision for a sustainable agriculture: Farming without antibiotics or synthetic hormones and
pesticides, pasturing animals, and ensuring the land would be preserved for future
generations.
Farmers: Farmers: Farmers: Farmers: Organic Valley represents more than 1,300 organic farmers in 32 states and one
Canadian province, up from 361 farmers in 15 states in 2002. Farmers by region are:
Heartland, 781; Northeast, 183; Northwest, 70; New England, 155; California, 18; and Rocky
Mountain, five. Farmers by type or “pool” are: Dairy, 1051; Produce, 122; Pork, 20; Poultry, 1;
Beef, 50; Egg, 69; Juice, 14; Soy, 12; Feed, 17. (Note: some farmers produce for more than one
pool.)
In order to market their products, CROPP created the more commonly known brand
Organic Valley. Organic Valley has become one of the largest organic brands in the nation,
offering milk, cheese, juice, eggs, spreads, produce, and soy, as well as meat labeled under the
sister brand, Organic Prairie Family of Farms. As the co-op continues to grow, they prove
that it is not necessary for a business to sacrifice people for profits: today, the cooperative’s
farmer-owners represent approximately 10 percent of the entire nation’s certified organic
farming community.
Despite Organic Valley’s growth, it remains true to its roots and unique business model. Part
of Organic Valley’s success is due to the fact that the farmer-owners pay themselves a stable,
sustainable pay price, which is set by a farmer board elected by the membership.
“The success of Organic Valley proves that organic agriculture can be a lifeline for America’s
struggling family farms,” says George Siemon, Organic Valley’s C-E-I-E-I-O. “In an era of
rising and falling agricultural prices, Organic Valley farmers can count on a stable, living
wage to stay in business on their land.”
Just as Organic Valley strives to support family farms, it is also committed to its local
communities. In 2004, Organic Valley chose to build its new company headquarters, which
accommodates approximately 250 employees, in La Farge, Wis., the small town the co-op has
called home since its inception. In 2007, they opened a distribution center in a neighboring
small town, Cashton, Wis. By maintaining relationships with businesses and other partners
nationwide, and contracting with production plants and shipping companies, Organic Valley
has minimized investment in “brick and mortar” while simultaneously supporting local
communities where their farmers live.
Being farmer-owned and independent has allowed Organic Valley to stay true to its original
mission of keeping family farmers farming. Organic Valley customers can be confident that
the food they purchase was produced under standards that meet and exceed the USDA

55 | P a g e
national organic standards by farmers who are stewards of the earth and at the heart of the
organic revolution.
Model: Model: Model: Model: Organic Valley provides its members with a stable, fixed annual pay-price, a rarity in
an industry where farmers’ paychecks typically reflect unpredictable, fluctuating markets. A
board of farmer-owners sets Organic Valley’s annual milk prices and oversees every aspect
of the organic process. They also uphold sustainable farming practices, such as pasturing
animals and treating them humanely, ensuring Organic Valley farmers meet and generally
exceed USDA organic requirements.
Sales: (2008) $527 million; Sales: (2008) $527 million; Sales: (2008) $527 million; Sales: (2008) $527 million; (2007) $432.5 million; (2006) $334 million; (2005) $245 million;
(2004) $208 million. In the past five years, Organic Valley’s total sales have increased 153
percent and its increases have consistently outpaced the food industry overall.
Employees: Employees: Employees: Employees: 500 employees work for CROPP at a number of locations including the CROPP
Headquarters in La Farge, Wisconsin; the Distribution Center in Cashton, Wisconsin; the
Butter Creamery in Chaseburg, Wisconsin; as well as the national sales team and farmer
support staff located nationwide.
WESTBY COOPERATIVE CREAMERYWESTBY COOPERATIVE CREAMERYWESTBY COOPERATIVE CREAMERYWESTBY COOPERATIVE CREAMERY
Maintaining Farmer ControlMaintaining Farmer ControlMaintaining Farmer ControlMaintaining Farmer Control (Researched and Written by Lori Harms, Food & Farm Initiative Steering Committee)
The Westby Creamery Cooperative is a farmer-owned and farmer controlled cooperative.
The 118 farmer patrons who currently own the cooperative provide all of the milk for the
creamery’s products. Most of the family-operated farms where the milk is produced are
located within 50 miles of Westby. The average herd size is 50 cows; no herds are very large.
Some farms are grass-based, some are certified organic and others are not. None of the cattle
on these farms is injected with recombinant bovine growth hormone (rBGH).
In 1992 the Westby Creamery Cooperative became independent of dairy giant Dean Foods.
The cooperative invested capital in their facilities, expanded production and developed the
familiar Westby Creamery Brand. They have recently formed a partnership to create the
organic brand Cultural Revolution. The creamery makes various products for ethnic and
specialty markets, such as Polish-formula yogurt, and does some milk processing for other
cooperatives.
The 60 employees of the Westby Creamery Cooperative produce cottage cheese, sour cream,
cheese, yogurt, curds and butter which gets to the consumer in a number of ways: the
Creamery Retail store, some local restaurants, local and regional food coops and grocers, and

56 | P a g e
through the food service industry. The Westby schools directly purchase some products;
Viroqua schools may do so this fall. Specialty products may be found in Michigan, Illinois
and New York. And of course the attendees of many local church, charity, non-profit and
school events benefit greatly from the generous donations from Westby Creamery
Cooperative patrons.
One hundred six years ago, 300 Vernon County farmers pooled their resources, skills,
knowledge and will to create an economic entity that has served the community to this day.
Over the years the many patrons of the Westby Creamery Cooperative have made decisions
that are rare in the world of dairy cooperatives: they have remained independent of big dairy
and maintained control of their product. The farmers have rather quickly responded to
consumer demands and concerns by rBGH and increasingly turning to organic and grass-
based production. Consumers are able to identify the source of their food, the one-hundred
eighteen dairy farms within fifty miles of Westby, Wisconsin.
Many thanks to Pete Kondrup, General Manager of the Westby Creamery Cooperative.
KEEWAYDIN ORGANICSKEEWAYDIN ORGANICSKEEWAYDIN ORGANICSKEEWAYDIN ORGANICS
A New Venture from an Old FarmA New Venture from an Old FarmA New Venture from an Old FarmA New Venture from an Old Farm (Reprinted with permission of the Viroqua Food Coop; minor updates added by Bob Goonin, Food & Farm
Initiative Steering Committee)
Keewaydin Farms was founded in 1976 as a dairy farm by Richard and Mary Hauke. They
were both city kids from the east side of the state who bought into the back-to-the-land
movement hook, line and sinker. They were further committed to the dream of farming after
traveling through this area in the early 70’s. After several years of searching, they discovered
a farm perched on a prominent ridge overlooking the eastern tributary valleys of the
Kickapoo River with beautiful views of the sunrise, storms, sunsets and the county night sky.
They farmed here till 1996 when they could no
longer sustain their farming dream. But they were
able to hold on to the land, and in 2004 after several
years of traveling and ski-bumming, their children
Jessica, Jacob and Rufus returned to the home farm
to make a family farm again. Now known as
Keewaydin Organics, they market and distribute not
only their own produce but that of 15 other local
farms as well.

57 | P a g e
How does the new venture work – Is it a coop?
Rufus - In December 2007 (when produce farmers have some time on their hands) we started
connecting with several farmers in the area who were looking for more markets. The
conversations started sooner with one of our farms in particular, the Thimmesch Farm,
whose owners Jason and Jennelle lived and worked on our farm last year before purchasing
their own farm in the Avalanche area. Once winter set in though, we were finally able to
focus on several more farms and after holding meetings around the area, the business began.
Currently we are not a co-op, though we do cooperate in ways and will continue to do so. For
now everyone sees satisfied with the current business arrangements. To us the most
important aspect of our business is that we are small family-run farms, raising a diversity of
crops and tending livestock as well. All the farms we work with are certified organic and are
within 20 miles of the Viroqua Food Co-op.
What are the benefits to you & the other farmers?
Rufus - I decided to try this because I have been fortunate enough to have more market
demand than I was able to supply and wanted to share that with other farmers. I have been
committed to farming no more than 10 acres of market garden because I see this as a
sustainable level of farming both for our land and our time. The benefit for me is that I get to
share my markets with other farmers; I get to visit their operations and learn how others are
farming. I help (hopefully) provide a more stable supply of local, organic product to meet the
growing demand for food produced in our neighborhood. For the other farms I am providing
a more diverse marketing base, increasing the amount of money that makes it back to our
farmers and teaching them about new crops they could grow for this ever-expanding market.
Who are the other farmers that make up Keewaydin Organics?
Rufus - The farmers I am working with are all from the local area, some Amish, some not.
They all operate beautiful little family farms nestled in quaint valleys and ridges with names
like Cozy Hollow, Pristine Valley, Little Ridge, or EZ Farming. These are the types of farms
lots of marketing people would like consumers to think of when they buy their products, but
rarely exist anymore in the modern farming world. They are farms where the cows or sheep
still graze on pastures, where families can be seen working gardens together, where in some
cases horses still work the land.
When I first started visiting these farms I was amazed at how beautiful these places are, as
someone who has grown up in the area and have seen the Amish working the fields from afar

58 | P a g e
it has been an awaking for me to see these farms up close. I’ve even gotten to drive a team of
horses as they disked up a field. The silence and pace of work was breathtaking.
What has the experience been like so far?
Rufus - So far the experience has been quite positive. I have made many new friends in the
farming world and learned many new techniques of farming I would never would have
thought about. Many of these farmers have been farmers their entire lives and are well
versed in what they are doing. Many have been saving their own seed for years or growing
gardens their whole lives.
Of course with everything there are negatives, such as the amount of driving I have been
doing this year. We joke around at Keewaydin Farms that I’m more of a window farmer
these days. I would honestly like to get back to farming my own land more, but I know that
will happen in due time, starting a new business requires patience and the ability to put off
some of your wants until another day. Other negatives involve just general rookie mistakes
that any person starting a business is bound to run into, making sure you are constantly
looking at the numbers, doing your homework and watching the summer fly by as your
friends are out floating on the Kickapoo River. And then there is the sleep factor; sometimes
the nights get long and sleep can be a precious commodity. All of those things are minor
though, compared to the friendships I’ve made and life lessons I’ve learned.
Where the heck do you find the time for your own farming?
Rufus - Luckily for me I have a wonderful wife and crew that have made it possible for me to
do what I am doing. I sneak out to the garden when I can with cell phone in hand. I’m
looking forward to more gardening time this fall when things slow down. We are in the
process of putting up a couple greenhouses to extend our season as long as possible.
What is your plan for Keewaydin Organics next year?
Rufus – I hope to continue next year, though one never really knows what the future will
bring. There will definitely be changes and that is one thing I have always tried to
communicate with everyone. We must always be ready to face the changes that present
themselves to us. As long as we have the support of the community and people who support
small organic farmers with their food dollars we are bound to be successful.

59 | P a g e
HARMONY VALLEY FARMHARMONY VALLEY FARMHARMONY VALLEY FARMHARMONY VALLEY FARM
OrganicOrganicOrganicOrganic, Local and Wholesome Year, Local and Wholesome Year, Local and Wholesome Year, Local and Wholesome Year----round!round!round!round! (Researched and Written by Sara Martinez, Food & Farm Initiative Steering Committee)
Richard de Wilde of Harmony Valley Farm explains that his family-owned farm has grown
over its 25 years with the expanding market for organic vegetables for consumers in the
Upper Midwest. Harmony Valley Farm’s home farm of 200 acres lays along Spring Creek
and additional leased acres of farmland border the nearby Bad Axe River. Well-managed
organic production of an incredible diversity of fresh market vegetables, integrating a
healthy, natural environment is fundamental to the farm’s mission as well as economic
success. Harmony Valley Farm strives to improve
soil life and fertility through a system of cover-
cropping and application of compost and minerals.
Customers benefit from great-tasting vegetables
and superior nutrition, and they come back for
more every year as subscribers to the Community
Supported Agriculture (CSA) operation. 100 acres
of vegetables are the mainstay of the farm.
Harmony Valley Farm also collaborates with local
farmer Jim Munsch to offer Grazier’s Organic
Beef. Once weaned at twelve months of age on
Jim’s farm, near Coon Valley, the cattle are
rotationally grazed on 60-80 acres of pasture at Harmony Valley Farm.
CSA boxes are provided to members nine months of the year, May-January. With upwards
of 1,000 CSA boxes to fill and deliver per week during peak vegetable season, Harmony
Valley Farm depends on and honors its employees’ contributions. Wholesale distributors
and a few regional restaurants are also among the farm’s customer base. The Dane County
Farmer’s Market hosts a stand for the farm too. Harmony Valley Farm employs 12-15 people
year-round and 40 people during peak farm labor times. Employees are provided chef-
prepared meals, made with the farm’s vegetables and pasture raised meats.
A top-quality market produce operation like Harmony Valley Farm requires not only
significant labor inputs, but also washing, cooling, and storage infrastructure. As the
business and demand for organic, high quality vegetable and fruits has expanded,
infrastructure has been developed deliberately and successfully. Food cooperatives as far as
the Twin Cities display Harmony Valley Farm’s lovely produce year-round and it is proudly
labeled as regionally-produced; often Harmony Valley Farm’s fare are the only organic
vegetables not grown on the West Coast offered for sale in the winter. Harmony Valley
Farm’s means of distribution include ownership and operation of two 20-24 foot refrigerated

60 | P a g e
freight trucks and the use of regional trucking services. The trucks deliver primarily CSA
orders and farmers’ market stock. Wholesale products are included on trips as needed to
maximize efficient use of the transportation. Harmony Valley Farm’s shipping stalls also
serve as a consolidation point for other local organic vegetable farms to distribute their
produce to locations in Minneapolis, Madison, and locations in between. Interestingly,
transporting food to markets in the Twin Cities is easier than servicing Madison buyers,
even though Madison is much closer. “Distribution is a challenge,” says Mr. De Wilde.
Mr. De Wilde says that another more obvious challenge for the farm was the area’s flooding
in 2007 and 2008, “We have some raised beds, but there’s only so much they can cope with.”
Floods caused crop and soil loss, weeds to wash in, and the need to replace fences. The farm
provided weekly news updates about the flooding and its impact on the farm through their
CSA newsletter. CSA members from across Wisconsin and into Minnesota were supportive
and understanding of the consequences of major flooding during peak vegetable season and
have remained loyal customers.
The downturn in the economy is also on Mr. De Wilde’s mind as the farm gets organized for
the planting season. Harmony Valley Farm is planning on maintaining its current CSA
member base. Mr. De Wilde is also concerned about local food security and the quality of
food provided to Vernon County residents, especially residents fed in schools and nursing
homes. “Those are the people that need nutritious food most.” He also shares his belief that
the county would benefit from a processing facility that could utilize high quality,
wholesome, and locally-produced foods. He thinks a processing facility would create local
jobs and capacity for businesses like his to prepare value-added nutritious foods. It also could
be a site for processing local foods for use at institutions year-round.
AMISH COMMUNITY FARM AMISH COMMUNITY FARM AMISH COMMUNITY FARM AMISH COMMUNITY FARM –––– MARY & PERRY GLICKMARY & PERRY GLICKMARY & PERRY GLICKMARY & PERRY GLICK
Mutual Benefits of local Food Movement ProgressMutual Benefits of local Food Movement ProgressMutual Benefits of local Food Movement ProgressMutual Benefits of local Food Movement Progress (Researched and Written by Becky Comeau, Food & Farm Initiative Steering Committee)
On a 44-acre farm in the rolling hills south of Viroqua, Mary and Perry Glick and their 7
sons, grow 13 acres of organic produce. They noticed a change when they arrived from a
smaller farm in southeast Minnesota: people nearby really appreciate their produce. Perry
says that growing organic has definitely opened markets to them. They would not be able to
sell as much direct to consumers if they were growing conventionally. They are able to sell
some of their first quality produce to Organic Valley, and the seconds and thirds sold well
last year, too. Demand for locally grown produce is increasing steadily.
61 | P a g e
The Glick family is part of a large Amish community in the county. Wisconsin is home to
over 15,000 Amish people (the state ranks 4th in the nation.16) and the statewide population
has been increasing at the rate of approximately 6% per year. Vernon County is fortunate in
many ways to have a thriving Amish community, and it seems there is mutual benefit. The
“Englishers” are gobbling up the fantastic food that the very able Amish producers bring to
market.
One weekday, late morning, finds the kitchen abuzz with activity: several women are
preparing food in the large, warm kitchen. Several freshly baked loaves of bread and a half
dozen pies are cooling; the table is set for 15 or so people. Grandmother Lydia remembers a
previous visit with Sara, a neighbor English woman who has come to facilitate the interview,
and remembers the names and ages of her children. She takes time to talk and ask me
questions, helping to make me feel very welcome and comfortable in my first-ever visit. It
does remind me a bit of my own grandmother’s home, many years ago. In the next room,
several younger women are busily hand-stitching an intricate and brightly colored quilt that
they will sell to someone in Iowa. The extended family and community clearly work and eat
together, and at the same time are welcoming to their visitors. We arrange to return the
following week to talk about their farm and food production activities.
Small vegetable farms are cropping up around Vernon County and the seasonal farmer’s
market of Viroqua recently expanded to an indoor winter market. The Amish community
has played a significant role in this new endeavor. They are major participants in the
thriving local food movement, and take a very active interest in the process. As we settle
into the living room for our interview, Mary and Perry share their experience and
perspective on this growing food market.
They are a group of 10 families, and another one will be added to the congregation this year.
Some of their farms are over 100 acres. They work together informally to share knowledge
and trade amongst themselves. “Sharing, that’s the way to go” sums up their community
approach. In fact, someone they know had shared with them some very large fish they’d
netted near Ferryville, which were stored frozen on their front porch. Also, someone shared
some hickory nuts which Mary made into a (very delicious) pie, which she shared with me.
This went very well with the tea that Perry brewed in a large pot and shared with us. He
made it from his own raspberry leaves, nettles and other things.
They find it concerning that so many small farms have disappeared over the years. That is
definitely “going in the wrong direction” they tell me. Perry told a story about someone he
knows seeing a very large milk tanker with license plates from Idaho; the driver told them it
came from a farm with 25,000 cows, which was going to expand to 50,000. Those cows are
16 “Amish Population by State (2008).” Young Center for Anabaptist and Pietist Studies, Elizabethtown College. http://www2.etown.edu/amishstudies/Population_by_State_2008.asp

62 | P a g e
turned over every 2 years, a very different scene from the pasturing care Perry’s cows are
given. Those cows are with them for many years. He has a hard time imagining how hard it
is on those thousands of confined cows.
It seems their gardening experience has come largely through Mary, who learned from her
mother. She is very curious and tries new things. For example, she was starting her sweet
potato slips in jars this week, and decided to try rooting ginger the same way. Also, she and
Perry are very interested in using their greenhouse year-round as a season extender, and they
asked to borrow Sara’s book about hoophouses. They talked about learning from mistakes,
and the valuable lessons that come from that. They have been learning a great deal from Mat
and Kate Eddy's who operate Ridgeland Harvest farm just up the road and they describe as
expert organic growers.
Last year (2008) for the first time the Glick’s had no trouble selling even their 2nds and 3rds,
which previously ended up as feed for their animals and compost. New markets are opening
to them as well. They have been meeting this winter, every 2 weeks, with Jenny Borchardt,
who is arranging to sell their produce to chefs in Chicago where she lives. Jenny also has a
farm outside Viroqua and is learning from these farmers, such things as how to grow from
seed. Jenny tells them that there is a very large expanding market in Chicago. She will be
bringing a truck to pick up and haul their produce. Apparently the word is getting out
amongst chefs and eaters in Chicago, and more of them want this “local” produce. In their
meetings with Jenny, they are planning who will grow which items.
They have seedlings in the spring and produce throughout the summer. They will be
starting their onions (from seed!) next week. They grow heirloom and open-pollinated
varieties. Mary is very fond of her “Aunt Mary” variety of tomato, which came from, you
guessed it, her aunt Mary. They also grow a small stuffing pepper that is an Amish special.
Mary is spending time browsing her Bakers Creek (Missouri) seed catalogs, and reading the
stories of the various varieties. They also buy from Seed Savers exchange in Iowa. But, as
much as they can, they save their own seed.
One area that they have questions about is pricing. For example, they sold turkeys last year
for around $2 per pound. They could have sold more. They don’t want to be greedy, but
want to know what is a fair price. That’s a good question, one faced by many diversified
farmers in the area.
Vernon County has a major “asset” in this curious and open-minded group of Amish people.
The mutual sharing of knowledge and produce is a benefit to all.
63 | P a g e
CHAPTER IV.CHAPTER IV.CHAPTER IV.CHAPTER IV.
A PROFILE OF FOOD RESOURCESA PROFILE OF FOOD RESOURCESA PROFILE OF FOOD RESOURCESA PROFILE OF FOOD RESOURCES
1. FARMERS MARKETS
2. COMMUNITY GARDENS
3. CHARITABLE FOOD PROGRAMS
i. Senior Meal Sites
ii. Food Pantries
iii. Food Stamp/Foodshare
iv. WIC
4. GROCERY & RETAIL FOOD OUTLETS
5. RESTAURANTS
6. COMMUNITY SUPPORTED AGRICULTURE (CSAs)
(Written by Dani Lind, Food & Farm Initiative Steering Committee)
I. FARMERS MARKETSI. FARMERS MARKETSI. FARMERS MARKETSI. FARMERS MARKETS
Viroqua Partners (a collaboration of the Viroqua Revitalization Association & Chamber of
Commerce) hosts an outdoor farmers’ market at the Viroqua Wisconsin Technical College
every Saturday from the last weekend in May through October. It features over 50 farmers
and vendors from Vernon and surrounding counties. There is also an indoor market in the
winter months across the street at the Main Street Station.
Other smaller yet notable Vernon County famers markets are located in Westby, Hillsboro
and Desoto. In addition, Coon Creek Produce & Meats manages a summer produce stand
weekdays across from the north side Kwik Trip in Viroqua.
II. COMMUNITY GARDENSII. COMMUNITY GARDENSII. COMMUNITY GARDENSII. COMMUNITY GARDENS
A community garden is a piece of land made available to individuals, families, or
organizations to grow produce for consumption, sale or donation. There may or may not be a
rental charge for use of this land.
The number of community gardens in Vernon County is very limited, perhaps because as a
farm community most people wishing to grow a garden probably have a relative or friend
that can provide space.
• The only rent-free community garden is offered by Tom Wilson on the northeast
side of Viroqua. It is about 1/4 acre. The only requirement is that organic gardening
methods be used.

64 | P a g e
• The City of Viroqua hosts a community garden at “Well 4”. The rent for a plot is
$15/year, registration at City Hall.
• Human Services Department uses a plot of the Vernon County Farm to provide
youthful offenders gardening experience to fulfill their community service obligations
The produce grown is donated to various churches and food pantries.
• Family and Children’s Center maintains a vegetable garden for school age behavioral
health clients.
• Some of the area schools have programs which are similar to community gardens:
o Viroqua Area Schools has an active FFA program. This includes a 4-acre
orchard on the southwest side of Viroqua, greenhouse-raised bedding plants
each spring and greenhouse-raised tomatoes November through January. This
produce is offered for sale to school personnel.
o De Soto Area Schools has a learning vegetable, herb, and flower garden at
Prairie View Elementary School near Retreat.
o Pleasant Ridge Waldorf School uses a 1/4 acre plot near the school which is
used to teach agriculture classes. A small portion of the produce is used in their
school hot lunch program.
o La Farge School District has a couple of acres made available by Organic
Valley Family of Farms used by various school organizations for fund raising.
o Youth Initiative High School in Viroqua has an Agriculture Program.
Students have used land at Jacob Hundt’s for food production.
III. CHARITABIII. CHARITABIII. CHARITABIII. CHARITABLE FOOD PROGRAMSLE FOOD PROGRAMSLE FOOD PROGRAMSLE FOOD PROGRAMS
1. Vernon County Senior Meal Sites1. Vernon County Senior Meal Sites1. Vernon County Senior Meal Sites1. Vernon County Senior Meal Sites
Those Vernon County residents who are 55 or older can contact the Vernon County Unit on
Aging for program information.
Chaseburg: Tippy Toe Inn (M-Th)
307 Depot St. Chaseburg 483-2119
Coon Valley: Fjord Bar and Food (M-Th)
404 Central Ave. Coon Valley 452-2278
De Soto: Bright Spot (M-Th)
118 Mill Park De Soto 648-3514
De Soto: Prairie View Elementary School (M-Th)
E3245 Cty. Rd. N De Soto 648-2227

65 | P a g e
Hillsboro: Parkview Apartments (M-Th)
Hill Ave Hillsboro 489-2780
La Farge: Kickapoo Haven (T-F)
106 W. Main La Farge 625-2202
Ontario: Speakeasy Cafe (T-F)
201 Garden Ontario 337-4577
Readstown: Valley View Apartments (M-Th)
520 N. 4th St. Readstown 629-5442
Stoddard: Valley Apartments (M-Th)
350 Elm Dr. Stoddard 457-2219
Viroqua #1: Viroqua Senior Center (M-Th)
220 N. Main Viroqua 637-3529
Viroqua #2: Park View Manor (M-Th)
200 Park View Ct. Viroqua 637-2626
Westby: Westby Community Center (M-Th)
206 N. Main Westby 634-2699
2. Food Pantries2. Food Pantries2. Food Pantries2. Food Pantries
The following is a list of food pantries that provide emergency food assistance to Vernon
County residents. Each pantry has different times of operation and requirements to
participate. Four pantries (New Hope, Good Samaritan, Living Faith, and Bethel Butikk)
rely on TEFAP (the federal Emergency Food Assistance Program, administered through the
Westby CouleeCap office, 634-3104) for about half of their inventory. The rest rely solely on
community donations.
DeSoto: New Hope United Methodist Church
E2290 Hwy 82 (location); E 1421 Hwy 82 (mail) De Soto 54624; 648-2644
Hillsboro: First Congregational Church
620 High Ave. Hillsboro 54634; 489-2492

66 | P a g e
Hillsboro: Good Samaritan
128 Mill St. (location); POB 389 (mail) Hillsboro 54634; 489-2492 or 489-3627
LaFarge: La Farge Free Methodist Church
214 S. Cherry St. LaFarge 54639; 625-4197
Stoddard: St. Matthews Evangelical Lutheran Church
303 N. Main St. Stoddard; 457-2711
Viroqua: Good Shepherd Lutheran Church
504 S. Main St. Viroqua 54665; 637-3978
Viroqua: Living Faith Church
852 N. Main St. Viroqua 54665; 637-7470
Westby: Bethel Butikk
341 Black River Ave. Westby 54667; 634-3473
Westby: Salvation Army Vernon County
314 Black River Ave. Westby 54667; 634-3473
3. State Food Stamp/FoodShare Benefits3. State Food Stamp/FoodShare Benefits3. State Food Stamp/FoodShare Benefits3. State Food Stamp/FoodShare Benefits
FoodShare benefits are administered through the Vernon County Human Services office at
E7410 County Road BB (637-5210). Benefits have been steadily rising, with the monthly
average number of recipients in Vernon County growing from 686 in 2000, 1,057 in 2004, to
1,733 in 2008.
The following is a list of stores and farms that accept Food Stamps in Vernon County:
Walgreens 517 North Main St. Viroqua
Viroqua Food Cooperative 609 North Main St. Viroqua
Village Market 1230 North Main St. Viroqua
Wal-Mart 1133 North Main St. Viroqua
Harmony Valley Farm S3442 Wire Hollow Viroqua
Kwik Trip 603 South Main St. Viroqua
Kwik Trip 520 North Main St. Viroqua

67 | P a g e
Dollar General 93 Swiggum Westby
Hansons IGA 419 North Main St. Westby
Bloomingdale Community Foods E8959 Ridge Road Westby
Dollar General 1231 Water Ave. Hillsboro
Hillsboro County Market E18590 Hwy 33/82 Hillsboro
Kwik Trip 229 Mill St. Hillsboro
Small Family CSA S2958 W. Salem Ridge Rd. La Farge
Bergums Food Market 101 North Maple Street La Farge
Kwik Trip 202 Main St. Stoddard
Kwik Trip 308 Central Ave. Coon Valley
Viola Natural Foods Coop 110 Commercial St. Viola
4. WIC4. WIC4. WIC4. WIC
WIC stands for Women Infants & Children, a federal USDA program that provides grants
to states for supplemental foods, health care referrals, and nutrition education for low-
income pregnant, breastfeeding, and non-breastfeeding postpartum women, and to infants
and children up to age five who are found to be at nutritional risk. WIC benefits are
administered through the Vernon County Human Services office in Viroqua (637-5210 or
637-5251). Vernon County staffs satellite clinics in Hillsboro, Coon Valley, Ontario and
DeSoto.
WIC participation in January of 2008 was 752. The average monthly number of participants
in 2007 was 680. These numbers represent individuals not families. According to Vernon
County Human Services over 45% of the low-income persons in Vernon County receive
WIC benefits. Vernon County has the ability to provide WIC benefits to 100% of the
county’s eligible residents. The number one participant criticism is the fact that the program
does not cover the purchase of organic food products.
WIC provides farmer’s market vouchers for the purchase of fresh fruit and vegetables from
participating farmer’s market vendors during the summer months.
WIC Retailers:
• Most grocery stores (Wal-Mart, Village Market, IGA Westby) except for the
Viroqua Food Coop because a % of total stock is not organic.
68 | P a g e
• Farm Stands (2-3 in 2007)
• Viroqua and Hillsboro Farmers Market
o June 1st – October 31st
o Must have a farmer’s market voucher
o Only fresh veggies
Eligible Food Products: (no produce or fruit)
• Cereals
• Juice
• Dried Bean, Lentils, Peas (no fresh or frozen)
• Peanut Butter
• Cheese (no specialty, goat cheese or deli cheese)
• Eggs (no organic, natural, cage free or free range)
• Milk (no organic, soy, rice)
• Formula
• Infant Cereals
IV. GROCERY AND RETAIL FOOD OUTLETSIV. GROCERY AND RETAIL FOOD OUTLETSIV. GROCERY AND RETAIL FOOD OUTLETSIV. GROCERY AND RETAIL FOOD OUTLETS
Many area grocers offer at least a small amount of local foods, but most of them do not label
them as such, so interested shoppers may have to hunt for them. The exception to this is the
Viroqua Food Co-op, who is committed to buying locally produced foods whenever possible
as part of their mission and utilize special ‘local’ signage to make identification easy.
Organic Valley, Westby Co-op Creamery, and Pasture Pride run retail outlet stores in
LaFarge, Westby, and Cashton respectively. The Cashton Produce Auction between Cashton
and Hillsboro is open to the public and specializes in locally grown or produced fruits,
vegetables, and baked goods. There are also many Amish homesteads scattered across the
county that are open to the public and sell eggs, produce, and baked goods. One Sun Farm
and Bakery (637-6895) off of Highway 56 outside of La Farge also runs a retail store featuring
their produce, meats, home-made pizzas and other local products. Artos Bakery at the Main
Street Station in Viroqua sells their made-from scratch bread, baked goods, and local farm
products.
IV. RESTAURANTSIV. RESTAURANTSIV. RESTAURANTSIV. RESTAURANTS
There are several area restaurants that offer locally sourced food to some degree on their
menus. The most commonly seen foodstuffs are dairy products from Westby Co-op
Creamery, local seasonal produce, and meat from local lockers. Most restaurants do not
advertise their use, if any, of local products – customers must ask if interested. However,

69 | P a g e
The Driftess Café, the Viroqua Food Co-op Deli, and Sibby’s Organic Zone – all in Viroqua
– are dedicated to buying locally produced food as much as possible.
VI. COMMUNITY SUPPVI. COMMUNITY SUPPVI. COMMUNITY SUPPVI. COMMUNITY SUPPORTED AGRICULTUREORTED AGRICULTUREORTED AGRICULTUREORTED AGRICULTURE
Community Supported Agriculture forges mutually committed relationships between local
households and farms producing fresh food. Household members support the farm by paying
an annual fee in the beginning of the season (when most farmers are typically cash-poor)
that entitles them to a "share" of the season's harvest, be it bountiful or not. During the
season, members pick up a weekly box of fresh foods (which may include produce, fruits,
cheeses, eggs, meats, poultry, flowers, herbs or preserves) at the farm or centralized drop-off
locations.
There are a couple of opportunities for households to reduce the cost of a CSA membership.
MACSAC (Madison Area Community Supported Agriculture Coalition) runs a CSA cost-
share program called Partner Shares for low-income households. Only CSA’s that are a part
of MACSAC are eligible. Applications and a list of participating farms are available at
www.macsac.org or by calling (608)-226-0300. Additionally, several health care providers and
HMO’s offer rebates to members for eligible CSA shares. MACSAC has a list of these also
available on their website.
Vernon County is rich in CSA farms that service both local and regional communities. The
following is a list of CSAs currently servicing Vernon County. Although we have made our
best effort to create an exhaustive list for 2009, we cannot guarantee that the following list is
complete, as new farms crop up every year.
Bella Sol Organics (Janice Blair)
Grass-fed beef and pork, chicken, turkey, ducks
S5868 Olson Ln. Viroqua
637-6727 www.blackberryridgellc.com
Driftless Organics (Josh and Noah Engel)
Vegetables, sunflower oil, grass-fed beef
50561 Cty. Rd. B Soldiers Grove
734-3711 www.driftlessorganics.com
Driftless Farm (Amelia Baxter)
Vegetables, salsas, honey
E2890 Lorenz Rd. Stoddard
452-2315 www.driftlessfarm.net

70 | P a g e
Harmony Valley (Richard de Wilde)
Vegetables, berries, grass-fed beef
S3442 Wire Hollow Rd. Viroqua
483-2143 www.harmonyvalley.com
Keewaydin Farm (Rufus Haucke)
Vegetables
152 Haucke Ln.Viola
627-1701 www.keewaydinfarms.com
Lynwood Farm and CSA (Lynn Tschumper)
Herbs, vegetables
Stoddard
483-2718 [email protected]
Ridgeland Harvest (Cate & Mat Eddy)
Vegetables, grass-fed beef, pork
E5538 Nelson Rd. Viroqua
675-3855 www.ridgelandharvest.com
Small Family Farm CSA (Jillian Jacqinot)
Vegetables, fruit, beef
S4374 Haugrud Hollow La Farge
625-4178 www.smallfamilyfarmcsa.com
Spring Valley Produce
vegetables
E15487 Warner Ave. Hillsboro
Sylvan Meadows (Virginia and John Goeke)
Grassfed beef, lamb, pork, vegetables, bread, berries, fruit, honey, maple syrup
E8303 Hwy SS Viroqua
637-2544 [email protected]
Twinhawks Hollow Farm (Sandra Eldredge)
Chicken, vegetables, lamb, herbs
E15936 Champion Ln. Hillsboro
528-4628

71 | P a g e
Westridge Produce (Jake and Kim Jakubowski)
Vegetables
26820 Kasts Ln. Blue River
536-3017
Whitakers (Faith and Duane Whitaker)
Vegetables
S2822 Garner Hill Rd. Hillsboro
489-2114

72 | P a g e
CHAPTER CHAPTER CHAPTER CHAPTER VVVV
A PROFILE OF A PROFILE OF A PROFILE OF A PROFILE OF THE LOCAL SCHOOL FOOD SYSTEMTHE LOCAL SCHOOL FOOD SYSTEMTHE LOCAL SCHOOL FOOD SYSTEMTHE LOCAL SCHOOL FOOD SYSTEM
1. FOOD SERVICES
i. School Meal Programs
2. VERNON COUNTY FARM TO SCHOOL PROGRAM
I. I. I. I. FOOD SERVICESFOOD SERVICESFOOD SERVICESFOOD SERVICES
School Meal ProgramsSchool Meal ProgramsSchool Meal ProgramsSchool Meal Programs
School Lunch Program Profile:
Pleasant Ridge Waldorf School Organic Hot Lunch Program
PRWS Organic Hot Lunch Program provides over 10,000 nourishing meals a year to students
and faculty. Started eight years ago, it was one of the first organic hot lunch programs in the
country. Four days a week, the program offers a 100% made-from-scratch meal. The diverse,
rotating menu consists of one entrée and two sides that are vegetarian, nutritious, and
protein balanced. All of the program’s food and personnel costs (a coordinator/cook and four
part-time, special-needs adults) are entirely funded through meal fees (currently $2.75/meal).
The program purchases locally grown food whenever possible. Much of the program’s
staples, such as onions, garlic, early potatoes, and winter squash are grown by its
coordinator/cook, Jim Hallberg. A small amount of the program’s produce is grown by the
school’s 3rd and 8th grade agriculture classes. Other locally grown food comes from farms
associated with the school (families who have children currently or formerly in the school or
farmers who graduated from the school). The rest of the school’s purchases are ordered
through the Viroqua Food Co-op, with an emphasis on regional or at least domestic product.
The program is a model for healthy, affordable, locally focused hot lunch programs. Hallberg
has helped eight other schools start similar programs.

73 | P a g e
IIIIIIII. . . . VERNON COUNTY FARM TO SCHOOL PROGRAMVERNON COUNTY FARM TO SCHOOL PROGRAMVERNON COUNTY FARM TO SCHOOL PROGRAMVERNON COUNTY FARM TO SCHOOL PROGRAM
VERNON COUNTY AND NORTH CRAWFORDVERNON COUNTY AND NORTH CRAWFORDVERNON COUNTY AND NORTH CRAWFORDVERNON COUNTY AND NORTH CRAWFORD
FARM TO SCHOOL PROGRAMFARM TO SCHOOL PROGRAMFARM TO SCHOOL PROGRAMFARM TO SCHOOL PROGRAM
(Researched and Written by Suzie Howe, Food and Farm Initiative Steering Committee)
Ed Block and Kait Keely were hired in October of 2008 through an AmeriCorps grant to
implement a Farm to School Program in Vernon County School Districts and in North
Crawford School District. Ed Block and Kait Keely are two very different people who are
performing two very different roles to meet a common goal. To provide a sustainable local
food system that will provide quality local foods to area school districts for the nutritional
enrichment of the children in these schools.
Ed comes to his role as Food Procurement Specialist with experience as a master gardener
and a commitment to the local community and local foods. Ed initiated his role with a
planning phase. During this time Ed worked toward his goal to provide a system to enable
local school districts to connect with local farmer/producers. Ed reviewed Farm to School
programs that are currently functioning both in Wisconsin and throughout the country. Ed
also networked with community resources including UW agriculture extension agents and
school district personnel. During this process Ed worked to learn of the schools food needs
and goals as well as barriers to creating a Farm to School Program. Ed’s target area included
North Crawford and Vernon County School Districts. The majority of school districts
contacted, including North Crawford, Viroqua, Westby, La Farge and De Soto, have
expressed an interest in creating a Farm to School Program. This interest included a $500.00
match for the AmeriCorps grant.
The second phase of creating a Farm to School Program was to interview local
farmer/producers. Ed defined a local farmer/producer as one who operates within 10 miles of
a given school. This area was determined as it allows for free delivery in most instances
reducing the overall cost to the school of food purchased. Ed has met with several
farmer/producers and indicates that the reception for a Farm to School Program has been
positive. Ed desires to create a system that will be a win-win situation for the schools and
producers. In order to accomplish this Ed has discussed the use of seconds, quality food that
does not have the perfect store shelf appearance, with both schools and farmer/producers.
The use of seconds is a natural choice for both entities. Types of foods being considered for
this program include, but are not limited to fruits such as apples, cranberries and raspberries
and vegetables such as squash, root crops, peppers, tomatoes, peas and beans, onions,
broccoli, cabbage and greens.

74 | P a g e
Kait comes to her role as the Nutrition Educator with a youthful enthusiasm and a strong
desire to work with kids. Kait, a native to area schools, including Kickapoo and De Soto,
provides the educational component of the Farm to School Program. While many children
frequently eat fresh local foods, some of the children in the districts may not be familiar with
the various foods that will soon be coming to their lunchroom. Kait’s focus is to provide
education to grades K-12 on nutrition and an introduction to healthy locally grown foods.
This will include the benefits of buying local and the joys of trying foods that they may not
have previously tried. Kait has been focusing on the elementary grades during the initial
phase of this project. This process takes different forms at different schools. The type of
nutrition education provided was determined through meetings with various school districts
to determine from them what would best meet their needs.
Both the Viroqua and Westby School Districts have monthly taste tests in the lunchroom.
During these taste tests Kait sets up a table that highlights a specific food that is grown
locally and might appear on their lunch plate in the future. To date these have included
cranberries in the form of craisins, sweet potatoes sliced and served raw with or without dip
and cabbage served as coleslaw and sauerkraut (Powerkraut). Along with food offerings Kait
provides educational information on the foods served and recipes are sent home.
In North Crawford and De Soto Kait visits each first grade elementary classroom once
monthly for 30 minutes. During these visits an enhanced version of the lunchroom taste tests
occurs with increased nutritional information and explanation of the importance of eating
locally grown sustainable foods.
La Farge has been the most challenging school for Kait as they already have a strong food
curriculum. This includes an active wellness committee, farm links and an active agricultural
department. Kait does hope to initiate taste testing in some form at La Farge soon. She is also
hoping to help La Farge School District to market some of their produce at a farmers market
in the summer months.
Kait believes that parent involvement in the Farm to School Program is critical. Many
parents have offered encouragement and ideas to enhance her efforts. Kait is very interested
in creating programs that improve children’s awareness about healthy eating. She plans to
increase her programming to include the middle schools and high schools next year.
Ed and Kait both perform all of these tasks in about 20 hours per week. They are enthusiastic,
thoughtful and effective in their efforts.

75 | P a g e
CHAPTER CHAPTER CHAPTER CHAPTER VIVIVIVI
VERNON COUNTY COMMUNITY FOOD ASSESSMENT VERNON COUNTY COMMUNITY FOOD ASSESSMENT VERNON COUNTY COMMUNITY FOOD ASSESSMENT VERNON COUNTY COMMUNITY FOOD ASSESSMENT
CONCLUSIONSCONCLUSIONSCONCLUSIONSCONCLUSIONS
TYING IT ALL TOGETHER:TYING IT ALL TOGETHER:TYING IT ALL TOGETHER:TYING IT ALL TOGETHER:
Key Themes Regarding Food Security in Vernon County & Key Themes Regarding Food Security in Vernon County & Key Themes Regarding Food Security in Vernon County & Key Themes Regarding Food Security in Vernon County & Recommendations for Future Food ProjectsRecommendations for Future Food ProjectsRecommendations for Future Food ProjectsRecommendations for Future Food Projects
The following are themes regarding the overall situation of food security in Vernon County.
They are addressed with recommendations for future food projects, which have been
identified through this 18-month long examination of the local food system. Since the
Community Food Assessment was an active, participatory process, organizational
relationships and collaborative groups have already started working on some of the
recommended projects. The themes are separated by recommendations regarding local food
supply (production) and local food consumption (access).
Current and future project partners include the following groups, organizations, agencies and
other entities:
• Vernon Economic Development Association
• Vernon County Land & Water Conservation Department
• Vernon County Planning Commission
• Vernon County Tourism Council
• Vernon County 4-H Groups, FFA and other community youth groups
• Vernon County Farm Service Agency
• Vernon County Farm Bureau
• Vernon County Farmer’s Union
• Viroqua Food Coop
• CROPP Cooperative
• Couleecap
• Local Human/Social Service Agencies
• Great Lakes Region Farm to School Network
• Land Stewardship Project
• Wisconsin Department of Agriculture, Trade and Consumer Protection
• Vernon County Farm to School Program
• University of Wisconsin Extension
• Vernon County Fair Board

76 | P a g e
• Area schools, churches, farmer’s markets, food pantries, medical facilities,
universities, institutions, farmers/gardeners, food retailers, restaurants
REGARDING THE LOCAL FOOD SUPPLY (PRODUCTION)REGARDING THE LOCAL FOOD SUPPLY (PRODUCTION)REGARDING THE LOCAL FOOD SUPPLY (PRODUCTION)REGARDING THE LOCAL FOOD SUPPLY (PRODUCTION)
To increase the amount of local food available and accessible to our population across the
socioeconomic spectrum greater support is needed for those interested in and already engaged
in food production and distribution for the local market. Such support should address the
following obstacles and needs:
1.1.1.1. SUPPORT FOR ECOLOGICALLY AND ECONOMICALLY SUSTAINABLE SUPPORT FOR ECOLOGICALLY AND ECONOMICALLY SUSTAINABLE SUPPORT FOR ECOLOGICALLY AND ECONOMICALLY SUSTAINABLE SUPPORT FOR ECOLOGICALLY AND ECONOMICALLY SUSTAINABLE
PRODUCTION SYSTEMSPRODUCTION SYSTEMSPRODUCTION SYSTEMSPRODUCTION SYSTEMS
2.2.2.2. SUPPORT FOR FARMLAND PRESERVATION FOR THE PRODUCTION OF SUPPORT FOR FARMLAND PRESERVATION FOR THE PRODUCTION OF SUPPORT FOR FARMLAND PRESERVATION FOR THE PRODUCTION OF SUPPORT FOR FARMLAND PRESERVATION FOR THE PRODUCTION OF
FOOD WHICH CAN BE CONSUMED LOCALLY FOOD WHICH CAN BE CONSUMED LOCALLY FOOD WHICH CAN BE CONSUMED LOCALLY FOOD WHICH CAN BE CONSUMED LOCALLY
3.3.3.3. SUPPORT FOR THE PROCESSING, MARKETING, STORAGE AND SUPPORT FOR THE PROCESSING, MARKETING, STORAGE AND SUPPORT FOR THE PROCESSING, MARKETING, STORAGE AND SUPPORT FOR THE PROCESSING, MARKETING, STORAGE AND
DISTRIBUTION OF LOCAL FARM PRODUCTDISTRIBUTION OF LOCAL FARM PRODUCTDISTRIBUTION OF LOCAL FARM PRODUCTDISTRIBUTION OF LOCAL FARM PRODUCTSSSS
4.4.4.4. PROVIDE CONSUMER EDUCATION TO SUPPORT LOCAL FOOD AND PROVIDE CONSUMER EDUCATION TO SUPPORT LOCAL FOOD AND PROVIDE CONSUMER EDUCATION TO SUPPORT LOCAL FOOD AND PROVIDE CONSUMER EDUCATION TO SUPPORT LOCAL FOOD AND
AGRICULTUREAGRICULTUREAGRICULTUREAGRICULTURE
5.5.5.5. IMPROVE ACCESS TO PUBLIC GROWING SPACES FOR NONIMPROVE ACCESS TO PUBLIC GROWING SPACES FOR NONIMPROVE ACCESS TO PUBLIC GROWING SPACES FOR NONIMPROVE ACCESS TO PUBLIC GROWING SPACES FOR NON----FARM FARM FARM FARM
RESIDENTSRESIDENTSRESIDENTSRESIDENTS
1. SUPPORT FOR ECOLOGICALLY AND ECONOMICALLY SUSTAINABLE 1. SUPPORT FOR ECOLOGICALLY AND ECONOMICALLY SUSTAINABLE 1. SUPPORT FOR ECOLOGICALLY AND ECONOMICALLY SUSTAINABLE 1. SUPPORT FOR ECOLOGICALLY AND ECONOMICALLY SUSTAINABLE
PRODUCTION SYSTEMSPRODUCTION SYSTEMSPRODUCTION SYSTEMSPRODUCTION SYSTEMS
More technical training for new and inexperienced farmers is needed to create a bridge
between agricultural development and the need to foster new farmers. Such programs might
include:
PROJECT: New Producer & Continued Training/EducationNew Producer & Continued Training/EducationNew Producer & Continued Training/EducationNew Producer & Continued Training/Education
• Including direct marketing opportunities for producers, ideas and technical education
for creating a profitable agricultural enterprise, and season extension techniques.
Expand outreach for management intensive grazing groups to youth in 4-H and new
farmers.
PROJECT: Farm Field ClassesFarm Field ClassesFarm Field ClassesFarm Field Classes

77 | P a g e
• Hands-on education experience for young/potential farmers
PROJECT: OnOnOnOn----FarmFarmFarmFarm Educational/Paid Internship Program Educational/Paid Internship Program Educational/Paid Internship Program Educational/Paid Internship Program
• Interested/potential new farmers
2. SUPPORT FOR PRESERVATION OF FARMLAND FOR PRODUCTION OF 2. SUPPORT FOR PRESERVATION OF FARMLAND FOR PRODUCTION OF 2. SUPPORT FOR PRESERVATION OF FARMLAND FOR PRODUCTION OF 2. SUPPORT FOR PRESERVATION OF FARMLAND FOR PRODUCTION OF
FOOD WHICH CAN BE CONSUMED LOCALLYFOOD WHICH CAN BE CONSUMED LOCALLYFOOD WHICH CAN BE CONSUMED LOCALLYFOOD WHICH CAN BE CONSUMED LOCALLY
PROJECT: Farmland Preservation InitiativesFarmland Preservation InitiativesFarmland Preservation InitiativesFarmland Preservation Initiatives
• Utilize the myriad number of land conservation programs that give incentives to
landowners who desire to keep their land agricultural in perpetuity
PROJECT: Campaign which highlights Vernon County’s history and modern bounty of Campaign which highlights Vernon County’s history and modern bounty of Campaign which highlights Vernon County’s history and modern bounty of Campaign which highlights Vernon County’s history and modern bounty of
diversified farmsdiversified farmsdiversified farmsdiversified farms
• Efforts to promote tourism development
3. SUPPORT FOR THE PROCESSING, MARKETING, STORAGE AND3. SUPPORT FOR THE PROCESSING, MARKETING, STORAGE AND3. SUPPORT FOR THE PROCESSING, MARKETING, STORAGE AND3. SUPPORT FOR THE PROCESSING, MARKETING, STORAGE AND
DISTRIBUTION OF LOCAL FARM PRODUCTSDISTRIBUTION OF LOCAL FARM PRODUCTSDISTRIBUTION OF LOCAL FARM PRODUCTSDISTRIBUTION OF LOCAL FARM PRODUCTS
Local farmers, retailers, and restaurants expressed the need for an efficient, cost-effective
locally based distribution system. These projects could address a lack of dependable delivery
systems for receiving or delivering local products and could offer support to farmers who do
not have the time to complete their own deliveries.
PROJECT: Distribution, Marketing, & Storage Facility/SDistribution, Marketing, & Storage Facility/SDistribution, Marketing, & Storage Facility/SDistribution, Marketing, & Storage Facility/Systemystemystemystem
• Local agricultural products
PROJECT: Community/Incubator KitchenCommunity/Incubator KitchenCommunity/Incubator KitchenCommunity/Incubator Kitchen
• Educating people on how to utilize local foods and to enable local farmers to develop
value-added products from locally produced food
PROJECT: Greater Producer Wholesale OpportunitiesGreater Producer Wholesale OpportunitiesGreater Producer Wholesale OpportunitiesGreater Producer Wholesale Opportunities
• Retail outlets, schools, restaurants, farmers’ markets, Community Supported
Agriculture (CSA) programs, and worksite CSAs
PROJECT: Development of Local SmallDevelopment of Local SmallDevelopment of Local SmallDevelopment of Local Small----Scale Specialty Markets Scale Specialty Markets Scale Specialty Markets Scale Specialty Markets

78 | P a g e
• Improve local distribution
PROJECT: More Farmers’ Market DaysMore Farmers’ Market DaysMore Farmers’ Market DaysMore Farmers’ Market Days
• Increase distribution and outlets for locally produced food
PROJECT: Greater Utilization of Existing Website Resources Greater Utilization of Existing Website Resources Greater Utilization of Existing Website Resources Greater Utilization of Existing Website Resources
• Link farmers and retailers
PROJECT: Farm to Institution Purchasing ProgramFarm to Institution Purchasing ProgramFarm to Institution Purchasing ProgramFarm to Institution Purchasing Program
• Link farmers and schools, hospitals, care facilities, etc.
4. CON4. CON4. CON4. CONSUMER EDUCATION TO SUPPORT LOCAL FOOD AND AGRICULTURESUMER EDUCATION TO SUPPORT LOCAL FOOD AND AGRICULTURESUMER EDUCATION TO SUPPORT LOCAL FOOD AND AGRICULTURESUMER EDUCATION TO SUPPORT LOCAL FOOD AND AGRICULTURE
It is clear from farmers that there is the desire for an educational campaign that would
increase community and institutional awareness on the benefits of buying local. Such
education could build on existing momentum and help increase the support for local
agriculture and local food-related business development.
PROJECT: BuyBuyBuyBuy----Local Marketing/Education Program Local Marketing/Education Program Local Marketing/Education Program Local Marketing/Education Program
• Promote the benefits of buying local food from health, economic and sustainable
community perspectives
PROJECT: Farm Tours Farm Tours Farm Tours Farm Tours
• Increase awareness of local food production, safe and economical food preservation,
and the food system in general
PROJECT: Consumer Education at Farmers’ Markets Consumer Education at Farmers’ Markets Consumer Education at Farmers’ Markets Consumer Education at Farmers’ Markets
• Promote the benefits of buying locally produced food
PROJECT: Youth Education Youth Education Youth Education Youth Education
• Increase awareness of the food system and agriculture policies on the local, national
and international levels
PROJECT: Community Cooking and Food Preservation LessonsCommunity Cooking and Food Preservation LessonsCommunity Cooking and Food Preservation LessonsCommunity Cooking and Food Preservation Lessons

79 | P a g e
• Increase purchase and consumption of locally grown, wholesome foods to enhance the
local market for locally-produced foods and to improve public health by helping
people consume fewer highly processed foods
5. IMPROVE ACCESS TO PUBLIC GROWING SPACES FOR NON5. IMPROVE ACCESS TO PUBLIC GROWING SPACES FOR NON5. IMPROVE ACCESS TO PUBLIC GROWING SPACES FOR NON5. IMPROVE ACCESS TO PUBLIC GROWING SPACES FOR NON----FARM FARM FARM FARM
RESIDENTSRESIDENTSRESIDENTSRESIDENTS
PROJECT: Education Programs and Greater Access toEducation Programs and Greater Access toEducation Programs and Greater Access toEducation Programs and Greater Access to Resources for more TownResources for more TownResources for more TownResources for more Town----Based and Based and Based and Based and
SmallSmallSmallSmall----Scale Agricultural ProductionScale Agricultural ProductionScale Agricultural ProductionScale Agricultural Production
• Promote gardening and the concept of “growing your own,” which are key strategies
for strengthening the food system that will have wide-ranging effects. The effects
include popular elements such as: community reliance, self-reliance, community
education, research, public-private partnerships (especially with community
gardens), school education and meals, policy improvements, healthy lifestyles (i.e.
physical activity), and affordability of high quality food
PROJECT: LandLandLandLand----Link NetworkLink NetworkLink NetworkLink Network
• Created between landowners and non-landowners (or small-landowner producers
who want to grow more food) to make use of experience, land, production, and water
that is needed to grow more food. Such a system could help connect those with
agricultural resources to those without resources and are interested in growing food.
REGARDING LOCAL FOOD CONSUMPTION (ACCESS)REGARDING LOCAL FOOD CONSUMPTION (ACCESS)REGARDING LOCAL FOOD CONSUMPTION (ACCESS)REGARDING LOCAL FOOD CONSUMPTION (ACCESS)
Fundamental differences exist in Vernon County. These differences must be considered to
effectively and equitably improve our local food system:
1. INCOME AND FINANCIAL ASSET DISPARITIES1. INCOME AND FINANCIAL ASSET DISPARITIES1. INCOME AND FINANCIAL ASSET DISPARITIES1. INCOME AND FINANCIAL ASSET DISPARITIES
2. NEEDS AND RESOURCES OF SCHOOLS2. NEEDS AND RESOURCES OF SCHOOLS2. NEEDS AND RESOURCES OF SCHOOLS2. NEEDS AND RESOURCES OF SCHOOLS
3. FOOD NEEDS AND R3. FOOD NEEDS AND R3. FOOD NEEDS AND R3. FOOD NEEDS AND RESOURCES FOR REMOTE RURAL AREASESOURCES FOR REMOTE RURAL AREASESOURCES FOR REMOTE RURAL AREASESOURCES FOR REMOTE RURAL AREAS
1. INCOME AND FINANCIAL ASSET DISPARITIES1. INCOME AND FINANCIAL ASSET DISPARITIES1. INCOME AND FINANCIAL ASSET DISPARITIES1. INCOME AND FINANCIAL ASSET DISPARITIES
It is theorized that the ability and willingness of residents of Vernon County to chose local
foods as part of their food budget is affected by an individual’s or family’s income and

80 | P a g e
financial assets. The basic health and food needs of different socioeconomic groups are
essentially the same; the difference is access due to both perceived and real costs.
PROJECT: Coordinated Effort to “Glean” Unsold Produce from Local FarmsCoordinated Effort to “Glean” Unsold Produce from Local FarmsCoordinated Effort to “Glean” Unsold Produce from Local FarmsCoordinated Effort to “Glean” Unsold Produce from Local Farms
• Distribution to people who want and need it
PROJECT: Affordable Food Purchasing and Cooking Program Affordable Food Purchasing and Cooking Program Affordable Food Purchasing and Cooking Program Affordable Food Purchasing and Cooking Program
• For those that do not have the knowledge or skills necessary to purchase and consume
inexpensive, healthy foods
PROJECT: Aggressively Market WIC Farmers’ Market Nutrition ProgramAggressively Market WIC Farmers’ Market Nutrition ProgramAggressively Market WIC Farmers’ Market Nutrition ProgramAggressively Market WIC Farmers’ Market Nutrition Program
• Improve access to local foods to WIC program participants
PROJECT: Local Guide to CharLocal Guide to CharLocal Guide to CharLocal Guide to Charitable Food Programs which can store and handle itable Food Programs which can store and handle itable Food Programs which can store and handle itable Food Programs which can store and handle
unprocessed whole locallyunprocessed whole locallyunprocessed whole locallyunprocessed whole locally----grown foods grown foods grown foods grown foods
• For both consumers who are actively seeking local foods and for local farmers who
wish to donate unsold, but healthful and safe foods
PROJECT: Improve Cold Storage CapaImprove Cold Storage CapaImprove Cold Storage CapaImprove Cold Storage Capacity for Food Pantries in all parts of the County city for Food Pantries in all parts of the County city for Food Pantries in all parts of the County city for Food Pantries in all parts of the County
• Increase opportunities to accept donations of fresh, local wholesome vegetables which
require refrigeration. This project could be a coordinated effort to solicit donations
and/or grants to this end.
PROJECT: Greenhouse and/or Garden Projects Greenhouse and/or Garden Projects Greenhouse and/or Garden Projects Greenhouse and/or Garden Projects
• Alternative food sources for charitable food programs
PROJECT: Aggressively Market Electronic Benefits Transfer (EBT food stamp) Farmers’ Aggressively Market Electronic Benefits Transfer (EBT food stamp) Farmers’ Aggressively Market Electronic Benefits Transfer (EBT food stamp) Farmers’ Aggressively Market Electronic Benefits Transfer (EBT food stamp) Farmers’
Market Program Market Program Market Program Market Program
• Accept Food Stamps at area farmers’ markets
2. NEEDS AN2. NEEDS AN2. NEEDS AN2. NEEDS AND RESOURCES OF SCHOOLSD RESOURCES OF SCHOOLSD RESOURCES OF SCHOOLSD RESOURCES OF SCHOOLS
Vernon County school districts are important community institutions and they influence
cultural and economic patterns. They are also major employers in the county. Each of the
schools has different economic resources and needs which affect their interest and capability

81 | P a g e
to participate in various food programs. Differences aside, the districts would benefit from
pooling human and economic resources when it comes to serving thousands of students in
the county each day.
PROJECT: CompCompCompComprehensive Farmrehensive Farmrehensive Farmrehensive Farm----totototo----School ProgramSchool ProgramSchool ProgramSchool Program
• Farm-to-school is a concept that resonates with the public and effectively “frames”
many of the overall food system issues including access to healthy food choices, the
importance of food quality over price, a need for system-wide policy changes and the
importance of local foods.
PROJECT: Youth Community Gardens Youth Community Gardens Youth Community Gardens Youth Community Gardens
• Educate and promote agriculture and local foods.
3. FOOD NEEDS AND RESOURCES FOR REMOTE RURAL AREAS3. FOOD NEEDS AND RESOURCES FOR REMOTE RURAL AREAS3. FOOD NEEDS AND RESOURCES FOR REMOTE RURAL AREAS3. FOOD NEEDS AND RESOURCES FOR REMOTE RURAL AREAS
A lack of access, especially to healthy foods, exist due to costs, transportation constraints or
distance to agencies and services and is a need the county must address to increase food
security, especially in rural areas and for our aging population.
PROJECT: Development of Rural Farmers’ Markets Development of Rural Farmers’ Markets Development of Rural Farmers’ Markets Development of Rural Farmers’ Markets
• In the outlying, small farm towns. Town dump/recycling sites might be used for this
purpose.
PROJECT: Rural Food Exchange Program Rural Food Exchange Program Rural Food Exchange Program Rural Food Exchange Program
• Connect neighbors that produce food and those that do not
PROJECT: Rural Community Garden Plots Rural Community Garden Plots Rural Community Garden Plots Rural Community Garden Plots
• Areas where people may go to gain knowledge and support from more experienced
gardeners
PROJECT: Rural Local Food Delivery Program Rural Local Food Delivery Program Rural Local Food Delivery Program Rural Local Food Delivery Program
• For seniors and low-income persons that improves access to healthy foods
PROJECT: Rural Charitable Food Programs Rural Charitable Food Programs Rural Charitable Food Programs Rural Charitable Food Programs
• Distribute of foods to those in rural areas in need

82 | P a g e
SUMMARYSUMMARYSUMMARYSUMMARY
The availability and affordability of safe, healthy, sustainable, local foods is an issue that
must be addressed when redeveloping our local food system. The assessment concludes that
there is much enthusiasm to improve our local food security. It is widely recognized that our
economic well-being is closely tied to the strength of our capacity to produce food for local
consumption. The recommendations listed for future community food projects are designed
to address gaps in already existing food programs and/or create new programs, make way for
food and agricultural policy change and involve and empower the community to address food
security in an equitable and effective fashion.
By completing the Vernon County Community Food Assessment, information has been
compiled regarding the resources and needs of the local food system, under-served
populations, Farm-to-School programs and key stakeholders. The process has also
strengthened links between existing food system groups, promoted community learning and
participation around the local food system and food security and generated results to plan
effective community food projects.
3.3.3.3.WHAT’S NEW AND WHAT’S NEXT?WHAT’S NEW AND WHAT’S NEXT?WHAT’S NEW AND WHAT’S NEXT?WHAT’S NEW AND WHAT’S NEXT?
ACCOMPLISHMENTS AND SHARING ASSESSMENT INFORMATIONACCOMPLISHMENTS AND SHARING ASSESSMENT INFORMATIONACCOMPLISHMENTS AND SHARING ASSESSMENT INFORMATIONACCOMPLISHMENTS AND SHARING ASSESSMENT INFORMATION
The process of conducting the Vernon County Community Food Assessment has already
resulted in several accomplishments that strengthen local food security. Accomplishments
include the 2008 Harvest Dinner, 2008 Eat Local Challenge, and the creation of the Vernon
County Farm to School Program and 5th Season Harvest Project.
The next steps in the process of building a stronger local food system are to publicly share
the findings and recommendations of the Vernon County Food Assessment, to prioritize the
assessment recommendations and to develop a series of action plans to implement future
food projects.
The Valley Stewardship Network Food & Farm Initiative sponsored two Vernon County
presentations showcasing Ken Meter’s Southwest Wisconsin Rural Economic Study and the
major findings and recommendations of the Vernon County Community Food Assessment.
The presentations were held Tuesday, May 12th and Thursday, May 21st, 2009.
This document will be available on the internet through Valley Stewardship Network’s
website. Bound copies of this document will be available at county public libraries, schools,
and Vernon County Museum. Individuals and organizations may purchase bound copies to
be printed as requested.

83 | P a g e
Get some background on Community Food AssessmentsGet some background on Community Food AssessmentsGet some background on Community Food AssessmentsGet some background on Community Food Assessments • Read reports from previous assessments and related resources • Talk to people who have conducted assessments to learn about their experiences
Recruit ParticipantsRecruit ParticipantsRecruit ParticipantsRecruit Participants
• Identify a group of key stakeholders and organize an initial meeting • Determine the group’s interest in conducting an assessment • Identify and recruit other participants, representing diverse interests and skills
Determine assessment purposes and goalsDetermine assessment purposes and goalsDetermine assessment purposes and goalsDetermine assessment purposes and goals
• Identify participants’ goals and interests • Clarify and prioritize initial goals for assessment • Revisit and refine goals later as needed
Develop a planning and decisionDevelop a planning and decisionDevelop a planning and decisionDevelop a planning and decision----making processmaking processmaking processmaking process
• Clarify who will make decisions and how • Clarify the roles of participants, defining various levels of participation • Develop a plan for meaningful community participation
Define the communityDefine the communityDefine the communityDefine the community
• Define geographic boundaries for the assessment • Decide whether to focus on specific population groups
Identify funds and other resourcesIdentify funds and other resourcesIdentify funds and other resourcesIdentify funds and other resources
• Develop overall budget • Secure grants or other funding • Identify in-kind resources and a project sponsor • Recruit and train staff and volunteers as needed
Plan and conduct researchPlan and conduct researchPlan and conduct researchPlan and conduct research
• Develop assessment questions and indicators • Identify existing data and information needed • Determine appropriate research methods • Collect data from existing and original sources • Process and analyze data • Summarize assessment findings
Present and disseminate assessment findingsPresent and disseminate assessment findingsPresent and disseminate assessment findingsPresent and disseminate assessment findings
• Identify audiences for assessment and appropriate ways to reach them • Compile assessment findings into a report and/or other materials
APPENDIX AAPPENDIX AAPPENDIX AAPPENDIX A
BASIC STEPS OF A COMMUNITY FOOD ASSESSMENTBASIC STEPS OF A COMMUNITY FOOD ASSESSMENTBASIC STEPS OF A COMMUNITY FOOD ASSESSMENTBASIC STEPS OF A COMMUNITY FOOD ASSESSMENT
This checklist provides an overview of the steps typically involved in planning and
implementing an assessment. These steps may not all be needed in each situation, and
they won’t necessarily occur in this sequence. (“Steps” borrowed from the Community Food
Security Coalition’s What’s Cooking in Your Food System? A Guide to Community Food Assessment, 2002)

84 | P a g e
• Disseminate findings through materials, meetings and media outreach
Evaluate and celebrateEvaluate and celebrateEvaluate and celebrateEvaluate and celebrate • Review assessment process and outcomes • Celebrate! Thank and honor participants
Implement followImplement followImplement followImplement follow----up actionsup actionsup actionsup actions
• Develop goals and action plan based on the assessment results
• Consider whether to implement another assessment phase

85 | P a g e
APPENDIX BAPPENDIX BAPPENDIX BAPPENDIX B
COMMUNITY MEMBERS WHO ASSISTED WITH INITIAL CFA COMMUNITY MEMBERS WHO ASSISTED WITH INITIAL CFA COMMUNITY MEMBERS WHO ASSISTED WITH INITIAL CFA COMMUNITY MEMBERS WHO ASSISTED WITH INITIAL CFA
PROJECT PLANNING & DEVELOPMENTPROJECT PLANNING & DEVELOPMENTPROJECT PLANNING & DEVELOPMENTPROJECT PLANNING & DEVELOPMENT
NameNameNameName Phone #Phone #Phone #Phone # Business/Organization AffiliationsBusiness/Organization AffiliationsBusiness/Organization AffiliationsBusiness/Organization Affiliations
Jessica Luhning 637-3615 VSN Projects Coordinator
Matt Urch 675-3766 VSN, Land Stewardship Project, North Crawford High School
Sara Martinez 675-3766 VSN, Family and Children’s Center Lori Harms 637-7136 Driftless Café, Family Farm Defenders Jean Young 634-2375 Elegant Stone Products Suzie Howe 629-5019 Family and Children's Center
Dan Peper 675-3866 Driftless Folk School, Green Builders Guild, Viroqua Food Coop, VSN
Jenny Borchardt 773-805-3210 Produce farmer
Bill Motlong 629-5561 VSN K OBrien 637-7778 Driftless Café, Local Theatre Group Beth Baker 647-8870 Richland County Emergency Planning
Angie Scotland 637-7524 Organic Valley(CROPP), VSN
Dani Lind 624-3525 Viroqua Food Coop
Sue Noble 637-5396 Vernon Economic Develop. Assoc.
Therese Laurdan 637-2493 Weston A. Price Foundation, Home Green Home
Sarah Johnson 637-7455 Viroqua School Board Virginia Goeke 637-2544 Sylvan Meadows Farm Janice Blair 637-6727 Blackberry Ridge Farm Rink DaVee 888-281-9472 Local Fare! UW-Platteville

86 | P a g e
APPENDIX CAPPENDIX CAPPENDIX CAPPENDIX C
COMMUNITY FOOD ASSESSMENT METHODOLOGYCOMMUNITY FOOD ASSESSMENT METHODOLOGYCOMMUNITY FOOD ASSESSMENT METHODOLOGYCOMMUNITY FOOD ASSESSMENT METHODOLOGY
1. OVERVIEW
2. LITERATURE REVIEW AND OTHER CFAs
3. COUNTY INFORMATION & DATA RESOURCES
4. ASSESSMENT SURVEYS
5. OTHER COUNTY ASSESSMENTS
a. SOUTHWEST WISCONSIN LOCAL FARM & FOOD ECONOMIC
STUDY – Produced by Ken Meter, Crossroads Resource Center
b. FARMER & VENDOR SURVEYS – A Contribution of the Department of Rural
Sociology, UW-Madison; Crawford County Extension and Valley Stewardship
Network
i. An Evaluation of Food & Culture Tourism: Food Vendor
Perspectives on Local Food Networks in Southwestern
Wisconsin
ii. An Evaluation of Food & Culture Tourism: Fresh Food
Production for Local food Networks in Southwestern
Wisconsin
I. OVERVIEWI. OVERVIEWI. OVERVIEWI. OVERVIEW
Steering Committee members and collaborators represented a diverse spectrum of the local
food system, each bringing a wealth of knowledge and experience to the table. Early
discussions revealed one overarching common goal; the creation of a healthy and sustainable
local food system.
The development of the VSN Food & Farm Initiative evolved out of the desire to raise
awareness about the importance of supporting sustainable, small family farming practices as
opposed to large, industrial agriculture operations. In addition, conversations with small
family farmers over the summer and fall of 2007 indicated a need for increased market
opportunities for locally produced food items.
It was determined, after conversations with other organizations tackling food system issues
that the best place to start was with the completion of a Community Food Assessment.
According to the Community Food Security Coalition, “Community Food Assessments are a
powerful resource for helping organizations to be more effective, to maintain momentum, to

87 | P a g e
gain new allies, to build new knowledge and support in the community, and to bring about
new policies and practices.”17
II. LITERATURE REVIEW & OTHER CFII. LITERATURE REVIEW & OTHER CFII. LITERATURE REVIEW & OTHER CFII. LITERATURE REVIEW & OTHER CFAsAsAsAs
To begin, we dedicated a significant amount of time to researching the food assessment
process. This included a review of current food system literature and an investigation of
other community food assessments such as the Missoula County, Montana Our Foodshed in
Focus report; the Salinas, California-based Agriculture & Land-Based Training Association’s
The Face of Food on the Central Coast; La Plata County, Colorado Food Assessment; and the
Milwaukee, Wisconsin Food System Assessment Study.
The Community Food Security Coalition (CFSC) and their extensive website18 serves as an
incredible resource for community organizations like ours exploring the food assessment
process. The CFSC published a guide to the food assessment process titled What’s Cooking in
Your Food System19. In addition, the United States Department of Agriculture (USDA)
published the invaluable Community Food Security Assessment Toolkit, which includes a
“general guide to community assessment and materials for assessing household food security,
food resource accessibility, food availability and affordability, and community food
production resources”.20
III. COUNTY III. COUNTY III. COUNTY III. COUNTY INFORMATION & INFORMATION & INFORMATION & INFORMATION & DATA RESOURCESDATA RESOURCESDATA RESOURCESDATA RESOURCES
Steering Committee members were able to utilize the USDA Community Food Security
Assessment Toolkit as a guide for retrieving existing socioeconomic, demographic and food
system program participation data from a variety of national, state and local tools and
resources. These resources included:
• Socioeconomic and Demographic Data
o United States Census Bureau’s Internet Site: www.census.gov
• Federal Food Assistance Programs
o Wisconsin Department of Health Services
� Vernon County Human Services
� Vernon County Health Services
� Vernon County Unit on Aging
o Wisconsin Department of Public Instruction
17 Pothukuchi, Joseph, Burton, & Fisher. What's Cooking in Your Food System? A Guide to Community Food Assessment. Community Food Security Coalition, 2002. 18 www.foodsecurity.org 19 Pothukuchi, Joseph, Burton, & Fisher. What's Cooking in Your Food System? A Guide to Community Food Assessment. Community Food Security Coalition, 2002. 20 Cohen, Barbara. Community Food Security Assessment Toolkit. Economic Research Service. United States Department of Agriculture, July 2002.

88 | P a g e
• Community Food Production Data
o University of Wisconsin- Extension Vernon County
o Vernon County Land & Water Conservation Department
o Vernon County Area School Districts
o Viroqua Partners
o Vernon County Historical Society
o United States Department of Agriculture Census of Agriculture Internet Site:
www.usda.gov.
o United States Census Bureau’s Economic Census Internet Site:
www.census.gov.
• Agriculture Data
o Census of Agriculture Data: http://www.agcensus.usda.gov/
• Background Information
o Vernon County Comprehensive Planning Committee’s Summary of Themes
from the Summer 2008 County-wide Listening Sessions
o Trout Unlimited 1999 Kickapoo Watershed Conservation Plan
o 2007 Vernon County Workforce Profile, a document prepared by the Office of
Economic Advisors at the Wisconsin Department of Workforce Development
o “History of Vernon County, Wisconsin” published by Union Publishing
Company in Springfield, Illinois (1884)
o September 1981 Vernon County, Wisconsin Farmland Preservation Plan,
Volume 2: Background Report
o Vernon County Land Water Conservation Department
IV. ASSESSMENT SURVEYSIV. ASSESSMENT SURVEYSIV. ASSESSMENT SURVEYSIV. ASSESSMENT SURVEYS
The Steering Committee took advantage of a simple and adaptive assessment tool utilized by
the Oregon State University Extension Service in their Oregon Small Farms Technical Report:
Tools for Rapid Market Assessment21. The Dot Survey approach was easily utilized by steering
committee members as it required little training or explanation for implementation. In
addition, Dot Surveys require minimal resources as opposed to traditional survey techniques
like interviews and written questionnaires, which are poorly suited to venues like county
fairs and farmer’s markets. As the Oregon State surveyors discovered, the “Dot Survey
approach significantly increases the number of consumers surveyed and the percentage who
21 Lev, Brewer and Stephenson. Oregon Small Farms Technical Report: Tools for Rapid Market Assessment. Oregon State University Extension Service, 2004.

89 | P a g e
agree to participate. This approach provides more accurate assessments of participant
preference and behavior.”22
Dot Survey questions are displayed on easels and participants indicate their responses by
placing a colorful, round sticker next to their chosen response. Steering Committee members
surveyed Vernon County residents at three locations during the summer months of 2008.
The three locations included the Organic Valley Kickapoo Country Fair in La Farge,
Wisconsin; the Viroqua Farmers Market and the Viroqua Area Schools “Back to School
Night”. Participants were asked questions about their annual local food budget,
recommendations for farmers market improvements and Farm to School program
preferences.
V. OTHER COUNTY ASSESSMENTSV. OTHER COUNTY ASSESSMENTSV. OTHER COUNTY ASSESSMENTSV. OTHER COUNTY ASSESSMENTS
In recent months the local food and farm system of southwest Wisconsin has been
highlighted in a number of studies and publications. We were able to incorporate rural
economic data and survey information collected from other county assessments including the
2008 farmer and vendor surveys completed by the Department of Rural Sociology, UW-
Madison in collaboration with Crawford County Extension and the Valley Stewardship
Network. The surveys are entitled: 1) An Evaluation of Food & Culture Tourism: Food
Vendor Perspectives on Local Food Networks in Southwestern Wisconsin; and 2) An
Evaluation of Food & Culture Tourism: Fresh Food Production for Local Food Networks in
Southwestern Wisconsin.
In addition, the VSN Food & Farm Initiative contracted with the Minneapolis, Minnesota-
based Crossroad Resource Center’s Ken Meter to produce a “Finding Food in Farm Country”
rural economic study for the southwest Wisconsin counties of Vernon, Monroe, Richland
and Crawford. Vernon County data has been extrapolated and included in the findings of the
Vernon County CFA report.
22
Lev, Brewer and Stephenson. Oregon Small Farms Technical Report: Tools for Rapid Market Assessment. Oregon State University Extension Service, 2004.