venture capital performance in chinaupdated€¦ · · 2014-05-07venture capital performance in...
TRANSCRIPT

Venture capital performance in China
Sophie Wanga1, Hamish Andersona, and Jing Chia
Abstract
This study investigates the determinants of venture capital (VC) performance in China. We focus on
the impact of VC reputation, political connections, and managing partner/founder’s experience on the
performance of domestic and foreign VC investments. After controlling for VC age, portfolio firm age,
syndicate size, VC industry competition, and a number of other factors, we find little correlation
between VC reputation and investment performance in the Chinese market. In contrast, we find that
the institutional characteristics such as political connections of VC firms and managing
partner/founder’s prior experience as managers and investment bankers are crucial to domestic VC
success, but these have little impact on foreign VC performance. In particular, if a domestic VC firm
is politically connected, or a managing partner/founder has more management experience or has
previously worked as an investment banker, a portfolio firm is more likely to have an IPO exit
through the Chinese mainland stock markets, and these VCs are also likely to speed up a portfolio
firm’s exit through IPOs in China.
Keywords: Venture Capital, Performance, Emerging Market, China
JEL Classification: G24, G28
a All authors are from the School of Economics and Finance, Massey University 1 Corresponding Author: Sophie Wang. School of Economics and Finance, Massey University (Manawatu Campus), Private Bag 11-222, Palmerston North 4442, New Zealand, Tel: +64-6-3505799 ext. 85635; Email: [email protected]

1
1. Introduction
We examine whether reputation, political connections and business experience of both
domestic and foreign venture capital firms (VCs) enhance venture success. China attracts
substantial attention and investment from foreign venture capital firms which transfer mature
human capital and institutional infrastructure into China’s developing VC market. This
diffusion of institutional knowledge significantly shortens and reduces the learning process
costs for domestic VCs (Black and Gilson, 1998; Wang and Wang, 2011). Following the 2008
global financial crisis, foreign VCs’ activity fell (Deutsche Borse Group, 2011), while
domestic VCs rapidly expanded to a market-dominant position within China. The rise of
domestic VCs was assisted by the loosening of regulations on domestic investors investing in
VC/PE funds and the addition of new exit routes for VC/PE investments (Lu, Tan, and Huang,
2012). Compared to cross-border VC investments2, domestic emerging market VCs are rarely
examined primarily due to their historically small size. Motivated by the rapid growth of
China’s total VC market, as well as the rise to market dominance of domestic VC activities,
this study investigates the determinants of both domestic and foreign VC performance given
their different backgrounds and networks.
Our study differs from the existing VC/PE literature in three ways. First, we focus on
domestic VC performance and compare this to foreign VC performance in an emerging
market. This is in contrast to the prior literature which focuses on either domestic VC
investments in developed markets or foreign VC investments in emerging markets. Second,
to the best of our knowledge, this is the first study to examine the role of political connections
as well as managing partner/founder’s prior experience on VC performance in an emerging
market. Third, we complete comprehensive cross-checking procedures across different
databases and original source documents and correct for the relatively high level of errors
evident in any single database, particularly surrounding investment dates, the number of
syndicated VC firms, and portfolio firm establishment dates.
While VC reputation is a significant factor affecting U.S. VC performance (Hochberg, et al.,
2 See Dai, Jo, and Kassicieh (2012) and Wang and Wang (2012) for studies on cross-border investments by using cross-country sample in emerging markets; Wang and Wang (2011) and Humphery-Jenner and Suchard (2013) on cross-border investments in China.

2
2007; Nahata, 2008), Wang and Wang (2011) find that foreign VC reputation has little impact
on cross-border VC investments in China. They contend that the cultural, institutional, and
capital market differences between developed and emerging markets may mean foreign VC
reputation is market-specific and not transferable. Humphery-Jenner and Suchard (2013)
argue that Wang and Wang’s (2011)’s small sample size may raise concerns about sample
selection bias. To reduce the potential small sample bias, we use a sample of 3,733 VC
investments in 2,371 Chinese portfolio firms that receive VC funding during 2004-2010. To
avoid market specificity problem of VC reputation we measure it based on VC past market
share of all the Chinese portfolio firms rather than portfolio firms from all the countries a VC
had taken public.
This study proposes two additional measures based on the unique characteristics of China’s
VC industry and institutional background. The first measure is political connections of VC
firms. As the CSRC and stock exchanges retain residual discretion to approve an issue
(Securities Law Article, 12, 13(4), 48, 50(1)), politically connected VC firms may have a
comparative advantage in navigating the relatively complex IPO regulations compared to
politically unconnected VC firms3 (Humphery-Jenner and Suchard, 2013). Motivated by this
argument, we hand-collect information on political connections of VC firms. The second
measure is related to managing partner/founder’s prior business experience (prior experience).
Bottazzi, Rin, and Hellman (2008) find that venture capitalists with prior business experience
are more actively involved in their portfolio firms and such investor activism is positively
related to the success of portfolio firms. Zarutskie (2010) argue that venture capitalists’
industry-specific human capital help their portfolio firms develop contacts and obtain
alternative sources of finance. To gain insight into the impact of a range of prior business
experience on portfolio performance we hand-collect information on managing
partner/founder’s experience as CEO (CEO experience), top manager (i.e. managers, CFOs)
(management experience), and investment banker (investment banker experience).
We make the following key findings. First, VC reputation has little impact on the two
common yardsticks of VC performance: the likelihood of a successful exit and time to exit
which is consistent with Wang and Wang (2011). However, we find that foreign VC
3 In emerging markets such as China and India, IPOs accounted for the bulk of exits, as they did in Japan, Korea and Taiwan. Due to the favourable IPO environment in Mainland China, domestic stock markets represented the bulk of all Chinese IPOs and VC-backed IPOs (Ernst &Young, 2011).

3
reputation is positively related to the likelihood of an IPO exit through the mainland stock
markets. Second, both political connections and prior experience consistently predict
domestic VC performance, but have limited impact on foreign VC success. Specifically,
political connections, as well as management and investment banker experience, are
positively related to the likelihood of IPO exits for domestic VC investments. In addition, we
find that investments made by politically connected VCs are more likely to go public in the
mainland stock markets but less likely to exit through other markets (including Hong Kong
stock markets).
The structure of this paper is as follows. Section 2 presents institutional background. Section
3 describes data, variables, and methodology. Section 4 analyzes VC performance at the
investment level. Section 5 conducts some robustness checks, and Section 6 concludes.
2. Institutional background
2.1 Development of China’s VC industry In the mid-1980s, China’s VC industry was established when the Chinese government
decided to finance high-tech industries through venture capital (Xiao, 2002). It experienced
the first boom during 1999-2000, a time period characterized by strong global stock market
performance and investor optimism. In China, concepts like “internet economy” and “U.S.
business model + Chinese market” emerged and attracted great attention. Domestic investors’
fervor for technology firms reached a climax in 2000 when the Shenzhen Stock Exchange
(SZSE) decided to introduce a NASDAQ-style venture board to support technology firms
(which did not come into existence until October 2009) (Lu et al., 2012). Stimulated by this
announcement, there was a significant increase in the number of VCs during this period.
However, having seen the burst of the internet bubble and the failure of German’s Neuer
market, the Chinese government decided to suspend its planned venture board plan in 2002.
This decision fundamentally changed the ecosystem of China’s VC industry. With neither
follow-up investments nor any prospects of exit4, a large number of domestic VC firms that
4 In China, the State decides which firms to be listed on the stock exchanges. The central government’s position was that VC-backed firms have strong financial resources and therefore do not need capital that a share offering would provide (Bruton and Ahlstrom, 2003). Instead, state enterprises that were in desperate need of capital to restructure should be considered first.

4
had accumulated numerous high-tech projects had to either close down or change to other
businesses (Lu et al., 2012).
Notwithstanding the plight of domestic VCs, this stage witnessed the dominance of foreign
VCs in the Chinese market. Statistics by China Venture Capital Research Institute (CVCRI)
reports that from 2003 to 2006, foreign VCs accounted over 80 percent of the amount of new
VC investments in China’s VC market. The primary reason for this significant increase was
that the Chinese government waived its approval for domestic private enterprises to be listed
overseas. Having more familiarity and connections with their home capital markets, foreign
VCs clearly had competitive advantages in taking their investees to the public in their home
capital markets.
In April 2005, the State Administration of Foreign Exchange (SAFE) tightened the regulation
for listing overseas. The rationale behind this action was the government’s intention to keep
valuable domestic assets listing on its own stock markets. Subsequently in 2006, the
government promulgated a regulation speculating that any new red-chip listing has to be
approved by the China Securities Regulatory Commission (CSRC). However, CSRC has
taken a restrictive approach and thus it only has approved a small number of applications (Lu
et al., 2012). These regulations removed the key competitive advantage enjoyed by foreign
VCs.
Since the debut of the Small-and-Medium Enterprises (SME) Board5 in May 2004 and the
long-awaited venture board (called the ChiNext Board) in October 2009, domestic VCs have
gradually revived and regained a market-dominant position (Lu et al., 2012). These two
Boards significantly increase the enthusiasm of venture capitalists as China opened up formal
exit routes for VC investments. VCs that invest in young and technology SMEs are now able
to exit their investments through the ChiNext Board. To better capture economic rents, a
great number of domestic VCs shift their investment preference to pre-IPO investments and
target private firms that have already started their IPO preparation6 (Tan, Huang, Lu, 2013).
5 It is noteworthy that the SME board is not a NASDAQ-like market. Rather, it is a component of the Main Board and it adopts the same law, regulation, and listing rules as those for the Main Board. Simply speaking, the requirements for listing on the SME Board are still very high, and only capital-concentrated SMEs can satisfy the stringent listing requirements. 6 According to the statistics from the Asia Venture Capital Journal (AVCJ), the average annual percentage of pre-IPO investment in total VC investment amount has increased from 7.5% during the period of 2000-2003, to 31% during the period of 2004-2010.

5
In response to the regulatory and institutional changes, many foreign VCs have started to
raise funds denominated in Chinese currency. In addition, the exit preferences change due to
the improvements in China’s financial markets. As documented by Humphery-Jenner and
Suchard (2013), the proportion of IPOs in mainland China has increased over time. However,
to exit via the domestic stock exchange, they have to compete with domestic VCs. This put
foreign VCs into a competitive disadvantage given their lack of political connections and
business experience in China.
2.2 A comparison between the VC in China and the West Although Japan has been a centre for venture capital investment in Asia for the last two
decades, China has attracted increased worldwide attention. This is mainly due to its strong
entrepreneurial culture, growing commitment to intellectual property rights protection, robust
economic growth, and growing domestic market (Li, 2005). However, VCs with experience
in the Western developed markets, like the US, are often surprised by the differences and
peculiarities of VC environment in China (Pukthuanthong and Walker, 2007). A number of
recent studies have applied the institutional-based view of international business strategy to
explain the cross-country differences in VC markets (Lu, et al., 2012; Peng, Wang, and Jiang,
2008). This institutional-based perspective suggests that differences in formal and informal
institutional environments, also known as the “rules of the game” (North, 1990), significantly
shape the strategy and performance of firms in emerging economies (Hoskisson, Eden, Lau,
and Wright, 2000).
Researchers have increasingly recognised that institutions are more than background
conditions; instead, institutions directly determine a firm’s strategic choices when it struggles
to create competitive advantages (Peng, 2006; Peng and Heath, 1996). In a perfectly
competitive market, no strategy will allow a firm to gain competitive advantage over its
competitors (Cyert, Kumar, and Williams, 1993). However, market imperfections, together
with the formal and informal constraints of a particular institutional framework, require
decision makers to formulate and implement strategies to exploit existing imperfections and
pursue economic rents generated from different institutions (Ingram and Silverman, 2002; Lu
et al., 2012).

6
In emerging markets, institutional-based perspective is particularly important in explaining
VC strategy. This is because governmental and societal effects are stronger in emerging
markets than in the Western context (Hoskisson et al., 2000). In developed economies where
market-supporting institutions are available, uncertainties of investing in an entrepreneurial
firm typically come from either industry-level conditions or firm-level agency problems. VCs
can earn economic rents by carefully screening and evaluating projects and providing
assistance to enhance the competitiveness of their investees. However, it is difficult to apply
the mainstream VC theories to emerging countries where there is a lack of market-supporting
institutions. For example, intellectual property protection, shareholder protection, government
intervention, supply of risky capital, transparency of financial reporting requirements, and
IPO markets for exits are matters of tremendous concerns to VC investors (Jeng and Wells,
2000; Lu et al., 2012). Hence when financing an entrepreneurial firm in an emerging market,
VCs are exposed to not only industry- and firm- level uncertainties, but also the legal and
institutional failure which cannot be easily controlled (Tan, et al., 2013).
China’s institutional environment was often characterized by a lack of clearly codified
information, unpredictable government regulation, and uncertain market conditions directed
at entrepreneurial activities (Tan and Tan, 2005; Tan and Litsschert, 1994). Hoskisson, et al.
(2000) and Peng (2003) argue that in the West, a rule-based, impersonal exchange regime
(market-centered strategy) is more relevant; whereas in emerging economies like China, a
guanxi-based, personalized strategy (network-based strategy) is likely to be more relevant.
Pukthuanthong and Walker (2007) suggest that the wider the guanxi network, the less likely
would a firm encounter a bad surprise in China. For instance, political connections help VCs
overcome legal and institutional failure and source good investment opportunities (Bruton
and Ahlstrom, 2003). Professional networks of customers, suppliers, investment banks, and
other related industry participants help provide inputs to their investees (Ahlstrom, Bruton,
and Yeh, 2007; Fuller, 2010). Due to the insufficient and unreliable accounting information,
less powerful boards, and problematic enforcement of contingent contracts (Wright, 2007),
close relationships with entrepreneurs may help VCs obtain accurate information and reduce
agency costs (Luo, 2000).
3. Data, variables, and methodology

7
3.1 Sources of data Our sample is collected from the VC/PE database of the Wind Financial Terminal (WIND),
one of China’s leading financial data and solutions providers. To ensure the reliability of the
data7, we cross-verify our data with the ChinaVenture, Investide, and Zero2 IPO online
sources8 . We examine VC/PE investments made between 2004 and 2010. However, as
variables such as VC reputation and success are typically measured over periods preceding or
subsequent to a VC investment, the combined sample period spans from Jan 1st, 2001 to June
30th, 2013. Following Krishnan et al. (2011), we use the VC-backed IPOs completed during
the first 3 years (2001-2003) to calculate a VC’s initial reputation in year 2004. In later years,
we update the VC reputation measure annually by using a three-year rolling window.
Therefore, ‘reputation’ is measured at the start of every year with data taken from the prior
three years, and linked to the performance of VC investments made in the subsequent year.
We classify our sample into two groups, one for successful exits (IPOs and acquisitions), and
the other for unsuccessful exits (liquidations and firms or investments that fail to exit
successfully by June 2013). The information on successful exits is available in the WIND
database. The median number of years from initial VC funding to IPO is extremely short in
China compared with the West, typically 2-3 years (Ernst and Young, 2011). Therefore, we
end our investment data in 2010 to provide a minimum of 2.5 years for a successful exit. This
is consistent with Wang and Wang (2011) and Nahata (2008)’s approach by tracing towards
at least 2.5 years and four years9 for an exit in the Chinese market and the U.S. market,
respectively.
Based on the ChinaVenture online database, VC/PE firms are classified into VC, VC/PE, and
PE firms10. We exclude investments made by the PE firms because (1) the majority of these
7 When comparing the VC/PE data across each database, we find that some data documented in our database are different from others. For example, the investment dates, the number of VC firms syndicated in an investment, and the establishment dates of portfolio firms documented in WIND are different from that in the Zero2IPO or the ChinaVenture database. In this case, we collect the data that are documented at least twice in our available databases. 8 ChinaVenture official website: http://www.chinaventure.com.cn/; Investide official website: http://www.investide.cn/; Zero2 IPO online source: http://www.pedaily.cn/en/. 9 According to Cumming and MacIntosh (2003), the average investment period for U.S. VC investments is about 5 years. 10 Some studies (i.e. Bruton, Ahlstrom, and Singh, 2002; Lu et al., 2011; Naqi and Hettihewa, 2002 ) argue that as VCs in emerging markets such as China invest heavily in traditional sectors and late-stage deals, the concept of “venture capital” in these markets is similar to that of “private equity”, rather than its meaning in the context of US. However, we find that the three groups as defined by the ChinaVenture database are significantly

8
PE investments are buy-outs of relatively mature companies, or private investments in public
enterprises (PIPEs), or pre-IPO investments; (2) we could not find information on the
managing partners/founders of many PE firms or whether they are politically connected from
the ChinaVenture online database or other available sources; We also exclude buyouts and
PIPEs made by the VC and VC/PE firms. As we could not distinguish the VC and PE
investments made by VC/PE firms, we include both VC and VC/PE investments in our
study11. We also exclude investments made in the Finance sector. This leaves us with 3,733
VC/PE investments by 179 VC firms and 80 VC/PE firms in 2,371 portfolio firms, for which
the relevant company and VC firm data are available. In the analyses of 3,733 VC
investments, each VC-portfolio firm is unique, even though the VC may have participated in
multiple rounds of financing.
Table 1 presents the distribution of our sample. We relate venture characteristics to the
headquarters of VC firms at both VC investment level and portfolio firm level. The number
of observations (N), corresponding percentages (N%), number of exits (N of exits), and
percentage of exits to total numbers of observations (% of exits) are listed separately for
domestic and foreign VCs. Panel A presents the distribution of domestic and foreign VC
investments sorted by the number of rounds invested in a portfolio firm (round) and the year
of funding. As shown, domestic VCs allocate larger percentage of their investments to first
round financing. For example, 63% of domestic VC investments receive one round of
financing, while only 42% of foreign VC’s investments receive one round of financing.
Furthermore, domestic VC investment activity experienced a rapid growth, with the number
of investments increasing from only 129 in 2004 to 576 in 2010. Foreign VC investment
activity gathered momentum during 2006-2007, presumably due to the impact of the
loosened regulation regarding overseas listing in 2006. The proportion of successful exits has
decreased sharply for foreign VC investment, while the proportion of successful exits peaked
for investments funded by domestic VCs in 2007, with an exit rate of 42%. The investments
undertaken particularly in the late 2000s have also had a shorter timeframe to exit (relative to
those in early or mid- 2000s) since our sample period is right censored at June 30th 2013.
different in terms of investment duration, VC age, portfolio firm age, etc. In unreported results, we find that PE firms have much shorter investment duration than the other two groups, and VC firms have longest investment duration and are most likely to invest in young firms. 11 This is consistent with Humphery-Jenner and Suchard (2013) who also include some VC/PE investments in their study.
9
Since these investments may eventually exit successfully, we follow Nahata (2008) and use
the Cox hazard model to account for the right-censoring involved.
At the portfolio firm level reported in Panel B of Table 1, we find that domestic VCs are less
likely to invest in young ventures. For example, about 48% of foreign VCs invest in ventures
between 0 and 3 years after establishment, while only 29% of domestic VCs are for ventures
between 0 and 3 years after establishment. On the basis of Wang and Wang (2011), we
identify the following industry groups: biotechnology, communications, computer related,
energy related, industrial related, medical and health related, other electronic related, other
service and manufacturing, real estate, and transportation. The majority of domestic VC deals
belong to the industrial sector (25%). However, foreign VCs are more likely to invest in the
high-tech sectors such as computer related (25%) and communications (23%). This is
consistent with Zhang (2012) who finds that domestic VCs are less likely to invest in high-
technology sectors because they are less risk-tolerant than their foreign competitors (mainly
U.S. VCs). Another possible explanation is that domestic VCs are less experienced compared
to U.S. VC firms which have rich experience and competitive advantages about making
investments in high-tech sectors.
According to the development level of different provinces reported by the National Statistics
Bureau of China in 2011, we divide China into five groups: east, central, west, northeast, and
Hong Kong12. As shown, 78% of portfolio firms invested by domestic VCs are located in east,
compared to 90% invested by foreign VCs. This indicates that foreign VCs are more likely to
invest in the well-developed regions in China. Based on provinces (not reported), most of the
portfolio firms in our sample are headquartered in Beijing, Shanghai, Guangdong province,
which consists of approximately 27%, 16%, 14% of our sample, respectively.
Panel C of Table 1 presents the distribution of the VCs by global region and type. As shown,
62% of VC firms are domestic VCs. Most foreign VCs are from the U.S. and other Asian
countries, which constitute 19% and 12% of our sample respectively. On the basis of Wang
and Wang (2011), we identify the following five VC types: corporate VC, government VC,
institutional VC, and traditional VC. As shown, 63% of the VC firms are traditional VCs.
12 The east includes Beijing, Tianjin, Hebei, Shanghai, Jiangsu, Zhejiang, Fujian, Shandong, Guangdong, and Hainan. The central includes Shanxi (Taiyuan), Anhui, Jiangxi, Henan, Hubei, and Hunan. The west includes Inner Mongolia, Guangxi, Chongqin, Sichuan, Guizhou, Yunnan, Tibet, Shanxi (Xi’an), Gansu, Qinghai, Ningxia, and Xinjiang. The northeast includes Liaoning, Jilin, and Heilongjiang.

10
Corporate VCs, government VCs, institutional VCs, and university VC constitute about 10%,
18%, and 9%, respectively.
[Insert Table 1 about here]
3.2 Data variables
Table 2 presents the expected signs, definitions, and data sources of all the variables included
in our study. We further define and explain these variables in the following subsections.
[Insert Table 2 about here]
3.2.1 VC performance measures (1) Investment success: Ideally, we would measure performance directly by using the rate of
returns VC firms achieve over their lives. However, such returns are usually not publicly
available, as VCs only disclose performance to their investors. According to Ljungqvist,
Richardson, and Wolfenzon (2005), complete write-offs among venture funds are as high as
75.3% on average. This implies that VCs generate most of their returns from a small portion
of their investments. Prior research documents that the majority of VC returns are from
successful exits of their portfolio companies via IPO or acquired by other strategic investors
(Cumming and MacIntosh, 2003; Hochberg, Ljungqvist, and Lu, 2007; Wang and Wang,
2011). All things equal, the more successful exits a VC has, the larger its rate of return tends
to be. Hence, we follow Nahata (2008) and Wang and Wang (2011) who use the likelihood of
a successful exit as an indirect measure for VC performance. VC investments are treated as
successful if portfolio firms go public or are acquired. Similar measures are also used by
Hochberg et al. (2007), Gompers and Lerner (2000a), and Sorensen (2007).
Table 3 Panel A shows the nature of exits by domestic and foreign VCs, and by VC and
VC/PE firms. As shown, successful rate for the whole sample is approximately 30% (see
column 1). This is higher than the 25% reported Nahata (2008) in the U.S. market while
lower than the 36% reported by Wang and Wang (2011) in cross-border VC performance of
the Chinese market. IPO exits are more likely than M&A exits for all the sub-sample groups.
However, M&A exits are less likely for domestic VC investments than for foreign VC

11
investments, whereas domestic VCs are more likely to exit by IPOs as compared to foreign
VCs (see column 4). We find no significant difference between exit preference for the VC
and VC/PE subsamples (see column 7). Figure 1 and Figure 2 exhibit the proportion of
successful VC investments that exit via IPO, sorted by foreign and domestic VCs, and by VC
and VC/PE firms, respectively. These figures show that domestic VCs are more likely to exit
through IPOs across the funding years, while VC and VC/PE firms show quite similar trend
in the exit preference.
[Insert Figure 1 about here]
[Insert Figure 2 about here]
(2) Time to exit: Time to exit is measured as the number of years between the date of VC’s
first investment in a portfolio firm and either (a) the date of exit if the investment is exited, or
(b) June 30th, 2013 if the investment is not exited. Table 3 Panel B shows the univariate
statistics for time to exit of successful exits of different groups. As shown in column 1, the
average time to exit for IPOs significantly decreased from 3.53 years in 2004 to 1.35 years in
2010, and the average time to exit for M&As dropped from 3.33 years in 2004 to 2.08 years
in 2010 (see column 8). These indicate that many of the VCs shifted their investment
preference to pre-IPO investments, especially after the establishment of the ChiNext market
in 2009. We find no significant difference in time to exit among subsamples (see column 4, 7,
11, and 14).
[Insert Table 3 about here]
3.2.2 Independent variables
(1) Political connections: In a theoretical study, Bruton and Ahlstrom (2003) argue that
connections (cognitive institutions) with key government officials are far more pervasive than
economic or legal controls (regulatory institutions) in China, given the absence of a strong
legal and administrative framework. While business transactions in the West rely heavily on
worded contracts that are enforceable under laws and regulations, China’s legal system
provides relatively little protection if things go wrong (Pukthuanthong and Walker, 2007).

12
Though the importance of political connections may be declining with the development of
institutions (Guthrie, 1998), they are still valuable assets to VC firms and are crucial to the
success of ventures in China (Ahlstrom et al., 2007; Li et al., 2008).
Humphery-Jenner and Suchard (2013) mention that the discretionary aspects13 of the listing
decision in Chinese stock market may impact the exit performance of VCs who lack political
connections. As China’s VC and IPO laws have changed over time, political connections may
prepare politically connected VCs from bad surprises. Furthermore, politically connected
VCs may have more personal interconnections with the CSRC or domestic stock exchanges
and thus may be more able to navigate the relatively complex IPO regulations in China.
Hence investments made by politically connected VCs may be more likely to be approved for
a listing in China.
In this study, we measure political connections as an indicator variable indicating whether (1)
the VC firm is government owned; or (2) the VC firm has small government ownership but
not controlled by the government; or (3) the managing partner/ founder used to be
government officials; or (4) the VC firm with its official website stating that the firm or its
managing partner/founder has close relationships with the government. Information on the
description of VC firms and their managing partners/ founders can be sourced online from the
ChinaVenture and Investide. We double check this information against each VC firm’s
official website. We predict that politically connected VCs have better exit performance as
compared to politically unconnected VCs. Since foreign VCs are claimed to be less
connected to the same networks, we expect political connections to be positively related to
domestic exit performance but have little impact on foreign VC investments.
(2) Prior experience: Venture capital fund managing partners/founders play a significant role
in enhancing the value of their entrepreneurial firms by providing financial, administrative
and strategic advice (Gompers and Lerner, 1999). Bottazzi et al. (2008) find that VC firms
with partners that have prior business experience are more active in recruiting managers and
directors, helping with raising funds, and interacting more frequently with entrepreneurial
firms. Such investor activism is shown to be positively related to the success of their
13 In China, the CSRC and the Stock Exchanges retain residual discretion to approve an issue (Securities Law Articles 12, 13(4), 48, 50(1)),

13
entrepreneurial firms. Zarutskie (2010) find that VC partners’ industry-specific human capital
is a strong predictor of VC performance. A limited number of studies have examined the
impact of human capital on VC performance in emerging markets. Our work complements
Wang and Wang (2011) who examine human capital aspects of entrepreneurs in cross-border
VC investments in China14.
Detailed information on the management team, especially on the managing partners /founders
of each VC firm, is publicly available. Specifically, this includes his/her name, positions, and
previous working experience. To analyse the impact of VC managing partners /founders’
experience on VC performance, we hand collect information from publicly available
descriptions on the managing partner/founder of a VC firm. Such information is made
available by ChinaVenture, Zero2 IPO, and VCs’ official websites.
We construct three variables as proxies for managing partner/founder’s prior experience. The
first is CEO experience which is measured as the number of firms of which the managing
partner/founder had previously served as CEOs. The second variable is management
experience, measured as the number of firms in which the managing partner/founder had
previously served as top managers, such as managers, CFO, CTO etc. The third is investment
banker experience, which is an indicator variable denoting whether the managing
partner/founder had previously served as an investment banker.
(3) VC reputation: Nahata (2008) shows that firms backed by reputable VCs are more likely
to exit successfully via IPO or M&As. However, Wang and Wang (2011) find that foreign VC
reputation15, together with foreign VC experience and networks, plays no significant role in
predicting the exit performance of Chinese portfolio firms. They reason that VC reputation
may be somewhat market-specific. There are several implications from Wang and Wang
(2011)’s finding. First, it may imply that foreign VCs’ skills, experience, and abilities
developed in their home countries may not be suitable in China. Dai, Jo, and Kassicieh (2012)
argue that VCs from different cultures may have developed investment strategies and value-
14 Our existing available databases provide little information on entrepreneurs other than his/her name. However, the ChinaVenture and Zero2IPO online sources provide descriptions on the positions, education, and working experience of a VC firm’s managing partner/ founder. 15 Foreign VC reputation is measured by Wang and Wang (2011) as the market value of all portfolio firms a VC had taken public normalized by the aggregate market value of all VC-backed firms that went public from the beginning of 1994 until the time of its first investment in portfolio companies.

14
adding abilities, which are presumably more suitable to entrepreneurial firms in their home
nations. When VCs invest in a different culture, many of their investment styles and skills
may not be useful. For instance, some of the VC’s monitoring skills, which are common in
the U.S. market, can be viewed as intrusive in China (Bruton and Ahlstrom, 2003). In this
sense, foreign VCs may need to develop local investment experience and have a set of skills
and strategies suitable to local environments. Second, reputation in the worldwide may not be
highly valued among local entrepreneurs, investors, and underwriters, who may focus more
on the creditability and visibility of a VC in the local market. For instance, local
entrepreneurs may not know the past successful exit a foreign VC had made in their home
markets.
To remove the mentioned concerns, we measure VC reputation based on VCs’ past market
share of all the Chinese portfolio firms rather than all the firms a VC had taken public
worldwide. Specifically, we measure VC reputation as an indicator variable denoting whether
the VC firm backing the portfolio firm belongs to the top quartile of VCs based on the IPO
market share at the time of initial VC funding. Due to many young domestic VCs in China,
we follow Krishnan, et al. (2011) in measuring IPO market share by using a 3-year moving
window prior to the first investment date to avoid the strong bias against younger VCs16. For
example, for companies initially funded in 2008, we first aggregate the dollar value of all
IPOs backed by the VC during years 2005, 2006, and 2007, and then normalize it by the total
dollar size of all VC-backed IPOs in the same three- year period. Following Krishnan et al.
(2011), we define the dollar size of an IPO as its gross proceeds, exclusive of overallotment
options. To ensure the consistency in currency, we use the exchange rate data from
Datastream to convert all the foreign currency of gross proceeds into Chinese RMB on the
same day when the IPOs go public. Each VC is given full credit for a completed IPO that it
backs. Since our IPO market share is based on information known before the investment date
under analysis, our reputation measure is free of look-ahead bias.
3.2.3 Control variables
16 Krishnan, et al. (2011) argue that Nahata (2008)’s cumulative IPO market share fails to adjust for the length of a VC’s active life. However, the relatively small number of Chinese companies that went public before 2004 may suggest that there would be no significant difference between Nahata’s (2008) measure and Krishnan et al. (2011)’s measure. As a robustness check, we include Nahata’s cumulative IPO market value as an alternative VC reputation measure and results are qualitatively similar (discussed in Section 5.4).

15
(1) VC connectedness: Hochberg et al. (2007) empirically examine the impact of connections
among VCs on the performance of VC firms in US. They find that better-connected VCs
experience significantly better performance. They explain that connections with other VCs
help source high-quality deal flows and add value to portfolio firms. Furthermore, well-
connected VCs can expand the range of customers and strategic alliance partners, and
improve the chances of securing follow-on funding for their portfolio firms. In this study, we
measure VC connectedness as an indicator variable denoting whether the VC firm backing the
portfolio firm belongs to the top quartile of VCs, based on the normalized number of other
VCs with which the VC firm has syndicated in the previous 5 years at the time of its first
investment in a portfolio firm.
(2) VC age: Bottazzi, et al. (2008) and Gomper et al. (2008) show the importance of VC
experience in determining VC investment performance. Kaplan and Scholar (2005) find that
returns persist strongly across subsequent funds managed by the same VC firm. They argue
that such persistence results from the underlying heterogeneity in VC experience. The more
experienced is a VC, the more monitoring role it plays in its portfolio firms, the better
performance it will have. In this study, we follow Gompers (1996), Gompers and Lerner
(1999a), and Nahata (2008) in using VC age as a proxy for VC experience.
(3) Portfolio firm age: VC investment performance is likely to depend on the stage of
portfolio firms. Nahata (2008) argue that seed/early stage investments are riskier than
mezzanine or late stage investments. A large proportion of investments were unsuccessful
when the initial funding was at seed/early stage. However, WIND database does not provide
the stage of firms during VCs’ first investment. Instead, we hand collected the establishment
dates of portfolio firms from WIND and ChinaVenture and control for portfolio firm age at
the time of VC’s first investment date. Young ventures are likely to be riskier and thus are
less likely to exit successfully.
(4) Syndicate size17: Similar to other financial institutions (i.e. banks and underwriters), VC
firms often prefer syndicating with other VCs over being the sole backer. They tend to co-
invest in portfolio firms with other VCs that they have strong relationships. Bygrave (1988)
17 According to Tian (2011), VC syndicates are a subset of VC networks. For example, the members of syndications must be in a VC’s network, while VC firms that within a VC’s network do not necessarily form syndicates investing an entrepreneurial firm.

16
argues that VC syndication facilitates the sharing of expertise, contacts, and resources. VCs
routinely cooperate with other industry participants by referring deals and people to each
other (Lerner, 1994), spreading financial risks (Bygrave, 1988), and exchanging each other’s
relationships with service providers such as investment banks (Hochberg et al., 2007).
Brander, Amit, and Antweiler (2002) find that syndicated VCs deals experience higher
returns than standalone investments. Therefore, in this study we control for the performance
implication of syndication and expect that large syndication size have positive implications
for the exit performance.
(5) Domestic market conditions for IPO and M&A: VCs’ exit performance is likely to depend
on the market conditions for IPO and M&As. Lerner (1994) finds that VCs are able to time
their exits at market peaks. Black and Gilson (1998) argue that an active IPO market
facilitates VC exits. Nahata (2008) finds that the larger the number of IPO or M&A
transactions, the higher probability is that VCs exit successfully during that period. Wang and
Wang (2011) use the same measures but find no significant relation between domestic exit
market environment and cross-border VC performance in the Chinese VC market. They
reason that due to unfavourable exit environment in China during 1999-2006, foreign VCs
exit mainly through IPOs and M&As in the overseas market. Therefore, domestic exit market
conditions have little impact on foreign VC performance.
With the development of China’s capital market, this situation is improving. The
improvement of the SME Board and the recent introduction of the ChiNext Board enable
both foreign VCs and local VCs to exit within the country. To control for the domestic exit
market environment, we follow Nahata (2008) and Wang and Wang (2011) in using the
quarterly number of IPOs and M&As prior to a successful exit. For unsuccessful exits, we
follow Nahata (2008) in using the average of the quarterly number of IPOs and M&As
transactions over the entire time period starting from the portfolio firms’ initial date of
funding. This may be imprecise. To alleviate this concern, we allow for time-varying exit
market conditions in our Cox hazard model.
(6) VC industry competition: Gompers and Lerner (2000b) show that when more money
inflows into the VC industry, the prices a VC pays for investing for a portfolio firm will be
driven up, holding investment opportunities constant. They interpret this as evidence that
competition for scarce investment opportunities increasing the valuation of portfolio firms.

17
Hochberg et al. (2007) and Nahata (2008) use the lagged aggregate fund inflows as a measure
for VC industry competition for deal flows, and they show that this measure is inversely
related to the subsequent performance of their portfolio firms. Similarly we control for VC
industry competition in our regressions in using the lagged aggregate inflows into China’s
VC industry in the year prior to a VC’s first investment in a portfolio firm. We collect this
information from Zero2 IPO online database.
(7) Location indicator: Due to the absence of strong regulatory and normative institutions,
VCs are more likely to fund firms near their offices (Bruton and Alhtrom, 2003). By funding
deals near offices, VCs can easily screen and monitor local deals while also building guanxi
with entrepreneurs and local authorities. These connections are important and are valuable
assets to VC firms (Luo, 2000). We hand collect VC firm office locations from ChinaVenture
and VCs’ official websites, and create an indicator variable denoting whether portfolio firms
are located in the same province as a VC firm’s office.
(8) Corporate VC indicator: Gompers and Lerner (2000a) argue that corporate VCs can
select better ventures and provide more value-added services to portfolio firms. They may use
information from their related lines of business and bring in potential customers and suppliers
using their extended networks. Thus corporate backing may have positive implications on
exit performance of portfolio firms. We capture this impact by creating an indicator variable
denoting presence of corporate VCs in the VC investments.
(9) Institutional VC indicator: With better networks with other services providers, VCs
affiliated to institutions may be more likely to bring their portfolio firms to the public.
Subsequently, we create an indicator variable denoting presence of institutional VCs in the
VC investments.
(10) Other factors: We include industry dummies to account for the industrial characteristics
of portfolio firms and year dummies to control for the changing economic conditions in
China.
3.3 Methodology

18
We use logistic and Cox hazard models to analyse VC performance. The dependent variable
for the logistic model is investment success, a dummy that takes 1 if a VC-backed firm went
public or was acquired by June 30st, 2013 and 0 otherwise. The dependent variable for the
Cox hazard model is the logarithm of one plus time to exit, which is measured as the number
of years between the date of VC’s first investment in a portfolio firm and either (1) the date
of exit if the investment is exited, or (b) June 30th, 2013 if the investment is not exited.
According to Giot and Schwienbacher (2007), VC-backed firms first exhibit an increase in
the likelihood of exit; after reaching a plateau, investment that yet to exit have lower and
lower possibilities to exit as time increases. The Cox hazard model considers the fact that, at
the time of analysis, investments may have not exited successfully by June 30th, 2013. It takes
into account the right-censored feature of the data and is a semi-parametric model in which
the hazard function is independent from the quantity of time18. We create an ‘event’ variable
that equals one if the investment is exited and 0 otherwise.
Similar to Nahata (2008) and Wang and Wang (2011), we measure most of our explanatory
variables, including VC reputation, political connections, and prior experience, at the time of
either VC firms’ first investment in portfolio firms or prior to the year of their first
investments. Specifically, we measure VC reputation, VC connectedness, and VC industry
competition prior to the year of VC’s first investment in a portfolio firm. VC age, portfolio
firm age, and political connections are measured at the time of each VC’s first investment in
a portfolio firm. Prior experience is measured before their joining a VC firm. This
methodology can effectively address concerns regarding reverse causality that better
performance leads to better VC reputation, political connections, and prior experience
(Nahata, 2008).
3.4 Summary statistics Table 4 presents the summary statistics for our sample of VC investments in the Chinese
portfolio firms. The mean values are presented. As shown, 29% of portfolio firms exit
successfully through IPOs and acquisitions. The average time to exit for the whole sample is
4.49 years. Domestic VCs (4.18 years) generally have shorter time to exit in Chinese
portfolio firms compared to foreign VCs (4.94 years). About 40% of the VC investments are
18 For detailed information of this model, please see Lee and Wang (2003) and Giot and Schwienbacher (2007).

19
funded by VCs with political connections 19 . The percentage of investments made by
government-controlled VCs, VCs with small government ownership, VCs with managing
partner/founder previously being government officials, and VCs with its official website
stating that the firm or its managing partner/founder has close relationships with the
government are 18%, 8%, 7% and 8 %, respectively. Domestic VCs (0.58) and VC/PE firms
(0.44) are more politically connected as compared to foreign VCs (0.14) and VC firms (0.37),
respectively20.
As for managing partner/ founder’s experience, the managing partner/ founder at the time of a
portfolio firm’s receiving the first VC funding has on average served as CEO of 0.34 other
firms and as a top manager of 0.75 other companies. About 18 % of the VC investments are
funded by VCs with managing partner/founder previously being an investment banker. On
average, foreign VCs generally are more reputable and better connected than local VCs.
Domestic VCs (6.60 years) are much younger than that of foreign VCs (12.32 years), while
VC/PE firms (6.49 years) are generally older than VC firms (5.33 years). Domestic VCs
(6.52 years) are less likely to invest in young firms than foreign VCs (4.81 years). On average,
three VCs form a syndicate in a portfolio company, which is the same as that reported in
Wang and Wang (2011). Also there are 48 IPOs and 121 M&As in the quarter prior to a
portfolio firm’s exit. About 66% of VC investments are near to the offices of VC firms. The
percentage of investments made by institutional VCs and corporate VCs are 8% and 7%,
respectively.
[Insert table 4 about here]
Table 5 shows the correlation matrix of our independent variables. All the correlations are
within accepted range. We also perform the VIF test (not reported) and find that there is no
multicollinearity issue in our regressions.
[Insert table 5 about here]
19 About 55% domestic VCs in our sample are politically connected, while only 9% of foreign VCs are. 20 In unreported statistics, we find that 60% of domestic investments are VC investments, and 40% are VC/PE investments. For foreign investments, 52% and 48% are VC and VC/PE investments, respectively.

20
4. Analysis at the VC investment level In this section, we estimate the impact of political connections, prior experience, and VC
reputation on VC performance. Our sample consists of 3733 investments made by 179 VC
and 80 VC/PE firms. We first present a logistic analysis with investment success as the
dependent variable. We relate the likelihood of investment success to the following variables:
political connections, prior experience, VC reputation, VC connectedness, VC age, portfolio
firm age, syndicate size, domestic IPO and M&A market conditions, VC industry competition,
location indicator, institutional VC indicator, and corporate VC indicator. The definitions,
expected signs, measures and data sources of all variables are listed in table 2. Though not
reported, we include industry indicators for each VC investment and control for year effects
based on the VC’s initial funding year in a portfolio firm.
Table 6 reports the results. The p-values have been adjusted for heteroskedasticity and
clustering by venture firms. Model 1 shows the results for the whole sample, whereas Model
2 and 3 shows the results for the domestic and foreign VC investments, respectively. Model 4
and 5 shows the regression results for VC and VC/PE investments respectively. We find a
significantly positive impact of political connections on VC investment success for all the
samples. This provides empirical evidence that political connections increase the likelihood
of exit in China. However, it may not necessarily improve the investment outcomes of
foreign VCs as the political connections variable is only positive at 10% significance level.
This is consistent with Mann’s case study (1997) that guanxi with the government would not
be sufficient to guarantee success for foreign VCs in China. For domestic VC investments, a
standard deviation increase in political connections increases the odds of investment success
by approximately by 15.2%. The impact of political connections is stronger for VC
subsample than for VC/PE subsample investments. A standard deviation increase in political
connections increases the odds of investment success by approximately 25 % and 13% for the
VC and VC/PE investments, respectively.
Furthermore, we find that prior experience is positively related to VC investment success.
Specifically, the odds of investment success increases by 9%, 13%, 13% for a standard
deviation increase in CEO, management, and investment banker experience respectively.
Such impact is strong for the investments funded by domestic VCs, but not for the
investments funded by foreign VCs. One possible reason is that managing partners/founders

21
of foreign VCs generally have more overseas working experience, which may not have
significant value in Chinese market.
However, we find that VC reputation is unrelated to VC investment success for all models.
This adds fresh evidence to Wang and Wang (2011) that VC reputation has little value in
Chinese market, regardless of the headquarters of VC firms or the nature of VCs. There are
many possible reasons for this finding. First is the presence of significant changes in laws and
regulations in China. For example, in April 2003 the Chinese government waived its approval
for domestic enterprises to be listed overseas. However the regulation was tightened in 2005
and subsequently in 2006 the government promulgated a regulation that all foreign listings
require the approval by CSRC. As the CSRC has taken a relatively restrictive approach, these
policy changes had “put an end to the short honeymoon enjoyed by foreign VC” (Lu et al.,
2011, p.11)21. Second is the introduction of the Small and Medium Enterprises (SME) Board
in 2004 and the venture board in 2009 that has increased the likelihood of an IPO exit of
domestic VCs (Humphery-Jenner and Suchard, 2013). With better network and government
background, domestic VCs that are less reputable compared to foreign VCs are in a
competitive advantage to exit via domestic stock exchanges.
Third, the increasing amount of pre-IPO investments may lead to little value of VC reputation
in Chinese market. IPO exiting from portfolio firms could bring huge profits to the funds as
well as establishing “reputation” in the market. Many VCs invest in firms prior to their listing
for the purpose of being “free rider” (Zhang, 2012). Hence, the authentic exit of VCs from
their portfolio firms may be far less than 30% as reported earlier, and the reputation may be
exaggerated for many VC firms. Fourth, entrepreneurs of Chinese private firms may care
more about the amount of capital they can received from VCs22 and the possibility of being
listed on stock exchanges, rather than the reputation of VCs. Zhang and Li (2011) find that
many venture board listed firms accept pre-IPO investments because pre-IPO investors can
improve the passing rate when applied to CSRC for listing. Last but not the least, reputation
21 We find that in 2001-2006 IPOs in other markets (including Hong Kong markets) accounted for 71% of all exits, while in 2007-2010 the percentage of IPOs in other markets dropped to 40% of all exits. The majority of these IPOs are listed on Hong Kong markets and U.S. markets. 22 To list on the Chinese Main Board in SHSE and the SME Board in SZSE, firms are required to have market capitalisation of at least RMB 30 million before IPO (Securities Law, Article 50(2)). The venture board (ChiNext) in SZSE requires net assets of no less than RMB 20 million at the end of the most recent year and market capitalisation of no less than 30 million after IPO (Interim Measures on the Administration of Initial Public Offerings and Listing of Shares on the ChiNext, Article 10 (3), 10(4)).

22
based on our measure may be something that needs to be learned over time by entrepreneurs.
Given the relatively new VC market in China, they therefore may rely on other metrics to
gauge reputation.
The control variables also affect the performance of VC investments. VC age is negatively
related to investment success for domestic VCs. This is because many young domestic VCs
invest in pre-IPO firms since the establishment of the SME and ChiNext Board and their exit
performance are thus exaggerated. As expected, we find that portfolio firm age positively
affects VC performance. The older the portfolio firm when it receives VC funding, the higher
the likelihood of a successful exit. Consistent with Brander, et al. (2002) and Nahata (2008),
we find that syndicate size positively affects performance of VC investments. Unexpectedly,
domestic M&A conditions are negatively related to investment performance23 and domestic
IPO market conditions decrease the odds of exit for foreign VC investments.
Location indicator is negatively related to VC performance. This is inconsistent with our
prediction that portfolio firms located near the offices of VCs are more likely to exit due to
better connections and monitoring of VCs in the cities where they have offices (Bruton and
Ahlstrom, 2003). There are two possible reasons for this result. One is that the majority of
VCs have their offices in large cities such as Beijing, Shanghai, Guangdong, and Hong Kong.
Fierce competition for portfolio firms in these cities may result in either high valuations or
VCs investing in ventures of average quality. Secondly, the screening procedures may be
more rigorous before VCs decide to invest in portfolio firms that are not located near their
offices.
The VC industry competition is insignificant after controlling for the year fixed effects for the
whole sample. The institutional VC indicator is positively related to the performance of
foreign VCs but unrelated to domestic VC performance. This is consistent with Wang and
Wang (2011) that institutional VCs have valuable services to portfolio firms and thus are
23 The negative correlation success may be because although there were better M&A market conditions during later periods, there were only a small number of M&A exits by VC firms. A possible reason was that VCs preferred to exit through IPOs in order to gain reputation in the Chinese VC market and joined the IPO wealth campaign since the establishment of the ChiNext market. In an unreported subsample tests, we find that domestic IPOs conditions is negatively related to investment success only for investments made during 2009-2010 when the ChiNext Board was introduced.

23
more likely to do well. Domestic corporate VCs have better exit performance while foreign
corporate VCs have similar exit performance as compared to other type of VC firms.
[Insert Table 6 about here]
Next, we analyse VC investments using a Cox hazard model. The dependent variable is the
logarithm of one plus time to exit. We trace the performance of the sample until June 30th,
2013, which allows at least 2.5 years for an exit. Time to exit is measured as the number of
years between the date of VC’s first investment in a portfolio firm and either (1) the date of
exit if the investment is exited, or (b) June 30th, 2013 if the investment is not exited. We
create an ‘event’ variable that equals one if the investment is exited and 0 otherwise.
The results are reported in Table 7. In the Cox hazard framework, positive (negative)
coefficients of a variable indicates that the covariate increases (decreases) the hazard and
hence a shorter (longer) expected time to exit. We find that most of the results mirror the
evidence reported earlier. In particular the coefficients for political connections are positively
related to time to exit for domestic VC investments but unrelated to that for foreign VC
investments. Specifically, a one standard-deviation increase in political connections is
associated with a 16% increase in the hazard of a domestic VC’s successful exit. Furthermore,
we find that management experience speeds up an investment’s exit for all groups. For
example, a one standard-deviation increase in this variable increases the hazard of a domestic
VC’s exit by 17% and a foreign VC’s exit by 10%. CEO and investment banker experience
increases the hazard of exits for domestic VCs but not for foreign VCs. Specifically, the
hazard of a domestic VC’s exit increases by 10% and 15% for a one-standard deviation
increase CEO and investment banker experience, respectively. Similar to Wang and Wang
(2011), we find that the coefficients for the VC reputation are insignificant for all groups.
As before, VC investments with larger syndicate size and older portfolio firms result in
shorter expected time to exit. Domestic IPO and M&A market conditions predict longer time
to exit. Corporate and institutional VCs speed up their portfolio firms’ exit. VC
connectedness, VC age, and VC industry competition are unrelated to the expected time to
exit.
[Insert Table 7 about here]

24
5. Robustness tests
In the previous section, political connections and prior experience have emerged as
consistent predictors of VC performance, especially for domestic VC investments; while VC
reputation is unrelated in China. In this section, we conduct some robustness tests to check
the reliability of our results.
5.1 Analysis at the portfolio firm level
In unreported tables, we conduct performance analysis at the portfolio firm level using the
logistic and Cox hazard models with the unit of analysis being a portfolio firm. The number
of observations reduces to 2371 and we focus only on the initial VC funding for each
portfolio firm. We identify the political connections and prior experience of the lead VC at
the initial VC funding. Here the lead VC is the VC firm that (1) participated in the first round
of financing; and (2) made the largest investments or involved in the most rounds of
financing in a portfolio firm. We find that the results are consistent with the earlier results on
individual VC investments. Specifically, a one standard deviation increase in political
connections, CEO, management and investment banker experience increase the odds of
investment success respectively by 19%, 13%, 15%, and 15%, and these are associated with a
16%, 10%, 14%, and 11% increase respectively in the hazard of a portfolio firm’s successful
exit.
5.2 IPOs vs M&As As a further robustness check, we examine the likelihood of an investment’s exit via one of
the three major routes-IPOs, M&As, or liquidations (including non-exits), in a multinomial
logistic framework24. We attempt to investigate differences in our measures of political
connections and prior experience on exit routes of IPOs versus M&As. Table 8 reports the
results of our multinomial logistic regressions on our measures of political connections, prior
experience, VC reputation, and other control variables in our earlier analysis. As shown,
political connections, CEO, management and investment banker experience increase the
choices of VCs towards an IPO exit, but not towards a M&A exit. One possible reason is that
24 In unreported tables, we examine the multinomial logistic analysis of different exits at the portfolio firm level and find that the results are qualitatively the same.

25
politically connected VCs and VCs with experienced managing partners/founders have more
personal interconnections with the CSRC or the domestic stock exchanges which facilitate
IPO exits in China.
[Insert Table 8 about here]
5.3 IPO exit in mainland stock exchanges vs IPO exit in other stock exchanges To check whether politically connected VCs and VCs with experienced managing
partners/founders are more connected to the CSRC or the domestic stock exchanges, we
examine the likelihood of a VC investment exit via IPO in mainland stock exchanges, IPO in
other stock exchanges (including Hong Kong), M&As, and liquidations (including non-exits)
in a multinomial setting. The exit likelihood is regressed on our measures of political
connections, prior experience, VC reputation, and other control variables. The results are
reported in Table 9. We find that political connections and investment banker experience
increase the odds of a domestic VC’s choice towards an IPO exit via mainland stock
exchanges, while political connections have negative impacts on the likelihood of an IPO exit
through other markets. This is consistent with our prediction that politically connected VCs
and VCs with managing partners/founders previously working as investment bankers have
more connections with the CSRC or the domestic stock exchanges, which facilitate the
domestic exits of their portfolio firms.
Instead, management experience enhances a portfolio firm’s exit through both mainland and
other stock exchanges. CEO experience increases the odds of a foreign VC’s exit through
other markets. For foreign VC investments, we find that VC reputation has positive impacts
on their IPO exits via the Chinese mainland markets, but has no impact on other exits. This
may be because we measure foreign VC reputation based on the IPO market share of all the
Chinese portfolio firms a VC has taken public.
[Insert Table 9 about here]
5.4 Alternative measure for VC reputation
An inappropriate measure of VC reputation variable could lead to the cause of insignificance

26
of VC reputation on VC performance. To rule out this possibility, we test several other
measures of VC reputation. Following Nataha (2008) and Wang and Wang (2011), we use the
cumulative IPO market share as an alternative measure for VC reputation. In this study, the
cumulative IPO market share is measured as an indicator variable denoting whether the VC
backing the portfolio firm belongs to the top quartile of VCs based on the normalized market
value of all the portfolio firms a VC had taken public from the beginning of 2000 until its
first investment in the portfolio firm. This measure incorporates at least four years of VC
performance if the portfolio firm received its funding in 2004. For companies that received
their initial funding in 2010, this reputation measure incorporates 10 years of VC
performance from 2000 to 2009. We find that our result remain qualitatively the same.
Krishnan et al. (2011) argue that VC reputation measure based on the IPO market value of
successful portfolio may be strongly influenced by a few large IPOs. As a further robustness
check, we include the IPO proportion which is measured as the number of Chinese portfolio
firms a VC has taken public over the prior 3 years, relative to the total number of VC-backed
IPOs during the same period. Again, we find that our result remain qualitatively the same.
5.5 The strength of political connections
We further test whether VC performance is affected by the strength of political connections.
Specifically, we classify politically connected VC firms into four groups, from the strongest
to the weakest connection: (1) Government controlled VCs (Government controlled), (2) VCs
with state ownership but not controlled by the government (Small government ownership), (3)
VCs with managing partners/founders previously being government officials (Government
officials), and (4) VCs with their official websites stating that they have close relationships
with the government (Close relationships with the government). A VC that fits in more than a
group will be included in the group with the strongest political connection. For example, if a
VC is partially owned by the State and at the same time is claimed to have close relationship
with the government in its official website will be considered as VC with state ownership.
Therefore, each of these groups is exclusive.
We rerun the logistic, Cox hazard, and multinomial logistic models by replacing the variable
political connections in Table 6-9 with the four subgroups of political connections. For
brevity, we only present the multinomial logistic analysis of different exits in Table 10, which

27
shows that all the four groups of political connections enhance the probability of going public
in the Chinese mainland stock markets. However, investments made by government
controlled VCs are less likely to go public in other markets.
[Insert Table 10 about here]
5.6 Correction for selection bias
The parameter estimates in previous tables could be biased due to a ‘selection’ effect where
better portfolio firms are more likely to be matched with politically connected VCs or VCs
with experienced managing partners/founders. If this match is non-random, it is possible that
the independent variables are correlated with the regression terms, leading to biased estimates.
In this study, we employ two methods to examine whether our results are robust to selection
issues: the classic instrumental variables (IV) approach and Heckman’s (1979) correction
procedure.
The IV approach is often used in the literature to address the potential endogeneity problem
(Berger, Miller, Peterson, Rajan, and Stein, 2005; Hellmann, Lindsey, and Puri, 2008). A
common choice for instruments is “the local availability of the selected characteristic”
(Bottazzi et al., 2008, p499)- political connections and prior experience in our case. The main
idea is that, for instance, the local availability of politically connected VCs affects the
likelihood of a portfolio firm’s match with a certain politically connected VC. But once a
match is made, the local availability of politically connected VCs becomes irrelevant, since
all that matters is the political connections of the chosen VC firm. Therefore it is reasonable
to use the local availability of politically connected VCs as an instrumental variable for
political connections. In this study, we define the local availability of politically connected
VCs as a fraction where the denominator measures the number of portfolio firms in our data
set that are made in a company’s region25, and where the numerator measures how many of
these portfolio firms were made by a politically connected VC. We follow Bottazzi et al.
(2008) by excluding the observation itself from both the numerator and denominator, in order
25 As documented in the Section 3.1, the majority of VC investments were made in the East of China and most of the portfolio firms are headquartered in Beijing, Shanghai, and Guangdong province. To better capture the local availability of politically connected VCs and experienced managing partners/founders, we further classify the eastern provinces into five groups. Specifically, we include Beijing, Shanghai, and Guangdong as three separate groups, Jiangsu and Zhejiang as another group. The rest eastern provinces are included as a separate group.

28
to not use an observation as its own instrument.
We use a two-step procedure to correct for endogeneity. In the first step, we estimate political
connections using the instrumental variable local availability of politically connected VCs
and other covariates in a Probit model. In the second step we use the estimates of political
connections from the first step to estimate the following measures of VC performance:
investment success, time to exit, and IPO versus M&As by using the logistic, Cox hazard, and
multinomial logistic models respectively. The results are shown in model 1-4 in Table 11.
The selection equation (model 1) shows that a politically connected VC is more likely if its
managing partner/founder has less CEO experience and more management experience, and if
the VC is more reputable and less connected. Also, politically connected VCs are less likely
to syndicate with other VCs, more likely to invest during periods of high fund inflows, and
more likely to invest near offices. Interestingly, portfolio firm age and domestic market
conditions have little impact on the investment behavior of politically connected VCs.
Model 2-4 show that adding the selection equation hardly affects the main models at all,
suggesting that selection does not interfere much with our regressions. We also find that the
local availability of politically connected VCs is significantly positive which validates that it
is a relevant instrument. As a further robustness test, we use local availability of experienced
managing partner/founders as instruments for prior experience and find that results remain
the same.
Although the IV approach is widely used, a weakness is that it requires a fairly narrow
specification of how endogeneous selection takes place (Bottazzi, et al., 2008). In our case,
the IV approach assumes that portfolio firms select VCs based on a single characteristic,
political connection. However, the matching process between portfolio firms and investors
are more complex, involving several investor and company characteristics. We therefore
follow Nahata (2008) and consider Heckman’s correction procedure that allows for a richer
selection model.
Similar to the first method, we model a politically connected VC’s likelihood of investing in
a portfolio firm using a Probit model in the first step. In the second step, we add λ, the
inverse Mills ratio, received from the first Probit model as an additional regressor to estimate
each measure of VC performance: investment success, time to exit, and IPO versus M&As.

29
Model 5-7 of Table 11 reports the results for the Heckman correction procedure. Once again
we find that our results are qualitatively the same after accounting for selection bias. We find
that the inverse Mills ratio derived from the first step is significant indicating that it is
important to control for the selection bias associated with a VC’s match with their portfolio
firms (Sørensen, 2007).
[Insert Table 11 about here]
5.7 Further robustness checks
We have also done several other robustness tests and here shows a summary of these tests.
First, considering the current situation in China’s IPO market, we introduce a different
definition of investment success. Under the current regulation, firms that have met the IPO
requirements still have to wait until the CSRC says they can go public (People’s Daily Online,
2013). The sluggish stock market in China leads to fewer permissions handed out by the
CSRC. Since the late 2012, IPOs on China’s A-share market slowed significantly, with fewer
newly listed firms. To some extent, firms receiving more rounds of funding or later stage of
funding are more likely to have a successful exit. Hence we follow Wang and Wang (2011)
and introduce a different definition of investment success which equals 1 if the portfolio firm
went public, or was acquired, or received follow-up funding before June 30th 2011, and 0
otherwise. The investment success in portfolio firm level increases from 24% to 30% after
this adjustment. The main results remain qualitatively the same, indicating that our results are
robust to changes in the measure of success.
Second, we follow Cumming (2006) by controlling a VC’s portfolio size, and this is
measured as the logarithm of the number of portfolio firms a VC had invested in China. We
find a significant negative relationship between portfolio size and VC performance, while our
main results are robust to including the portfolio size.
Third, considering the possible impact of the split share structure in 2005, we rerun our
regressions using a subsample which excludes the investments made in 2004 and 2005. The
sample size is reduced to 3,139 VC investments and 2,005 portfolio firms. We find that our
main results remain qualitatively the same.

30
Fourth, after winsorizing the top and bottom 1% and 5% of each variable, we find that our
results are very similar to the results reported earlier.
6. Conclusion This study examines the determinants of VC performance in Chinese market. Unlike existing
studies, we focus on the impacts of political connections, managing partner/founder’s prior
experience, and VC reputation on both domestic and foreign VC investments. VC reputation
has little value in explaining VC performance in China. Instead, we find that political
connection and managing partner/founder’s prior management and investment banker
experience positively impact the investment success and time to exit for domestic VC
investments, but not for foreign ones.
The main implication from this study is that empirical evidence predominantly derived from
the developed U.S. market regarding the positive role of VC reputation in investment
performance is not equally applicable in emerging markets like China. Instead, regulatory
environment and the informal institutions such as connections play a significant role in
predicting the performance of domestic VC investments in emerging markets.

31
Table 1: Sample distribution The sample contains 3733 VC and VC/PE investments by 179 VC firms and 80 VC/PE firms in 2371 Chinese domestic firms that receive capital between 2004 and 2010. We relate venture characteristics to the headquarters of VC firms at both VC investment level and portfolio firm level. We relate venture characteristics to the headquarters of VC firms at both VC investment level and portfolio firm level. The number of observations (N), corresponding percentages (N %), number of exits (N of exits), and percentage of exits to total numbers (% of exits) are listed. We present round number and year of funding of both foreign and domestic VC investments in panel A. In Panel B, we sort entrepreneurial firms by their portfolio firm age at the time of initial VC funding, industry, and location. Panel C shows the distribution of VC firms by global region and VC type. Domestic Foreign
N [1]
N % [2]
N of exits [3]
% of exits [4]= [3]/[1]
N [5]
N % [6]
N of exits [7]
% of exits [8] =[7]/[5]
Panel A: VC investment level analysis Round Round 1 1405 63% 347 25% 629 42% 138 22% Round 2 528 24% 176 33% 498 33% 131 26% Round 3 and plus 301 13% 152 50% 372 25% 156 42% Total 2234 100% 675 30% 1499 100% 425 28% Year of funding 2004 129 6% 51 40% 150 9% 76 51% 2005 146 7% 56 38% 169 11% 52 31% 2006 216 10% 76 35% 301 19% 102 34% 2007 397 18% 166 42% 319 20% 75 24% 2008 412 18% 124 30% 347 22% 54 16% 2009 358 16% 99 28% 121 8% 28 23% 2010 576 26% 103 18% 192 12% 38 20% Total 2234 100% 675 30% 1599 100% 425 27% Panel B: portfolio firm level analysis Portfolio firm age [0,3] 448 29% 63 14% 402 48% 63 16% [3,6] 341 22% 96 28% 178 21% 45 25% [6,9] 336 22% 109 32% 110 13% 37 34% [9,12] 203 13% 73 36% 69 8% 25 36% 12+ 210 14% 55 26% 74 9% 23 31% Total 1538 100% 396 26% 833 100% 193 23% Industry Biotechnology 48 3% 7 15% 19 2% 4 21% Communications 206 13% 37 18% 193 23% 40 21% Computer related 198 13% 34 17% 210 25% 38 18% Consumer related 234 15% 60 26% 143 17% 36 25% Energy related 82 5% 18 22% 28 3% 7 25%

32
Industrial related 381 25% 121 32% 63 8% 18 29% Medical and health related 103 7% 17 17% 58 7% 14 24% Other electronic related 224 15% 84 38% 97 12% 29 30% Other services and manufacturing 24 2% 7 29% 8 1% 3 38% Real estate 16 1% 3 19% 10 1% 3 30% Transportation 22 1% 8 36% 4 0% 1 25% Total 1538 100% 396 26% 833 100% 193 23% Location of portfolio firms East 1192 78% 304 26% 752 90% 168 22% West 132 9% 31 23% 41 5% 13 32% Northeast 39 3% 4 10% 12 1% 3 25% Central 166 11% 51 31% 16 2% 2 13% Hongkong 9 1% 6 67% 12 1% 7 58% Total 1538 100% 396 26% 833 100% 193 23%
Panel C: Distribution of VC firms by global region and type Type Corporate VC Government VC Institutional VC Traditional VC Total % Global region Mainland 14 43 11 91 159 62% Hong Kong 2 0 3 8 13 5% Asia 5 3 6 16 30 12% U.S. 4 0 2 44 50 19% Europe 2 0 1 3 6 2% Total 27 46 23 162 258 100% % 10% 18% 9% 63% 100%

33
Table 2: Description of variables This table presents the expected signs of independent variables, and data sources, definitions, and measures for all the variables included in our study.
Variables Expected signs Data source Definition and measurement Dependent Variables Investment success
WIND, ChinaVenture and Zero2IPO online sources
1=if the VC-backed portfolio firm went public or was acquired before June 30th, 2013 and 0 otherwise
Time to exit
WIND, ChinaVenture and Zero2IPO online sources
Time to exit is the number of years between the date of VC’s first investment in a portfolio firm and either (a) the date of exit if the investment is exited, or (b) June 30th, 2013 if the investment is not exited.
Independent Variables Political collections
+ Hand collected from China-Venture and Investide online sources
An indicator variable denoting whether (1) the VC firm is government controlled; or (2) the VC firm has small government ownership but not controlled by the government; or (3) the managing partner/ founder used to be government officials; or (4) the VC firm has its official website stating that the firm or its managing partner/founder has close relationships with the government.
Managing partner/founder’s prior experience CEO experience
+ Hand collected from ChinaVenture and Zero2 IPO online sources, and VC firms’ official websites
The number of firms the managing partner/founder had previously worked as CEO
Management experience
+ Hand collected from China-Venture and Zero2 IPO online sources, and VC firms’ official websites
The number of firms the managing partner/founder had previously worked as top managers (manager, CFO, etc)
Investment banker experience
+ Hand collected from China-Venture and Zero2 IPO online sources, and VC firms’ official websites
An indicator variable denoting whether the managing partner/founder had previously served as investment banker.
VC reputation
+ WIND, ChinaVenture,and Investide online sources, and Datastream
An indicator denoting whether the VC firm backing the portfolio firm belongs to the top quartile of VCs based on the IPO market share at the time of initial VC funding. The IPO market share is the dollar size of all portfolio firms taken public by a VC firm in the previous 3 years normalized by the aggregate size of all VC-backed Chinese portfolio firms taken public during the same period
VC connectedness
+ WIND, ChinaVenture, Investide, and Zero2IPO online sources
An indicator variable denoting whether the VC firm backing the portfolio firm belongs to the top quartile of VCs based on the normalized number of other VCs with whom the VC firm has syndicated in the previous 5 years at the time of its first investment in a portfolio firm.
VC age + WIND, ChinaVenture, The logarithm of one plus the VC firm's age at the time of its first investment in a portfolio firm

34
Investide, and Zero2IPO online sources
Portfolio firm age
+ Hand collected from WIND
The logarithm of one plus the number of years between portfolio firm's establishment date and VC's first investment date in a portfolio firm
Syndicate size
+ WIND, ChinaVenture, Investide, and Zero2IPO online sources
The number of VC firms which participate in a portfolio firm’s funding
Location indicator
+ Hand collected from China-Venture and VC firms’ official websites
1= if portfolio firms are located in the same province as one of the offices of VC firms, 0 otherwise
VC industry competition
- Zero2IPO online source
The logarithm of the aggregate fund flows in China's VC industry prior to VC's first investment in a portfolio firm
IPO and M&A market conditions Domestic IPO + conditions
WIND
The logarithm of one plus the lagged quarterly number of IPOs in Mainland China prior to a portfolio firm’s exit. For investments yet to exit successfully before June 30th, 2013, it is the logarithm of one plus the average of the lagged quarterly number of IPOs over the entire time period starting from the date of the portfolio firm’s receiving its first funding.
Domestic M&A + Conditions
WIND
The logarithm of one plus the lagged quarterly number of M&As in Mainland China prior to a portfolio firm’s exit. For investments yet to exit successfully before June 30th, 2013, it is the logarithm of one plus the average of the lagged quarterly number of M&As over the entire time period starting from the date of the portfolio firm’s receiving its first funding.
Institutional VC indicator
+ WIND and ChinaVenture online source
1= investments made by institutional VCs, 0 otherwise
Corporate VC indicator
+ WIND and ChinaVenture online source
1=investments made by corporate VCs , 0 otherwise

35
Table 3: Exit-based univariate statistics This table contains exit-based statistics for successful VC investments. Panel A presents sample proportions and sample observations. The row title denotes the exit type and the column title states the subsample under analysis. Panel B shows the univariate statistics for time to exit by exit type (IPO and M&As). Time to exit is measured as the time between VC firms’ investment dates and portfolio firms’ exit dates. The row title denotes the year of funding and the column title states the sample. The significance levels at 1%, 5%, and 10% are identified by ***, **, and *, respectively. Panel A: VC investments exits sorted by the headquarters and nature of VC firms Sample
All [1]
Domestic [2]
Foreign [3]
Difference [4]=[2]-[3]
VC [5]
VC/PE [6]
Difference [7]= [5]-[6]
Sample proportions Exits 0.29 0.30 0.28 0.02 0.29 0.30 -0.01 IPO exits 0.23 0.25 0.19 0.06*** 0.22 0.23 -0.01 M&A exits 0.06 0.05 0.09 -0.04*** 0.07 0.06 0.01
Observations Exits 1100 675 425 616 484 IPO exits 847 558 289 465 382 M&A exits 253 117 136 151 102 Panel B: Time to exit for successful investments by year of funding Exit type IPO M&A Year of funding
All [1]
Domestic [2]
Foreign [3]
Difference [4]=[2]-[3]
VC [5]
VC/PE [6]
Difference [7]=[5]-[6]
All [8]
Domestic [9]
Foreign [10]
Difference [11]=[9]-[10]
VC [12]
VC/PE [13]
Difference [14]=[12]-[13]
2004 3.53 3.72 3.34 0.37 3.67 3.26 0.41 3.33 2.83 3.66 -0.82 3.35 3.18 0.17 2005 2.56 2.85 2.26 0.60 2.85 2.31 0.55 3.91 4.27 3.75 0.53 4.22 3.60 0.62 2006 2.53 2.48 2.57 -0.09 2.87 2.09 0.78 3.49 3.84 3.32 0.52 3.68 3.17 0.51 2007 2.70 2.77 2.62 0.15 2.74 2.72 0.02 3.10 3.07 3.13 -0.06 3.47 2.75 0.73 2008 2.34 2.35 2.32 0.03 2.18 2.58 -0.39*** 3.12 3.17 3.06 0.11 3.00 3.30 -0.30 2009 1.43 1.56 1.30 0.26 1.58 1.41 0.17 2.34 2.45 2.16 0.28 2.38 2.29 0.09 2010 1.35 1.47 1.23 0.24 1.49 1.36 0.13 2.08 2.17 1.95 0.22 2.02 2.30 -0.27 Total 2.39 2.32 2.45 -0.12 2.46 2.24 0.23 3.17 3.15 3.19 -0.04 3.28 3.02 0.26

36
Figure 1: Proportion of exits that are by IPOs sorted by the headquarters of VC firms This figure exhibits the proportion of successful VC investments that are exited via IPO by year of funding and by the headquarters of VC firms.
Figure 2: Proportion of exits that are by IPOs sorted by the nature of VC firms This figure exhibits the proportion of successful VC investments that are exited via IPOs by year of funding and by the nature of VC firms.
0.71
0.58
0.75
0.60
0.69
0.650.66
0.63
0.68
0.83
0.870.83
0.90
0.85
0.50
0.60
0.70
0.80
0.90
1.00
2004 2005 2006 2007 2008 2009 2010
Foreign
Local
Year of Funding
Pro
p (
IPO
/Exi
ted
)
0.66
0.58
0.76
0.85
0.79
0.89
0.70
0.70 0.69
0.81
0.77
0.79
0.85
0.90
0.50
0.60
0.70
0.80
0.90
1.00
2004 2005 2006 2007 2008 2009 2010
VC
VC/PE
Year of Funding
Pro
p (
IPO
/Exi
ted
)

37
Table 4: Summary Statistics for VC investments This table contains summary statistics for VC investments in Chinese portfolio firms that receive VC funding during 2004-2010 and have relevant data in the databases. The Column title denotes the subsample under analysis. For example, Column 5 contains statistics for VC sub-sample investments. Investment success is an indicator variable denoting whether the portfolio firm had gone public or had been acquired before June 30th, 2013. Time to exit is measured as the number of years between the date of VC’s first investment in a portfolio firm and either (1) the date of exit if the investment is exited, or (b) June 30th, 2013 if the investment is not exited. Political connections an indicator variable denoting whether the VC is (1) government controlled (Government controlled), (2) with state ownership but not controlled by the government (Small government ownership), (3) with managing partners/founders previously being government officials (Government officials), and (4) with their official websites stating that they have close relationships with the government (Close relationships with the government). CEO experience refers to the number of firms the managing partner/founder of the VC firm had previously served as CEO. Management experience refers to the number of firms that the managing partner/founder had previously served as top managers. Investment banker experience is an indicator variable denoting whether the managing partner/founder had previously served as investment banker. VC reputation is an indicator denoting whether the VC firm backing the portfolio firm belongs to the top quartile of VCs based on the IPO market share at the time of initial VC funding. Other variables include VC connectedness, VC age, portfolio firm age, syndicate size, IPO and M&A market conditions, VC industry competition, location indicator, corporate VC indicator, and institutional VC indicator.
All Domestic
Foreign Difference VC VC/PE Difference
[1]
[2]
[3]
[4]=[2]-[3]
[5]
[6]
[7]=[5]-[6]
Investment success 0.29 0.30 0.28 0.02 0.29 0.30 0.01 Time to exit 4.49 4.18 4.94 -0.76*** 4.62 4.31 0.31*** Political connections 0.40 0.58 0.14 0.44*** 0.37 0.44 -0.07*** Government controlled 0.18 0.30 0.00 0.30*** 0.24 0.10 0.14***
Small government ownership 0.08 0.14 0.00 0.14*** 0.07 0.10 -0.03*** Government officials 0.07 0.11 0.00 0.11*** 0.03 0.12 -0.09*** Close relationships with the
government 0.08 0.03 0.14 -0.10*** 0.04 0.13 -0.09***
Managing partner/founder’s prior experience CEO experience 0.34 0.37 0.29 0.08*** 0.21 0.16 -0.00
Management experience 0.75 0.75 0.74 0.02 0.75 0.75 0.00 Investment banker experience 0.18 0.20 0.15 0.05*** 0.14 0.24 -0.10***
VC reputation 0.25 0.20 0.33 -0.13*** 0.21 0.30 -0.09*** VC connectedness 0.26 0.19 0.36 -0.17*** 0.29 0.22 0.07*** VC age 8.90 6.6 12.32 -5.72*** 8.71 9.15 -0.44** Portfolio firm age 5.83 6.52 4.81 1.71*** 5.33 6.49 -1.16*** Syndicate size 2.85 2.48 3.22 -0.74*** 2.92 2.58 0.34*** IPO and M&A market conditions Domestic IPO conditions 47.87 50.13 44.5 5.63*** 47.54 48.30 -0.75 Domestic M&A conditions 120.57 122.4 117.9 4.48*** 120.10 121.20 -1.12 VC industry competition 22.04 22.15 21.88 0.26*** 22.01 22.08 -0.07*** Location indicator 0.66 0.68 0.63 0.05*** 0.69 0.62 0.07*** Corporate VC 0.08 0.08 0.08 -0.01 0.09 0.06 0.03*** Institutional VC indicator 0.07 0.06 0.09 -0.03*** 0.04 0.11 -0.07***

38
Table 5: Correlation Matrix This table presents the correlation matrix among the independent variables. IPO market share is determined by the dollar size of all portfolio firms taken public by the VC firm in previous three years, relative to other VC firms. Political connections an indicator variable denoting whether the VC is (1) government controlled (Government controlled), (2) with state ownership but not controlled by the government (Small government ownership), (3) with managing partners/founders previously being government officials (Government officials), and (4) with their official websites stating that they have close relationships with the government (Close relationships with the government). CEO experience refers to the number of firms the managing partner/founder of the VC firm had previously served as CEO. Management experience refers to the number of firms that the managing partner/founder had previously served as top managers. Investment banker experience is an indicator variable denoting whether the managing partner/founder had previously served as investment banker. VC reputation is an indicator denoting whether the VC firm backing the portfolio firm belongs to the top quartile of VCs based on the IPO market share at the time of initial VC funding. Other variables include VC connectedness, VC age, portfolio firm age, syndicate size, IPO and M&A market conditions, VC industry competition, location indicator, etc.
CEO experience
Manage-ment experience
Investment banker experience
VC reputation
VC connected-ness
VC age
Portfolio firm age
Syndicate size
Domestic IPO conditions
Domestic M&A conditions
VC industry competition
Location indicator
Political connections -0.16 0.08 0.09 0.21 -0.01 0.07 0.13 -0.18 0.07 0.04 0.07 0.05
CEO experience 0.00 0.00 -0.11 -0.04
-0.29 -0.01 0.01 -0.01 -0.02 0.02 -0.03
Management experience 0.13 0.04 -0.04 -
0.12 0.09 0.00 0.02 -0.01 0.07 -0.08
Investment banker experience -0.17 -0.14 -
0.14 0.13 -0.05 0.1 0.03 0.12 -0.08 VC reputation 0.48 0.23 -0.00 -0.04 -0.02 -0.03 -0.02 0.1 VC connectedness 0.22 -0.02 -0.02 0.01 0.04 0.04 0.09 VC age 0.06 -0.02 0.01 0.05 0.06 -0.03 Portfolio firm age -0.04 0.15 0.03 0.25 -0.13 Syndicate size -0.03 -0.18 -0.17 -0.00 Domestic IPO conditions 0.16 0.45 -0.01 Domestic M&A conditions 0.32 0.03 VC industry competition -0.05
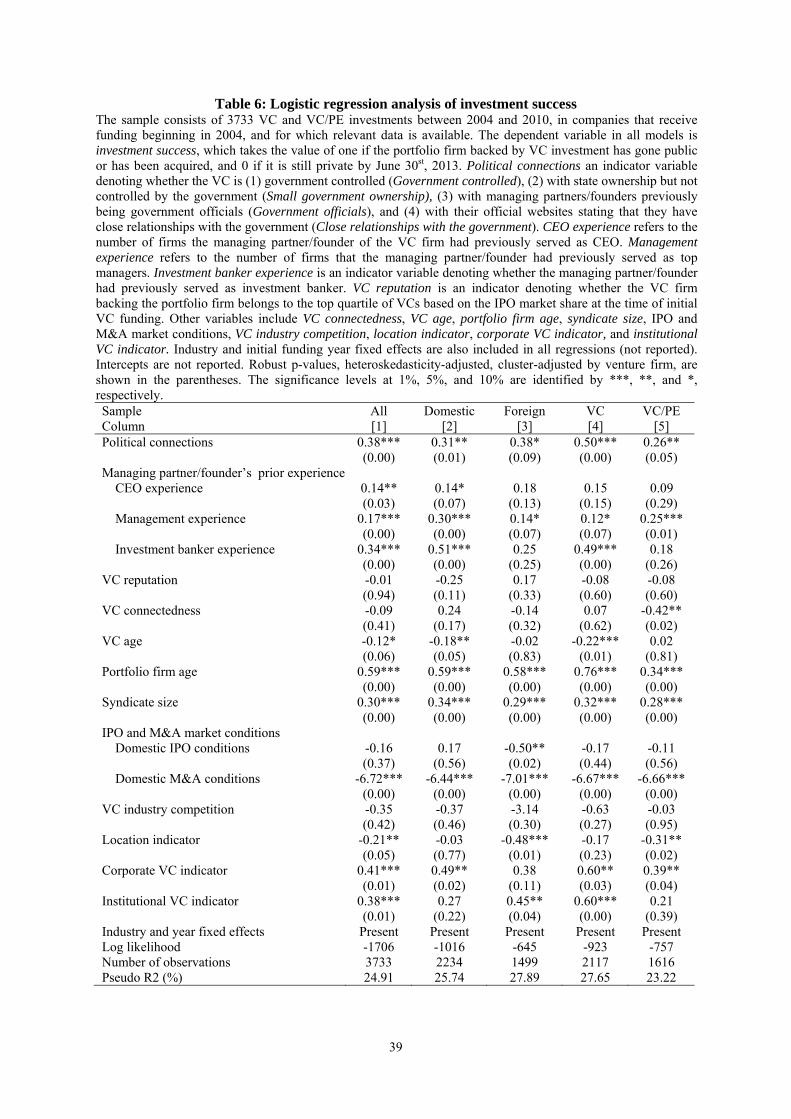
39
Table 6: Logistic regression analysis of investment success The sample consists of 3733 VC and VC/PE investments between 2004 and 2010, in companies that receive funding beginning in 2004, and for which relevant data is available. The dependent variable in all models is investment success, which takes the value of one if the portfolio firm backed by VC investment has gone public or has been acquired, and 0 if it is still private by June 30st, 2013. Political connections an indicator variable denoting whether the VC is (1) government controlled (Government controlled), (2) with state ownership but not controlled by the government (Small government ownership), (3) with managing partners/founders previously being government officials (Government officials), and (4) with their official websites stating that they have close relationships with the government (Close relationships with the government). CEO experience refers to the number of firms the managing partner/founder of the VC firm had previously served as CEO. Management experience refers to the number of firms that the managing partner/founder had previously served as top managers. Investment banker experience is an indicator variable denoting whether the managing partner/founder had previously served as investment banker. VC reputation is an indicator denoting whether the VC firm backing the portfolio firm belongs to the top quartile of VCs based on the IPO market share at the time of initial VC funding. Other variables include VC connectedness, VC age, portfolio firm age, syndicate size, IPO and M&A market conditions, VC industry competition, location indicator, corporate VC indicator, and institutional VC indicator. Industry and initial funding year fixed effects are also included in all regressions (not reported). Intercepts are not reported. Robust p-values, heteroskedasticity-adjusted, cluster-adjusted by venture firm, are shown in the parentheses. The significance levels at 1%, 5%, and 10% are identified by ***, **, and *, respectively. Sample All Domestic Foreign VC VC/PE Column [1] [2] [3] [4] [5] Political connections 0.38*** 0.31** 0.38* 0.50*** 0.26**
(0.00) (0.01) (0.09) (0.00) (0.05) Managing partner/founder’s prior experience CEO experience 0.14** 0.14* 0.18 0.15 0.09
(0.03) (0.07) (0.13) (0.15) (0.29) Management experience 0.17*** 0.30*** 0.14* 0.12* 0.25***
(0.00) (0.00) (0.07) (0.07) (0.01) Investment banker experience 0.34*** 0.51*** 0.25 0.49*** 0.18
(0.00) (0.00) (0.25) (0.00) (0.26) VC reputation -0.01 -0.25 0.17 -0.08 -0.08
(0.94) (0.11) (0.33) (0.60) (0.60) VC connectedness -0.09 0.24 -0.14 0.07 -0.42**
(0.41) (0.17) (0.32) (0.62) (0.02) VC age -0.12* -0.18** -0.02 -0.22*** 0.02
(0.06) (0.05) (0.83) (0.01) (0.81) Portfolio firm age 0.59*** 0.59*** 0.58*** 0.76*** 0.34***
(0.00) (0.00) (0.00) (0.00) (0.00) Syndicate size 0.30*** 0.34*** 0.29*** 0.32*** 0.28***
(0.00) (0.00) (0.00) (0.00) (0.00) IPO and M&A market conditions Domestic IPO conditions -0.16 0.17 -0.50** -0.17 -0.11
(0.37) (0.56) (0.02) (0.44) (0.56) Domestic M&A conditions -6.72*** -6.44*** -7.01*** -6.67*** -6.66***
(0.00) (0.00) (0.00) (0.00) (0.00) VC industry competition -0.35 -0.37 -3.14 -0.63 -0.03
(0.42) (0.46) (0.30) (0.27) (0.95) Location indicator -0.21** -0.03 -0.48*** -0.17 -0.31**
(0.05) (0.77) (0.01) (0.23) (0.02) Corporate VC indicator 0.41*** 0.49** 0.38 0.60** 0.39**
(0.01) (0.02) (0.11) (0.03) (0.04) Institutional VC indicator 0.38*** 0.27 0.45** 0.60*** 0.21
(0.01) (0.22) (0.04) (0.00) (0.39) Industry and year fixed effects Present Present Present Present Present Log likelihood -1706 -1016 -645 -923 -757 Number of observations 3733 2234 1499 2117 1616 Pseudo R2 (%) 24.91 25.74 27.89 27.65 23.22

40
Table 7: Cox hazard analysis at the investment level The sample consists of 3733 VC and VC/PE investments between 2004 and 2010, in companies that receive funding beginning in 2004, and for which relevant data is available. This model is estimated with logarithm of time to exit being the dependent variable. Time to exit is the number of years between the date of VC’s first investment in a portfolio firm and either (a) the date of exit if the investment is exited, or (b) June 30th, 2013 if the investment is not exited. Political connections an indicator variable denoting whether the VC is (1) government controlled (Government controlled), (2) with state ownership but not controlled by the government (Small government ownership), (3) with managing partners/founders previously being government officials (Government officials), and (4) with their official websites stating that they have close relationships with the government (Close relationships with the government). CEO experience refers to the number of firms the managing partner/founder of the VC firm had previously served as CEO. Management experience refers to the number of firms that the managing partner/founder had previously served as top managers. Investment banker experience is an indicator variable denoting whether the managing partner/founder had previously served as investment banker. VC reputation is an indicator denoting whether the VC firm backing the portfolio firm belongs to the top quartile of VCs based on the IPO market share at the time of initial VC funding. Other variables include VC connectedness, VC age, portfolio firm age, syndicate size, IPO and M&A market conditions, VC industry competition, location indicator, corporate VC indicator, and institutional VC indicator. Industry and initial funding year fixed effects are also included in all regressions (not reported). Intercepts are not reported. Robust p-values, heteroskedasticity-adjusted, cluster-adjusted by venture firm, are shown in the parentheses. The significance levels at 1%, 5%, and 10% are identified by ***, **, and *, respectively. Sample All Domestic Foreign VC VC/PE Column [1] [2] [3] [4] [5] Political connections 0.32*** 0.33*** 0.14 0.49*** 0.13
(0.00) (0.00) (0.40) (0.00) (0.22) Managing partner/founder’s prior experience CEO experience 0.10** 0.14** 0.10 0.10 0.07
(0.03) (0.02) (0.23) (0.21) (0.31) Management experience 0.19*** 0.24*** 0.13** 0.13*** 0.32***
(0.00) (0.00) (0.03) (0.01) (0.00) Investment banker experience 0.19** 0.37*** 0.04 0.32*** 0.01
(0.02) (0.00) (0.80) (0.00) (0.94) VC reputation -0.02 -0.10 0.11 -0.07 -0.17
(0.84) (0.41) (0.39) (0.55) (0.21) VC connectedness -0.06 0.18 -0.04 0.10 -0.19
(0.51) (0.20) (0.75) (0.40) (0.21) VC age -0.08* -0.10 -0.04 -0.18*** 0.03
(0.07) (0.13) (0.80) (0.00) (0.66) Portfolio firm age 0.51*** 0.47*** 0.53*** 0.63*** 0.32***
(0.00) (0.00) (0.00) (0.00) (0.00) Syndicate size 0.19*** 0.16*** 0.23*** 0.21*** 0.18***
(0.00) (0.00) (0.00) (0.00) (0.00) IPO and M&A market conditions Domestic IPO conditions -0.38*** 0.08 -0.63*** -0.36** -0.40***
(0.00) (0.76) (0.00) (0.03) (0.00) Domestic M&A conditions -2.93*** -3.65*** -2.51*** -2.86*** -3.28***
(0.00) (0.00) (0.00) (0.00) (0.00) VC industry competition -0.03 -0.05 -0.37 -0.31 0.26
(0.92) (0.90) (0.17) (0.69) (0.16) Location indicator -0.14 -0.06 -0.26* -0.17 -0.24**
(0.10) (0.49) (0.07) (0.23) (0.03) Corporate VC indicator 0.36*** 0.38*** 0.28* 0.38*** 0.50***
(0.00) (0.01) (0.09) (0.00) (0.00) Institutional VC indicator 0.39*** 0.21 0.44*** 0.26 0.54***
(0.01) (0.13) (0.00) (0.15) (0.00) Industry and year fixed effects Present Present Present Present Present Log likelihood -8157 -4646 -2740 -4177 -3197 Number of observations 3733 2234 1499 2117 1616

41
Table 8: Multinomial logistic analysis of IPO and M&A exits The sample consists of 3733 VC and VC/PE investments between 2004 and 2010, in companies that receive funding beginning in 2004, and for which relevant data is available. The sample is classified into three groups: IPOs, M&As, and liquidations (including non-exits). The dependent variable takes three discrete values respectively for these three groups. Political connections an indicator variable denoting whether the VC is (1) government controlled (Government controlled), (2) with state ownership but not controlled by the government (Small government ownership), (3) with managing partners/founders previously being government officials (Government officials), and (4) with their official websites stating that they have close relationships with the government (Close relationships with the government). CEO experience refers to the number of firms the managing partner/founder of the VC firm had previously served as CEO. Management experience refers to the number of firms that the managing partner/founder had previously served as top managers. Investment banker experience is an indicator variable denoting whether the managing partner/founder had previously served as investment banker. VC reputation is an indicator denoting whether the VC firm backing the portfolio firm belongs to the top quartile of VCs based on the IPO market share at the time of initial VC funding. Other variables include VC connectedness, VC age, portfolio firm age, syndicate size, IPO and M&A market conditions, VC industry competition, location indicator, corporate VC indicator, and institutional VC indicator. Industry and initial funding year fixed effects are also included in all regressions (not reported). Intercepts are not reported. Robust p-values, heteroskedasticity-adjusted, cluster-adjusted by venture firm, are shown in the parentheses. The significance levels at 1%, 5%, and 10% are identified by ***, **, and *, respectively. Sample All Domestic Foreign Column IPO M&A IPO M&A IPO M&A Political connections 0.49*** -0.07 0.42*** -0.12 0.36 0.36
(0.00) (0.72) (0.00) (0.67) (0.16) (0.27) Managing partner/founder’s prior experience CEO experience 0.18*** -0.04 0.16* 0.07 0.33** -0.13
(0.01) (0.76) (0.07) (0.65) (0.02) (0.51) Management experience 0.21*** 0.08 0.36*** 0.09 0.15 0.13
(0.00) (0.36) (0.00) (0.61) (0.10) (0.26) Investment banker experience 0.42*** 0.07 0.69*** -0.27 0.19 0.42
(0.00) (0.76) (0.00) (0.45) (0.10) (0.19) VC reputation 0.05 -0.16 -0.24 -0.40 0.32 -0.08
(0.64) (0.38) (0.16) (0.32) (0.10) (0.75) VC connectedness -0.11 -0.07 0.39** -0.19 -0.17 -0.17
(0.39) (0.73) (0.04) (0.61) (0.33) (0.43) VC age -0.15** -0.02 -0.18* -0.08 -0.10 0.08
( 0.02) (0.85) (0.07) (0.70) (0.32) (0.59) Portfolio firm age 0.91*** -0.02 0.89*** -0.17 0.95*** 0.08
(0.00) (0.85) (0.00) (0.34) (0.00) (0.59) Synidicate size 0.33*** 0.23*** 0.35*** 0.30*** 0.37*** 0.17**
(0.00) (0.00) (0.00) (0.00) (0.00) (0.03) IPO and M&A market conditions Domestic IPO conditions 0.25 -0.73*** 0.72 -0.62*** -0.18 -1.00***
(0.42) (0.00) (0.12) (0.00) (0.55) (0.00) Domestic M&A conditions -6.81*** -5.48*** -7.06*** -3.24*** -6.94*** -6.37**
(0.00) (0.01) (0.00) (0.00) (0.00) (0.02) VC industry competition -0.23 -3.29* -0.31 -4.31 -2.83 -4.78**
(0.60) (0.07) (0.52) (0.17) (0.29) (0.03) Location indicator -0.33*** 0.17 -0.11 0.24 -0.80*** 0.13
(0.00) (0.39) (0.41) (0.92) (0.00) (0.67) Corporate VC indicator 0.46*** 0.27 0.61*** 0.20 0.47* 0.29
(0.00) (0.23) (0.01) (0.59) (0.09) (0.36) Institutional VC indicator 0.42*** 0.18 0.10 0.66 0.68*** 0.02
(0.01) (0.52) (0.68) (0.16) (0.00) (0.97) Industry and year fixed effects Present Present Present Log likelihood -2114 -1201 -826 Number of observations 3733 2234 1499 Pseudo R2 (%) 25.72 27.91 28.84

42
Table 9: Multinomial logistic analysis of different exits The sample consists of 3733 VC investments between 2004 and 2010, and that have relevant data in the databases. The sample is classified into four groups: IPOs listed on mainland stock markets, IPOs listed on other markets, M&As, and liquidations (including non-exits). The dependent variable takes four discrete values respectively for these four groups. Political connections an indicator variable denoting whether the VC is (1) government controlled (Government controlled), (2) with state ownership but not controlled by the government (Small government ownership), (3) with managing partners/founders previously being government officials (Government officials), and (4) with their official websites stating that they have close relationships with the government (Close relationships with the government). CEO experience refers to the number of firms the managing partner/founder of the VC firm had previously served as CEO. Management experience refers to the number of firms that the managing partner/founder had previously served as top managers. Investment banker experience is an indicator variable denoting whether the managing partner/founder had previously served as investment banker. VC reputation is an indicator denoting whether the VC firm backing the portfolio firm belongs to the top quartile of VCs based on the IPO market share at the time of initial VC funding. Other variables include VC connectedness, VC age, portfolio firm age, syndicate size, IPO and M&A market conditions, VC industry competition, location indicator, corporate VC indicator, and institutional VC indicator. Industry and initial funding year fixed effects are also included in all regressions (not reported). Intercepts are not reported. Robust p-values, heteroskedasticity-adjusted, cluster-adjusted by venture firm, are shown in the parentheses. The significance levels at 1%, 5%, and 10% are identified by ***, **, and *, respectively. Sample All Domestic Foreign
Column Mainland
Other markets
M&A
Mainland
Other markets
M&A
Mainland
Other markets
M&A
Political connections 0.94*** -0.34** -0.07 0.56*** -0.10 -0.06 -0.39 0.52* 0.43 (0.00) (0.04) (0.72) (0.00) (0.73) (0.82) (-0.73) (0.07) (0.18)
Managing partner/founder’s prior experience CEO experience 0.08 0.30*** 0.01 0.14 0.23 0.09 -0.16 0.41** -0.09
(0.39) (0.00) (0.96) (0.19) (0.16) (0.54) (0.47) (0.01) (0.66) Management experience 0.22*** 0.22*** 0.07 0.37*** 0.42** 0.07 0.30 0.14 0.13
(0.01) (0.00) (0.42) (0.00) (0.02) (0.66) (0.63) (0.16) (0.26) Investment banker experience 0.59*** -0.12 -0.01 0.84*** -0.02 -0.27 1.29*** -0.17 0.34
(0.00) (0.56) (0.96) (0.00) (0.96) (0.41) (0.01) (0.55) (0.30) VC reputation -0.08 0.17 -0.11 -0.30 -0.09 -0.25 1.17*** 0.08 -0.11
(0.66) (0.32) (0.55) (0.12) (0.77) (0.48) (0.01) (0.72) (0.64) VC connectedness -0.29 0.20 -0.12 0.12 0.77** -0.26 -0.25 -0.16 -0.18
(0.12) (0.25) (0.53) (0.59) (0.04) (0.48) (0.57) (0.41) (0.39) VC age -0.40*** 0.15 -0.03 -0.26** 0.32 -0.09 -0.23 -0.04 0.08
(0.00) (0.11) (0.80) (0.02) (0.21) (0.62) (0.35) (0.68) (0.60) Portfolio firm age 1.09*** 0.75*** -0.13 1.11*** 0.46** -0.22 1.02*** 1.00*** 0.03
(0.00) (0.00) (0.35) (0.00) (0.02) (0.18) (0.00) (0.00) (0.86) Synidicate size 0.14** 0.47*** 0.27*** 0.21*** 0.59*** 0.37 -0.17 0.44*** 0.19**
(0.01) (0.00) (0.00) (0.00) (0.00) (0.00) (0.21) (0.00) (0.01) IPO and M&A market conditions Domestic IPO 2.43*** -0.59** -0.98*** 2.40*** -0.85** -1.02*** 5.22*** -0.52* -1.16*** conditions (0.00) (0.03) (0.00) (0.00) (0.00) (0.00) (0.00) (0.09) (0.00)

43
Domestic M&A -5.48*** -6.76*** -4.91** -5.95*** -7.05*** -3.07 -0.62 -6.90*** -5.99** conditions (0.00) (0.00) (0.01) (0.00) (0.00) (0.27) (0.81) (0.00) (0.02) VC industry competition 0.30 -2.52 -4.35** 0.10 -1.94 -4.95 -5.67*** -2.56 -4.49**
(0.50) (0.29) (0.03) (0.83) (0.66) (0.18) (0.01) (0.29) (0.02) Location indicator -0.17 -0.48*** 0.10 -0.01 -0.18 0.13 -1.37*** -0.60** 0.16
(0.22) (0.01) (0.62) (0.93) (0.51) (0.60) (0.00) (0.01) (0.60) Corporate VC indicator 0.42* 0.46** 0.22 0.60** 0.86** 0.14 0.37 0.48* 0.28
(0.07) (0.03) (0.33) (0.02) (0.02) (0.72) (0.63) (0.09) (0.36) Institutional VC indicator -0.42 1.11*** 0.28 -0.78** 1.57*** 0.64 0.80* 0.64** 0.00
(0.10) (0.00) (0.33) (0.00) (0.00) (0.15) (0.09) (0.01) (1.00) Industry and year fixed effects Present Present Present Log likelihood -2341 1318 861 Number of observations 3733 2234 1499 Pseudo R2 (%) 31.88 33.33 33.09

44
Table 10: Multinomial logistic analysis of exits The sample consists of 3733 VC investments between 2004 and 2010, and that have relevant data in the databases. The sample is classified into four groups: IPOs listed on mainland stock markets, IPOs listed on other markets, M&As, and liquidations (including non-exits). The dependent variable takes four discrete values respectively for these four groups. We classify politically connected VC firms into four groups, from the strongest to the weakest connection; (1) Government controlled, (2) VCs with state ownership but not controlled by the government (Small government ownership), (3) VCs with managing partners/founders previously being government officials (Government officials), and (4) VCs with their official websites stating that they have close relationships with the government (Close relationships with the government). A VC that fits in more than a group will be included in the group with the strongest political connection. For example, if a VC is partially owned by the State and at the same time is claimed to have close relationship with the government in its official website will be considered as VC with state ownership. Therefore, each of these groups is exclusive. CEO experience refers to the number of firms the managing partner/founder of the VC firm had previously served as CEO. Management experience refers to the number of firms that the managing partner/founder had previously served as top managers. Investment banker experience is an indicator variable denoting whether the managing partner/founder had previously served as investment banker. VC reputation is an indicator denoting whether the VC firm backing the portfolio firm belongs to the top quartile of VCs based on the IPO market share at the time of initial VC funding. Other variables include VC connectedness, VC age, portfolio firm age, syndicate size, IPO and M&A market conditions, VC industry competition, location indicator, corporate VC indicator, and institutional VC indicator. Industry and initial funding year fixed effects are also included in all regressions (not reported). Intercepts are not reported. Robust p-values, heteroskedasticity-adjusted, cluster-adjusted by venture firm, are shown in the parentheses. The significance levels at 1%, 5%, and 10% are identified by ***, **, and *, respectively. Sample All Domestic Foreign
Column Mainland
Other markets
M&A
Mainland
Other markets
M&A
Mainland
Other markets
M&A
Political connections Government controlled 0.99*** -1.05*** -0.52* 0.51** -0.81* -0.40
(0.00) (0.00) (0.10) (0.02) (0.06) (0.26) Small government ownership 1.00*** -0.29 0.33 0.47** -0.06 0.66*
(0.00) (0.27) (0.26) (0.05) (0.88) (0.06) Government officials 0.86*** -0.86* -0.51 0.57** 0.35 -0.25
(0.00) (0.07) (0.29) (0.01) (0.50) (0.63) Close relationships with 0.57** 0.45* 0.40 0.61* 1.10** -0.32 -0.39 0.55* 0.55* the government (0.04) (0.06) (0.13) (0.09) (0.03) (0.67) (0.47) (0.05) (0.10) Managing partner/founder’s prior experience CEO experience 0.10 0.27*** 0.00 0.12 0.07 0.08 -0.16 0.41** -0.07
(0.27) (0.01) (0.99) (0.24) (0.69) (0.61) (0.63) (0.01) (0.70) Management experience 0.20** 0.27*** 0.09 0.38*** 0.45** 0.02 0.30 0.14 0.13
(0.02) (0.00) (0.34) (0.00) (0.02) (0.90) (0.13) (0.16) (0.23) Investment banker experience 0.63*** -0.17 -0.10 0.83*** -0.29 -0.54 1.30*** -0.17 0.33
(0.00) (0.43) (0.65) (0.00) (0.45) (0.14) (0.01) (0.55) (0.30) VC reputation -0.06 0.14 -0.17 -0.29 -0.05 -0.30 1.17*** 0.07 -0.14
(0.71) (0.42) (0.33) (0.13) (0.87) (0.39) (0.01) (0.75) (0.57) VC connectedness -0.30 0.14 -0.17 0.11 0.85** -0.30 -0.25 -0.17 -0.2
(0.10) (0.41) (0.39) (0.62) (0.03) (0.44) (0.57) (0.40) (0.36)

45
VC age -0.39*** 0.11 -0.04 -0.24** 0.41 -0.08 -0.23 -0.05 0.08 ( 0.00) (0.22) (0.70) (0.04) (0.11) (0.71) (0.36) (0.68) (0.59)
Portfolio firm age 1.09*** 0.78*** -0.10 1.11*** 0.49** -0.20 1.02*** 1.00*** 0.04 (0.00) (0.00) (0.49) (0.00) (0.03) (0.22) (0.00) (0.00) (0.84)
Synidicate size 0.14*** 0.47*** 0.26*** 0.21*** 0.59*** 0.36 -0.17 0.44*** 0.19** (0.00) (0.00) (0.00) (0.00) (0.00) (0.00) (0.21) (0.00) (0.01)
IPO and M&A market conditions Domestic IPO conditions 2.42*** -0.60** -0.98*** 2.40*** -0.89** -1.04*** 5.23*** -0.52* -1.16***
(0.00) (0.03) (0.00) (0.00) (0.05) (0.00) (0.00) (0.08) (0.00) Domestic M&A conditions -5.48*** -6.78*** -4.90** -6.01*** -7.11*** -3.00 -0.60 -6.91*** -6.00**
(0.00) (0.00) (0.01) (0.00) (0.00) (0.27) (0.82) (0.00) (0.02) VC industry competition 0.27 -2.24 -4.11** 0.12 -2.01 -3.99 -5.69*** -2.56 -4.48**
(0.56) (0.33) (0.03) (0.80) (0.63) (0.22) (0.01) (0.29) (0.02) Location indicator -0.20 -0.41** 0.14 -0.01 -0.01 0.19 -1.37*** -0.60** 0.16
(0.16) (0.03) (0.49) (0.95) (0.63) (0.45) (0.01) (0.01) (0.60) Corporate VC indicator 0.51** 0.45** 0.23 0.59** 0.70* 0.16 0.37 0.49* 0.3
(0.03) (0.04) (0.30) (0.03) (0.06) (0.69) (0.63) (0.09) (0.35) Institutional VC indicator -0.41 1.00*** 0.15 -0.75** 1.41*** 0.18 0.80* 0.64** -0.00
(0.13) (0.00) (0.61) (0.02) (0.00) (0.73) (0.09) (0.01) (1.00) Industry and year fixed effects Present Present Present Log likelihood -2327 -1310 -858 Number of observations 3733 2234 1499 Pseudo R2 (%) 32.29 33.75 33.13

46
Table 11: Correction for selection bias at the portfolio firm level The sample consists of 2371 VC-backed firms funded between 2004 and 2010. The dependent variable in the logistic model is investment success, which takes the value of one if the portfolio firm backed by VC investment has gone public or has been acquired, and 0 if it is still private by June 30st, 2013. The Cox hazard model is estimated with the logarithm of time to exit being the dependent variable. Time to exit is the number of years between the date of VC’s first investment in a portfolio firm and either (a) the date of exit if the investment is exited, or (b) June 30th, 2013 if the investment is not exited. The dependent variable of the multinomial logistic regression takes three discrete values respectively for IPOs, M&As, and liquidations (including non-exits). Political connections in the second stage of IV approach are the predicted values generated from the first step of the Probit model. The inverse Mills ratios of the Heckman’s correction procedure are also derived from the first step. Managing partner/founder’s prior experience variables include CEO experience, management experience, and investment banker experience. VC reputation is an indicator denoting whether the VC firm backing the portfolio firm belongs to the top quartile of VCs based on the IPO market share at the time of initial VC funding. Control variables include VC connectedness, VC age, portfolio firm age, syndicate size, IPO and M&A market conditions, VC industry competition, location indicator, corporate VC indicator, and institutional VC indicator. Industry and initial funding year fixed effects are also included in all regressions (not reported). Intercepts are not reported. Robust p-values clustered by year of funding are shown in the parentheses. The significance levels at 1%, 5%, and 10% are identified by ***, **, and *, respectively. First step IV approach Heckman's correction procedure
[1] [2] [3] [4] [5] [6] [7] Probit Logistic Cox Hazard Multinomial logistic Logistic Cox Hazard Multinomial logistic
IPO M&A IPO M&A Political connections 1.92*** 0.22*** 2.03*** 1.22 0.28** 0.26** 0.28* 0.21
(0.00) (0.00) (0.00) (0.31) (0.02) (0.02) (0.05) (0.39) Managing partner/founder experience CEO experience -0.19*** 0.33*** 0.22*** 0.38*** 0.14 0.34*** 0.23*** 0.40*** 0.12
(0.00) (0.00) (0.00) (0.00) (0.50) (0.00) (0.00) (0.00) (0.56) Management experience 0.09** 0.16** 0.17*** 0.20** 0.05 0.17** 0.17*** 0.20** 0.07
(0.03) (0.04) (0.00) (0.02) (0.73) (0.04) (0.01) (0.02) (0.65) Investment banker experience 0.15* 0.29** 0.23** 0.38** -0.15 0.38*** 0.27** 0.48*** -0.09
(0.07) (0.04) (0.05) (0.02) (0.65) (0.00) (0.02) (0.00) (0.78) VC reputation 0.97*** -0.38* -0.21 -0.32 -0.51 -0.32 -0.21 -0.30 -0.36
(0.00) (0.08) (0.22) (0.17) (0.29) (0.13) (0.22) (0.18) (0.450 VC connectedness -0.38*** 0.08 0.05 0.07 -0.02 0.1 0.10 0.12 -0.07
(0.00) (0.61) (0.73) (0.70) (0.96) (0.53) (0.49) (0.51) (0.84) VC age 0.06 -0.10 -0.05 -0.14 -0.01 -0.10 -0.04 -0.14 0.00
(0.20) (0.22) (0.47) (0.14) (0.96) (0.25) (0.53) (0.16) (1.00) Portfolio firm age 0.06 0.54*** 0.47*** 0.80*** -0.13 0.53*** 0.46*** 0.79*** -0.12
(0.13) (0.00) (0.00) (0.00) (0.37) (0.00) (0.00) (0.00) 90.42) Syndicate size -0.05*** 0.44*** 0.20*** 0.45*** 0.39*** 0.44*** 0.20*** 0.45*** 0.38***
(0.01) (0.00) (0.00) (0.00) (0.00) (0.00) (0.00) (0.00) (0.00) IPO and M&A market conditions Domestic IPO conditions 0.11 -0.29 -0.25 0.32 -1.11*** -0.30 -0.26 0.30 -1.09***
(0.22) (0.15) (0.18) (0.45) (0.00) (0.13) (0.16) (0.47) (0.00)

47
Domestic M&A conditions -0.04 -7.72*** -3.01*** -7.84*** -6.05*** -7.69*** -3.03*** -7.80*** -6.03*** (0.82) (0.00) (0.00) (0.00) (0.01) (0.00) (0.00) (0.00) (0.00)
VC industry competition 1.19** -1.26 -0.12 -1.03 -5.44* -1.26 -0.11 -1.05 -5.50* (0.05) (0.12) (0.88) (0.23) (0.07) (0.14) (0.89) (0.24) (0.07)
Location indicator 0.64*** -0.40*** -0.26** -0.46*** -0.13 -0.39*** -0.27** -0.46*** -0.09 (0.00) (0.00) (0.02) (0.00) (0.67) (0.00) (0.01) (0.00) (0.76)
Corporate VC indicator -0.11 0.52** 0.50*** 0.56** 0.38 0.53*** 0.50*** 0.57** 0.39 (0.32) (0.01) (0.00) (0.01) (0.32) (0.00) (0.00) (0.01) (0.31)
Institutional VC indicator -0.06 0.35* 0.49*** 0.45** -0.23 0.31 0.45*** 0.40* -0.24 (0.63) (0.07) (0.00) (0.04) (0.71) (0.12) (0.00) (0.06) (0.69)
Local availability of politically connected VCs
2.79*** (0.00)
Inverse Miller Ratio -0.83*** -0.44** -0.98*** -0.33 (0.00) (0.04) (0.00) (0.58)
Industry and year fixed effects Present Present Present Present Present Present Present Log likelihood -1310.28 -965.90 -4100.27 -1158.14 -964.19 -4096.38 -1155.86 Number of observations 2371 2371 2371 2371 2371 2371 2371 Pseudo R2 (%) 0.20 0.27 0.29 0.27 0.29

48
7. Reference
Ahlstrom, D., Bruton, G., and Yeh, K. (2007). Venture capital in China: Past, present, and future. Asia Pacific Journal of Management, 24(3), 247-268.
Aizenman, J., and Kendall, J. (2012). The Internationalization of Venture Capital. Journal of Economic Studies, 39(5), 488-511.
Berger, A. N., Miller, N. H., Petersen, M. A., Rajan, R. G., and Stein, J. C. (2005). Does function follow organizational form? Evidence from the lending practices of large and small banks. Journal of Financial economics, 76(2), 237-269.
Black, B. S., and Gilson, R. J. (1998). Venture capital and the structure of capital markets: banks versus stock markets. Journal of Financial Economics, 47(3), 243-277.
Bottazzi, L., Da Rin, M., and Hellmann, T. (2008). Who are the active investors?: Evidence from venture capital. Journal of Financial Economics, 89(3), 488-512.
Brander, J. A., Amit, R., and Antweiler, W. (2002). Venture-Capital Syndication: Improved Venture Selection vs. The Value-Added Hypothesis. Journal of Economics and Management Strategy, 11(3), 423-452.
Bruton, G. D., and Ahlstrom, D. (2003). An institutional view of China's venture capital industry: Explaining the differences between China and the West. Journal of Business Venturing, 18(2), 233-259.
Bruton, G. D., Dattani, M., Fung, M., Chow, C., and Ahlstrom, D. (1999). Private equity in China: differences and similarities with the Western model. Journal of Private Equity, 2(2), 7-13.
Bygrave, W. D. (1988). The structure of the investment networks of venture capital firms. Journal of Business Venturing, 3(2), 137-157.
Cummings, D. (2006). The determinants of venture capital portfolio size: empirical evidence. Journal of Business, 79(3), 1083-1126.
Cumming, D., and Dai, N. (2010). Local bias in venture capital investments. Journal of Empirical Finance, 17(3), 362-380.
Cumming, D. J., and MacIntosh, J. G. (2003). A cross-country comparison of full and partial venture capital exits. Journal of Banking and Finance, 27(3), 511-548.
Cyert, R. M., Kumar, P., and Williams, J. R. (1993). Information, market imperfections and strategy. Strategic Management Journal, 14(S2), 47-58.
Dai, N., Jo, H., and Kassicieh, S. (2012). Cross-border venture capital investments in Asia: Selection and exit performance. Journal of Business Venturing, 27(6), 666-684.
Deloitte. (2007). Global trends in venture capital 2007 survey. Deloitte Touche Tohmatsu. Deutsche Borse Group (2011). European investors’ exposure to Chinese private equity: an
insider’s perspective. Retrieved from http://www.funds-at-work.com/uploads/media/PE_in_China_-_Funds_Work.pdf
Ernst and Young (2011). Globalizing venture capital insights and trends report 2011. Retrieved from http://www.ey.com/GL/en/Services/Strategic-Growth-Markets/Global-venture-capital-insights-and-trends-report-2011---Paradigm-shifts-in-global-capital
Fuller, D. (2010). How law, politics and transnational networks affect technology entrepreneurship: Explaining divergent venture capital investing strategies in China. Asia Pacific Journal of Management, 27(3), 445-459.
Giot, P., and Schwienbacher, A. (2007). IPOs, trade sales and liquidations: Modelling venture capital exits using survival analysis. Journal of Banking and Finance, 31(3), 679-702.
Gompers, P., and Lerner, J. (2000a). The determinants of corporate venture capital successes: organizational structure, incentives and complementarities. In R. K. Morck (Ed.),

49
Concentrated Corporate Ownership (pp. 17-50): Unversity of Chicago Press for the National Bureau of Economic Research.
Gompers, P., & Lerner, J. (2000b). Money chasing deals? The impact of fund inflows on private equity valuations. Journal of Financial Economics, 55(2), 281-325.
Gompers, P. A., and Lerner, J. (1999). The venture capital cycle. Cambridge: The MIT Press. Guthrie, D. (1998). The Declining Significance of Guanxi in China's Economic Transition.
The China Quarterly, 154, 254-282. Heckman, J. J. (1979). Sample selection bias as a specification error. Econometrica, 47(1),
153-161. Hellmann, T., Lindsey, L., & Puri, M. (2008). Building relationships early: Banks in venture
capital. Review of Financial Studies, 21(2), 513-541. Hochberg, Y. V., Ljungqvist, A., and Lu, Y. (2007). Whom You Know Matters: Venture
Capital Networks and Investment Performance. Journal of Finance, 62(1), 251-301. Hoskisson, R. E., Eden, L., Lau, C. M., and Wright, M. (2000). Strategy in Emerging
Economies. The Academy of Management Journal, 43(3), 249-267. Humphery-Jenner, M., and Suchard, J. (2013). Foreign VCs and Venture success: evidence
from China. Journal of Corporate Finance, 21(1), 16-35. Ingram, P., and Silverman, B. S. (2002). Introduction: the new institutionalism in strategic
management. In P. Ingram and B. S. Silverman (Eds.), The new institutionalisma in strategic management (Vol. 19, pp. 1-30): Emerald Group Publishing Limited.
Jeng, L. A., and Wells, P. C. (2000). The determinants of venture capital funding: evidence across countries. Journal of Corporate Finance, 6(3), 241-289.
Kaplan, S. N., and Schoar, A. (2005). Private Equity Performance: Returns, Persistence, and Capital Flows. Journal of Finance, 60(4), 1791-1823.
Krishnan, C. N. V., Ivanov, V. I., Masulis, R. W., and Singh, A. K. (2011). Venture Capital Reputation, Post-IPO Performance, and Corporate Governance. Journal of Financial and Quantitative Analysis, 46(5), 1295-1333.
Lee, E. T., and Wang, J. M. (2003). Statistical methods for survival data analysis (3rd ed.). New Jersey: John Wiley and Son, Inc.
Lerner, J. (1994). The Syndication of Venture Capital Investments. Financial Management, 23(3), 16-27.
Li, J. Y. (2005). Investing in China: the emerging venture capital industry. London: GMB Publishing Limited.
Ahlstrom, A., Richardson, M., and Wolfenzon, D (2005). The investment behavious of private equity find managers. Working paper, New York University.
Lu, H., Tan, Y., and Huang, H. (2012). Why do venture capital firms exist: An institution-based rent-seeking perspective and Chinese evidence. Asia Pacific Journal of Management, 30 (3), 1-16.
Luo, Y. (2000). Guanxi and business. Singapore: World Scientific Publishing Co. Pte. Ltd. Mann, J. (2007). Beijing Jeep: the short, unhappy romance of American business in China.
2nd ed, Simion and Schuster, New York. Nahata, R. (2008). Venture capital reputation and investment performance. Journal of
Financial Economics, 90(2), 127-151. Naqi, S. A., and Hettihewa, S. (2007). Venture capital or private equity? The Asian
experience. Business Horizons, 50(4), 335-344. North, D. (1990). Institutions, Institutional Change and Economic Performance (Political
Economy of Institutions and Decisions): Cambridge University Press. Peng, M. W. (2006). Global strategy: Thomson/South-Western.

50
Peng, M. W., and Heath, P. S. (1996). The Growth of the Firm in Planned Economies in Transition: Institutions, Organizations, and Strategic Choice. The Academy of Management Review, 21(2), 492-528.
Peng, M. W., Wang, D. Y. L., and Jiang, Y. (2008). An Institution-Based View of International Business Strategy: A Focus on Emerging Economies. Journal of International Business Studies, 39(5), 920-936.
People’s Daily Online (2013). Retrieved on November 17th, 2013 from http://english.people.com.cn/90778/8082336.html
Pukthuanthong, K., and Walker, T. (2007). Venture capital in China: a culture shock for Western investors. Management Decision, 45 (4), 708-731.
Scott, W. R. (1995). Institutions and organizations. Thousand Oaks, CA: Sage. Sørensen, M. (2007). How Smart Is Smart Money? A Two-Sided Matching Model of Venture
Capital. Journal of Finance, 62(6), 2725-2762. Tan, J., and Litsschert, R. J. (1994). Environment-strategy relationship and its performance
implications: An empirical study of the chinese electronics industry. Strategic Management Journal, 15(1), 1-20.
Tan, J., and Tan, D. (2005). Environment–strategy co-evolution and co-alignment: a staged model of Chinese SOEs under transition. Strategic Management Journal, 26(2), 141-157.
Tan, Y., Huang, H., and Lu, H. (2013). The Effect of Venture Capital Investment—Evidence from China's Small and Medium-Sized Enterprises Board. Journal of Small Business Management, 51(1), 138-157.
Wang, L., and Wang, S. (2011). Cross-border venture capital performance: Evidence from China. Pacific-Basin Finance Journal, 19(1), 71-97.
Wright, M. (2007). Venture capital in China: A view from Europe. Asia Pacific Journal of Management, 24(3), 269-281.
Xiao, W. (2002). The new economy and venture capital in China. Perspectives, 3(6), 30. Zarutskie, R. (2010). The role of top management team human capital in venture capital
markets: Evidence from first-time funds. Journal of Business Venturing, 25(1), 155-172.
Zhang, L. (2012). Venture capital and the corporate governance of Chinese listed companies. New York: Springer
Zhang, Z., and Li, Y. (2011). Why do ChiNext board firms accept private equity shortly before IPO: an explanation from trade-off perspective. Working Paper: Shanghai University of Finance and Economics.