venture capital and initial public · pdf fileventure capital and initial public offering ......
TRANSCRIPT
VENTURE CAPITAL AND INITIAL PUBLIC OFFERING
By
WEICHENG WANG
A dissertation submitted in partial fulfillment of the requirement for the degree of
DOCTOR OF PHILOSOPHY
WASHINGTON STATE UNIVERSITY College of Business
MAY 2010

ii
To the faculty of Washington State University: The members of the Committee appointed to examine the dissertation/thesis of WEICHENG WANG find it satisfactory and recommend that it be accepted.
John R. Nofsinger, Ph. D., Chair
Gene Lai, Ph. D.
David A. Whidbee, Ph. D.

iii
ACKNOWLEDGEMENT
I am heartily thankful to my committee chair, John Nofsinger, whose encouragement,
supervision and support from the preliminary to the concluding level enabled me to develop a
clear understanding of my dissertation subject. This dissertation would not have been possible
without his guidance. I am also grateful to Gene Lai and David A. Whidbee, my committee
members, for providing their insightful comments when I was framing and writing the
dissertation. I would like to thank Swaminathan Kalpathy for being my friend and guide. I
benefited a lot from the discussion with him. His generous provision of data enabled me to
launch this research project as planned.
The faculty of Department of Finance, Insurance and Real Estate at Washington State
University has been very helpful and supportive. I thank them for investing their precious time in
commenting on my research. Their insightful suggestions played a critical role in shaping my
dissertation. I thank Sandra Boyce, the former department secretary and my good friend, for her
most efficient and friendly helps.
I owe my deepest gratitude to my wife, Fangfang Chen and my son, Eric Dingyi Wang.
Their love is my strongest support when going through the Ph.D. program. I am also grateful to
my parents, Guangkui Wang and Weihua Luo. They provided me with all the help they can give.
Lastly, I offer my regards and blessings to all of those who supported me in any respect
during the completion of the Ph.D. program and dissertation especially Mark Holmgren,
M’Linda Holmgren and Abhishek Varma.

iv
VENTURE CAPITAL AND INITIAL PUBLIC OFFERING
ABSTRACT
by Weicheng Wang, Ph.D.
Washington State University May 2010
Chair: John R. Nofsinger
I use the SDC initial public offering (IPO) data to study the role of venture capitalists (VC)
and the implications of their presence in the going-public process.
I firstly examine the implications of VC reputation for the post-IPO performance of the
newly public stocks. I propose a Venture Capital ‘Reputation Index’ that explicitly captures the
dynamic nature of VC reputation. The Reputation Index also captures the short-term economic
performance and visibility of a VC firm. These two components are important determinants to
reputation and are new to the existing literature. The proposed index explains the post-IPO stock
return over 1- and 2-year horizons within a group of VC-backed IPOs and also within the overall
IPO sample that includes VC- and nonVC-backed IPOs. After controlling for other existing
reputation measures, such as the age of VC firms, total capital under management, aggregate
investment in the portfolio companies, the number of portfolio companies, and the number of
investment rounds participated, the index still shows strong and robust predictive power.
Secondly, I explore the post-IPO ownership dynamics of venture capitalists in the initial
public offering backed by VCs. Venture Capitalists (VC) do not always cash out their investment

v
immediately at an IPO or even after the lockup period. There is significant variation in the
selling decision and timing of venture capitalists after the IPO. I examine the determinants of
such variation at lockup expiration and post-expiration, respectively. Four competing hypotheses
are proposed to explain the selling decision of venture capitalists at the lockup expiration: (1) an
information trading hypothesis; (2) a reputation maximization hypothesis; (3) a reputation
establishment hypothesis; and (4) an information asymmetry hypothesis. The results support the
reputation maximization hypothesis and information asymmetry hypothesis. I further analyze the
selling decision of VCs after the lockup expiration by examining the investment duration of VCs.
I find that a good prior return of an IPO firm will significantly increase the likelihood of VC
selling on lockup expiration and also shorten the investment duration of VCs post-expiration.

vi
TABLE OF CONTENTS Page
ACKNOWLEDGEMENT ............................................................................................................. iii
ABSTRACT ................................................................................................................................... iv
LIST OF TABLES ....................................................................................................................... viii
LIST OF FIGURES ........................................................................................................................ x
DEDICATION ............................................................................................................................... xi
CHAPTER ONE: INTRODUCTION ............................................................................................. 1
CHAPTER TWO: VENTURE CAPITAL REPUTATION AND IPO RETURNS ....................... 3
1 INTRODUCTION .................................................................................................................. 3
2 LITERATURE REVIEW ....................................................................................................... 9
3 DATA, RETURN MEASURE and SAMPLE SUMMARY ................................................ 11
3.1 Data and Summary .......................................................................................................... 11
3.2 Return Measure ............................................................................................................... 12
3.3 Do VC-backed IPOs Have Anything Special? ............................................................... 14
4 VC REPUTATION ............................................................................................................... 15
4.1 Economic Performance and Visibility ............................................................................ 15
4.2 Possible Proxy for Economic Performance and Visibility ............................................. 16
4.3 Methodology ................................................................................................................... 17
5 VC REPUTATION AND POST-IPO RETURN .................................................................. 18
5.1 Initial Evidence ............................................................................................................... 18
5.2 Reputation Index ............................................................................................................. 20

vii
5.3 Reputation Index: Univariate Analysis ........................................................................... 22
5.4 Reputation Index: Regression Analysis .......................................................................... 23
6 CONCLUSION ..................................................................................................................... 32
CHAPTER THREE: VENTURE CAPITAL OWNERSHIP, POST-IPO SELLING AND
OWNERSHIP DURATION ......................................................................................................... 34
1 INTRODUCTION ................................................................................................................ 34
2 LITERATURE REVIEW ..................................................................................................... 36
3 DATA AND METHODOLOGY .......................................................................................... 39
3.1 Data ................................................................................................................................. 39
3.2 VC Selling At Lockup Expiration ................................................................................... 40
4 EMPIRICAL EVIDENCE .................................................................................................... 42
4.1 Summary ......................................................................................................................... 42
4.2 VC Selling at IPO and Lockup Expiration ..................................................................... 43
4.3 Determinants to VC Selling at Lockup Expiration ......................................................... 46
4.4 VC Selling After Lockup Expiration: A Duration Approach ......................................... 60
5 CONCLUSIONS................................................................................................................... 66
REFERENCES ............................................................................................................................. 69

viii
LIST OF TABLES
Table 2.1 ....................................................................................................................................... 74
Table 2.2 ....................................................................................................................................... 76
Table 2.3 ....................................................................................................................................... 77
Table 2.4 ....................................................................................................................................... 77
Table 2.5 ....................................................................................................................................... 78
Table 2.6 ....................................................................................................................................... 79
Table 2.7 ....................................................................................................................................... 80
Table 2.8 ....................................................................................................................................... 81
Table 2.9 ....................................................................................................................................... 82
Table 2.10 ..................................................................................................................................... 83
Table 2.11 ..................................................................................................................................... 84
Table 2.12 ..................................................................................................................................... 85
Table 3.1 ....................................................................................................................................... 86
Table 3.2 ....................................................................................................................................... 87
Table 3.3 ....................................................................................................................................... 88
Table 3.4 ....................................................................................................................................... 89
Table 3.5 ....................................................................................................................................... 91
Table 3.6 ....................................................................................................................................... 92
Table 3.7 ....................................................................................................................................... 93
Table 3.8 ....................................................................................................................................... 95
Table 3.9 ....................................................................................................................................... 96

ix
Table 3.10 ..................................................................................................................................... 97
Table 3.11 ..................................................................................................................................... 98

x
LIST OF FIGURES
Figure 3.1 ...................................................................................................................................... 99

xi
DEDICATION
This dissertation is dedicated to my wife, Fangfang Chen, my son, Eric Dingyi Wang and my
parents Guangkui Wang and Weihua Luo who have provided their support and love.

1
CHAPTER ONE: INTRODUCTION
I use the SDC initial public offering (IPO) data to study the role of venture capitalists (VC)
and the implications of their presence in the going-public process. Venture capitalists represent a
critical pre-IPO insider who is usually actively involved in the nurturing and management of
private firms. They provide financial and strategic support during the growth stage of small firms
and have succeeded in bringing many large and well-known corporations to this world. This
research may enhance our understanding of the investing style of VCs and the implications of
VC investment for the public firms. This research consists of two major topics: (1) VC reputation
and (2) VC ownership dynamics. They are examined in Chapter 2 and Chapter 3 respectively.
In chapter 2, I examine the implications of VC reputation for the post-IPO performance of
the newly public stocks. I propose a Venture Capital ‘Reputation Index’ that explicitly captures
the dynamic nature of VC reputation. The Reputation Index also captures the short-term
economic performance and visibility of a VC firm. These two components are important
determinants to reputation and are new to the existing literature. The proposed index explains the
post-IPO stock return over 1- and 2-year horizons within a group of VC-backed IPOs and also
within the overall IPO sample that includes VC- and nonVC-backed IPOs. After controlling for
other existing reputation measures, such as the age of VC firms, total capital under management,
aggregate investment in the portfolio companies, the number of portfolio companies, and the
number of investment rounds participated, the index still shows strong and robust predictive
power.
In chapter 3, I explore the post-IPO ownership dynamics of venture capitalists in the initial
public offering backed by VCs. I explore the post-IPO ownership dynamics of venture capitalists

2
in the initial public offering backed by VCs. Venture Capitalists (VC) do not always cash out
their investment immediately at an IPO or even after the lockup period. There is significant
variation in the selling decision and timing of venture capitalists after the IPO. I examine the
determinants of such variation at lockup expiration and post-expiration, respectively. Four
competing hypotheses are proposed to explain the selling decision of venture capitalists at the
lockup expiration: (1) an information trading hypothesis; (2) a reputation maximization
hypothesis; (3) a reputation establishment hypothesis; and (4) an information asymmetry
hypothesis. The results support the reputation maximization hypothesis and information
asymmetry hypothesis. I further analyze the selling decision of VCs after the lockup expiration
by examining the investment duration of VCs. I find that a good prior return of an IPO firm will
significantly increase the likelihood of VC selling on lockup expiration and also shorten the
investment duration of VCs post-expiration.

3
CHAPTER TWO: VENTURE CAPITAL REPUTATION AND IPO RETURNS
ABSTRACT
I propose a Venture Capital ‘Reputation Index’ that explicitly captures the
dynamic nature of VC reputation. The Reputation Index also captures the short-
term economic performance and visibility of a VC firm. These two components
are important determinants to reputation and are new to the existing literature.
The proposed index explains the post-IPO stock return over 1- and 2-year
horizons within a group of VC-backed IPOs and also within the overall IPO
sample that includes VC- and nonVC-backed IPOs. After controlling for other
existing reputation measures, such as the age of VC firms, total capital under
management, aggregate investment in the portfolio companies, the number of
portfolio companies, and the number of investment rounds participated, the index
still shows strong and robust predictive power.
1 INTRODUCTION
The venture capital (VC) industry is a highly segmented and relatively new industry1
without monopolistic players.2 VCs are likely not the homogenous group they are commonly
perceived. In this regard, VC reputation can effectively differentiate VCs in terms of their
1 Before World War II, venture capital investments (originally known as "development capital") were primarily the domain of wealthy individuals and families. It was not until after World War II that what is considered today to be true private equity investments began to emerge marked by the founding of the first two venture capital firms in 1946: American Research and Development Corporation. (ARDC) and J.H. Whitney & Company. 2 The top VCs have only 2% average IPO market share. Compare this to the top 10 largest investment banks, which controlled 90% or more of IPO underwriting business in the US since the late of 1990s (Krishnan et al., 2010).

4
monitoring quality and ability of bringing companies public. The early studies in venture capital
typically ignored the reputation differences3 and simply use the distinction between VC-backed
versus nonVC-backed public offerings. The failure to differentiate between VC-backed IPOs
based on the VCs’ reputation may explain why the existing studies often report conflicting
results regarding various IPO characteristics.4 In other word, being backed by VCs does not
mean a firm has any advantage over non-VC-backed firms. It is the different ability and
experience of the sponsoring VC that makes the difference. Top frims, such as Kleiner Perkins
Caufield & Byers, have strong reputations in the VC industry and have hundreds of portfolio
companies under management, while many VCs barely survive. Thus, treating these VC firms as
one group misses the richness of their differences in quality and characteristics.
Theoretically, ‘reputation’ is the outcome of a competitive process in which firms signal
their key characteristics to the public for maximizing their social and economic status (Spence
1974). A favorable reputation can generate excess return by inhibiting the mobility of rivals in an
industry (Caves and Porter, 1977; Wilson, 1985). For an industry with highly competitive
structure, the reputation building process is a dynamic process (Hörner, 2002), which implies
that the reputation of a firm is always changing. The change of reputational ranking in the market
can be due to either the performance of this firm itself or a move by its competitors. Therefore, it
seems problematic to define ‘Reputation’ as a static measurement in a competitive industry.
Instead, the reputation in such an industry should consist of long-term and short-term
components. The long-term component measures the reputational capital that has been
accumulated in the entire history of a firm, while the short-term component is more closely
3 See Barry, Muscarella, Peavy, and Vetsuypens (1990), Megginson and Weiss (1991), Brav and Gompers (1997), Lee and Wahal (2004) 4 Barry, Muscarella, Peavy, and Vetsuypens (1990) and Megginson and Weiss (1991) both report a lower first-day return of VC-backed IPOs while Lee and Wahal (2004) report the opposite.

5
related with the recent past. The more competitive an industry, the more weight the recent past
performance will have on the overall reputation. Alternatively, this may not be true for a
monopolistic industry. The customer has no ‘outside option’ (Hörner, 2002) in a monopoly
market. For example, Morgan Stanley, Goldman Sachs and a few other big names in the
underwriting industry are well known. These investment banks are at the top of the list for
everyone who has a plan to go public. No one would dramatically change their impression (or
reputational ranking) about these big investment banks simply because they either recently
succeeded or failed in promoting a huge IPO. Due to the highly concentrated and monopolistic
structure, the reputation of investment banks is relatively stable. The monopoly power of these
top underwriters protects them from being affected by short-term recent performance. In
comparison, the VC industry is at a totally different stage of industry development, having many
small VC firms fighting for recognition in the market. Big VC firms such as Sequoia Capital are
barely known by ordinary investors even though they repeatedly offer IPOs and have backed
many well-known companies, including Google. Yet, because of the short-term component of
reputation, even they should remain vigilant to protect their reputation. Given the different
characteristics of VC industry, it seems important to capture this dynamic nature when
measuring VC reputation.
The visibility of a firm may also be an important determinant to reputation. Management
and economic literatures have recognized this point for long time (Fombrum and Shanley 1990).
Given the fact that most VC firms have low recognition in the market, the availability of
information about them or their visibility may greatly affect their reputational ranking among the
investors. This is similar to Tversky and Kahneman (1974), who argue that the availability of
information biases the judgment of investors.

6
Existing measures of VC reputation tend to lack both the short-term component and
visibility component. They typically measure the reputation capital that has been build up in the
entire history of a VC firm.5 The recent market performance, and hence its effect on reputation,
is not captured by these measures. This is because they ignore the competitive nature of the VC
industry and hence fail to capture the dynamic aspect of VC reputation.
On the other hand, little evidence exists with regard to the predictive power of VC
reputation for the post-IPO stock return. Previous studies6 only examine the relation between
VC-backing and first day IPO return, but report conflicting results. In comparison, the relation
between the post-IPO stock return and VC reputation is an under-studied topic.
Multiple reasons justify this expected relation between VC reputation and post-IPO
returns. There is some evidence showing that good VC reputation is associated with better post-
IPO survival probability, better operating performance (Krishnan et al., 2010), and higher market
valuation (Chemmanur and Loutskina, 2006). These studies imply that better VC reputation is
associated with better firm quality. If better firm quality is recognized by the market and
translated into better stock returns, we should expect that VC reputation can predict those post-
IPO stock returns.
In addition, VCs do not typically exit the newly public firm immediately at the IPO.
Instead, they remain as principal shareholders after the offering for some time (Barry et al.,
1990). If VCs value their reputation, the desire to protect it could inhibit them from engaging in
any activities that will be viewed poorly by the market. Similarly, this desire may force VCs to
engage in activities that may improve or at least maintain their reputation. In this regard, one
5 For example, Gompers (1996) uses the age of VC firm as reputation measure. Hsu (2004) uses the number of investments a VC has made in a startup’s industrial segments. Sorensen (2007) uses past investment rounds of venture investments and the total amount of funds available for investing. 6 See Barry, Muscarella, Peavy, and Vetsuypens (1990), Megginson and Weiss (1991), Lee and Wahal (2004).
7
reputation boosting activity may be to help firms get through the initial stages of the private-to-
public transition and to experience a good initial market return. This argument is similar to
Logue et al. (2002), who reports that the reputation of investment banks is unrelated to post-IPO
return directly, but that the aftermarket activities of underwriters play an important role in
determining the post-IPO returns. It is the extent and quality of aftermarket activities that is
directly related to reputation. Therefore, it seems reputation predicts the post-IPO return via the
possible aftermarket activities. This logic seems to suggest that the predictive power of VC
reputation may depend upon the duration of VCs as principal shareholders, where they would
have the ability to monitor the firms. Barry et al. (1990) finds that venture capitalists maintain
their investment beyond the IPO for approximately one year. Therefore, it seems more likely to
see predictive power of VC reputation for short-run rather than long-run post-IPO return.
Chemmanur and Loutskina (2006) argue that VC reputation will determine the quality and
participation of important market participants in the post-IPO market such as underwriters,
institutional investors and analysts. In turn, the active participation of these market players may
attract the attention of other investors, especially retail investors. Given more attention and more
investors in the post-IPO market, we should expect higher investor heterogeneity, which may
eventually lead to higher short-run returns of newly public firms (Miller, 1977).
The contribution of this research is three fold: First, I argue that performance in the recent
market and the firm visibility, as two important components of VC reputation, have been mostly
neglected by the existing measures of VC reputation. Given the highly segmented nature of the
VC industry, the recent performance of VC will have disproportional effect on their reputation. I
propose a venture capital ‘reputation index’ to explicitly capture these two components.
8
Second, less evidence documents the relationship between post-IPO stock returns and VC
reputation. Existing literature examines the impact of VC reputation on the first-day return, post-
IPO operating performance, survival probability, and market valuation, but whether VC
reputation has any power to predict post-IPO stock returns is a less examined topic. Here,the
proposed measure of VC reputation shows strong and robust predictive power for post-IPO
returns.
Third, I test another type of measure that can potentially capture the recent performance of
VCs. Specifically, I use the post-IPO returns of recent venture-backed IPOs as a measure of VC
reputation. Chemmnaur and Fulghieri (1994) develop a model showing that the good return of
previous IPOs underwritten by investment banks improves the reputation of the underwriters and
may explain the positive relationship between underwriter’s reputation and post-IPO returns
(Carter, Dark and Singh, 1998). Similar reasoning may also apply to VC reputation. However,
the empirical results do not show any supportive evidence in this regard. This may be due to the
fact that post-IPO return is influenced by various factors and investors may not necessarily
attribute either good or bad post-IPO returns to the backing VCs.
This paper is organized as follows. Section 2 overviews the existing literature about the
importance of reputation for financial intermediaries including investment banks, auditing firms
and venture capital firms. Section 3 summarizes the data and introduces the return measures.
Section 4 discusses the determinants of VC reputation and proposes a set of variables that may
capture recent economic performance and visibility of a VC firm. A Reputation Index created
from this set of variables is also introduced. Section 5 provides evidence for the predictive power
of the proposed reputation measures for post-IPO stock returns. Section 6 concludes the paper.

9
2 LITERATURE REVIEW
Reputation is a valuable asset in a market in which the customers can only assess the
quality of a product by purchasing and consuming it (Hörner, 2002). In finance, the functions of
auditing, investment banking, and venture capital are three examples that fit this description,
which explains the abundant research about the reputation of financial intermediaries. In
particular, many studies examine the implications of reputation in the IPO market. Reputation in
the IPO market is important because of the lack of information or financial records available that
can help with valuation. Thus, the reputation of the affiliated financial intermediary may
effectively certify the value and overcome the information gap.
Beatty and Ritter (1986) explore the relation between the ex-ante uncertainty of an IPO
and the initial return. They find that the reputation of investment bankers are the necessary
condition that can help to enforce the underpricing, an important mechanism for the IPO’s
success. In a more direct manner, Carter and Manaster (1990) report a significant negative
relation between the underwriter prestige and IPO initial return. They use the rank of
underwriters in offering tombstone announcements as a measure of underwriter reputation and
find that an IPO sold by a more prestigious underwriter is associated with a lower first-day return.
With the same reputation measures, Carter, Dark and Singh (1998) report that the
underperformance of IPO stocks relative to the market over a three-year holding period is less
severe for IPOs handled by more prestigious underwriters. Logue et al. (2002) jointly examines
the effect of reputation and activities of investment banks on the IPO return. Specifically, they
report that the underwriter reputation is a significant determinant of premarket underwriter
activities, but unrelated to issuer returns. Premarket underwriter activities are a significant
determinant of issue-date returns, while aftermarket underwriter activities are significantly
10
related to longer-run returns. Therefore, they argue that the reputation itself is not a direct
determinant of IPO returns, but it does have explanatory power for returns due its correlation
with market activities.
Another type of intermediary whose service may reveal the true value of an IPO is the
auditing industry. The focus is similarly on the auditor reputation and IPO returns both in the
short-run and long-run. Beatty (1989) uses the residuals of regressing compensation to an auditor
on the marginal cost of performing the audit as a measure of auditor reputation. The results
support the inverse relation between auditing reputation and initial return of IPO, which is
consistent with the results reported by Balvers et al. (1988). They argue that using a ‘Big’ auditor
may significantly reduce the ex ante uncertainty of an IPO, which may in turn help to obtain the
highest offer price (thus lower underprcing) for the IPO firm. Chaney and Philipich (2002) use
the market reaction to clients of former Arthur Andersen, a former ‘Big Five’ auditing firm, to
measure the reputational impact due to the Enron audit failure. They report a significant negative
response to Andersen’s other clients when it admitted the failure in auditing Enron. Hogan (1997)
also reports that an auditor with higher quality may effectively reduce the underpricing, but such
gain is associated with a cost premium charged by big auditing firms.
Starting with two seminal papers by Barry, et al. (1990) and Megginson and Weiss
(1991), venture capital backing services begin to be viewed in a similar role as investment banks
and auditing firms. However, the early studies typically ignore the reputation difference among
VC firms. Instead, most of them use the VC-versus-nonVC dichotomy approach (Barry, et al.,
1990; Megginson and Weiss, 1991; Lee and Wahal, 2004). Gompers (1996) distinguishes among
VCs with the age of a VC firm as a measure of VC reputation. He reports that the younger VC
firms take companies pubic earlier than older venture capital firms in order to establish

11
reputation. His evidence also shows that companies backed by young venture capital firms are
more underpriced at their IPO than those of established venture capital firms. Krishnan et al.
(2010) use prior market share of VC-backed IPOs as the measure of VC reputation. They show
that this reputation measure is positively related with long-run post-IPO performance measured
by industry-adjusted operating performance, market-to-book ratio, and long-run listing survival.
To explain this positive relation, they show that more reputable VCs are more actively involved
in their post-IPO firms and are associated with better quality corporate governance. More
reputable VCs are also associated with greater investor demand for the IPOs they back. There are
other measures of VC reputation that have been used. For example, Hsu (2004) uses the number
of investments a VC has made in a startup’s industrial segment. Sorensen (2007) uses past
investment rounds of venture investments and the total amount of funds available for investing.
All of these measures are shown to have some power to explain the quality or post-IPO
performance of newly public firms.
3 DATA, RETURN MEASURE and SAMPLE SUMMARY
3.1 Data and Summary
The IPO and VC-backed data are provided by SDC Global New Issues database. The
VC firm characteristics all come from SDC VentureXpert. The data includes all IPOs that
occurred from 1990 to 2004. Similar to other IPO research, I exclude all IPOs that are defined as
ADRs, REITs, partnership, close-end fund, and unit offering. I also exclude all IPOs that have an
offer price less than 5 dollars or are in the finance or utility industries. To enter the final sample,
the IPO has to be tracked by CRSP within 90 days after the IPO and its first book value of equity
should be available in Compustat within 2 years after the issue day. The final sample includes

12
4,269 IPOs. Consistent with what has been previously observed, venture-backed IPOs represent
a significant portion of the total IPO market in each year, see Panel A of Table 2.1. During the
internet bubble (1999-2000), venture-backed IPOs even dominated the market.
Panel B summarizes the IPO characteristics of different periods. For both VC-backed and
nonVC-backed IPOs, their sizes in terms of IPO proceeds increases significantly since the 1990s.
However, venture-backed IPOs are smaller than non venture-backed IPOs in every period. The
summary also shows that venture-backed IPOs have a generally higher first-day return than non
venture-backed IPOs. During the internet bubble, the first-day return of venture-backed IPOs is
almost twice that of non venture-backed IPOs. This is consistent with the finding by Lee and
Wahal (2004).
3.2 Return Measure
To measure the abnormal return of a newly public firm, I compare the raw buy-and-hold
return7 to benchmarks over 1-year, 2-year and 3-year periods after the IPO date.8 For the first
month of the IPO stock return, I include the daily returns from the second day after the IPO date9
to the end of first month. These firms are benchmarked to the return of a matched size and book-
to-market portfolio, and the equally-weighted market index of the CRSP NYSE,
NYSE/AMEX/NASDAQ return to ensure the results are robust. At the end of every June, I
7 [1 ] 1i
i
BHAR R⎧ ⎫= + −⎨ ⎬⎩ ⎭∏
8 I do not focus on the 6-month return because a typical 180-day lockup period restricts most insiders including VCs from selling their shares. The limited supply during this period may bias the short-term return. Field and Hanka (2001), Brav and Gompers (2003) report a significant negative return around the expiration of the IPO lockup which is caused by substantial selling of pre-IPO shareholders. This makes the 6-month return a noisy measure of market valuation of newly public firms. 9 The first-day return of the IPO is usually high and may cloud the real post-IPO buy-and-hold return. It is therefore better to exclude the first day return when evaluating long-run post-IPO stock returns.

13
obtain the size and book-to-market break points of the NYSE stock universe to divide the
NYSE/AMEX/NASDAQ stock universe into 5 size quintiles and 5 book-to-market quintiles
whose intersections are the 25 size and book-to-market portfolios. Similar to Brav and Gompers
(1997), each size and book-to-market portfolio is purged of firms that have undertaken an IPO or
seasoned equity offering (SEO) within 5 years in order to avoid comparing the sample IPO firms
to ‘themselves.’ The 25 size and book-to-market portfolios are reformed every June. I match
each sample IPO with one corresponding portfolio based on their size and book-to-market ratio
at the end of every June. The size used at the end of June is the market capitalization at the end
of June in year t. For the book-to-market ratio, the book value of equity is equal to the sum of the
book value of common equity and the balance sheet deferred taxes and investment tax credits of
fiscal year that ended in year t-1. The market value of equity uses the stock price and shares
outstanding in December of year t-1. These definitions are the same as Fama and French (1992).
The matching between each IPO and the size and book-to-market portfolio remains unchanged
from July of year t until June of year t+1. At the end of June in year t+1, the matching is repeated
using the same procedure. If any sample IPO is delisted before the next matching date, I remove
it and its benchmark portfolio to mimic the experience of real investors. However, I use its
delisting return, if available, as the return for the delisting month. Panel C of Table 2.1 shows
that 79.67% of the sample IPO firms survive the first 36 months after the IPO. There are 50 firms
(1.17%), 365 firms (8.55%) and 453 firms (10.61%) that are delisted before 12 months, 24
months and 36 months, respectively. I calculate both the equally- and value-weighted returns of
each size and book-to-market portfolio as the benchmark.
14
3.3 Do VC-backed IPOs Have Anything Special?
In Table 2.2, I calculate the first day return, 1-year and 3-year post-IPO BHAR adjusted by
the market index10 and the size and book-to-market portfolio. An obvious pattern is found in this
table. The VC-backed IPOs are associated with much higher short-run (1-year) and long-run (3-
year) returns before the internet bubble. However, since the bubble bursting, VC-backed IPOs
underperform in both the short-run and long-run. The most significant change is shown in three-
year BHAR. In the 1990s (before the internet bubble), the venture-backed IPOs over-perform the
non-VC-backed IPOs by 41.67% in raw returns, but since 2001, this relation reverses. The VC-
backed IPOs underperform by 45.37% over the three-year horizon after the IPO during the post-
bubble period. The first-day return of VC-backed IPOs is always higher throughout the three
sub-periods.
The pattern identified in Table 2.2 implies that when treating VCs as a homogenous
group, there is no robust relation between VC-backed IPOs and nonVC-backed IPOs in terms of
their post-IPO return. Focusing on different sub-periods, the data tend to give different results.
This is possibly because VCs heavily cluster in the technology industry and if these types of
stocks show any time pattern in terms of stock returns, it will be easily observed that VC-backed
IPOs show the similar pattern. In other words, the destiny of a VC-backed IPO is simply at the
hands of the macro economy, determined by technology progress, investor optimism and many
other factors that are beyond the control of the venture capitalist
However, it does not mean that the VC industry has no value at all. Rather, there are VCs
who are able to add great value to the newly public firms through their networks (Hochberg,
2007) and expertise. As repeated players in this private-to-public process, they have accumulated
10 The results using different index returns are similar and I only report the return adjusted by NYSE/AMEX/NASDAQ equally-weighted returns.

15
abundant experience and reputation, which may be recognized by the other investors in the IPO
market. We therefore focus on the question of how to distinguish these really good VCs from the
others who are simply riding on the technology trend. In this regard, VC reputation may be the
best candidate that serves this purpose.
4 VC REPUTATION
4.1 Economic Performance and Visibility
Given the importance of VC reputation, it is unfortunate that the debate is still going on
about how to measure it. This is in sharp contrast to the literature focusing on investment bank
reputation. Various variables have been used in the existing literature such as the age of the VC
firm (Gompers, 1996), the cumulative investment made by a VC firm in a startup’s industrial
segment (Hsu, 2004), the number of investment rounds participated (Sorensen 2007), etc. While
these measures all have some power in capturing the reputation capital that have been
accumulated in the entire history of a VC firm, none of them explicitly consider the fact that the
most recent performance of a VC firm, instead of the entire history, may have disproportional
influence on the VC reputation due to the highly competitive and segmented nature of VC
industry. Besides, behavioral finance suggests that investors tend to over-weigh their recent
experience when making an investment decision. If an investor by chance invested in an IPO
recently backed by a really good VC, which results in a good return in the post-IPO market,
he/she may be deeply impressed by this experience. If the same VC brings another IPO in the
near future, this investor may be more likely to invest in it because the recent good return
contributes to the reputational ranking of this particular VC in the investor’s mind.

16
However, the economic performance in the recent past is not the only factor that may
have a disproportional effect on reputation. In an industry where most of the players are not well-
known, the ‘visibility’ of a VC firm may be another component that has similar power. For a
long time, the management and economic literature has recognized the importance of ‘being
visible’ for building reputation (Fombrun and Shanley 1990). However, the existing measures of
VC reputation seem to have weak power in capturing visibility.
4.2 Possible Proxy for Economic Performance and Visibility
There are many different variables that can proxy for the recent economic performance
and visibility of a VC firm. In this paper, I will focus on the IPO-related variables because it is
well known that the IPO is the most profitable outcome of VC investment and it is used as the
most important yardstick for evaluating a VC firm. At the same time, the IPO is also an event
that may attract the attention of the media and other investors. For example, the Wall Street
Journal tracks incoming and successful IPOs in a special section. Therefore, it seems reasonable
to assume that if a VC firm frequently shows up in the IPO market, the potential IPO investors
may be more familiar with them and tend to recognize the value of being backed by these ‘well-
known’ VCs.
The first proxy variable that explicitly captures the effect of recent performance and
visibility is the number of successful IPOs recently backed by a VC firm (IPONUM) and it may
be the most straightforward one. The more IPOs recently backed by a VC firm, the better and
more visible is the VC firm. However, it is not a perfect proxy. For example, this proxy fails to
capture the so-called ‘size’ effect in the IPO market. Anecdotal evidence suggests that a ‘big’
IPO in terms of the amount of funds raised may have unique power in capturing the public

17
attention. If a VC firm is associated with a big IPO that is disclosed in detail by the media, it is
more likely that investors will notice this VC firm. Therefore, the number of big IPOs backed by
a VC firm may be another good proxy and is explored here.
In fact, there are many possible good proxy variables. I propose five different but
closely related variables that may partially capture the economic performance and visibility of a
VC firm. All of them are easy to calculate and straightforward to interpret. Table 2.3 lists them.
Each of these proxy variables may have significant power to proxy for the recent
performance and visibility of a VC firm and hence its reputation. I use all the variables together
by taking a composite approach to show the importance of capturing recent performance and
visibility. I will first show the power of ‘IPONUM’, the most straightforward proxy, and then use
principal component analysis to construct a composite index based on all of five variables. It is
shown that this composite index of VC reputation has stronger predictive power for post-IPO
stock return than ‘IPONUM’ .
4.3 Methodology
To test the predictive power of the proposed VC reputation measures, I define every
three-year period as a sorting period in which the reputation measures are calculated. The
following two-year period will serve as a testing period in which the new IPOs backed by VCs
are matched with their reputation as created in the previous three-years.11 Under this sorting-
testing design, I am able to capture the incremental effect on VC reputation due to its recent
11 I do not use a one-year sorting and testing period because it is rare for a venture capitalist to bring several firms public in one year. This is extremely hard even for the most prestigious VCs. To sort VC reputation in one year and match it with a one-year testing period, results in too little variation in the numbers of IPOs backed by a certain venture capitalists. In contrast, a ‘wider’ sorting and testing period will make it easier to capture the variation in the number of VC-backed IPOs and hence the difference in reputation of venture capitalists.

18
economic performance and visibility. The sorting and testing period is selected in the following
manner.
Sorting and Matching Scheme
Given the sample period (1990-2004), I create 6 sorting periods with one year overlaps.
Correspondingly, there are 6 testing period each of which is matched with the previous sorting
period. Under the design scheme as shown in Figure 1, the testing period does not have any
overlap years. Table 2.4 shows the detailed time interval for each sorting and testing period as
well as their matching relations.
The testing period ranges from the year 1993 to 2004 while the first three years (1990-
1992) only serve a sorting purpose. The testing sample overall includes 3,412 IPOs that consist
of 1,416 VC-backed IPOs and 1,996 nonVC-backed IPOs.
5 VC REPUTATION AND POST-IPO RETURN
5.1 Initial Evidence
It is important to notice the multiple-to-multiple relations between a VC firm and an IPO.
In particular, one IPO could be backed by multiple VCs and similarly, one VC could back
multiple IPOs during one period. Therefore, for each VC in one particular sorting period, I
calculate the total number of IPOs that are backed by it (IPONUM). When matching this

19
particular VC firm with IPOs that occurred in the following testing period, one IPO could have
multiple VCs who had shown up in the previous sorting period and hence have non-zero
IPONUM. For each IPO in the testing period, I calculate the average of IPONUM across all of
its backing VCs who have non-zero IPONUM. This average will be used as the proxy for the
average reputation of backing VCs (AVGIPONUM). This matching and calculating process is
shown as follows.
VC-to-IPO Matching
Table 2.5 summarizes IPONUM and AVGIPONUM for each sorting and testing period.
In the following analysis, AVGIPONUM will proxy for the average reputation of VCs who are
now backing one IPO.
In Table 2.6, I sort the whole sample into four categories: nonVC-backed IPOs, VC-
backed IPO with AVGIPONUM lower than 3, VC-backed IPOs with AVGIPONUM between 3
and 10, and VC-backed IPOs with AVGIPONUM above 10.12 I report the mean and median of
first day returns, one-year BHAR, two-year BHAR and three-year BHAR respectively.
Table 2.6 Panel A shows that the mean and median returns have quite different patterns.
The mean return shows a strong and monotonic trend increasing from the ‘Low’ category to the
12 I also tried other classification of AVGIPONUM, the results are qualitatively similar.

20
‘High’ category. When I compare the mean return of different sub-groups of VC-backed IPOs to
that of nonVC-backed IPOs, the evidence shows that the IPOs backed by ‘Low’ reputation VCs
always underperform nonVC-backed IPOs except in the first day return. However, the ‘High’
group always shows the best return, not just within VC-backed IPOs but within the overall
sample. In comparison, the median return does not show any consistent pattern. The t-test and
nonparametric test in Panel B show the pairwise comparison between different sub-groups of
VC-backed IPOs.
The initial evidence seems to suggest the potential power of this reputation measure
(AVGIPONUM). However, this power is not supported by the median return. This suggests that
IPONUM, the number of IPOs backed by a VC, may not be a perfect measure of VC reputation.
Instead, it only captures one dimension of the VC reputation. To have a better measure, it is
necessary to incorporate other dimensions. Next, I verify the importance of capturing recent
performance and visibility when measuring VC reputation.
5.2 Reputation Index
The previous evidence suggests that a single proxy of VC reputation may not capture all
dimensions of reputation. It may only have some predictive power for post-IPO returns. Next, I
use principal component analysis to construct a composite index as the proxy for VC reputation.
The advantage of this technique is that the principal component will capture the common
variation among all five proxy variables. If these variables are all measuring VC reputation in
some way, their common component may be a cleaner measure of reputation.

21
Specifically, for each sorting period, I extract the first principal component of five
proposed proxy variables for each VC firm.13 This procedure creates one variable (the principal
component) based on the real proxy variables. I call this principal component the ‘Reputation
Index’ hereafter. Panel A of Table 2.7 shows the factor loadings of each proxy variables in
different sorting periods. For example, the first row of Table 2.7 shows that the reputation index
in the first sorting period is a linear combination of standardized proxy variable as follows:
1Reputation Index 0.2753 IPONUM 0.2693 BIGIPONUM 0.2644 BIGIPO= × + × + × 0.2217 EVERYYEAR 0.1981 IPO+ × + × ,
The factor loadings show that each of the five proposed proxies contribute to the
reputation index, which implies that all of them at least partially proxy for VC reputation. The
IPONUM has the highest contribution while the IPO dummy contributes the least. The loadings
are all positive, which means all proxies are positively related with the VC reputation. Panel A
also shows that the factor loadings in different sorting periods are quite stable. The number of
IPOs (IPONUM) is always the proxy that has the highest loadings on the index.
The average factor loadings show that a one unit increase in ‘Reputation Index’
corresponds to an increase of approximately 3.5 previous IPOs (1/0.2867) or previous big IPOs
(1/0.2862). In addition, the coefficients on BIGIPO, EVERYYEAR and IPO means that if a
venture capitalist brings one ‘big’ IPO in past three years, its ‘Reputation Index’ will increase by
0.2721. If it has brought new IPOs every year in the past three years, the index will increase by
13 For all sorting periods, the only principal component with eigenvalue > 1 is the first principal component, which means the proposed proxies are all measuring one common thing. To retain only the first principal component is hence consistent with eigenvalue larger-than-one criterion when deciding the number of retained principal components.

22
0.2219. If it has brought at least one new IPO in the past three years, its reputation index will
increase by 0.2074.
5.3 Reputation Index: Univariate Analysis
Once the reputation index is created for each VC firm, the similar VC-to-IPO matching
procedure as described earlier will be used to calculate the average reputation of backing VCs for
each IPO in the testing period. I then test the predictive power of this average measure of
reputation. Panel B of Table 2.7 briefly summarizes the average reputation index for all VC-
backed IPOs during 1993-2004.
In Table 2.8, I divide the sub-sample of VC-backed IPOs into three groups based on the
value of Reputation Index. I define a negative index as the low reputation group. A range of ‘0~3’
is defined as medium reputation group while the high reputation group are VCs with reputation
index higher than 3. I report the mean and median return for nonVC-backed IPOs and three sub-
groups of VC-backed IPOs in Panel A. Similar to Table 2.6, the mean return shows a strong
monotonic trend in post-IPO returns within the VC-backed IPOs and overall sample. But Table
2.8 is different from Table 2.6 in that even the median returns have shown a similar pattern.
Specifically, a higher Reputation Index is associated with a higher median return within the VC-
backed IPOs. The IPOs backed by the most prestigious venture capitalists even out-perform the
nonVC-backed IPOs. The t-test and nonparametric test show that most group comparisons are
significantly different. Thus, the initial evidence implies a much stronger predictive power of the
Reputation Index, the composite measure of VC reputation. This is possibly because it captures
more dimensions of reputation. To examine the robustness of the RI, I will use a regression
framework to control for other factors that may also affect the post-IPO returns.
23
5.4 Reputation Index: Regression Analysis
5.4.1 Model Specification
I focus on the predictive power of VC reputation for the post-IPO returns over various
horizons (1-year, 2-year and 3-year). Specifically, I use the same model specifications for three
dependent variables, each of which uses an equally-weighted book-to-market portfolio as the
benchmark. The dependent variables are: (1) 1-Year BHAR (BHAR1YR); (2) 2-Year BHAR
(BHAR2YR); and (3) 3-year BHAR (BHAR3YR). All of them are Winsorized at 0.5% and 99.5%
to remove the influence of extreme values.
The sample includes both venture-backed and non-venture-backed IPOs during 1993 to
2004. The main explanatory variables are the proposed reputation index (RI) and other existing
VC reputation measures14 such as VC age (VCAGE), total number of portfolio companies
invested (COSNUM), total number of investment rounds participated (RNDNUM), total known
amount of investment (TOTINVT), and total amount of capital under management (TOTCAP).
For each IPO in the testing period, I calculate the average of these variables across all backing
VCs and use the natural log of this average value in the regression. The main purpose of this
regression is to evaluate whether the proposed proxy for VC reputation has predictive power as
theory implies and if its power is robust when other existing reputation measures are included in
the regression.
Since the sample includes both venture-backed and non-venture-backed IPOs, the above
VC reputation measures will be only available for venture-backed IPOs while the non-venture-
14 The proposed Reputation Index may be just capturing the power of other reputation measures such as the age of VC, the total amount of capital under management, etc. Using a similar VC-IPO matching procedure, I calculate the average value of other reputation measures of all backing VCs for each IPO. I use regression analysis to check this possibility.

24
backed IPOs all have missing values for these variables. To overcome this problem, the
following model specification is used and allows for a decomposition of the effect of venture
capital financing and the incremental effect of VC reputation for post-IPO return.
1 2 *[VC Reputation Measures]RET VC VC Controlsα β β β ε= + ∗ + ∗ + ∗ + (1)
Where RET = BHAR1YR, BHAR2YR, or BHAR3YR.
‘VC’ is a dummy variable indicating venture-capital financing. It is equal to one if the
IPO is backed by VCs and zero otherwise. When it is not a VC-backed IPO, ‘VC’ is equal to
zero and hence eliminates the interaction term. Thus the non-existing measures of VC reputation
for non-VC-backied IPOs will not be involved in the model. It is reduced to:
RET Controlsα β ε= + ∗ + When VC=0 (nonVC-backed IPOs) (2)
In contrast, when the IPO is VC-backed and hence ‘VC’ is equal to one, the model
becomes:
1 2 [VC Reputation Measures]RET Controlsα β β β ε= + + ∗ + ∗ + (3)
Given the value of control variables, the difference between equation (2) and equation (3) is :
1 2 [VC Reputation Measures]β β+ ∗ (4)
Assuming that a certain IPO is backed by a rookie VC, and hence it has virtually no
reputation (VC Reputation Measures =0), equation (4) simply collapses to 1β .
25
Therefore, 1β is the difference in post-IPO returns between non-venture-backed IPOs and
VC-backed IPOs when VC reputation is negligible. For IPOs backed by reputable VCs, it is
straightforward to show that 2β is the incremental effect of reputation. In other words, the
second coefficient measures the marginal change in post-IPO returns due to a one unit increase
in VC reputation. Therefore, the specification (1) estimates the effect of ‘VC-backing’ if
reputation is ignored and the incremental effect of VC reputation for VC-backed IPOs
respectively.
5.4.2 Controls Variables
IPOsize: In addition to VC reputation measures, I also control for the IPO size with the
natural log of IPO gross proceeds (IPOsize) that is deflated to 1993 dollars using the CPI index
from the Bureau of Labor Statistics. Whether a large IPO will be associated with higher or lower
post-IPO return is not clear. Rationally, a large IPO may be conducted by a mature and
established firm which implies less risk and hence lower return. However, abundant anecdotal
evidence seems to suggest that large IPOs are more likely to attract attention in the IPO market
which may lead to higher investor heterogeneity and hence higher short-run over-valuation
(Miller 1977).
FIRMAGE: Another factor that may affect the post-IPO return is the age of the IPO firm.
Ritter (1984) argues that a firm with a longer history is less risky and therefore the return-risk
relationship implies lower post-IPO return for older firms. Carter, Dark and Singh (1998) report

26
the supporting evidence. The firm age data is provided by Jay Ritter. Empirically, I use the
natural log of one plus real firm age15 as a control variable.
STDRET1YR: Johnson and Miller (1988) find that the standard deviation of IPO stock
returns reflect the riskiness of future cash flow. The rational risk-return tradeoff predicts a higher
post-IPO return when such riskiness is high. But it may be harder to value such a firm when the
uncertainty of a newly public firm is high, as reflected by a higher standard deviation of IPO
stock return. This valuation difficulty may be accompanied by a lower stock return due to lower
participation of investors. Therefore, theories do not have a definite prediction. I calculate the
standard deviation of raw daily stock returns of each IPO stock starting from the 6th trading day
for 255 trading days, similar to Carter, Dark and Singh (1998). It is used in percentage form in
the regression.
SECOND: The demand for IPO stocks may also affect the post-IPO return given the
limited supply when a stock just becomes public. To measure this demand for new stock, I use
the fraction of total offering represented by pre-IPO shareholders (secondary stock offered).
When the market demand is expected to be strong, the existing shareholders are more likely to
sell more of their pre-IPO shareholdings. If the demand seems weak, the secondary stock offered
may be reduced significantly (Hanley, 1993). I define SECOND as the percentage of total
offered stock by existing stockholders.
P90s: Panel B of Table 2.1 shows that the period before the internet bubble has a
significantly different pattern in both short-run and long-run post-IPO returns when VC-backed
IPOs are compared to non-VC-backed IPOs. This trend may be due to the rise and fall of
technology stocks. To control for this time trend, I create a dummy, P90s, that is equal to one if
the issue happened before the year of 1999. It is equal to zero otherwise. 15 Ln(1+Firm Age)

27
The complete regression model is as follows:
1 2 3
4* 5 6 7
[VC Reputation Measures] (1 ) ( ) * * 1 * 90RET Ln FIRMAGE
Ln IPOSIZE SECOND STDRET YR P sα β β β
β β β β ε= + + ∗ + ∗ +
+ + + + (5)
Where RET = BHAR1YR, BHAR2YR, or BHAR3YR.
I use the same set of control variables on the right hand side of the equation for
regressions with different dependent variables (BHAR1YR, BHAR2YR, and BHAR3YR).
5.4.3 Short-run BHAR as Dependent
The regression with 1-Year BHAR or 2-Year BHAR as the dependent variable is
reported in Table 2.9 and Table 2.10. The regression results are very similar in both regressions.
The VC dummy is insignificant in almost all specifications and its sign is also sensitive to the
specific model specification, which provides further evidence again the VC-nonVC dichotomy.
The coefficient on the interaction term is highly significant in all model specifications.16 This is
strong evidence for the predictive power of the reputation index for the short-run post-IPO return.
On average, one unit increase in the ‘Reputation Index is accompanied by an approximate
increase of 3.46% in one-year BHAR and 7.54% in two-year BHAR. Consider that the average
factor loading for IPONUM (0.2867) and BIGIPONUM (0.2862), this corresponds to
approximately 3.5 more IPOs or big IPOs in past three years. As for BIGIPO (0.2721),
EVERYYEAR (0.2219) and IPO(0.2074), their average factor loadings means that when a VC
brought a big IPO public in past three years or brought new IPOs every year in the past three
years or brought at least one IPO in the past three years, its Reputation Index will, on average,
increase 0.2721, 0.2219 or 0.2074 respectively. This corresponds to an increase of 0.94%, 0.77%,
16 Due to the high correlation among reputation measures, I carefully design the specifications to avoid the multicolinearity.
28
and 0.72% in one-year BHAR and an increase of 2.1%, 1.67%, and 1.56% respectively in two-
year BHAR.
When various combinations of other existing reputation measures are included in the
regression, no one proxy (or combination) captures the power of the reputation index. In
regression 6 in both Table 2.9 and Table 2.10, I omit the Reputation Index and only include
existing reputation measures. None of these reputation measures has any significant predictive
power. Therefore, Reputation Index, as a recent past VC reputation, is not simply a proxy for the
other reputation measures. In fact, the index seems to capture something that has been missed by
other measures.
In addition, when comparing the R-Squared of the first regression with the other
regressions that include other reputation measures, the R-squared has only slight improvement.
So the inclusion of the other reputation measures adds very little additional explanatory power.
5.4.4 Long-Run BHAR as Dependent
The results using 3-year BHAR as the dependent variable is reported in Table 2.11. As in
the previous analysis, I do not expect strong predictive power of VC reputation for long-run
returns if the post-IPO presence of the venture capitalists is the main factor that relates reputation
to the return. The results in Table 2.11 using 3-year BHAR as the dependent variable are
consistent with this conjecture. The Reputation Index is positive and significant in all regressions.
However, the magnitude of the coefficient on the interaction term of ‘VC’ and Reputation Index
suggests that there is no marginal increase in return within the third year after the IPO. In Table
2.10, it is shown that one unit increase of Reputation Index is associated with an increase of 7.54%
in two-year BHAR. A similar increase in the index is associated with an increase of 6.6% in

29
three-year BHAR. This implies that a more reputable VC may predict a higher two-year post-
IPO return, but not necessarily a better third year BHAR.
‘Firm age’ is not significantly in any regression. However, the IPOSIZE coefficient is
negative and significant in all regressions, which is consistent with the rational theory. A larger
IPO tends to be more established and hence less risky. The risk-return relation predicts lower
return for larger IPOs. The standard deviation of IPO return is also highly negative and
significant in all model specifications. This result is similar to Carter, Dark and Singh (1998).
The time dummy (P90s) is positive and significant in the two-year BHAR and three-year
BHAR regressions. A VC-backed IPO that went public before the year of 1999 is associated with
an increase of 15.75% in two-year BHAR and 16.69% in three-year BHAR. This implies the
possibility that VC-backed IPOs before the internet bubble may have better firm quality. When
this better quality is recognized by the market, it is translated into a higher long-run return.
Overall, the regression results confirm the previous univariate results about the predictive
power of the Reputation Index. Specifically, the VC reputation, measured by RI, has strong and
significant predictive power for 1-year and 2-year post-IPO stock returns. However, the fact that
VCs unwind their investment in the short-run reduces the power of RI for predicting longer run
returns. A higher RI does not predict a higher third year return after the IPO.
5.4.5 Post-IPO Return As Reputation Measures?
Chemmnaur and Fulghieri (1994) argue that the post-IPO returns of a newly public firm
underwritten by an investment banker may be a good measure of its reputation. Similarly, will
the post-IPO return of venture-backed IPOs be another candidate for capturing the VC reputation?
In a different field, but using a similar argument, Chaney and Philipich (2002) use the market

30
reaction to the other clients of Arthur Andersen, a former ‘Big Five’ auditing firm, to measure
the reputational impact on this auditing firm by the Enron audit failure. However, the post-IPO
return of venture-backed IPOs could be quite a noisy measure due to the fact that the investors
do not necessarily attribute either good or bad post-IPO return to its backing venture capitalists.
Various factors have significant influence on the post-IPO return such as underwriting market
support, the firm quality, and IPO market condition. Therefore, theories do not indicate clear
implications for the power of post-IPO return as a reputation measure.
I use the same model specification as the above analysis to see the effect of ‘VC-backing’
and the incremental effect of VC reputation measured by the post-IPO returns. In each sorting
period, I calculate the mean return (first-day return, 1-Year BHAR and 3-yr BHAR) of IPOs that
were backed by the same VC. Then I match the mean return with the IPOs in the following
testing period that are backed by the same VC. When matching the return of 1-Year BHAR of
previous IPOs, I leave a one year gap between the sorting period and testing period which allow
the market to observe the one-year post-return. Similarly, when matching the return of 3-year
BHAR of previous IPOs, I leave a gap of three years between the sorting period and testing
period. This gap will give sufficient time to the market for establishing return-based reputation
ranking. I also test the predictive power of value-weighted average and median of post-IPO
returns, the results are the same and hence untabulated. The regressions shown in Table 2.12
show that even when the post-IPO return of previous IPOs is the only reputation measure
included in the regression, it is insignificant in all specifications. The results clearly reject the use
of post-IPO return as a measure of VC reputation.

31
5.4.6 Endogenous Choice: Brief Discussion
The matching between a VC firm and a portfolio company is a two-sided matching
procedure (Sørensen, 2007) or endogenous decision (Lee and Wahal, 2004). A VC firm with a
good reputation is able to provide better monitoring, invites better underwriters at the IPO, etc.
These may explain the better post-IPO returns. However, the casual relation could be the other
way around in that an inherently better portfolio company tends to seek investment from a VC
firm with a better reputation. If this is the case, the positive relation between VC reputation and
post-IPO return as shown is not indicating any causality. It will be therefore inappropriate to
state that good reputable VCs can add value to their portfolio companies. This is a common
problem for any research that uses VC reputation to predict anything related to performance of a
portfolio company. However, the proposed Reputation Index seems to overcome the endogeneity
concern. The Index is derived from the performance of a VC firm in the previous three years. If a
private firm observes the performance of a VC firm during this period, this private firm may
decide that this VC is a good target for seeking investment. But the process of obtaining venture
capital financing is very time-consuming. Even if we assume that the private firm succeeds in
receiving investment from its preferred VC firm shortly, it doesn’t mean its IPO is imminent.
What happens in the VC industry is that a VC firm makes investments in startup firms in the first
four or five years and then considers harvesting the crops (Lee and Wahal, 2004). This proposal-
to-harvest process is long, implying that the identified relation between the Reputation Index and
post-IPO returns is very unlikely due to the screening ability of a VC firm (e.g. a better VC firm
is more likely to attract a better portfolio companies). Rather it is more likely due to the better
monitoring service provided by the VC.

32
6 CONCLUSION
Venture capital reputation is important for differentiating VC firms in terms of their
monitoring ability and ability to bringing companies public. However, there is still debate about
the measure of VC reputation. Various proxies have been employed in the literature to proxy for
VC reputation. These proxy variables have been shown useful in explaining the performance of
portfolio companies, such as their first day return after the IPO or operating performance.
I argue that two new components should be added; the recent economic performance and
visibility of a VC firm. I propose five simple but intuitive proxy variables that can partially
capture the economic performance and visibility of a VC firm in the IPO market. Based on these
proposed proxy variables, I use principal component analysis to extract the first principal
component as a ‘Reputation Index’ for measuring VC reputation.
Both univairate analysis and regression results provide strong evidence for the predictive
power of the proposed Reputation Index. Using 1-year and 2-year BHAR as dependent variables,
a one unit increase of the Reputation Index is accompanied by 3.46% and 7.54% increases in
BHAR respectively. This relation is robust to various model specifications that control for other
firm or IPO characteristics. More importantly, the regression model shows that the inclusion of
the other existing measures of VC reputation does not capture the predictive power of the
Reputation Index. The inclusion of other reputation measures only slightly contributes to the
overall explanatory power measured by R-squared. When the proposed ‘Reputation Index’ is
omitted, the other reputation measures such as the age of VC and the total capital under
management do not show any predictive power.
The detected relation between the Reputation Index and post-IPO returns may be due
multiple reasons. It could be the case that more reputable VCs can bring companies with better

33
inherent quality that hence translate into better stock returns. However, this relation may also be
due to the fact that VCs tend to remain as principal shareholders even after the IPO. Their desire
to protect their reputation may lead to some aftermarket activities that eventually improve the
return. A third possibility is that the good VCs may attract more and better participation of other
IPO investors, which raises the issue of investor heterogeneity in the post-IPO market. The
theory of investor heterogeneity predicts higher short-run stock returns in this case. It seems a
good avenue to specifically test these possibilities in the future.

34
CHAPTER THREE: VENTURE CAPITAL OWNERSHIP, POST-IPO SELLING
AND OWNERSHIP DURATION
ABSTRACT
Venture Capitalists (VC) do not always cash out their investment immediately
at an IPO or even after the lockup period. There is significant variation in the
selling decision and timing of venture capitalists after the IPO. I examine the
determinants of such variation at lockup expiration and post-expiration,
respectively. Four competing hypotheses are proposed to explain the selling
decision of venture capitalists at the lockup expiration: (1) an information
trading hypothesis; (2) a reputation maximization hypothesis; (3) a reputation
establishment hypothesis; and (4) an information asymmetry hypothesis. The
results support the reputation maximization hypothesis and information
asymmetry hypothesis. I further analyze the selling decision of VCs after the
lockup expiration by examining the investment duration of VCs. I find that a
good prior return of an IPO firm will significantly increase the likelihood of VC
selling on lockup expiration and also shorten the investment duration of VCs
post-expiration.
1 INTRODUCTION
Most IPOs have a lockup agreement which prohibits pre-IPO shareholders from
unwinding their share stake for typically 180 days after the IPO. This mechanism serves several
purposes: “…it reassure the market that key employees will continue to exert themselves for at

35
least a few months; it provides a credible signal that insiders are not attempting to cash out in
advance of imminent bad news; and it may aid the underwriters’ price support efforts by
temporarily constraining the supply of shares…” (Field and Hanka, 2001). The expiration of the
lockup agreement is the first date when pre-IPO shareholders may sell without restriction. The
existing evidence17 shows a significant increase in trading volume and a negative abnormal
return around this date.18 In particular, Field and Hanka (2001) and Bradely et al. (2001) find that
the negative abnormal return is largely driven by the IPOs backed by venture capitalists. They
attribute this to the more aggressive selling of VCs than other pre-IPO shareholders. But why
does venture capitalist concentrate its selling on the unlock date? Just because a typical VC fund
has a limited lifespan of 10-12 years, it does not mean all VCs have to sell aggressively at lockup
expiration.
Some evidence shows that VC firms with certain characteristics are more eager to cash
out quickly.19 This implies that there may be significant variation in the selling decision among
venture capitalists when lockup expires. It might be those with the strongest incentive of
unwinding shareholding that should be responsible for the negative return on the unlock date.
We study these issues. The answer to this question may help to identify the real driving force of
the abnormal negative return around lockup expiration, the newly identified anomaly. In fact, the
hand-collected data used here shows that lead VCs have very different selling behavior and also
brings up the first question: what determines the selling of VCs at lockup expiration?
17 See Field and Hanka (2001), Brav and Gompers (2003), Bradley et al. (2001), and Ofek and Richardson (2000). 18 Given the public disclosure of lockup and its expiration date before the IPO, the reported negative abnormal return around this date is inconsistent with some versions of the efficient market hypothesis and hence represents a newly identified anomaly. 19 For example, Gompers (1996) finds that the younger VC firms bring firms public earlier and exit more quickly after the IPO.

36
The data also shows that a significant percent of venture capitalists remain as principal
shareholders after the lockup expiration. Contrary to common perception, VCs typically do not
exit their portfolio companies at the IPO, lockup, or shortly afterwards. Some research20 does
recognize the continuing equity holding of venture capitalists after the IPO, but they do not
explore the dynamics of such continuing holding, let alone the determinants of the dynamics. We
use an ownership ‘duration’ approach to shed light on this question. This may further enhance
our understanding of the investing style of venture capital.
This paper is organized as follows: Section 2 reviews the literature. Section 3 introduces
the data source and relevant methodology. Section 4 empirically analyzes the selling decision of
venture capitalists at lockup expiration and afterwards. Section 5 concludes the paper.
2 LITERATURE REVIEW
In the IPO literature, there is abundant evidence regarding the ownership/selling
decisions of pre-IPO insiders and its implications for the newly public firms (Jain and Kini, 1994;
Mikkelson et al., 1997; Kim et al., 2004; Wang, 2005). Given the controlling position and large
shareholding of VCs, it is surprising that little direct evidence exists for the dynamics of post-
issue VC ownership. This is possibly due to a widely held belief that VCs realize their gain by
unwinding their investment immediately at-IPO or shortly thereafter.
Contrary to this belief, Mikkelson, Partch and Shah (1997) report that venture capitalists
still hold 14.2% ownership five years after the IPO. Gompers and Lerner (1998) report that
venture capitalists usually have a lockup agreement with the underwriter and may continue to
20 Barry et al. (1990), Megginson & Weiss (1991), Mikkelson, Partch & Shah (1997), Gompers & Lerner (1998), Field & Hanka (2001), and Krishnan et al. (2010) all report evidence against the quick exit of venture capitalists in the newly public firms.
37
hold their equity for months or even years after lockup expiration. Field and Hanka (2001) report
that during the year after the IPO, VCs sell or distribute 29% of their stake, but still hold
approximately 17% of the total outstanding shares. The earlier studies of Megginson and Weiss
(1991) and Barry et al. (1990) also examine the ongoing equity holding of VCs for
approximately one year after the IPO. They find that holdings declined by 28% and that the
number of seats on the board remains high. More recently, Krishnan et al. (2010) explicitly
examine the presence of VC ownership up to three years after the IPO and report a significantly
positive relationship between VC reputation and the VCs’ ongoing ownership.
The only direct evidence supporting a quick exit of VC investment is Lin and Smith
(1998). They examine the ownership of lead VCs by looking at their equity holding for the
period starting from the first available proxy statement up to three years thereafter. They find that
only 12.3% of the lead VCs remain as blockholders in proxy statements several years after the
IPO and that the average reported holding is only 1.4%. However, there are several problems in
their analysis. First, they start to track proxy statements from 1989, while their original sample is
for 1979-1990, which explains why they only locate proxy statements for 106 IPOs in contrast to
their whole sample of 497 venture-backed IPOs. It is questionable whether the results based on
only 20% (106 out of 497) of the entire sample is sufficient to support their conclusion. Secondly,
even for the IPOs with proxy statements, there are still 12% (13 out of 106) of the IPOs with
significant VC ownership (11.2% on average) after several years post-IPO. They do not explain
why such variation exists and its implications.
At the same time, the shareholding of venture capitalists has important implications for
the VC-backed firms. Most existing research in venture capital has confirmed the value-adding
services or monitoring provided by venture capitalists. For example, VCs frequently evaluate the

38
progress of entrepreneurial firms and stage their funding as a monitoring mechanism (Gompers,
1995). Their presence is also positively related with the quality of the internal governance system
and board independence (Baker & Gompers, 2003; Hochberg, 2004). Lerner (1995) confirms the
role of VCs in providing monitoring by reporting VCs’ increased board representation around
CEO turnover. In addition, VCs also contribute to the growth of firms by professionalizing the
management team in a more efficient and faster way (Hellmann & Puri, 2002), and facilitating
efficiency-improving strategic alliances among complementary companies (Lindsey, 2008). This
evidence shows the importance of VC presence on firm performance and hence justifies the need
of examining the dynamics of venture capital ownership.
Another stream of finance literature that is related to this paper examines the lockup
period (Ofek and Richardson, 2000; Field and Hanka, 2001; Bradley et al., 2001; Brav and
Gompers, 2003). Most of the IPO issuers have a lockup agreement with the underwriter that
prohibits all pre-IPO insiders, including venture capitalists, from selling after the IPO for a
certain period of time. When such an agreement expires, insiders face the first chance of
unwinding their pre-IPO shareholding and realizing the value of their investment. Since the
lockup period and its expiration date are both disclosed in the public IPO prospectus, we should
not expect any abnormal return around the lockup expiration in an efficient market. However,
Ofek and Richardson (2000), Field and Hanka (2001), and Bradley et al. (2001) all report a
permanent increase in average trading volume and a statistically prominent abnormal return
around lock-up expiration. This seems to be a new anomalous event against the efficient market
hypothesis. Field and Fanka (2001) and Bradley et al. (2001) both find a much larger abnormal
return and excessive trading in the IPOs backed by venture capitalists. None of the above
research, however, further examines this question within the group of VC-backed IPOs and

39
hence provides no explanation of their finding. We specifically focus on the VC-backed IPOs
and provide more detailed analysis of VC selling at the lock-up expiration, which will contribute
to our understanding of the newly identified anomalous event.
3 DATA AND METHODOLOGY
3.1 Data
The complete venture-backed IPOs list for 1997 to 2004 comes from SDC Global New
Issues database. All stock prices, shares outstanding, share volume and return data come from
CRSP. All accounting items are from Compustat. The VC-related variables such as the age of
VC fund come from SDC VenturXpert. We exclude all IPOs from the financial services or utility
sectors (SIC 4900-5000 and 6000-7000) as well as ADRs, limited partnerships, REITs and
closed-end funds. We also exclude any IPOs with an offer price less than 5 dollars to rule out
any concern about penny stock firms. The analysis requires that there is at least one proxy
statement after lockup expiration. The final sample includes 701 VC-backed IPOs.
In this paper, the focus is on the ownership and selling decisions of the lead venture
capitalists in each IPO. The “lead VC” is defined as the one who has the highest pre-IPO
ownership. The IPO prospectus identifies the lead VCs based on their pre-IPO shareholding.
Once identified, we track the annual proxy statements for up to the fourth calendar year after the
IPO year. For ownership data, we only collect those with over 5% of the total outstanding shares
because it is usually the threshold for defining blockholding (Rule 13d-1(a) of the Securities
Exchange Act). If the lead VC holds less than 5% of the total shares outstanding in a certain year,
their ownership is defined as being equal to zero. We also exclude IPOs whose prospectus misses

40
reporting the ownership either before or after IPO data. When inconsistencies are encountered,21
the Pratt’s guide to venture capital or the company website is sought for verification.
The “lockup” agreement and its expiration date are disclosed in the IPO prospectus and
hand-collected.
3.2 VC Selling At Lockup Expiration
It is easy to observe the selling behavior of pre-IPO VCs around the IPO date because the
IPO prospectus reports the ownership of all pre-IPO insiders immediate before and after the IPO.
Unfortunately, we cannot directly measure share sales by venture capitalists around the lockup
expiration. As noted by Gompers and Lerner (1998), venture capitalists’ share distributions to
their limited partners need not be disclosed to the SEC. However, all insiders, including venture
capitalists, are prohibited from selling during the lockup period according to the lockup
agreement. In most cases, the underwriter does not grant the early release during this period.
Therefore, the ownership of pre-IPO shareholders immediate after the IPO date is a good
estimate of the insiders’ shareholding before lockup expiration. At the same time, the ownership
reported in the first proxy statement after lockup expiration can be used as the estimate of VC
ownership immediate after lockup expiration. Based on these ownership data, we can
approximately measure the selling of venture capitalists on the unlock day. Note that this is a
coarse estimate because there is a time gap between the lockup expiration day and the first proxy
statement after. To reduce the inaccuracy caused by the data limitation, we measure the VC
selling at the lockup expiration with the categorized variable (‘Buy’, ‘Hold’, ‘Sell Partially’ and
21 Alexander Ljungqvist has reported data quality problems in the SDC in indentifying venture capitalists for venture-backed IPOs.

41
‘Exit Control’ 22 ) instead of a nominal variable measuring the percentage change of VC
shareholding. Below figure shows the time line of various important dates.
IPO Date, Lockup Expiration and Reported Ownership
IPO Date Lock-up Expiration Date First Proxy Statement
SH1 SH2 SH3
SH1: Shareholding immediate before IPO date (reported in IPO prospectus)
SH2: Shareholding immediate after IPO date (reported in IPO prospectus)
SH3: Shareholding reported in the first proxy statement after lockup Expiration
Based on above ownership data, we calculate the selling of the lead venture capitalists on
IPO date and lockup expiration as follows:
VC Selling at IPO = SH2 - SH1
VC Selling at Lockup Expiration = SH3 – SH2
Instead of examining the level of VC selling at IPO and at lock-up expiration, we
categorize the actions of lead VCs into four categories: (1) Buy; (2) Hold; (3) Sell Partially; and
(4) Exit Control, according to the values of (SH2-SH1) and (SH3-SH2).
22 Since we define any ownership level less than five percent as zero, the lead VC with zero shareholding post-expiration does not really unwind all of its shares. It only means that this lead VC has given up its share block and hence exits the controlling group. Therefore, ‘exit control’ is a more precise name to describe this group.

42
4 EMPIRICAL EVIDENCE
4.1 Summary
For the period of 1997 to 2004, the VC-backed IPO sample includes 701 IPOs. Table 3.1
shows significant variation in the number of VC-backed IPOs year by year. Not surprisingly, the
famous “Internet Bubble,” the years of 1999 and 2000, has much more VC-backed IPOs
compared to other years. In total, 397 VC-backed IPOs went public during the bubble period
while the other six years in the sample (1997, 1998, 2001-2004) have only 304 IPOs combined.
The average first-day return by year peaks in the year of 1999. The average VC-backed
IPO in that year gave the investor a return of 102.99% on the first day. The year of 2000 also
shows the similar fever for new IPOs. In that year, the stock price increases approximately 72%,
on average, in the first-day of trading. The average first-day returns for the years before and after
the bubble are much lower. They range from 7.18% in 2002 to 32.25% in 1998. It is interesting
to note that the time-series pattern of first day returns coincides with that of the “Tech IPO”
percentages across the years.
In most of new IPOs, the issuer has a lock-up agreement with the underwriter. I call the
period from the IPO date to lockup expiration as “lockup period.” Based on a review of all IPO
prospectuses, the lockup agreement exists during the entire sample of IPOs. The summary shows
that the average length of the lockup period is close to 6 months, or approximately 180 days in
all years, which is consistent with the literature (Field and Hanka, 2001; Bradley et al., 2001).
The average IPO proceeds by year show that the size of the IPOs generally becomes
larger. In 1997, the average IPO proceeds are $33.34 million. This number more than tripled to
$111.28 million in just 7 years. The average offer price, however, does not have such
incremental pattern. It increases from $10.71 in the year 1997 to $15.25 in 1999 and starts to

43
decrease afterwards. This is possibly because IPO issuers tend to time the IPO market and to
raise more funds when the market for new stock is hot in 1999 and 2000.
The summary table also shows that the IPO is usually sponsored by multiple VCs. The
average number of backing venture capitalists is very stable at a range of 2 to 4.
4.2 VC Selling at IPO and Lockup Expiration
Table 3.2 summarizes the frequency and percentage of the lead VCs who take different
actions (Hold, Buy, Sell Partially, and Exit Control) at IPO date and at lockup expiration,
respectively.
The table shows that 96.87% of lead VCs chooses to partially cash out at the IPO while
the other three categories (Buy, Hold, and Exit Control) in aggregate only represent 3.13% of the
sample. However, the dominance of the “Sell Partially” group is significantly weakened at
lockup expiration. The actions of lead VCs become more diversified on unlock day.
Approximately one-tenth of lead VCs do not sell at all. They either increase their shareholding or
hold their original shares without any change. The category of “Exit Control” becomes the
second largest group. 20.51% of the lead VCs give up their controlling stake. The “Sell Partially”
group still represents the largest group but its dominance is reduced significantly at lockup
expiration compared to the IPO date.
It is rational to expect that many VCs will partially cash out their pre-IPO investments
when the shares become public. This is because the liquidity of venture capital investment is
much worse than other financial investments such as stocks or bonds. It is very costly or almost
impossible for VCs to transfer their investment to other entities before their investment becomes
tradable. One of the most frequent ways that make VC investment more liquid is going public.
After holding the illiquid asset for many years, VCs will usually cash out part of their investment

44
when it become tradable and re-deploy the proceeds into other ventures. Therefore, the action of
“Sell Partially” does not seem very informative about how the VCs evaluate the real quality and
long-term potential of the newly public stocks. In other words, “Sell Partially” can be viewed as
the normal or benchmark action of every pre-IPO venture capitalist at lockup expiration. In
comparison, it’s more interesting to study the underlying information associated with the other
categories, namely, “Buy”, “Hold” and “Exit Control”.
When the VCs are allowed to sell at lockup expiration, it seems “Buy” signals something
unusual. It is important to ask why VCs increase their holding when the selling restriction is
finally released and what “Buy” implies about the post-expiration performance of new stock. At
the same time, it is also interesting to note that a big portion of lead VCs give up their controlling
share blocks on unlock day. The lead VCs usually hold a big block of shares and their significant
selling will lead to significant increases in the supply of the stock. Given the downward-sloping
demand curve of stocks, such increases in supply may result in a dramatic price drop and lead to
a significant loss for investors who chose to invest in the newly public stocks during the lockup
period. If the market observes the cause of this price drop, it may impair the reputation of VCs as
value creators and may further affect the success of future IPOs backed by the same venture
capitalist. Therefore, it seems that the ’Exit Control’ of the lead VCs may be associated with
certain insider information as well. The above questions all point to the central question of this
paper: what determines the different selling decisions of venture capitalists at lockup expiration?
Table 3.3 Panel A shows the detailed ownership level of the lead VCs at the different
time points. Immediately before IPO, the average lead VC holds 23.7% of the total shares
outstanding. In some extreme cases, the lead VC is almost the only shareholder of the IPO firm
and owns 99.7% of the firm. It is also shown that the lead VCs hold an average17.81%

45
immediately after the IPO. Comparing the mean ownership of the lead VCs around the IPO, on
average they sell 5.89% of the total shares outstanding at the IPO.
After lockup expiration, the pre-IPO insiders are allowed to sell without any restriction.
The mean shareholding of lead VCs drops to 12.45% at that time, but still represents a large
share block. Some lead VCs even hold 75.1% of the total shares outstanding. These statistics are
based on the hand-collected data from either the IPO prospectus or proxy statements. Therefore,
the evidence reported above presents a direct challenge to the so-called “quick exit” assumption.
Panel B of Table 3.3 describes the maximum, mean, and median change in the Lead VC
ownership around the IPO date and lockup expiration. It shows that the average lead VC sells
approximately one-third (32.98%) of their pre-expiration shares on the unlock day. In
comparison, the lead VC sells 24.38% of its pre-IPO holding at the IPO. Admittedly, this
evidence supports the perception that the lead VCs tend to exit after firms go public. It is
important to realize, however, that the statistics above are only describing the central tendency of
VC selling at the IPO and lockup expiration. They ignore the variation in such decisions. This
paper will focus on explaining this variation.
The evidence provided by Table 3.2 and Table 3.3 are strongly against the common
misperception that VCs completely reap the venture investment once the venture becomes public.
Large percentages of lead VCs remain as principal shareholders23 even after lockup expiration.
More importantly, there is significant variation in the selling decisions of lead VCs at lockup
expiration. The next section will focus on the determinants of such variation.
23 Because I define any ownership level less than 5% as negligible, the evidence shown here means that a significant portion of lead VCs remain as principal shareholders even after lockup expiration.

46
4.3 Determinants to VC Selling at Lockup Expiration
4.3.1 Hypotheses Development
What determines whether lead VCs will buy, sell, or hold around the lockup expiration?
We present four hypotheses that might explain their change in ownership: information trading,
reputation maximization, reputation establishment, and information asymmetry.
Information Trading
The literature on insider trading claims that insiders exploit their private information.
Typically, corporate insiders sell if their inside information predicts a significant stock-price
decrease and buy if the information predicts a significant price run-up (Jaffe, 1974; Seyhun, 1986;
Seyhun and Bradley, 1997). Gompers and Lerner (1998) also provide evidence that VCs time
their distribution of shares and exploit the temporary overpricing of shares to achieve a high
stated return. If VCs believe, based on their private information, that the price run-up before
lockup expiration is temporary and immediate price drop might occur, they are more likely to
unwind their shareholding on the unlock day. In contrast, VCs are more likely to buy at lockup
expiration if the insider information predicts an immediate price increase after the expiration of
lockup agreement. Specifically, the action of sell, especially “Exit Control”, should be
associated with a temporary price run-up prior to lockup expiration and a price drop short-run
afterwards. The action of ‘Buy’ should predict significant price increase immediate after
expiration.

47
H1: VCs are more likely to sell at lockup expiration when the specific venture’s stock price
temporarily runs up before the expiration date and drop short-run afterwards. Contrarily, VCs
are more likely to buy when they predict an immediate price run-up after lockup expiration.
Reputation Maximization
The reputation of venture capital is its most valuable asset. VCs have to achieve a good
return in order to boost their reputation among the current investors and secure future financing.
Therefore, we should expect a higher likelihood of VC selling on the unlocked day when the IPO
firms experience a higher return during the lockup period. However, it doesn’t mean that VCs
can simply exploit the temporary overpricing and ignore the subsequent return performance of
IPO firms. If there is a significant return reversal post-expiration, the IPO investors who invest in
the IPO firms and hence suffer the loss may attribute their loss to the leaving VCs. This may
negatively affect the success of future IPOs backed by the same VC firms. Therefore, VCs have
to balance the immediate gain against future success in order to maximize their reputation and
economic interests in the long-run. Specifically, we argue that VCs are more likely to sell and
less likely to buy when the IPO firms perform well during the lockup period but the selling
shouldn’t be associated with significant return reversal afterwards.
H2: VCs are more likely to sell and less likely to buy at lockup expiration when the IPO firm
experiences a high return during the lockup period but the selling should not be associated
with long-run return reversal post-expiration.
48
Reputation Establishment
The third hypothesis is directly related to the grandstanding hypothesis proposed by
Gompers (1996). He argues that the younger VCs who are more eager to establish their
reputation may bring firms public earlier and exit their investment more quickly. This implies a
relationship between the age of the VC and its selling decision at lockup expiration because this
is the first day when pre-IPO insiders are allowed to cash out. Specifically, a younger VC is
more likely to sell and less likely to buy when the lockup agreement expires. Such a quick exit
will enable it to establish its reputation quickly and to re-deploy its limited financial resources
into other projects. To some extent, this hypothesis is a modified version of grandstanding
hypothesis by Gompers (1996).
H3: A younger VC firm is more likely to sell and less likely to buy at the lockup expiration.
Information Asymmetry
Cumming and MacIntosh (2003) argue that the information asymmetry between VC
sellers and outside buyers is the main determinant to full versus partial exit at the IPO. Their
argument implies that in certain industries and firms that are characterized by more specialized
technology, and hence higher information asymmetry, it is less likely VCs will completely
unwind their investment (full exit) immediately after the IPO. At the same time, Leland and Pyle
(1977) argue that the investment by an insider may serve as a signal of firm quality when
information asymmetry exists. Their logic clearly implies a negative relation between the
information asymmetry and selling by venture capitalists. Therefore, the information asymmetry
hypothesis is:

49
H4: The more information asymmetry between the IPO issuers and market, the less likely VCs
will sell at lockup expiration.
4.3.2 Univariate Evidence
Based on the actions of the lead VCs at lockup expiration, the whole sample is
categorized into three sub-groups: “Buy or Hold”,24 “Sell Partially,” and “Exit Control.” Table
3.4 Panel A, shows the mean and median of key explanatory variables for each sub-sample based
on the actions of the lead VCs at lockup expiration. Pairwise comparisons and statistical test
results are presented in Panel B. First-day Return is calculated using the offer price and close
price of the first day, e.g. First-day Return = (First Close Price – Offer Price)/Offer Price. Age of
Lead VCs is the length of period, in months, from VC firm establishment to the IPO date. IPO
proceeds are the product of offering price and shares offered in the IPO. Firm age is calculated
using the founding dates of IPO firms provided by Jay Ritter. Underwriter reputation ranking
also comes from Jay Ritter’s website and has a scale of 0 to 9. The higher the ranking, the more
prestigious is the underwriter.
Across the sub-samples in the order of “Buy or Hold,” “Sell Partially,” and “Exit Control,”
all variables including first-day return, age of lead VCs, IPO proceeds, firm age and underwriter
reputation increase monotonically. In particular, the mean first-day return for “Buy or Hold” is
14% while the “Exit Control” group on average gives the investor a first day return of 79%. The
average first-day return of “Sell Partially” group is 58%. The pair-wise t-test and Wilcoxon test
show the mean and median first-day returns are significantly different between every possible
24 Due to the small number of observations in “Hold” and “Buy” group, we combine them into one single group. We generally interpret it as a non-sell group.

50
pair of sub-groups. This implies a strong impact of the IPO first-day return on the selling
decision of venture capitalists at lockup expiration.
The pattern of VC age is a little surprising. The reputation establishment hypothesis
implies a younger VC is more likely to sell because the quick exit helps to establish reputation
faster. The univariate analysis in Table 3.4 suggests the opposite occurs. The “Buy or Hold”
group corresponds to the youngest VCs. The mean and median age of the VC in that group is
159 months and 141 months, respectively. In comparison, the “Sell Partially” and “Exit Control”
groups have much older VC firm. The mean age of the lead VC in these groups is 206 months
and 218 months, respectively. The “Exit Control” group has the oldest VCs. The difference in
mean age and median age of lead VCs is significant between “Buy or Hold” and two sell groups
(i.e. “Sell Partially” and “Exit Control”). Within the sell groups, the age of the VC is not
significantly different.
Underwriter reputation also shows some potential in explaining the selling decision of
VCs on the unlock day. The average ranking of the underwriter in the “Buy or Hold” group is
7.86, which is significantly lower than both “Sell Partially” (8.26) and “Exit Control” (8.27). The
median ranking shows a similar pattern.
Based on the univariate analysis, it seems that the age of the IPO firm, the variable
measuring information asymmetry, does not have any explanatory power. Even though the mean
and median of firm age show the monotonic pattern across the sub-groups, none of pairwise
difference is significant. The results regarding IPO proceeds are weak as well. The mean value of
the IPO proceeds increases from $57.4 million in “Buy or Hold” to $80 million in “Exit Control,”
but the mean difference is only marginally significant between the “Buy or Hold” and sell groups.

51
The median IPO proceeds, however, are significantly different at the 10% level between “Buy or
Hold” and “Exit Control.”
The IPO industry may also have an impact on the selling decision of the lead VC. To
examine this possibility, the frequency and percentage of “Tech IPO”25 is measured in each sub-
group. Panel C reports the summary. The percentage of Tech IPOs increases monotonically from
the “Buy or Hold” group (52%) to the “Exit Control” group (72%). The Chi-square test shows
the difference in percentage of Tech IPOs is statistically different at 5% level among the groups.
Both the information trading and reputation maximization hypotheses involve the price
change and return pattern around lockup expiration.
Table 3.5 reports the weekly average and median price for the 16-week window around
lockup expiration (8 weeks before and 8 weeks after the expiration). There is no strong price run-
up before the expiration date. Instead, the weekly average and median prices are generally
declining throughout the whole window. This is consistent with Field and Hanka (2001), who
report the permanent share price drop at and after unlock date. In untabulated results, a 16-day
window around lock-up expiration is analyzed using daily prices—the results are very similar.
As the information trading hypothesis implies, there should be a temporary price run-up prior to
the lockup expiration and a price drop short-run afterwards if the lead VC times its selling at
lockup expiration. However, the weekly price pattern in Table 3.5 does not support this
implication. In all three sub-groups, the weekly price generally keeps declining.
After examining the raw price movement around lockup expiration, we now focus on the
“return” in Table 3.6. The table reports a Buy-and-Hold return (BHAR) using the NYSE/AMEX
25“Tech IPO” is defined as an IPO with SIC codes 3571, 3572, 3575, 3577, 3578 (computer hardware), 3661, 3663, 3669 (communications equipment), 3671, 3672, 3674, 3675, 3677, 3678, 3679 (electronics), 3812 (navigation equipment), 3823, 3825, 3826, 3827, 3829 (measuring and controlling devices), 3841, 3845 (medical instruments), 4812, 4813 (telephone equipment), 4899 (communications services), and 7371, 7372, 7373, 7374, 7375, 7378, and 7379 (software). This is the definition by Loughran and Ritter (2004).
52
Equally-weighted Index as the benchmark 26 for different periods 27 before and after lockup
expiration. Because most lockup periods are 6 months, I calculate BHAR up to 30 months after
unlock date. I define the “Lockup return” as the buy-and-hold return starting from the second day
after the IPO to lockup expiration. It monotonically increases from the “Buy or Hold” group (-
28.76%) to the “Exit Control” group (28.33%). Such relation generally remains until 12 months
post-expiration. Afterwards, the “Buy or Hold” group gradually catches up. From 24 months
after lockup expiration, “Exit Control” surrenders its leading position to the “Buy or Hold” group.
These dynamics are graphed in Figure 3.1 in order to give a clearer picture of return pattern.
The return around the lockup expiration is critical for testing information trading
hypothesis and reputation maximization hypothesis. The information trading hypothesis implies
a temporary price run-up (positive return) before and price drop (negative return) in the short-run
after the lockup expiration for the selling VC. For the venture capitalists who increase their
shareholding at lockup expiration, the information trading hypothesis implies a significant price
increase (positive return) after the unlock date. We use the ‘Lockup Return’ (BHAR from the
second day after the IPO to lockup expiration) to detect the pre-expiration price run-up. It is
important to note that the information trading hypothesis emphasizes the ability of venture
capitalists to exploit their insider information in the short-run around lockup expiration.
Therefore, we use the 6-month BHAR post-expiration (BHAR from lockup expiration to 6
months post-expiration) to detect the stock performance after unlock date.
The reputation maximization hypothesis similarly predicts that a higher return before
lockup expiration should be associated with a higher likelihood of VC selling on expiration date.
26 Other index returns were also used as benchmarks, such as the NYSE equally-weighted and value-weighted indexes and the NYSE/AMEX value-weighted index. Value-weighted BHAR is also calculated. All results are qualitatively similar to the reported table. 27 If any firm is delisted before the end of a certain period, I include its delisting return if available.
53
The difference is that such selling is conditional on a persistently good performance afterwards.
If return reversal is expected, VCs will be less likely to sell even facing a good prior return
because the short-sighted selling behavior may impact the success of future IPOs. We use the
first-day return and ‘Lockup Return’ to measure the prior return. We will use 30-month BHAR
after lockup expiration to detect the long-run return pattern post-expiration.
4.3.3 Regression
4.3.3.1 Model Specifications
To obtain more conclusive evidence, a multinomial logit regression is used to test the
proposed hypotheses and find the major determinants of VC selling at lockup expiration. The
whole sample is divided into three sub-groups based on the selling decisions of lead VCs (i.e.
Buy or Hold, Sell Partially, and Exit Control). We argue that “Sell Partially” simply reflects the
liquidity needs of venture capitalists and hence is not informative. In the multinomial logit
regression, the “Sell Partially” group is used as the reference. This is equivalent to assuming that
all lead VCs will sell partially at lockup expiration if no hypothesis is relevant. In other words,
the action of either “Buy or Hold” or “Exit Control” must imply something special which may
have been captured by one of the proposed hypotheses. The specifications of the multinomial
logit regression are as follows:
Regression 1:
Buy or Hold01 11 21 31
Sell Partially
( ) FirstDayReturn LockupReturn PostLockupReturn_LongLnπ
β β β βπ
= + × + × + ×
41 51 61 1PostLockupReturn_Short VCAge FirmAge OtherControlsβ β β β ε+ × + × + × + × +
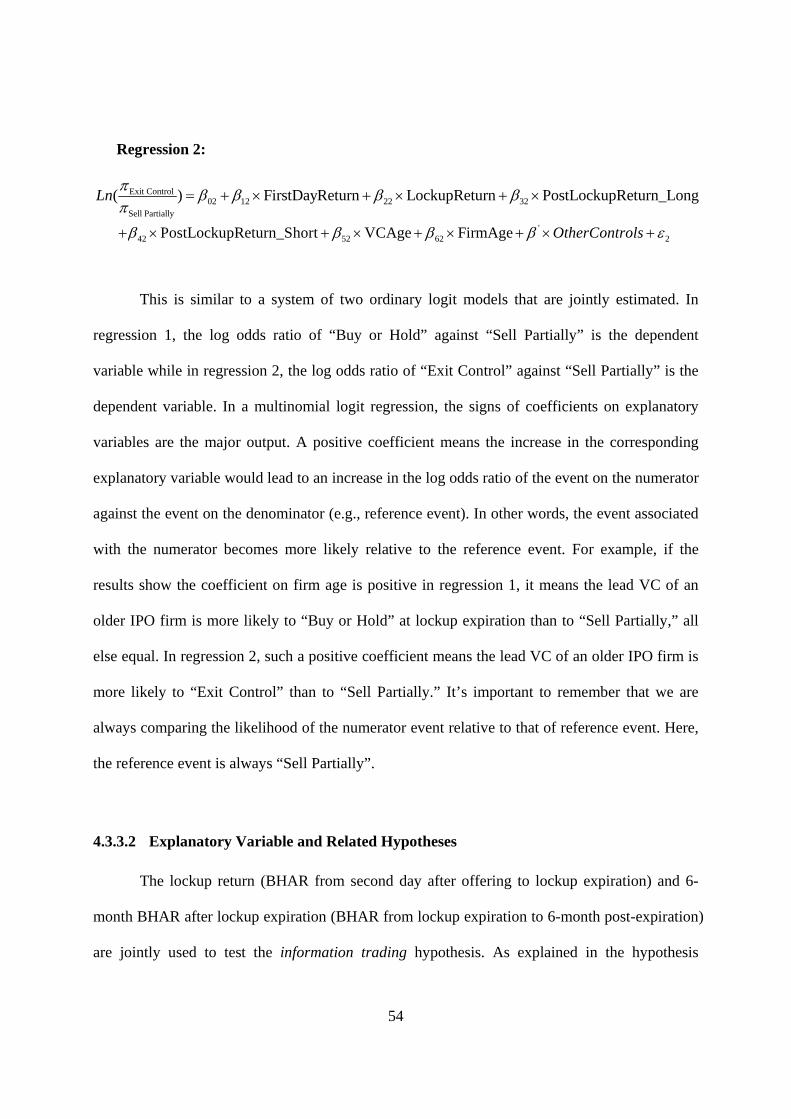
54
Regression 2:
Exit Control02 12 22 32
Sell Partially
( ) FirstDayReturn LockupReturn PostLockupReturn_LongLn π β β β βπ
= + × + × + ×
'
42 52 62 2PostLockupReturn_Short VCAge FirmAge OtherControlsβ β β β ε+ × + × + × + × +
This is similar to a system of two ordinary logit models that are jointly estimated. In
regression 1, the log odds ratio of “Buy or Hold” against “Sell Partially” is the dependent
variable while in regression 2, the log odds ratio of “Exit Control” against “Sell Partially” is the
dependent variable. In a multinomial logit regression, the signs of coefficients on explanatory
variables are the major output. A positive coefficient means the increase in the corresponding
explanatory variable would lead to an increase in the log odds ratio of the event on the numerator
against the event on the denominator (e.g., reference event). In other words, the event associated
with the numerator becomes more likely relative to the reference event. For example, if the
results show the coefficient on firm age is positive in regression 1, it means the lead VC of an
older IPO firm is more likely to “Buy or Hold” at lockup expiration than to “Sell Partially,” all
else equal. In regression 2, such a positive coefficient means the lead VC of an older IPO firm is
more likely to “Exit Control” than to “Sell Partially.” It’s important to remember that we are
always comparing the likelihood of the numerator event relative to that of reference event. Here,
the reference event is always “Sell Partially”.
4.3.3.2 Explanatory Variable and Related Hypotheses
The lockup return (BHAR from second day after offering to lockup expiration) and 6-
month BHAR after lockup expiration (BHAR from lockup expiration to 6-month post-expiration)
are jointly used to test the information trading hypothesis. As explained in the hypothesis

55
development, information trading hypothesis implies the temporary overpricing before the
lockup expiration and an immediate price drop after expiration for the selling VC. For the VCs
who buy on the unlock date, the information trading hypothesis implies a significant price run-
up after lockup expiration. We should therefore expect 41β to be positive in regression 1. The
information trading hypothesis also implies a positive 22β and negative 42β in regression 2.
The market performance before lockup expiration is also related with the reputation
maximization hypothesis. We will use the first-day return and lockup return to measure the pre-
expiration performance. If the reputation maximization hypothesis is valid, then we expect both
the first-day return and lockup return to positively affect the likelihood of selling and negatively
affect the likelihood of buying. In the multinomial logit framework, this means a higher first-day
return and lockup return predict a lower likelihood of “Buy or Hold” relative to “Sell Partially”
and a higher likelihood of “Exit Control” relative to “Sell Partially.” In terms of coefficients, this
implies a negative 11β and 21β in regression 1 while 12β and 22β should be both positive in
regression 2. On the other hand, the reputation maximization hypothesis implies that the selling
on the unlock day should not be associated with long-run return reversal after lockup expiration.
We use 30-month BHAR after lockup expiration (BHAR from lockup expiration to 30-month
post-expiration) to check this implication. If the reputation maximization hypothesis is right, then
32β should be non-negative.
The reputation establishment hypothesis states that younger VCs may bring ventures
public earlier and exit more quickly in order to establish their reputation faster. This clearly
implies that it is less likely for a younger venture capitalist to “Buy or Hold” at lockup expiration
and more likely to “Exit Control.” Therefore, we should expect a positive 51β in regression 1 but a
negative 52β in regression 2.
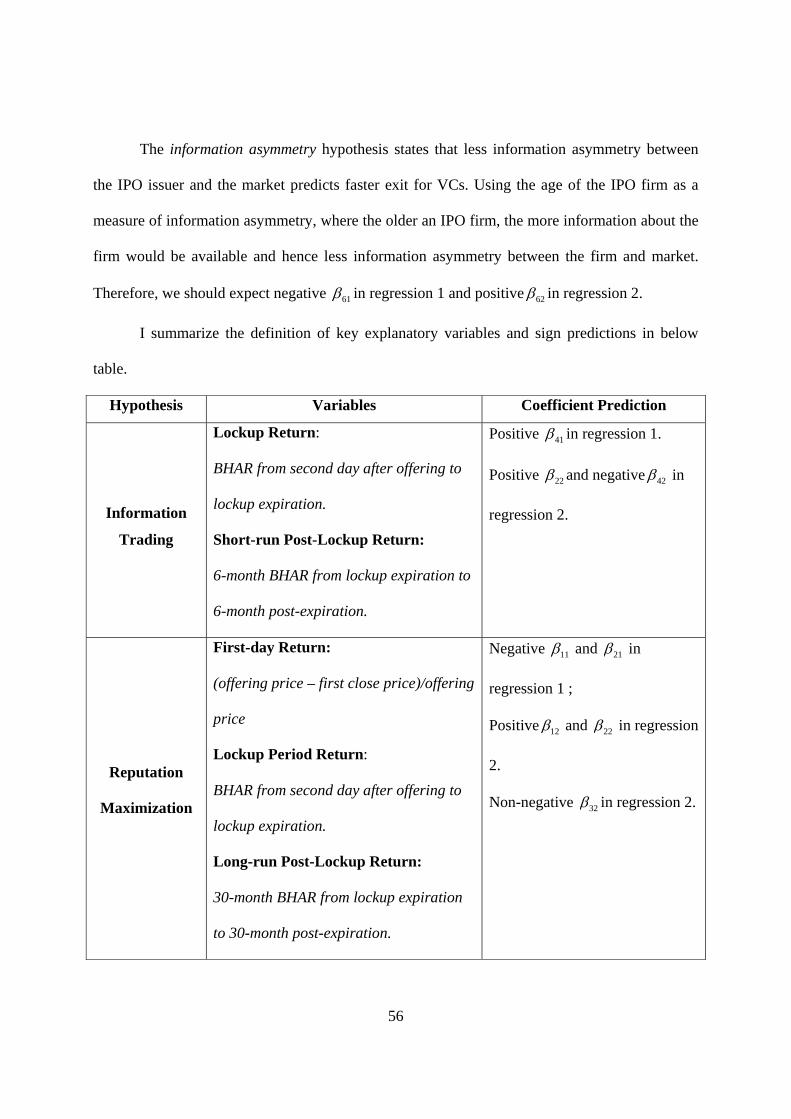
56
The information asymmetry hypothesis states that less information asymmetry between
the IPO issuer and the market predicts faster exit for VCs. Using the age of the IPO firm as a
measure of information asymmetry, where the older an IPO firm, the more information about the
firm would be available and hence less information asymmetry between the firm and market.
Therefore, we should expect negative 61β in regression 1 and positive 62β in regression 2.
I summarize the definition of key explanatory variables and sign predictions in below
table.
Hypothesis Variables Coefficient Prediction
Information
Trading
Lockup Return:
BHAR from second day after offering to
lockup expiration.
Short-run Post-Lockup Return:
6-month BHAR from lockup expiration to
6-month post-expiration.
Positive 41β in regression 1.
Positive 22β and negative 42β in
regression 2.
Reputation
Maximization
First-day Return:
(offering price – first close price)/offering
price
Lockup Period Return:
BHAR from second day after offering to
lockup expiration.
Long-run Post-Lockup Return:
30-month BHAR from lockup expiration
to 30-month post-expiration.
Negative 11β and 21β in
regression 1 ;
Positive 12β and 22β in regression
2.
Non-negative 32β in regression 2.

57
Reputation
Establishment
VCAge:
natural log of VC age in months.
Positive 51β in regression 1;
Negative 52β in regression 2.
Information
Asymmetry
FirmAge:
natural log of firm age in years.
Negative 61β in regression 1;
Positive 62β in regression 2.
In addition to above key explanatory variables, control variables for the underwriter
reputation ranking by Jay Ritter, a dummy indicating if an IPO is “Tech IPO” and the natural log
of IPO proceeds are included.
The regression is reported in Table 3.7. Regardless of specifications, the Lockup Return
is significantly positive (i.e. 22β >0) in regression 2. It means a higher return during the lockup
period will significantly improve the likelihood of “Exit Control”. However, Short-run Post-
lockup Return enters the regression 1 negatively (i.e. 41β <0) and enters regression 2 positively
(i.e. 42β >0) ,which is completely inconsistent with the implications of the information trading
hypothesis for the post-expiration stock performance. It seems that a higher likelihood of ‘VC
Buying’ at lockup expiration is not necessarily associated with a higher short-run return after
expiration. Similarly, a higher likelihood of “Exit Control” on the unlock day does not predict a
significant price drop post-expiration. This evidence suggests that the selling decisions of
venture capitalists at lockup expiration do not reflect the exploitation of short-run insider
information. Therefore, the information trading hypothesis is rejected.
All model specifications strongly support the reputation maximization hypothesis. The
first-day return after the IPO and the lock-up return are used to jointly measure the market
performance of the IPO firm before lockup expiration. Consistent with the implications of the
reputation maximization hypothesis, both the first-day return and lockup return enter regression

58
1 significantly negative. This means a higher first-day return or lockup return will decrease the
likelihood of “Buying or Hold” relative to “Sell Partially.” In other words, the likelihood of “Sell
Partially” is significantly increased when either the first-day return or lockup return is high.
Regression 2 further strengthens the support. First-day return and lockup return are both positive
and significant in this regression. This suggests that a higher return before the lockup expiration
will significantly increase the likelihood of “Exit Control” relative to “Sell Partially.” We
argued in the hypothesis development that if venture capitalists consider their selling behavior
with a long-run perspective, their selling should not be just exploiting temporary overpricing.
Facing a good prior return, VCs will not sell unless they expect a persistently good return in the
long run. This means a long-run return reversal after lockup expiration is not likely if venture
capitalists decide to sell. Consistent with this implication, the long-run post-lockup return enters
the regressions always positively in all model specifications of regression 2.
The reputation establishment hypothesis is rejected in all specifications. What is
interesting is that the predicted sign of the VCAge coefficient is opposite in the regression results.
Gompers (1996)’s grandstanding hypothesis says a younger venture capitalist is more likely to
exit quickly after the IPO. These results demonstrate a different story. In regression 1, the age of
the lead VC is always significantly negative. This simply means a younger VC is more likely to
“Buy or Hold” at lockup expiration than to “Sell Partially.” In regression 2, the age of the VC
enters positive, but insignificantly. If we just interpret the results based on the sign, this means a
younger VC is less likely to “Exit Control” than to “Sell Partially.” Though the result associated
with regression 2 is inconclusive due to the insignificant coefficient, the overall evidence
suggests a less likelihood for a younger VC to sell at lockup expiration. This is inconsistent with
the grandstanding hypothesis. A possible explanation is that a younger VC may be more
59
concerned with its reputation. When it sells heavily at the lockup expiration, a significant price
drop may be caused due to the increased supply of stocks. This may lead to a significant loss for
the investors who purchased the IPO shares before the lockup expiration. If these investors
observe the cause of their loss, it may affect the reputation of young venture capitalists. In
comparison, the older VCs who are supposed to have higher reputational capital may have less
such concern of the destructive effect of selling at lockup expiration. The grandstanding
hypothesis of Gompers (1996) may actually be more relevant for the post-expiration period.
The information asymmetry hypothesis also receives some support. This hypothesis states
that when information asymmetry is severe, it is less likely for the venture capitalists to leave
early. Assuming an older IPO firm is associated with less information asymmetry, this implies a
negative 61β in regression 1 and positive 62β in regression 2. Except for the insignificant
positive coefficient in regression 2 of the fourth model specification, all the other model
specifications with firm age support the hypothesis. The regression results tell us that (1) the lead
VC in an older IPO firm is less likely to “Buy or Hold” than to “Sell Partially” (regression 1); (2)
the lead VC in an older IPO firm is more likely to “Exit Control” than to “Sell Partially”
(regression 2). Therefore, the extent of information asymmetry between the IPO issuer and the
market is also a significant determinant to the selling decision of the lead venture capitalists at
lockup expiration.
In all model specifications, other variables control for the underwriter reputation, the
industry characteristic of IPO (tech IPO or not), and the size of IPO. However, almost none of
them enter any regression significantly.
In conclusion, the regression results show that the selling decision of the lead VC at
lockup expiration heavily depends upon how the newly public stock performs before lockup

60
expiration. The better the stock performs, the more likely a lead VC will sell its shareholding at
the lockup expiration. This is simply because a good achieved return may boost the reputation of
VC firms among their current investors. As further evidence shows, VCs only sell in the IPO
firms who have established a solid value foundation and show a persistent long-run performance.
This is strong evidence for the statement that venture capitalists are trying to maximize their
reputation not just at the moment but also in the long-run. As the repeated players in the IPO
market, VCs have to consider the impact of their current behavior on the future success.
In addition, a lead VC is more likely to sell its shareholding at lockup expiration when
the IPO firm has a longer history. This is because when an IPO firm has a longer history, less
information asymmetry exists between the firm and market. According to the model by Leland
and Pyle (1977), the venture capitalists, as pre-IPO insiders, do not have to hold the equity in
order to signal the quality. This implies a quick exit of lead VC.
To avoid the survival biases that may be created due to the delisting of some IPO firms,
similar multinomial logit regressions are run with the sub-sample including only IPOs that
survive 30 months post-expiration. The results are very similar and thus are not sensitive to the
delisting of IPO firms.
4.4 VC Selling After Lockup Expiration: A Duration Approach
Table 3.2 shows that 20.51% of the lead VCs give up their controlling stake at lockup
expiration, while the rest of them remain as principal shareholders in the IPO firms. It is
interesting to ask when these venture capitalists will eventually exit. This may provide a more
comprehensive picture of how venture capitalists manage their equity holding after the public

61
offering. Since the selling dates of VCs are not available, we take a ‘duration’ approach to attack
this problem.
The annual proxy statements are tracked from the IPO date for up to the fourth calendar
year after the IPO. Based on the collected ownership data, the “ownership duration” of each lead
VC as principal shareholder can be calculated. However, there are two problems that may
complicate the calculation. The first problem is caused by the delisting of some IPO firms within
4 years after IPO. This is because if a certain VC is still one of the principal shareholders when
the firm is delisted, it will be impossible to tell how long this venture capitalist would have
stayed if the delisting did not occur. Table 3.8 Panel A shows that among the 701 VC-backed
IPOs, 200 or 28.63% of the entire sample are delisted within 4 years after the IPO. Therefore, it
is a significant issue.
The reasons for delisting are summarized in Table 3.8 Panel B based on the CRSP
delisting code. 62% of the delisting happens as the consequence of merger & acquisition. It is
well known that merger & acquisition is another “exit” method that is often used by venture
capitalists. Existing evidence shows (Cumming and MacIntosh, 2003) that VCs will usually
surrender most of its shareholding in this process. Therefore, it seems reasonable to assume that
the lead VC will hold negligible shares when the firm is delisted due to mergers. A similar
argument can be made when the delisting is due to liquidation or exchanges. Admittedly the
assumption of negligible shareholding at delisting is not a very precise way to measure the VC
ownership because another 36.5% of delisting is due to other reasons not explained by CRSP.
Given the data limitation, we believe it is still the second-best way to assume zero shareholding
of venture capitalists if delisting occurs.

62
The second problem that may complicate the calculation of ownership duration is due to
the data collection. As introduced in the Data and Methodology, the proxy statements collected
were up to the fourth calendar year after the IPO. This implies that if a venture capitalist remains
as principal shareholder in the fourth proxy statement, it is unknown how much longer the VC
will hold its equity holding.
To overcome these problems, a variable is designed called the “Weighted Average
Duration” (WAD) to estimate the ownership duration.
4.4.1 Weighted Average Duration (WAD)
The “Weighted Average Duration” or WAD hereafter, is calculated as follows:
Proxy Dates and WAD
We have VC ownership data from VC0 to VC4 where VC0 is the ownership immediate
after IPO and VCi (i=1,2,3,4) is the ownership reported in the ith proxy statements since the IPO.
The interval (ti) between proxy statements can also be exactly calculated up to t4. The weighted
average duration is calculated as follows:
0 1 2 31 2
1 1 2 1 2 30 0 0
(VC VC ) (VC VC )(VC VC )WAD= ( ) ( )VC VC VC
t t t t t t− −−× + × + + × + +
3 41 2 3 4
0
(VC VC ) ( )VC
t t t t−+ × + + +

63
31 2 41 2 3 4 1 2 3 4
0 0 0 0
VCVC VC VC= ( )VC VC VC VC
t t t t t t t t+ × + × + × − × + + +
By weighting the time duration with the ownership change, WAD not only considers the
length of time when a VC remains as principal shareholder, but also the ownership variation
from year to year.
If the VC completely unwinds its shareholding by the fourth proxy statement (i.e.,
VC4=0), it simply collapses to:
31 2
1 2 3 40 0 0
VCVC VCWAD=VC VC VC
t t t t+ × + × + × .
If the VC exits earlier (e.g., by the third or second proxy statement), similar alterations can be
easily made.
However, if the VC remains as a principal shareholder by the fourth proxy statements,
some assumptions have to be made about the later ownership dynamics. A VC fund usually has a
lifetime of 10-12 years. We assume 10 years to be the limit, so the remaining VC by fourth proxy
statement who still retains some ownership has to completely unwind their equity position by the
10th proxy statements with equal annual selling. The interval between two proxy statements
beyond the fourth proxy statement is always assumed to be 12 months (i.e.,
t5=t6=t7=t8=t9=t10=12 months). This means that if a VC remains as a principal shareholder by
the fourth proxy statement, WAD will be calculated as follows:
3 5 61 2 41 2 3 4
0 0 0 0 0 0
7 8 9
0 0 0
VC VC VCVC VC VCWAD= + 12 12 12VC VC VC VC VC VC
VC VC VC 12 12 12VC VC VC
t t t t mos mos mos
mos mos mos
+ × + × + × × + × + ×
+ × + × + ×

64
5 4 6 4 7 4 8 4 9 45 4 3 2 1where VC VC ,VC VC , VC VC , VC VC , VC VC6 6 6 6 6
= = = = = ,
if VC 5%, i=5,6,7,8,9 then I set VC 0.i i< = This reflects the point that the fewer shares
retained by the date of fourth proxy statement, the shorter a lead VC will remain.
For the IPO firms that are delisted within the first four years, the lead VC is assumed to
surrender all of its shares at the time of delisting, regardless of the delisting reason. This
assumption is not very precise, but seems to be the best option given the data limitations. It
implies that if a proxy statement is missing after its third proxy statement, the lead VC is
assumed to exit immediate after the third proxy statement. In this case, WAD is calculated as
follows:
1 21 2 3
0 0
VC VCWAD=VC VC
t t t+ × + ×
To reduce the bias associated with this assumption, the regression is run without delisted
IPOs.
Table 3.9 reports the summary statistics for WAD. It is shown that the mean and median
WAD is 29.4 months and 20.9 moths respectively.
The percentage of the lead VCs whose WAD falls into the categories of ‘<12 months’,
‘12-36 months’ and ‘>36 months’ is shown. The summary results further strengthen the point
that VCs do not cash out quickly. In 57.6% of IPOs, their lead VC remains for 12-36 months. In
24.9% of the IPO sample, the WAD is larger than 36 months.

65
4.4.2 Determinants of WAD
4.4.2.1 Univariate Analysis
To explore the determinants of WAD, the whole sample is divided into three trintiles
based on the length of WAD. Table 3.10 Panel A, shows the mean and median of the key
explanatory variables for each trintile. They are (1) first-day return; (2) IPO proceeds; (3) firm
age; (4) age of the lead VC; and (5) underwriter reputation. A dummy variable indicating
whether the IPO is a Tech IPO is included.
The pairwise t-test and Wilcoxon statistic are also reported in Panel A. Except for the
first-day return, there is no strong pattern across the WAD trintiles. In particular, the first-day
return increases monotonically across the WAD trintiles from “Longest” to “Shortest.” The t-test
and Wilcoxon test show the mean and median first-day return is significantly different in all but
one pair (between “Shortest” vs. “Intermediate”). Panel B shows the percentage of Tech IPO in
each trintile is significantly different at the 5% level.
In addition to the explanatory variables that have been summarized in Table 3.10, we also
include the Lockup return, the BHAR from the second day after the IPO to the lockup expiration
date, and the PostLockup return, which is the BHAR from lockup expiration to the exit date28 of
the lead VCs. These variables can test the explanatory power of the prior return for the
ownership duration of venture capitalists.
The regression results are reported in Table 3.11. Notice that the three return measures
(i.e. First-day Return, Lockup Return, and PostLockup Return ) all enter the regression
significantly negative. This simply means that a better prior return may lead to faster “exit” or
28 The “exit” date is defined as the date of the last proxy statement with non-zero ownership. For example, if a lead VC has completely cashed out in the year 2000, the report date of the 1999 proxy statement is used as the “exit” date for this venture capitalist.

66
shorter duration of lead VCs. Both the selling decision at lockup expiration and afterwards are
significantly affected by the prior market performance of the IPO firms. In general, a better prior
return predicts a higher likelihood of selling on unlock day and faster selling after the lockup
expiration.
Based on the last model specification that includes all the variables, a 10% increase in the
First-day return, Lockup return and PostLockup return will lead to a WAD reduction of 6 days,
10.2 days, and 8 days, respectively. Relatively speaking, the return during the lockup period has
the largest impact on the ownership duration of the lead VCs.
The Tech IPO dummy is significantly negative in all model specifications. Assuming
everything else equal, a lead VC in a Tech IPO stays 3.188 months (i.e. a quarter), less than its
counterpart in a non-Tech IPO. Its marginal effect is huge compared to that of return-based
measures. This finding is possibly because the sample includes the “Internet Bubble” period
when many Tech IPOs went public. VCs tend to cash out quickly in order to re-deploy their
resources and take advantage of the “hot market”.
5 CONCLUSIONS
Venture Capitalists (VC) do not always cash out their investment immediately at an IPO
or even after the lockup period. There is significant variation in the selling decisions and timing
of venture capitalist exit after the IPO. To identify the determining factors of such variation, four
competing hypotheses are proposed to explain the selling decision of venture capitalists at
lockup expiration. The information trading hypothesis implies that VCs are more likely to sell at
the lockup expiration when the specific venture’s stock price temporarily runs up before the
expiration date and drops short-run afterwards. Contrarily, VCs are more likely to buy when they

67
predict an immediate price run-up after lockup expiration. The reputation maximization
hypothesis suggests that VCs are more likely to sell at lockup expiration when the IPO firm
experiences a better return before lockup expiration. It also implies that VCs sell only in the IPO
firms who have established solid foundation and who are less likely to show return reversal
afterwards. The reputation establishment hypothesis predicts a younger VC firm is more likely to
sell at lockup expiration. Finally, the information asymmetry hypothesis implies the more
information asymmetry that exists between the IPO issuers and outside buyers, the less likely
VCs will sell at lock-up expiration.
The empirical evidence from the multinomial logit regression shows strong support for
the reputation maximization hypothesis and marginal support for the information asymmetry
hypothesis. Specifically, better first-day returns and lockup returns predict a lower likelihood of
buying and a higher likelihood of selling at lockup expiration. At the same time, the selling of
VCs at lockup expiration is not associated with firm underperformance afterwards. The
information asymmetry hypothesis is also marginally supported by the empirical results.
Consistent with the model implications of Leland and Pyle (1977), this paper finds that less
information asymmetry between the IPO issuer and market may lead to quick exit of venture
capitalists, one of the pre-IPO insiders. When the IPO firm is older, it is less necessary for VCs
to hold their equity long after the IPO in order to signal firm quality.
Venture capitalists frequently remain as a principal shareholder long after lockup
expiration. In only 17.5% of sample IPOs, the lead VCs completely unwind their shareholding
within 12 months after the IPO. The venture capitalists in the rest of the VC-backed IPOs hold
their equity for more than 1 year. The OLS regression reports similar determining factors to the
above variation in ownership duration of venture capitalists. The accumulated return before the

68
final exit significantly determines the length of ownership duration. In addition, the lead venture
capitalists in Tech IPOs have a much shorter “stay” than those in non-Tech IPOs.

69
REFERENCES
Baker, M., & Gompers, P. A. (2003). The Determinants of Board Structure at the Initial Public
Offering. Journal of Law and Economics, 46, 569 597.‐
Balvers, R. J.,McDonald B. & Miller, R. E. (1988). Underpricing of New Issues and the Choice
of Auditor as a Signal of Investment Banker Reputation, The Accounting Review, 63(4),
605-622.
Barry, C. B., Muscarella, C. J., Peavy III, J. W., & Vetsuypens, M. R. (1990). The Role of
Venture Capital in the Creation of Public Companies: Evidence from the Going-public
Process, Journal of Financial Economics , 27(2), 447-471.
Beatty, R. P. (1989). Auditor Reputation and the Pricing of Initial Public Offerings, The
Accounting Review, 64(4), 693-709.
Beatty, R. P. & Ritter, J. (1986). Investment banking, Reputation, and the Underpricing of Initial
Public Offerings, Journal of Financial Economics, 15(1), 213-232.
Bradley, D. J., Jordan, B. D., Yi, Ha-Chin & Roten, I. C. (2001). Venture Capital and IPO
Lockup Expiration: An Empirical Analysis. Journal of Financial Research, 24(4), 465-492.
Brav, A. & Gompers, P. A. (1997). Myth or Reality? The Long-Run Underperformance of Initial
Public Offerings: Evidence from Venture and Nonventure Capital-Backed Companies,
Journal of Finance, 52(5), 1791-1821.
Brav, A. & Gompers, P. A. (2003). The Role of Lockups in Initial Public Offerings, Review of
Financial Studies, 16(1), 1-29.
Carter, R. B., Dark, F. H. & Singh, A. K.,(1998).Underwriter Reputation, Initial Returns, and the
Long-Run Performance of IPO Stocks, Journal of Finance, 53(1),285-311.

70
Carter, R. & Manaster, S. (1990). Initial Public Offerings and Underwriter Reputation. Journal
of Finance,45(4), 1045-1067
Caves, R. E., & Porter, M. E. (1977). From Entry Barriers to Mobility Barriers. Quarterly
Journal Economics, 91, 421-434.
Chaney, P. K. & Philipich, K. L. (2002). Shredded Reputation: The Cost of Audit Failure,
Journal of Accounting Research, 40(4), 1221-1245.
Chemmanur, T. J. & Fulghieri, P. (1994). Investment Bank Reputation, Information Production,
and Financial Intermediation, Journal of Finance, 49(1), 57-79.
Chemmanur, T. J. & Loutskina, E. (2006). The Role of Venture Capital Backing in Initial Public
Offerings: Certification, Screening, or Market Power?, SSRN Working Paper.
Cumming, D. J., & MacIntosh, J. G. (2003). A Cross-country Comparison of Full and
Partial Venture Capital Exits. Journal of Banking & Finance, 27, 511-548.
Fama, E. F. & French, K. R. (1992). The Cross-Section of Expected Stock Returns. The Journal
of Finance, 47(2), 427-465.
Field, L. C. & Hanka, G. (2001). The Expiration of IPO Share Lockups. Journal of Finance ,
56(2), 471-500.
Fombrun, C. & Shanley, M. (1990). What's in a Name? Reputation Building and Corporate
Strategy, The Academy of Management Journal,33(2),233-258.
Gompers, P. A. (1995). Optimal Investment, Monitoring, and the Staging of Venture Capital.
Journal of Finance, 50, 1461 1489.‐
Gompers, P. (1996). Grandstanding in the Venture Capital Industry, Journal of Financial
Economics, 43, 133-156.

71
Gompers, P., & Lerner, J. (1998). Venture Capital Distributions: Short run and Long run ‐ ‐
Reactions. Journal of Finance, 53, 2161 2183.‐
Hanley, K. W. (1993). Tbe Underpricing of Initial Public Offerings and the Partial Adjustment
Phenomena, Journal of Financial Economics, 34, 177-197.
Hellmann, T., & Puri, M. (2002). Venture Capital and the Professionalization of Start up Firms: ‐
Empirical Evidence. Journal of Finance, 57, 169 197.‐
Hochberg, Y. V. (2004). Venture Capital and Corporate Governance in the Newly Public Firm.
AFA 2004 San Diego Meetings Paper.
Hochberg, Y., Ljunqvist, A. & Lu, Y. (2007). Venture Capital Networks and Investment
Performance, Journal of Finance, 62,251-301.
Hogan, C. E. (1997). Costs and Benefits of Audit Quality in the IPO Market: A Self-Selection
Analysis,. The Accounting Review, 72(1), 67-86.
Hörner, J. (2002). Reputation and Competition. The American Economic Review, 92(3), 644-663.
Hsu, D. H. (2004). What Do Entrepreneurs Pay for Venture Capital Affiliation? Journal of
Finance, 59(4), 1805-1844.
Krishnan, C. N. V. , Ivanov, V. I., Masulis, R. W., & Singh, A. K. (2010). Venture Capital
Reputation,Post-IPO Performance and Corporate Governance, Journal of Financial and
Quantitative Analysis, Forthcoming
Jaffe, J. (1974). Special Information and Insider Trading. Journal of Business, 47, 410–428.
Jain, B. A., & Kini, O. (1994). The Post Issue Operating Performance of IPO Firms. ‐ Journal of
Finance, 49(5), 1699 1726.‐
Johnson, J. M.& Miller, R. E. (1988). Investment Banker Prestige and the Underpricing of Initial
Public Offerings, Financial Management, 17(2), 19-29.

72
Kim, K. A., Kitsabunnarat, P., & Nofsinger, J. R. (2004). Ownership and Operating Performance
in an Emerging Market: Evidence from Thai IPO Firms. Journal of Corporate Finance, 10,
355– 381.
Lee, P. M. & Wahal, S. (2004). Grandstanding, Certification and the Underpricing of Venture
Capital Backed IPOs, Journal of Financial Economics, 73, 375–407.
Leland H.E. & Pyle, D.H. (1977). Information Asymmetries, Financial Structure and Financial
Intermediation. Journal of Finance , 32,371-387.
Lerner, J. (1995). Venture Capitalists and the Oversight of Private Firms. Journal of
Finance,50,301 318.‐
Lin, T. H., & Smith, R. L. (1998). Insider Reputation and Selling Decisions: the Unwinding of
Venture Capital Investments during Equity IPOs. Journal of Corporate Finance, 4, 241–
263.
Lindsey, L. (2008). Blurring Firm Boundaries: The Role of Venture Capital in Strategic
Alliances. Journal of Finance ,63, 1137 1168.‐
Logue, D. E., Rogalski, R. J. , Seward, J.K. & Johnson, L. F. (2002). What Is Special about the
Roles of Underwriter Reputation and Market Activities in Initial Public Offerings?, Journal
of Business, 75(2),213-243.
Loughran,T. & Ritter, J. (2004). Why Has IPO Underpricing Changed Over Time?, Financial
Management, Autumn, 5 – 37.
Megginson, W. L., & Weiss, K. A. (1991). Venture Capitalist Certification in Initial Public
Offerings, Journal of Finance , 46 (3), 879-903.
Mikkelson, W. H., Partch, M. M., & Shah, K. (1997). Ownership and Operating Performance of
Companies that Go Public. Journal of Financial Economics, 44, 281 307.‐
73
Miller, E. M. (1977). Risk, Uncertainty, and Divergence of Opinion, Journal of Finance, 32,
1151-1168.
Ofek, E., & Richardson, M. (2000). The IPO Lock-up Period: Implications for Market Efficiency
and Downward Sloping Demand Curves. NYU working paper, New York University.
Ofek, E., & Richardson, M. (2003). DotCom Mania: The Rise and Fall of Internet Stock Prices.
Journal of Finance, 58, 1113-1137.
Ritter, J. (1984). The ‘Hot’ Issue Market of 1980, Journal of Business, 57,215-241.
Seyhun, H. N. (1986). Insiders’ Profits, Costs of Trading, and Market Efficiency. Journal of
Financial Economics ,16, 189–212.
Seyhun, H. N. & Bradley, M. (1997). Corporate Bankruptcy and Insider Trading, Journal of
Business,70, 189-216.
Sorensen, M. (2007). How Smart Is Smart Money? A Two-Sided Matching Model of Venture
Capital, Journal of Finance , 62(6), 2725 – 2762.
Spence, A. M. (1974). Market Signaling: Informational Transfer in Hiring and Related Screening
Processes. Cambridge, Mass.: Harvard University Press.
Tversky, A., & Kahneman, D. (1974). Judgment under Uncertainty: Heuristics and Biases.
Science, 185, 1125-1131.
Wang, C. (2005). Ownership and Operating Performance of Chinese IPOs. Journal of Banking &
Finance, 29, 1835–1856.
Wilson, R. (1985). Reputations in Games and Markets. In A. E. Roth (Ed.), Game-theoretic
models of bargaining: 65-84. New York: Cambridge University Press.
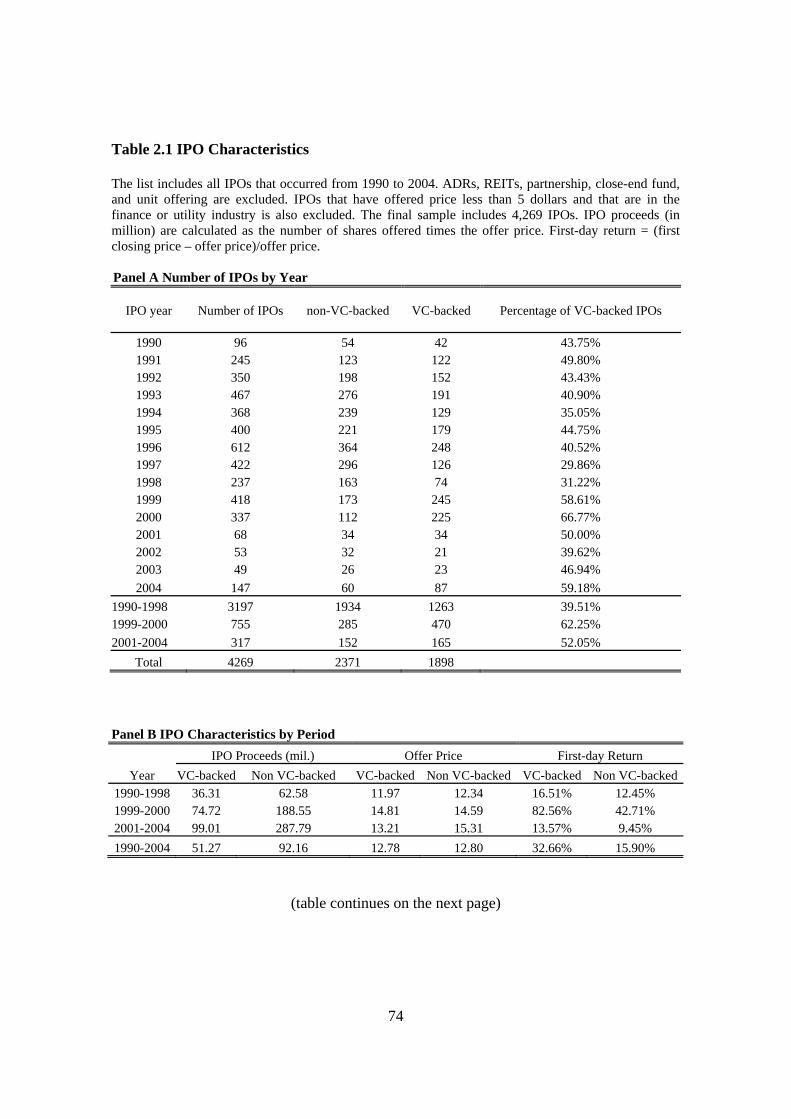
74
Table 2.1 IPO Characteristics
The list includes all IPOs that occurred from 1990 to 2004. ADRs, REITs, partnership, close-end fund, and unit offering are excluded. IPOs that have offered price less than 5 dollars and that are in the finance or utility industry is also excluded. The final sample includes 4,269 IPOs. IPO proceeds (in million) are calculated as the number of shares offered times the offer price. First-day return = (first closing price – offer price)/offer price.
Panel A Number of IPOs by Year
IPO year Number of IPOs non-VC-backed VC-backed Percentage of VC-backed IPOs
1990 96 54 42 43.75% 1991 245 123 122 49.80% 1992 350 198 152 43.43% 1993 467 276 191 40.90% 1994 368 239 129 35.05% 1995 400 221 179 44.75% 1996 612 364 248 40.52% 1997 422 296 126 29.86% 1998 237 163 74 31.22% 1999 418 173 245 58.61% 2000 337 112 225 66.77% 2001 68 34 34 50.00% 2002 53 32 21 39.62% 2003 49 26 23 46.94% 2004 147 60 87 59.18%
1990-1998 3197 1934 1263 39.51% 1999-2000 755 285 470 62.25% 2001-2004 317 152 165 52.05%
Total 4269 2371 1898
Panel B IPO Characteristics by Period IPO Proceeds (mil.) Offer Price First-day Return
Year VC-backed Non VC-backed VC-backed Non VC-backed VC-backed Non VC-backed1990-1998 36.31 62.58 11.97 12.34 16.51% 12.45% 1999-2000 74.72 188.55 14.81 14.59 82.56% 42.71% 2001-2004 99.01 287.79 13.21 15.31 13.57% 9.45% 1990-2004 51.27 92.16 12.78 12.80 32.66% 15.90%
(table continues on the next page)

75
Panel C Survival Rate of IPO Firms Survival Period After IPO Frequency Percent
<= 12 months 50 1.17% 12~24 months 365 8.55% 24~36 months 453 10.61% > 36 months 3401 79.67%
4269 100.00%

76
Table 2.2 Post-IPO BHAR by VC-backing and Period First-day return = (first closing price – offer price)/offer price. Market adjusted return = raw return – NYSE/AMEX/NASDAQ equally-weighted Index Return; Style adjusted return = raw returns – equally-weighted matched size/bm portfolio returns. The Buy-and-hold return is calculated as
[1 ] 1ii
BHAR R⎧ ⎫= + −⎨ ⎬⎩ ⎭∏ . The size and book-to-market benchmark portfolio is constructed similarly to Brav and Gompers (1997). At the end of every June,
the size and book-to-market break points of NYSE stock universe is obtained to divide the NYSE/AMEX/NASDAQ stock universe into 5 size quintiles and 5 book-to-market quintiles whose intersections are the 25 size and book-to-market portfolios. Each size and book-to-market portfolio is purged of firms that have undertaken IPO or seasoned equity offering (SEO) within 5 years. The 25 size and book-to-market portfolios are reformed every June. Each sample IPO is matched with one corresponding portfolio based on their size and book-to-market ratio at the end of every June. The size used at the end of June is the market capitalization at the end of June in year t. For the book-to-market ratio, the book value of equity is equal to the sum of book value of common equity and balance sheet deferred taxes and investment tax credits of fiscal year that ended in year t-1. The market value of equity uses the stock price and shares outstanding in December of year t-1. The matching between each IPO and size and book-to-market portfolio remain from July of year t until June of year t+1. At the end of June in year t+1, the matching is repeated using the same procedure. If any IPO firm is delisted, I use its delisting return, if available, as the return for delisting month.
Number First-Day Return
Average 12-month Buy-and-hold Return Average 36-month Buy-and-hold Return of IPOs Raw Market Adjusted Style Adjusted Raw Market Adjusted Style Adjusted
1990-1998 VC-backed 1263 16.51% 17.37% 1.79% 12.23% 61.23% 10.81% 38.46% NonVC-backed 1934 12.45% 10.27% -3.25% 5.27% 28.89% -20.57% -0.99% All 3197 14.05% 13.07% -1.26% 8.02% 41.67% -8.18% 14.59%
1999-2000 VC-backed 470 82.56% -14.93% -25.91% -21.65% -65.69% -80.22% -70.66% NonVC-backed 285 42.71% -5.37% -18.96% -22.09% -46.69% -64.24% -63.34% All 755 67.52% -11.32% -23.30% -21.82% -58.52% -74.20% -67.90%
2001-2004 VC-backed 165 13.57% -0.80% -13.09% -6.98% 25.98% -36.33% -21.10% NonVC-backed 152 9.45% 13.90% 3.19% 6.30% 66.41% 3.00% 20.62%
All 317 11.59% 6.25% -5.29% -0.62% 45.37% -17.47% -1.09%

77
Table 2.3 Proxy Definition
Proxy Variable Definition ‘IPO’ =1 if a VC firm was backing any IPO
in the recent sorting period. =0 otherwise.
‘BIGIPO’ =1 if a VC firm was backing any big IPO in the recent sorting period. =0 otherwise. The big IPOs are defined as the ones with highest 20% proceeds among the IPOs that occurred in the recent sorting period.
‘EVERYYEAR’ =1 if a VC firm was backing at least one IPO every year during the recent sorting period (3 years). =0 otherwise.
‘BIGIPONUM’ The number of big IPOs that were backed by a VC firm in the recent sorting period. The definition of big IPOs is the same as in ‘BIGIPO’.
‘IPONUM’ The number of IPOs that were backed by a VC firm in the recent sorting period.
Table 2.4 Sorting and testing periods matched
Sorting period Time interval Testing period Time interval 1 1990-1992 1 1993-1994 2 1992-1994 2 1995-1996 3 1994-1996 3 1997-1998 4 1996-1998 4 1999-2000 5 1998-2000 5 2001-2002 6 2000-2002 6 2003-2004

78
Table 2.5 Summary Sorting and Testing Period Every three-year period is defined as one sorting period during which the reputation measures are calculated. The following two-year period will serve as one testing period in which the new IPOs backed by the same VCs are matched with their reputation that was created in the previous sorting period. 6 sorting periods with one year overlap is created. Correspondingly, there are 6 testing periods, each of which is matched with the previous sorting period. The testing periods do not have any overlapping years.
Panel A Sorting Period Summary Percentage of Avg. Number of IPOs Max. Number of IPO Sorting Period Time interval Number of IPOs VC-backed IPOs Number of VCs per VC per VC
1 1990-1992 691 45.73% 426 2.58 19 2 1992-1994 1185 39.83% 512 2.70 26 3 1994-1996 1380 40.29% 557 2.95 34 4 1996-1998 1271 35.25% 500 2.57 35 5 1998-2000 992 54.84% 526 2.84 26 6 2000-2002 458 61.14% 367 2.06 14
Panel B Testing Period Summary
Percentage of VCs Who Backed IPO
Test Time interval Number of IPOs VC-backing% Number of VCs in Sorting Period AVGIPONUM29Max.
AVGIPONUM 1 1993-1994 835 38.32% 419 55.85% 3.91 18 2 1995-1996 1012 42.19% 487 52.57% 5.66 21 3 1997-1998 659 30.35% 300 62.67% 7.14 34 4 1999-2000 755 62.25% 474 43.88% 4.79 35 5 2001-2002 121 45.45% 95 62.11% 5.66 22 6 2003-2004 196 56.12% 226 55.31% 2.47 10
29For a VC firm who is now backing an IPO in the testing period, I obtain the total number of previous IPOs backed by this VC in the sorting period. AVGIPONUM is the average of such total number across all VCs who are backing the same IPO in the testing period.

79
Table 2.6 IPONUM Univariate Analysis For each VC who is now backing an IPO in the testing period, I obtain the total number of previous IPOs backed by this VC in the sorting period. AVGIPONUM is the average of such total number across all VCs who are backing one IPO (See Figure 2 for illustration). AVGIPONUM = 0 to 3 is defined as a range for low reputation, 3-10 as medium reputation and above 10 as high reputation. The equally-weighted book-to-market portfolio is used as a benchmark. For each portfolio, the nonVC-backed IPOs, AVGIPONUM High, AVGIPONUM Medium and AVGIPONUM Low, the mean and median of returns are reported. Panel B reports the t-test for difference in mean return and Wilcoxon test for difference in median return. The t-test and Wilcoxon test are reported with asterisk indicating level of significance. If any firm is delisted, I use its delisting return, if available, as the return for the delisting month. Panel A Univariate Analysis First Day Return (%) 1-Year BHAR (%) 2-Year BHAR (%) 3-Year BHAR (%)
Venture_Backed AVGIPONUM N Mean Median Mean Median Mean Median Mean MedianNo . 1996 16.80% 8.05% -0.26% -9.86% -6.89% -30.92% -16.73% -53.66%Yes 0~3 (Low) 620 28.41% 11.94% -8.91% -22.70% -18.32% -48.69% -30.24% -63.81%Yes 3~10 (Medium) 594 35.37% 18.04% -4.91% -23.74% -4.76% -37.86% -9.86% -56.56%Yes >10 (High) 202 37.62% 20.83% 5.86% -15.26% 2.11% -49.73% -7.12% -58.99%
Panel B Test of Return Differences First Day Return 1-Year BHAR (%) 2-Year BHAR (%) 3-Year BHAR (%) Comparison Group t-Statistic Wilcoxon Test t-Statistic Wilcoxon Test t-Statistic Wilcoxon Test t-Statistic Wilcoxon TestNonVC-backing vs. Low 5.84*** 4.55*** -2.74*** -4.1*** -2.43** -4.16*** -2.5** -2.11** NonVC-backing vs. High 5.6*** 6.8*** 0.96 -0.73 0.99 -0.65 0.87 0.66 Low vs. High -2.25** 3.24*** -2.17** 1.45* -2.08** 1.67* -1.99** 1.21 *** 1% significant **5% significant *10% significant

80
Table 2.7 Factor Loadings and Reputation Index For each sorting period, I extract the first principal component of five proposed proxy (IPONUM, BIGIPONUM, EVERYYEAR, BIGIPO and IPO)30 for VC reputation and use this principal component as the measure of VC reputation. I call this component ‘Reputation Index’ hereafter. For example, the first row shows that the reputation index in the first sorting period is a linear combination of standardized proxy variable as follows: 1Reputation Index 0.2753 IPONUM 0.2693 BIGIPONUM 0.2644 BIGIPO= × + × + × 0.2217 EVERYYEAR 0.1981 IPO+ × + × , where IPONUM, BIGIPONUM, BIGIPO, EVERYYEAR and IPO are all standardized by their mean and standard deviation. Panel A Factor Loadings Factor Loading Sorting Period IPONUM BIGIPONUM BIGIPO EVERYYEAR IPO %Variation Explained
1 0.2753 0.2693 0.2644 0.2217 0.1981 65.23% 2 0.2797 0.275 0.264 0.2384 0.1992 62.48% 3 0.2987 0.2946 0.2708 0.2391 0.2044 57.42% 4 0.2982 0.2954 0.2812 0.2255 0.218 56.56% 5 0.2807 0.2766 0.2562 0.2338 0.1865 64.43% 6 0.2878 0.306 0.2958 0.173 0.2384 57.03%
Avg. Loadings 0.2867 0.2862 0.2721 0.2219 0.2074 Panel B Reputation Index Summary
Variable Mean Std. Dev. Min 1st Quartile (25%) Median 3rd quartile
(75%) Max
Reputation Index 1.39 1.58 -0.54 0.09 1.12 2.25 8.08
30 Table 3 gives the definition of these variables.

81
Table 2.8 Reputation Index Univariate Analysis Reputation index (RI) is the first principal component of five proxy variables that can capture the recent economic performance and visibility of a VC firm. It’s a linear combinations of standardized value of proxy variables. The coefficient (factor loadings) on each proxy variable is provided in Table 9. The range of less than zero is defined as the ‘Low’ group of VC reputation, the range of 0~3 is defined as the medium group while the range of higher than 3 is defined as ‘High’ reputation group. For each subgroup including nonVC-backed IPOs, RI High, RI Medium and RI Low, the mean and median of returns are reported. The equally-weighted book-to-market portfolio is used as benchmark. Panel B tests the differences of mean and median returns for different group-pair. The t-statistic and Wilcoxon test are reported with asterisk indicating significance level. Panel A Univariate Analysis First Day Return (%) 1-Year BHAR (%) 2-Year BHAR(%) 3-Year BHAR (%)
Venture_Backed Reputation Index N Mean Median Mean Median Mean Median Mean Median No . 1996 16.80% 8.05% -0.26% -9.86% -6.89% -30.92% -16.73% -53.66%Yes <0 (Low) 313 28.43% 11.61% -12.09% -25.74% -23.26% -57.24% -41.91% -70.95% Yes 0~3 (Medium) 896 34.25% 16.67% -5.83% -23.30% -10.38% -41.57% -15.45% -58.39% Yes >3 (High) 207 32.05% 17.97% 8.35% -8.39% 13.78% -25.80% 4.53% -44.74%
Panel B Test for Return Difference First Day Return 1-Year BHAR (%) 2-Year BHAR (%) 3-Year BHAR (%) Comparison Group t-Statistic Wilcoxon Test t-Statistic Wilcoxon Test t-Statistic Wilcoxon Test t-Statistic Wilcoxon TestNonVC-backing vs. Low -4.36*** 3.8*** 2.76*** -4.26*** 2.41** -4.6*** 3.88*** -3.43*** NonVC-backing vs. High -4.22*** 5.58*** -1.78* 0.69 -2.18** 1.07 -1.87* 1.27 Low vs. High -0.86 1.56* -2.97*** 3.14*** -3.3*** 3.71*** -3.73*** 3.3*** *** 1% significant **5% significant *10% significant

82
Table 2.9 Regression of One-year BHAR
The dependent variable is 1-Year BHAR (BHAR1YR), Winsorized at 0.5% and 99.5%.The sample includes both venture-backed and non-venture-backed IPOs during 1993 -2004 period. The main explanatory variables are Reputation Index (RI) and other existing VC reputation measures such as VC age (LNAVGVCAGE), total number of portfolio companies invested (LNAVGCOSNUM), total number of investment rounds participated (LNAVGRNDNUM), total known amount of investment (LNAVGTOTINVT) and total amount of capital under management (LNAVGTOTCAP). Natural log of these reputation measures are used in the regression. Other control variables include IPOsize: the natural log of IPO gross proceeds (IPOsize) deflated to 1993 dollar using CPI index from Bureau of Labor Statistics. FIRMAGE: the firm age since found date provided by Jay Ritter. The natural log of one plus real firm age is used. STDRET1YR: the standard deviation of raw daily stock returns of IPO stock starting from 6th trading day for 255 trading days in percentage. SECOND: the fraction of total offering represented by pre-IPO shareholders (secondary stock offered) in percentage. P90s: a dummy equal to one if issue happened before the year of 1999. It is equal to zero otherwise. T-statistics are reported in parentheses.
1 2 3 4 5 6 7 Intercept 0.6796*** 0.6839*** 0.6834*** 0.6762*** 0.6844*** 0.671*** 0.6732***
(7.6553) (7.6574) (7.6532) (7.5469) (7.6593) (7.4741) 97.5025)VC 0.0404 0.0215 0.0333 -0.0274 -0.0211 -0.0845 0.1388
(1.371) (0.1617) (0.2548) (-0.2083) (-0.0923) (-0.3171) (0.4827)VC*RI 0.0305*** 0.0323** 0.0336** 0.0287** 0.0322** 0.0346**
(2.7175) (1.977) (2.1382) (1.9759) (2.0795) (2.0546)VC*lnavgcosnu 0.0077 0.0427 -0.0107
(0.2816) (0.4217) (-0.1021)VC*lnavgrndnu 0.0038 -0.0185 0.0011
(0.1646) (-0.22440 (0.0128)VC*lnavgtotca 0.0153 0.0258 0.028
(1.0848) (1.1528) (1.2504)VC*lnavgtotin 0.0056 -0.0103 -0.0169
(0.3324) (-0.0307) (-0.4987)VC*lnavgvcage -0.007 -0.006 -0.0145 -0.0056 0.0078 -0.0088
(-0.1879) (-0.1596) (-0.3757) (-0.1537) (0.1975) (-0.2183)firmage -0.022* -0.0206 -0.0207 -0.0199 -0.0206 -0.0206 -0.0204
(-1.6806) (-1.5683) (-1.5719) (-1.5095) (-1.5677) (-1.5581) (-1.5434)p90s 0.0431 0.0425 0.0426 0.043 0.0431 0.0472 0.0432
(1.3448) (1.3193) (1.3205) (1.3258) (1.3346) (1.4551) (1.3289)second 0.001 0.001 0.001 0.0011 0.001 0.0011 0.0011
(1.3467) (1.3333) (1.3332) (1.458) (1.3429) (1.4957) (1.4242)IPOsize -0.0573*** -0.0578*** -0.0577*** -0.0581*** -0.0582*** -0.0574*** -0.0572***
(-3.9274) (-3.94) (-3.934) (-3.9417) (-3.9422) (-3.8695) (-3.8553)stdret1yr -0.103*** -0.104*** -0.104*** -0.1028*** -0.104*** -0.1026*** -0.1026***
(-16.3367) (-16.3552) (-16.3397) (-16.1168) (-16.3729) (-16.0113) (-16.0153)R-Square 0.1191 0.1211 0.1211 0.1187 0.1211 0.1176 0.1189 N 3081 3049 3049 3017 3049 3017 3017
***1% significant **5% significant *10% significant

83
Table 2.10 Regression of Two-year BHAR
The dependent variable is 2-Year BHAR (BHAR2YR), winsorized at 0.5% and 99.5%.The sample includes both venture-backed and non-venture-backed IPOs during 1993 -2004 period. The main explanatory variables are Reputation Index (RI) and other existing VC reputation measures such as VC age (LNAVGVCAGE), total number of portfolio companies invested (LNAVGCOSNUM), total number of investment rounds participated (LNAVGRNDNUM), total known amount of investment (LNAVGTOTINVT) and total amount of capital under management (LNAVGTOTCAP). Natural log of these reputation measures are used in the regression. Other control variables include IPOsize: the natural log of IPO gross proceeds (IPOsize) deflated to 1993 dollar using CPI index from Bureau of Labor Statistics. FIRMAGE: the firm age since found date provided by Jay Ritter. The natural log of one plus real firm age is used. STDRET1YR: the standard deviation of raw daily stock returns of IPO stock starting from 6th trading day for 255 trading days in percentage. SECOND: the fraction of total offering represented by pre-IPO shareholders (secondary stock offered) in percentage. P90s: a dummy equal to one if issue happened before the year of 1999. It is equal to zero otherwise. T-statistics are reported in parentheses.
1 2 3 4 5 6 7 Intercept 0.6446*** 0.6844*** 0.6856*** 0.683*** 0.689*** 0.6755*** 0.6792***
(4.6476) (4.9298) (4.9402) (4.9043) (4.9601) (4.837) (4.869)VC 0.0815* 0.1282 0.0934 0.0909 -0.0621 -0.5281 -0.0387
(1.7553) (0.6201) (0.4586) (0.4451) (-0.1732) (-1.257) (-0.0853)VC*RI 0.0537*** 0.0655** 0.0621** 0.064*** 0.0574** 0.0754***
(3.03) (2.5539) (2.5113) (2.7968) (2.3527) (2.851) VC*lnavgcosnu -0.0007 -0.1118 -0.2259
(-0.0174) (-0.7004) (-1.3737)VC*lnavgrndnu 0.0079 0.0985 0.1403
(0.2179) (0.76) (1.0772)VC*lnavgtotca 0.0183 0.0237 0.029
(0.8267) (0.6712) (0.8212)VC*lnavgtotin 0.015 0.0389 0.0238
(0.5683) (0.7325) (0.4462)VC*lnavgvcage -0.022 -0.0259 -0.0611 -0.0257 -0.0155 -0.0523
(-0.378) (-0.4431) (-1.0241) (-0.4556) (-0.2531) (-0.8356)firmage 0.003825 0.0026 0.0028 0.0029 0.003 0.0024 0.0031
(0.185) (0.1246) (0.1353) (0.1384) (0.1462) (0.1146) (0.1488)p90s 0.169*** 0.1568*** 0.1564*** 0.1547*** 0.1574*** 0.1659*** 0.1575***
(3.3637) (3.1172) (3.1103) (3.0607) (3.1307) (3.2763) (3.1091)second 0.0016 0.0016 0.0016 0.0018 0.0017 0.002 0.0018
(1.3721) (1.3634) (1.369) (1.464) (1.388) (1.638) (1.5292)IPOsize -0.089*** -0.0921*** -0.0924*** -0.0931*** -0.0938*** -0.094*** -0.0935***
(-3.8578) (-3.9842) (-3.9967) (-4.0078) (-4.0308) (-4.0161) (-3.9976)stdret1yr -0.1187*** -0.1222*** -0.1224*** -0.1213*** -0.1224*** -0.121*** -0.1209***
(-12.426) (-12.7451) (-12.7556) (-12.6143) (-12.7827) (-12.522) (-12.5243)R-Square 0.0944 0.0979 0.0979 0.09645 0.0980 0.0947 0.0971
N 3086 3055 3055 3022 3055 3022 3022 ***1% significant **5% significant *10% significant

84
Table 2.11 Regression of Three-year BHAR The dependent variable is 3-Year BHAR (BHAR3YR), winsorized at 0.5% and 99.5%.The sample includes both venture-backed and non-venture-backed IPOs during 1993 -2004 period. The main explanatory variables are Reputation Index (RI) and other existing VC reputation measures such as VC age (LNAVGVCAGE), total number of portfolio companies invested (LNAVGCOSNUM), total number of investment rounds participated (LNAVGRNDNUM), total known amount of investment (LNAVGTOTINVT) and total amount of capital under management (LNAVGTOTCAP). Natural log of these reputation measures are used in the regression. Other control variables include IPOsize: the natural log of IPO gross proceeds (IPOsize) deflated to 1993 dollar using CPI index from Bureau of Labor Statistics. FIRMAGE: the firm age since found date provided by Jay Ritter. The natural log of one plus real firm age is used. STDRET1YR: the standard deviation of raw daily stock returns of IPO stock starting from 6th trading day for 255 trading days in percentage. SECOND: the fraction of total offering represented by pre-IPO shareholders (secondary stock offered) in percentage. P90s: a dummy equal to one if issue happened before the year of 1999. It is equal to zero otherwise. T-statistics are reported in parentheses.
1 2 3 4 5 6 7 Intercept 0.642*** 0.6654*** 0.6673*** 0.6412*** 0.6715*** 0.6376*** 0.6392*** (3.8272) (3.9458) (3.9586) (3.7748) (3.979) (3.7465) (3.758)VC 0.1086* 0.099 0.0262 0.1155 -0.2202 -0.5857 -0.1542
(1.931) (0.3944) (0.1057) (0.4617) (-0.5028) (-1.1297) (-0.2759)VC*RI 0.0607*** 0.0611** 0.0552* 0.0655** 0.0565* 0.066**
(2.8267) (1.9751) (1.8485) (2.3514) (1.9127) (2.0554)VC*lnavgcosnu 0.0381 -0.2115 -0.3136
(0.7394) (-1.0806) (-1.5541)VC*lnavgrndnu 0.0514 0.2264 0.2651*
(1.1686) (1.4299) (1.6636)VC*lnavgtotca 0.0216 0.0185 0.0233
(0.7984) (0.4278) (0.5394)VC*lnavgtotin 0.0363 0.037 0.0235
(1.1289) (0.566) (0.3574)VC*lnavgvcage -0.0714 -0.0818 -0.0664 -0.066 -0.0492 -0.0817 (-0.9987) (-1.1358) (-0.9027) (-0.9529) (-0.6501) (-1.0582)firmage -0.0102 -0.0098 -0.0092 -0.0092 -0.0095 -0.0082 -0.0077
(-0.406) (-0.3886) (-0.3645) (-0.3648) (-0.3771) (-0.3231) (-0.3033)p90s 0.1638*** 0.157** 0.156** 0.1669*** 0.1596*** 0.1736*** 0.1669***
(2.6928) (2.5684) (2.5518) (2.7071) (2.6118) (2.812) (2.7011)second 0.0045*** 0.0043*** 0.0043*** 0.0044*** 0.0043*** 0.0046*** 0.0045***
(3.0655) (2.928) (2.9454) (2.964) (2.9677) (3.1411) (3.0576)IPOsize -0.0986*** -0.1008*** -0.101*** -0.0995*** -0.1037*** -0.1004*** -0.0996***
(-3.5354) (-3.5913) (-3.602) (-3.5158) (-3.6701) (-3.5197) (-3.4931)stdret1yr -0.1317*** -0.1337*** -0.1342*** -0.1316*** -0.1335*** -0.1323*** -0.1322*** (-11.3875) (-11.4651) (-11.4974) (-11.2116) (-11.4696) (-11.2289) (-11.2211)
R-Square 0.0823 0.0827 0.0830 0.0814 0.0829 0.0811 0.0824 N 3088 3057 3057 3025 3057 3025 3025
***1% significant **5% significant *10% significant

85
Table 2.12 Post-IPO Returns as Reputation Measure In each sorting period, the mean of First-day Return, 1-Year BHAR and 3-yr BHAR is calculated for each IPO that was backed by a VC firm. The return-based ranking is matched with the same VCs who are now backing new IPOs in the following testing period. These return-based ranking is used as measures for VC reputation. 1-Year BHAR and 3-BHAR are used as dependent variables respectively. Other control variables include IPOsize: the natural log of IPO gross proceeds (IPOsize) deflated to 1993 dollar using CPI index from Bureau of Labor Statistics. FIRMAGE: the firm age since found date provided by Jay Ritter. The natural log of one plus real firm age is used. STDRET1YR: the standard deviation of raw daily stock returns of IPO stock starting from 6th trading day for 255 trading days in percentage. SECOND: the fraction of total offering represented by pre-IPO shareholders (secondary stock offered) in percentage. P90s: a dummy equal to one if issue happened before the year of 1999. It is equal to zero otherwise. T-statistics are reported in parentheses.
First-day Return as Reputation Measure 1-Year BHAR as Reputation Measure 3-Year BHAR as Reputation Measure
Parameter 1-Year BHAR
3-Year BHAR Parameter
1-Year BHAR
3-Year BHAR Parameter
1-Year BHAR 3-Year BHAR
Intercept 0.4561*** 0.7209** Intercept 0.4185*** 0.5794 Intercept 0.3016* 0.3823 (3.59) (2.15) (2.79) (1.5) (1.75) (0.8)
VC 0.0975** 0.4299*** VC 0.1225*** 0.4282*** VC 0.0616 0.4791***(2.23) (3.71) (2.92) (3.97) (1.23) (3.47)
VC*munderprc 0.0328 -0.1562 VC*mabemret1yr 0.0259 0.0739 VC*mabemret3yr 0.024 0.0271 (0.29) (-0.52) (0.34) (0.37) (1.28) (0.52)
firmage -0.0182 -0.0398 IPOsize -0.0449* -0.0909 IPOsize -0.0567** -0.1145 (-0.98) (-0.8) (-1.86) (-1.46) (-2) (-1.46)
IPOsize -0.0458** -0.1116** second 0.1752 0.7512** firmage 0.0026 -0.0254 (-2.21) (-2.03) (1.37) (2.28) (0.1) (-0.35)
second 0.1237 0.5687** stdret1yr -6.3139*** -13.0683*** second 0.276* 1.055** (1.14) (1.98) (-6.1) (-4.91) (1.73) (2.4)
stdret1yr -6.747*** -14.2374*** firmage -0.024 -0.0743 stdret1yr -4.6233*** -10.9027***(-7.72) (-6.14) (-1.1) (-1.32) (-4.07) (-3.49)
p90s 0.0993** 0.3959*** p90s 0.1269** 0.4922*** p90s 0.1547*** 0.5779*** (2.1) (3.15) (2.31) (3.47) (2.66) (3.61)
R-Square 0.0379 0.0369 R-Square 0.0377 0.0399 R-Square 0.0344 0.0383 OBS 2998 2998 OBS 2488 2488 OBS 1828 1828 ***1% significant **5% significant *10% significant

86
Table 3.1 Sample Summary The complete venture-backed IPOs list for 1997-2004 comes from SDC Global New Issues database. All stock prices, shares outstanding, share volume and return data come from CRSP. All accounting items are from Compustat. Lockup expiration dates are hand-collected from the IPO prospectus. The lockup agreement exists in the entire sample. All IPOs from the financial services or utility sectors (SIC 4900-5000 and 6000-7000) as well as ADRs, limited partnerships, REITs and closed-end funds are excluded. Also excluded are any IPOs with an offer price less than 5 dollars to rule out any concern about penny stock firms. In addition, the analysis requires that there be at least one proxy statement after the lockup expiration. The final sample includes 701 VC-backed IPOs.
Issue Year
Number of VC-backed IPOs
AverageFirst-day Return
Percentageof Tech IPO
Average Length of Lockup Period (in Months)
Average IPO proceeds (in Mils.)
Average Offer Price
Average Num.
Backing VCs
1997 96 14.65% 51.04% 6.05 33.34 10.71 2.6 1998 62 32.25% 66.13% 5.97 40.85 12.68 2.5 1999 200 102.99% 76.50% 5.93 68.54 15.25 2.8 2000 197 71.99% 64.97% 5.88 78.84 14.76 3.1 2001 30 17.13% 46.67% 5.97 80.09 12.03 2.5 2002 19 7.18% 36.84% 5.95 87.85 13.51 1.9 2003 20 15.87% 40.00% 6.00 70.76 13.40 3.6 2004 77 13.10% 48.72% 5.94 111.28 13.31 3.6

87
Table 3.2 VC Selling at IPO and Lockup Expiration The VC ownership immediately before the IPO (SH1) and after the IPO (SH2) iscollected from the IPO prospectus. VC ownership reported by the first proxystatement after lockup expiration is use as the estimate of VC shareholdingimmediate after the unlock day (SH3). The VC selling at IPO is therefore equalto SH2 – SH1 and the VC selling at lockup expiration is the difference betweenSH3 and SH2. The categories in the table of the actions of the lead VCs at IPOand lockup expiration are based on the value of (SH2-SH1) and (SH3-SH2). This table summarizes the percentage of the lead VCs who take different actions(Hold, Buy, Sell Partially, and Exit Control) at the IPO date and lockup expiration, respectively.
At IPO At Lockup Expiration Leading VC Frequency Percent Frequency Percent Hold 1 0.14 16 2.28 Buy 5 0.71 48 6.84 Sell Partially 680 96.87 478 68.09 Exit Control 16 2.28 144 20.51 Total 701 68631
31 At the IPO, 15 leading VCs completely unwound their pre-IPO shareholding. Therefore, the total sample size shrinks to 686 at lockup expiration.

88
Table 3.3 Ownership Level and Ownership Change around IPO and Lockup Expiration VC ownership immediate before the IPO (SH1) and after the IPO (SH2) are collected from the IPO prospectus. The VC ownership reported by the first proxy statement after lockup expiration is collected and used as the estimate of VC shareholding immediate after unlock day (SH3). Panel A Level of Lead VC Ownership at Different Time Points
Lead VC Ownership Max (%) Mean (%) Median (%) Ownership Before IPO Date (SH1) 99.7 23.7 19.25 Ownership Immediately After IPO Date(SH2) 78.2 17.81 14.54 Ownership After Lockup Expiration(SH3) 75.1 12.45 10.2
Panel B Change of Lead VC Ownership Change in Lead VC Ownership Max (%) Mean (%) Median (%)
Pre- to Post-IPO Change 100 24.38 21.62 Pre- to Post-Lockup Expiration Change 100 32.98 17.9
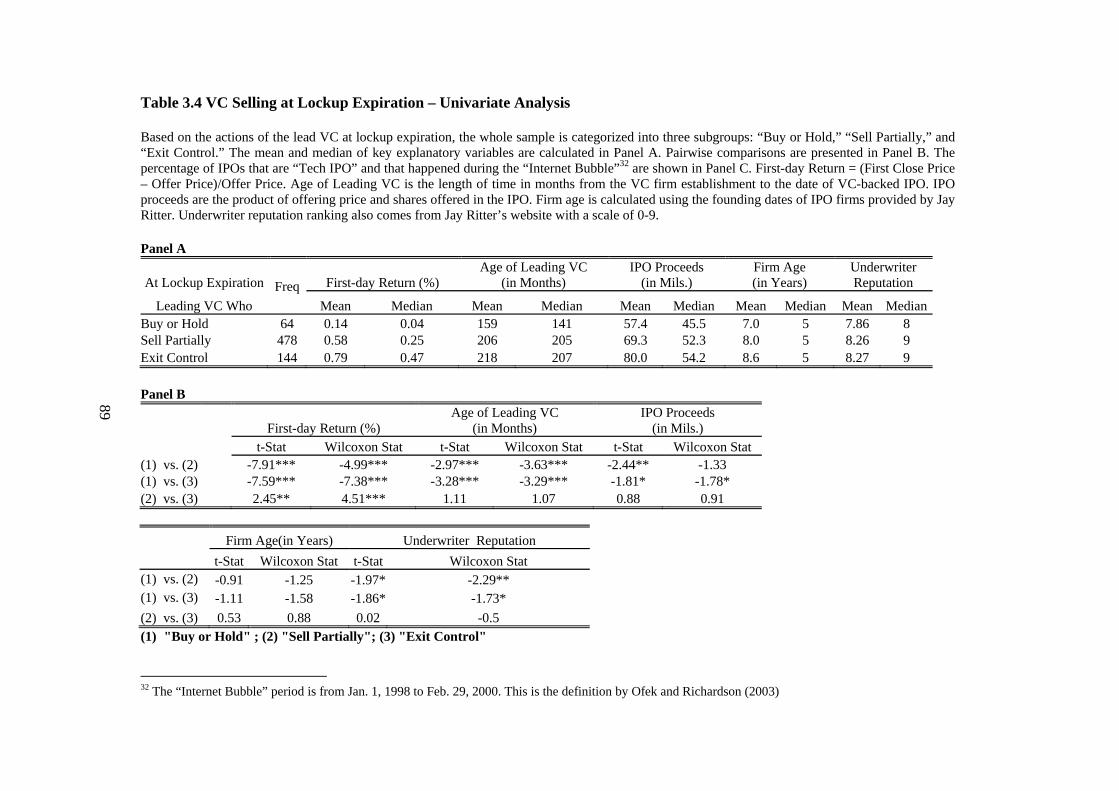
89
Table 3.4 VC Selling at Lockup Expiration – Univariate Analysis Based on the actions of the lead VC at lockup expiration, the whole sample is categorized into three subgroups: “Buy or Hold,” “Sell Partially,” and “Exit Control.” The mean and median of key explanatory variables are calculated in Panel A. Pairwise comparisons are presented in Panel B. The percentage of IPOs that are “Tech IPO” and that happened during the “Internet Bubble”32 are shown in Panel C. First-day Return = (First Close Price – Offer Price)/Offer Price. Age of Leading VC is the length of time in months from the VC firm establishment to the date of VC-backed IPO. IPO proceeds are the product of offering price and shares offered in the IPO. Firm age is calculated using the founding dates of IPO firms provided by Jay Ritter. Underwriter reputation ranking also comes from Jay Ritter’s website with a scale of 0-9. Panel A
At Lockup Expiration Freq First-day Return (%) Age of Leading VC
(in Months) IPO Proceeds
(in Mils.) Firm Age (in Years)
Underwriter Reputation
Leading VC Who Mean Median Mean Median Mean Median Mean Median Mean MedianBuy or Hold 64 0.14 0.04 159 141 57.4 45.5 7.0 5 7.86 8 Sell Partially 478 0.58 0.25 206 205 69.3 52.3 8.0 5 8.26 9 Exit Control 144 0.79 0.47 218 207 80.0 54.2 8.6 5 8.27 9 Panel B
First-day Return (%) Age of Leading VC
(in Months) IPO Proceeds
(in Mils.) t-Stat Wilcoxon Stat t-Stat Wilcoxon Stat t-Stat Wilcoxon Stat
(1) vs. (2) -7.91*** -4.99*** -2.97*** -3.63*** -2.44** -1.33 (1) vs. (3) -7.59*** -7.38*** -3.28*** -3.29*** -1.81* -1.78* (2) vs. (3) 2.45** 4.51*** 1.11 1.07 0.88 0.91
Firm Age(in Years) Underwriter Reputation t-Stat Wilcoxon Stat t-Stat Wilcoxon Stat
(1) vs. (2) -0.91 -1.25 -1.97* -2.29** (1) vs. (3) -1.11 -1.58 -1.86* -1.73* (2) vs. (3) 0.53 0.88 0.02 -0.5(1) "Buy or Hold" ; (2) "Sell Partially"; (3) "Exit Control"
32 The “Internet Bubble” period is from Jan. 1, 1998 to Feb. 29, 2000. This is the definition by Ofek and Richardson (2003)

90
Panel C At Lockup Expiration
Freq Number of
Tech IPO% Leading VC Who Tech IPO
Buy or Hold 64 33 0.52 Sell Partially 478 293 0.61 Exit Control 143 103 0.72 Chi-square Test 9.37**
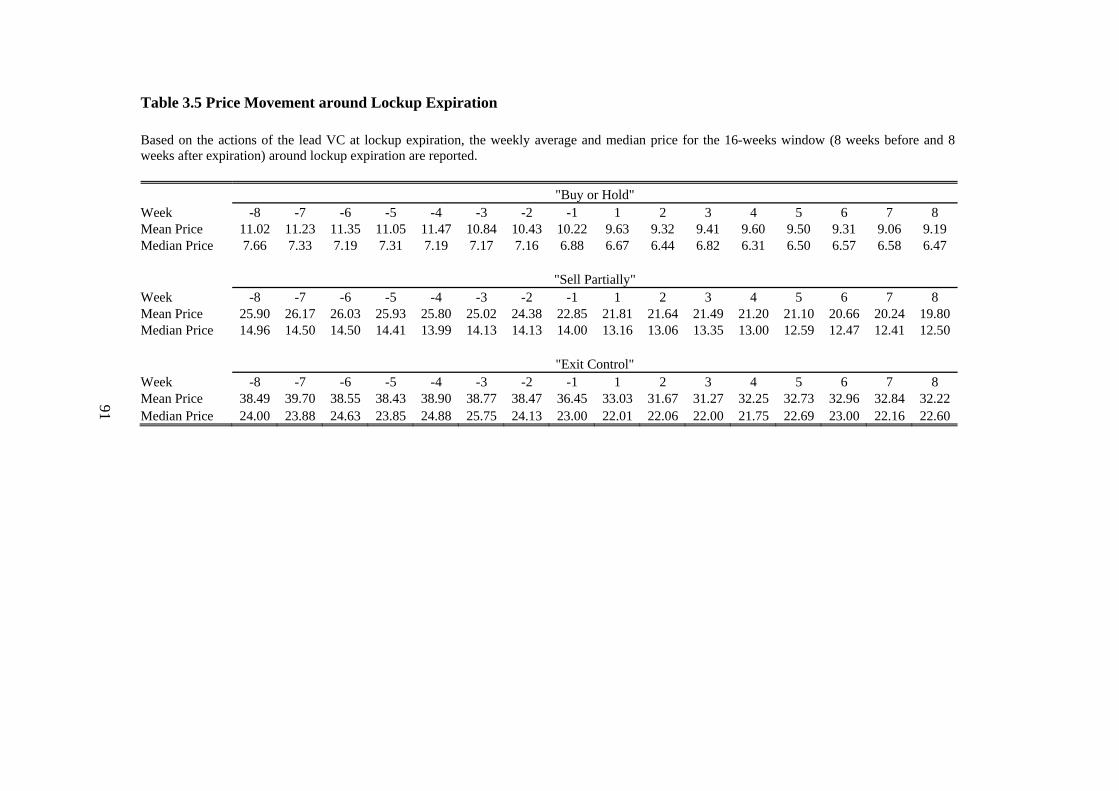
91
Table 3.5 Price Movement around Lockup Expiration Based on the actions of the lead VC at lockup expiration, the weekly average and median price for the 16-weeks window (8 weeks before and 8 weeks after expiration) around lockup expiration are reported. "Buy or Hold" Week -8 -7 -6 -5 -4 -3 -2 -1 1 2 3 4 5 6 7 8 Mean Price 11.02 11.23 11.35 11.05 11.47 10.84 10.43 10.22 9.63 9.32 9.41 9.60 9.50 9.31 9.06 9.19 Median Price 7.66 7.33 7.19 7.31 7.19 7.17 7.16 6.88 6.67 6.44 6.82 6.31 6.50 6.57 6.58 6.47
"Sell Partially" Week -8 -7 -6 -5 -4 -3 -2 -1 1 2 3 4 5 6 7 8 Mean Price 25.90 26.17 26.03 25.93 25.80 25.02 24.38 22.85 21.81 21.64 21.49 21.20 21.10 20.66 20.24 19.80 Median Price 14.96 14.50 14.50 14.41 13.99 14.13 14.13 14.00 13.16 13.06 13.35 13.00 12.59 12.47 12.41 12.50
"Exit Control" Week -8 -7 -6 -5 -4 -3 -2 -1 1 2 3 4 5 6 7 8 Mean Price 38.49 39.70 38.55 38.43 38.90 38.77 38.47 36.45 33.03 31.67 31.27 32.25 32.73 32.96 32.84 32.22 Median Price 24.00 23.88 24.63 23.85 24.88 25.75 24.13 23.00 22.01 22.06 22.00 21.75 22.69 23.00 22.16 22.60

92
Table 3.6 Abnormal Return around Lock Expiration The equally-weighted Buy-and-Hold return (BHAR) using the NYSE/AMEX Equally-weighted Index as the benchmark is reported for different periods before and after lockup expiration. If any firm is delisted before the end of a certain period, the delisting return is used if available. BHAR before Lockup Expiration BHAR Starting from Lockup Expiration Leading VC Who Freq (Second Day to Lockup Expiration) 1-month 3-month 6-month 12-month 18-month 24-month 30-month
"Buy or Hold" 64 -28.76% -5.02% -13.98% -23.68% -4.56% 4.24% 31.95% 84.29% "Sell Partially" 478 2.17% -1.67% -7.99% -17.24% -16.97% -21.02% -26.57% -28.03%"Exit Control" 143 28.33% 4.20% 3.09% 2.82% 1.24% 37.32% 23.01% 1.72%

93
Table 3.7 Multinomial Logit Regression at Lockup Expiration The whole sample is divided into three sub-samples: “Buy or Hold,” “Sell Partially,” and “Exit Control”. The “Sell Partially” group is used as a reference category. The complete specifications are as follows: Regression1:
Buy or Hold01 11 21 31
Sell Partially
( ) FirstDayReturn LockupReturn PostLockupReturn_LongLnπ
β β β βπ
= + × + × + ×
41 51 61 1PostLockupReturn_Short VCAge FirmAge OtherControlsβ β β β ε+ × + × + × + × + Regression2:
Exit Control02 12 22 32
Sell Partially
( ) FirstDayReturn LockupReturn PostLockupReturn_LongLn π β β β βπ
= + × + × + × '
42 52 62 2PostLockupReturn_Short VCAge FirmAge OtherControlsβ β β β ε+ × + × + × + × + First-day Return: (offering price – first close price)/offering price; Lockup Return: BHAR from second day after offering to lockup expiration; Post Lockup Return_Long: 30-month BHAR from lockup expiration to 30-month post-expiration; PostLockup Return_Short: 6-month BHAR from lockup expiration to 6-month post-expiration VCAge: natural log of VC age in months; FirmAge: natural log of firm age in years. Underwriter Reputation: the reputation ranking of underwriters provided by Jay Ritter; TechIPO: a dummy indicating if an IPO is Tech IPO according to the definition of Ritter (2004); IPO size: natural log of IPO proceeds in million dollars.
<< See next page >>

94
Variable Reg.1 Reg.2 Reg.1 Reg.2 Reg.1 Reg.2 Reg.1 Reg.2 Reg.1 Reg.2 Reg.1 Reg.2 Intercept -0.7963 -1.5759* 0.6766 -1.9511** 2.7** -2.3353** 1.5413 -2.1648** 2.6605* -2.1261* 2.3888* -2.0987*
(0.9896) (0.8458) (0.9689) (0.8245) (1.1576) (1.0343) (1.1667) (0.9324) (1.4226) (1.1224) (1.4368) (1.1252)FirstDayReturn -0.0183*** 0.0024** -0.0181*** 0.0024** -0.0181***0.0031***
(0.0049) (0.001) (0.0048) (0.0011) (0.0049) (0.0011)LockupReturn -0.009*** 0.0022***-0.0072*** 0.002** -0.0077***0.0021*** -0.0069** 0.0023***
(0.003) (0.0008) (0.0027) (0.0008) (0.0029) (0.0008) (0.0029) (0.0008)PostLockupReturn_Long 0.0015*** 0.0011** 0.0017*** 0.0008
(0.0005) (0.0005) (0.0006) (0.0005)PostLockupReturn_Short -0.0023 0.0036*** -0.0057* 0.0036***
(0.0027) (0.0012) (0.0032) (0.0013)VCAge -0.4634*** 0.1085 -0.3755** 0.0643 -0.354** 0.0516
(0.1363) (0.122) (0.1502) (0.1264) (0.153) (0.128)FirmAge -0.4315** 0.1464 -0.4554** 0.2206* -0.4473** 0.2352*
(0.1935) (0.1255) (0.206) (0.1320) (0.21) (0.1328)UnderwriterReputation -0.1219 -0.1188 -0.1317 -0.0983 -0.1685 -0.0536 -0.1947* -0.0459 -0.1094 -0.1021 -0.1396 -0.136
(0.11) (0.0921) (0.1048) (0.0924) (0.106) (0.0907) (0.113) (0.0953) (0.1234) (0.0957) (0.1259) (0.0968)TechIPO -0.0399 0.3311 -0.3254 0.4248** -0.3092 0.4759** -0.4343 0.5243** -0.0469 0.36 -0.1353 0.3132
(0.285) (0.2178) (0.2724) (0.2126) (0.2754) (0.2099) (0.2731) (0.2115) (0.2921) (0.2191) (0.2979) (0.2216)IPO size 0.0339 0.2348 -0.4067 0.3153* -0.2288 0.1755 -0.2553 0.1825 -0.1896 0.1562 -0.1068 0.2338
(0.2478) (0.1722) (0.2528) (0.1659) (0.3458) (0.1609) (0.2432) (0.1614) (0.2636) (0.1711) (0.2719) (0.173)AIC 1044.82 1074.77 1075.97 1083.29 1022.86 1008.05
-2 Log L 1016.82 1050.77 1055.97 1063.29 990.86 968.05 Number of Obs 685 685 677 678 670 670
***1% significant **5% significant *10% significant

95
Table 3.8 Delisting and Its Reasons Panel A Percentages of Delisting and non-Delisting
IPOs Delisted within 4 years after IPO Frequency Percent (%)Yes 200 28.63 No 501 71.37
Total 701
Panel B Reason for Delisting
Among IPOs Delisted33 Frequency Percent (%)Mergers 124 62 Exchanges 1 0.5 Liquidations 2 1 Dropped due to other reasons 73 36.5
Total 200
33 The classification is based on CRSP definition of delisting code.

96
Table 3.9 Weighted Average Duration (WAD): Summary The weighted average duration (WAD) is calculated as follows:
0 1 2 31 21 1 2 1 2 3
0 0 0
(VC VC ) (VC VC )(VC VC )WAD= ( ) ( )VC VC VC
t t t t t t− −−× + × + + × + + 3 4
1 2 3 40
(VC VC ) ( )VC
t t t t−+ × + + +
=31 2 4
1 2 3 4 1 2 3 40 0 0 0
VCVC VC VC= ( )VC VC VC VC
t t t t t t t t+ × + × + × − × + + +
Where VC0 is the ownership immediate after IPO and VCi (i=1,2,3,4) is the ownership reported in the ith proxy statements since the IPO. T1 is the interval between the IPO date and the first proxy statement. Ti (i=2,3,4) is the interval between first proxy statement and second proxy statement, between second proxy statement and third proxy statement so on and so forth.
WAD Summary Mean Median Min Max29.4 20.9 0 120
WAD Freq Percent <12 Months 122 17.5
12-36 Months 400 57.6 >36 Months 173 24.9
Total 695

97
Table 3.10 WAD: Univariate Evidence The whole sample is divided into three trintiles based on the length of WAD. For each trintile, the mean and median of key explanatory variables are reported in Panel A. The variables include (1) first-day return; (2) IPO proceeds; (3) firm age; (4) age of lead VC; and (5) underwriter reputation. First-day Return = (First Close Price – Offer Price)/Offer Price. Age of Lead VC is the length of period in months from VC firm establishment to the date of VC-backed IPO. IPO proceeds are the product of offering price and shares offered in the IPO. Firm age is calculated using the founding dates of the IPO firms provided by Jay Ritter. Underwriter reputation ranking also comes from Jay Ritter’s website with a scale of 0-9. Panel B reports the percentage of IPO firms in each trintile that belong to “Tech IPO.” Panel A
WAD Num of IPO
First-Day Return (%) IPO Proceeds
(in Mil.) Firm Age (in Years)
Age of Leading VC (in Months)
Underwriter Reputation
Mean Median Mean Median Mean Median Mean Median Mean Median "Shortest" 209 65.80% 37.50% 74.2 52.5 7.8 5 195.2 186 8.2 8 "Intermediate" 278 61.79% 26.18% 66.5 52.3 7.2 5 219.8 211 8.3 9 "Longest" 208 42.51% 13.71% 70.1 49.6 9.4 6 193.5 192 8.0 9
First-Day Return (%) IPO Proceeds
(in Mil.) Firm Age (in Years)
Age of Leading VC(in Months)
Underwriter Reputation
t-Stat Wilcoxon Stat t-Stat Wilcoxon Stat t-Stat Wilcoxon Stat t-Stat Wilcoxon Stat t-Stat Wilcoxon Stat
"Shortest" vs. "Intermediate" 0.49 1.83* 0.87 0.09 0.68 0.25 -2.19** -2.33** -1.57 -1.78* "Shortest" vs. "Longest" 3.11*** -4.33*** 0.43 -0.26 -1.38 1.18 0.14 0.08 1.09 -0.22
"Intermediate" vs "Longest" 2.53** -2.97*** -0.64 -0.18 -
2.23** 1.58 2.47** -2.45** 2.58** -1.92* Panel B
WAD Num of IPO Number of
Tech IPO%Tech IPO "Shortest" 209 143 68.42%
"Intermediate" 278 179 64.39% "Longest" 208 112 53.85%
Chi-square Test 9.37**

98
Table 3.11 WAD: OLS Evidence OLS regression is used. The WAD of each IPO is the dependent variable. The definition of explanatory variables are as follows: (1) First-day Return = (First Close Price – Offer Price)/Offer Price; (2) Lockup Return: the buy-and-hold return calculated from second day after the IPO to the expiration date; (3) PostLockup Return: the buy-and-hold return calculated from lockup expiration to the exit date of the lead VCs; (4) VCAge, natural log of VC age which is equal to the length of period in months from the VC firm’s establishment to the IPO date; (5) FirmAge, natural log of firm age in years which is calculated using the founding dates of IPO firms provided by Jay Ritter; (6) IPO size, natural log of the IPO proceeds in million dollars; (7) Underwriter reputation, investment banker ranking with a scale of 0-9 from Jay Ritter’s website; (8) Tech IPO: a dummy indicating if an IPO is a Tech IPO; (9) VCSHAFTLKUP: the equity holding of the lead VC immediate after lockup expiration. Standard error is reported in parenthesis below the estimate. (1) (2) (3) (4) (5) Intercept 28.009*** 31.5987*** 36.2795*** 28.8803*** 32.0682***
(7.1599) (7.0356) (8.6128) (7.626) (8.8253) FirstDayReturn -0.0183* -0.0199*
(0.0103) (0.0104) LockupReturn -0.0333*** -0.034***
(0.0081) (0.0081) PostLockupReturn -0.0239*** -0.0268***
(0.0091) (0.009) VCAge -1.0497 -1.0987
(0.9978) (0.9988) FirmAge 0.8663 0.6572
(1.1225) (1.1358) IPO size -0.7185 -0.6731 -0.3267 -0.2799 -1.069
(1.4787) (1.4379) (1.4376) (1.439) (1.475) Underwriter Reputation -0.1746 -0.7275 -0.7388 -0.684 -0.0344
(0.796) (0.791) (0.7946) (0.8008) (0.797) Tech IPO -3.3743* -4.8137*** -4.7542*** -4.6785*** -3.188*
(1.7715) (1.7343) (1.7422) (1.749) (1.7649) VCSHAFTLKUP 0.4866*** 0.4844*** 0.4756*** 0.4692*** 0.4866***
(0.0721) (0.0725) (0.0728) (0.0735) (0.0725) R-Square 0.0989 0.08182405 0.07393068 0.0732292 0.1124829 Number of Obs. 673 674 674 674 670 ***1% significant **5% significant *10% significant

99
Figure 3.1 BHAR for Various Periods Before and After Lockup Expiration
‐0.4
‐0.2
0
0.2
0.4
0.6
0.8
1
‐6 months
1 month 3 months6 months 12 months
18 months
24 months
30 months
buyorneutral sellpar exitcontrol