fundraising by european venture capital funds - · pdf fileventure capital funds. introduction...
TRANSCRIPT

21 September 2017
Fundraising by European
venture capital funds

Introduction
2
Objective
▪ How much venture capital is out there? Where is capital coming from? Is Brexit causing a shift in Europe? This report aims to answer these questions
▪ The second objective of this report is to improve data about venture capital funding in Europe and make it more transparent
▪ Data used in this report is available via a recently added section on Dealroom app.dealroom.co/new_funds
▪ If you have any comments on data in this report please contact us: via email on [email protected] or via Intercom inside app.dealroom.co
Methodology
▪ This report focuses on capital raised by European VC funds (pension funds, the European Investment Fund, corporates, …)
▪ Excluded are private equity funds and most growth equity funds (although growth equity funds are included if the same fund is known to mostly participate in VC rounds). Israel is excluded. Corporate VC funds are excluded but mentioned
▪ Timing wise, our data is based on closing announcement dates. For subsequent closings, we only count the incremental amounts
▪ A special thanks to Yannick Roux. His open source research not only gave us a head start, but also made clear that traditional sources of venture capital funding data do not provide the full picture, exposing the need to research this area
VC funding
trends
▪ Europe is on track for €12 billion in new VC funds raised in 2017, tripling in just 3-4 years, thus catching up with European investment levels
▪ The number of funds grew at the same pace, from 30 to 100 new funds per year, while the average size per fund is fairly constant around €110M
▪ Traditionally, the UK (London) has been Europe’s top venture capital hub. In 2016, continental European VC fundraising surged, especially in France, Sweden, Netherlands. And in 2017 for the first time ever, France leads with €2.7 billion funds raised, vs. €2.3 billion in the UK
Additional
funding sources
▪ The number of unique active investors in Europe has tripled from 758 in 2012 to 2,484 so far in 2017 in Europe (VCs, corporates, angels, other)
▪ By amount invested, the fastest growing investor categories are: European and Asian investors (geographically), and corporates and angels (type)
▪ Private equity and growth equity have started to participate in venture rounds too
▪ Notable non-VC investors have entered the scene too: corporate funds and government-backed funds

€ 3.5B
€ 6.7B
€ 12.2B
€ 8.4B€ 8.6B
€ 13.1B€ 13.8B
€ 12.1B
€ 0B
€ 3B
€ 6B
€ 9B
€ 12B
€ 15B
2014 2015 2016 2017 to Aug
Amount raised by European VC funds (€ billions) Amount of VC invested in Europe (€ billions)
Europe is on track for €12 billion in new VC funds
raised in 2017, catching up with investment levels
3
Source: Dealroom.co.
1. INKEF added €300M to total €500M.
2. Rocket internet reached cap of $1 billion of which $420M announced in 2016 and $580M in 2017.
3. Historically, funds have been announced in H1, therefore the full year 2017 may end up lower than €12 billion.
Index Ventures € 400M (UK)
Balderton Capital € 277M (UK)
Abingworth € 270M (UK)
Northzone € 250M (SE)
DN Capital € 182M (UK)
Advent Life Sciences € 175M (UK)
Seventure Partners € 160M (FR)
Principia SGR € 160M (IT)
Mosaic Ventures € 127M (UK)
Runa Capital € 123M (RU)
Woodford € 960M (UK)
Kinetik € 455M (UK)
Lakestar € 350M (CH)
Highland Europe € 332M (UK)
HV Holtzbrinck € 301M (DE)
Partech € 300M (FR)
Sofinnova € 300M (FR)
Business Growth Fund € 240M (UK)
BGF Ventures € 240M (UK)
Acton Capital € 182M (DE)
Notable exclusion:
DST Global € 1.5B (RU)
(because invests mainly outside Europe)
EQT Ventures € 566M (SE)
Index Ventures € 500M (UK)
Accel Partners € 455M (UK)
Partech Ventures € 400M (FR)
Rocket Internet SE € 382M (DE)
Verdane Capital € 320M (NO)
Rothschild VC € 300M (FR)
HTGF € 300M (DE)
INKEF Capital € 300M (NL) (1)
Northzone € 300M (SE)
Atomico € 719M (UK)
Rocket Internet € 527M (DE) (2)
Partech Ventures € 400M (FR)
Cathay Innovation € 287M (FR)
Alven Capital € 250M (FR)
Omnes € 245M (FR)
Omnes € 210M (FR)
Draper Esprit € 192M (UK)
Project A € 180M (DE)
Mangrove € 155M (LU)
Notable exclusion:
Vitruvian € 2.4B (UK)
(because it is a growth equity fund)
annualised
€12B (3)
Shortfall is funded by U.S. funds, corporates, PE funds
annualised
€16B+

31
60
105
72
€ 111M € 111M€ 116M € 116M
€ 0M
€ 30M
€ 60M
€ 90M
€ 120M
€ 150M
2014 2015 2016 2017 to Aug
–
30
60
90
120
150
Number of funds Average size per fund
€ 1.7B € 2.2B€ 3.2B
€ 1.8B
€ 4.5B
€ 9.0B
€ 3.5B
€ 6.7B
€ 12.2B
€ 0B
€ 3B
€ 6B
€ 9B
€ 12B
€ 15B
2014 2015 2016
EIF equity
EIF’s role has diminished but remains significant.
The average size per fund is constant around €110M
4Source: Dealroom.co.
1. Historically, funds have been announced in H1, therefore the full year 2017 may end up lower.
EIF’s contribution has increased in absolute terms, but
it has diminished in % terms
The number of funds has increased, while the average
size per fund stayed constant just above €110M
annualised
100+ (1)
€ capital raised
The EIF’s % contribution has dropped from 47% in 2014
to 26% in 2016

Source: Dealroom.co.
Note: Index Ventures counted as UK fund (not Switzerland). 5
Traditionally, the UK (London) has been Europe’s top
venture capital hub, followed by France, and Germany
€ 8.9B
€ 5.4B
€ 3.4B
€ 1.9B
€ 1.3B
€ 0.7B
€ 0.6B
€ 0.6B
€ 0.5B
€ 0.5B
€ 0.4B
€ 0.4B
€ 0.3B
€ 0.3B
€ 0.2B
United Kingdom
France
Germany
Netherlands
Sweden
Switzerland
Spain
Ireland
Italy
Luxembourg
Finland
Norway
Denmark
Belgium
Austria
2015 2016 2017€ capital raised by European VC funds
UK, France and Germany together account for 64% of capital
€ 11.4B
€ 6.0B
€ 7.3B
€ 1.2B
€ 2.8B
€ 2.7B
€ 1.7B
€ 1.0B
€ 0.4B
€ 0.1B
€ 0.7B
€ 0.4B
€ 0.6B
€ 0.6B
€ 0.4B
United Kingdom
France
Germany
Netherlands
Sweden
Switzerland
Spain
Ireland
Italy
Luxembourg
Finland
Norway
Denmark
Belgium
Austria
€ capital invested into European companies 2015-2017 YTD

€ 1.6B
€ 0.3B€ 0.4B
€ 1.2B
€ 3.0B
€ 1.1B€ 0.9B
€ 1.7B
€ 3.5B
€ 1.6B€ 1.4B
€ 5.7B
€ 2.3B€ 2.7B
€ 1.1B
€ 2.3B
€ 0.0B
€ 1.0B
€ 2.0B
€ 3.0B
€ 4.0B
€ 5.0B
€ 6.0B
United Kingdom France Germany Rest of Europe
2014 2015 2016 2017 to Aug
Source: Dealroom.co.
Note: Index Ventures counted as UK fund (not Switzerland). 6
In 2016, continental European VC fundraising surged,
especially in France, Sweden, Netherlands, …
Notable VC fundraisings in 2016:Sweden:EQT Ventures €566m (Fund I) Northzone €300m (Fund VIII)Creandum €180m (Creandum IV)Netherlands:INKEF Capital €300m (Fund I) LSP Life Sciences Partners €255m (LSP 5) Gilde Healthcare €250m (Gilde Healthcare IV)Spain:Ysios Capital €126m (BioFund II) Kibo Ventures €71m (Fund II)
€ capital raised by European VC funds

Source: Dealroom.co analysis with help from Yannick Roux.
Note: Index Ventures counted as UK fund (not Switzerland).
Excludes private equity. Includes growth funds if funding is known to invest in VC rounds. Includes life sciences funds. Excludes Corporate venture funds and commitments (which are mostly in Germany and France).
7
… and in 2017 for the first time ever, France leads
with €2.7 billion funds raised, vs. €2.3 billion in the UK
France
UK
Germany
€ 1.6B
€ 1.4B
€ 2.6B
€ 1.0B
€ 2.3B
€ 0.6B€ 0.5B
€ 0.5B
€ 1.0B
€ 2.7B
€ 0.4B € 0.4B
€ 1.0B
€ 0.5B
€ 1.1B
€ 0.6B
€ 1.1B
€ 2.9B€ 2.8B
€ 2.3B
€ 0.0B
€ 1.0B
€ 2.0B
€ 3.0B
H1 H2 H1 H2 H1 to Aug
2015 2016 2017
United Kingdom France Germany Rest of Europe
Rest of Europe
€ capital raised by VC funds (1)

Source: Dealroom.co.
Note: Index Ventures counted as UK fund (not Switzerland). 8
Fundraising by French VCs is more distributed and
this excludes additional capital from corporate VCs
French VCs: 2017 so far United Kingdom: 2017 so far
France: €2.7 billion raised in 2017 UK €2.3 billion
raised in 2017

9
Notable non-VC investors have entered the scene
too: corporate funds and government-backed fundsInvestor Type Location Fund size Fund date
Next47 - a Siemens Company Corporate Germany € 1,000M 2016 Q2
KFW Government Germany € 1,000M 2015 Q3
UK National Investment Fund Government United Kingdom € 909M 2017 Q3
Sapphire Ventures (formerly SAP Ventures) Corporate U.S. (London office) € 833M 2016 Q3
Deutsche Telekom Capital Partners Corporate Germany € 500M 2014 Q4
BMW i Ventures Corporate U.S. (Munich office) € 500M 2016 Q4
Allianz Ventures Corporate Germany € 430M 2016 Q4
UBS Corporate Switzerland € 428M 2016 Q2
Nokia Growth Partners Corporate Finland € 314M 2016 Q1
Bosch Corporate Germany € 300M 2017 Q1
Britain Electric Battery Technology Fund Government United Kingdom € 291M 2017 Q3
Galdana Ventures Fund-of-fund Spain € 250M 2016 Q3
Sberbank Corporate Russia € 227M 2016 Q4
SoftBank Private Equity Japan (London office) $ 100B 2017 Q2
SILK Ventures Venture Capital China (London office) $ 500M 2017 Q2
Source: Dealroom.co.

More fund data by type, location and more
Click image to view online
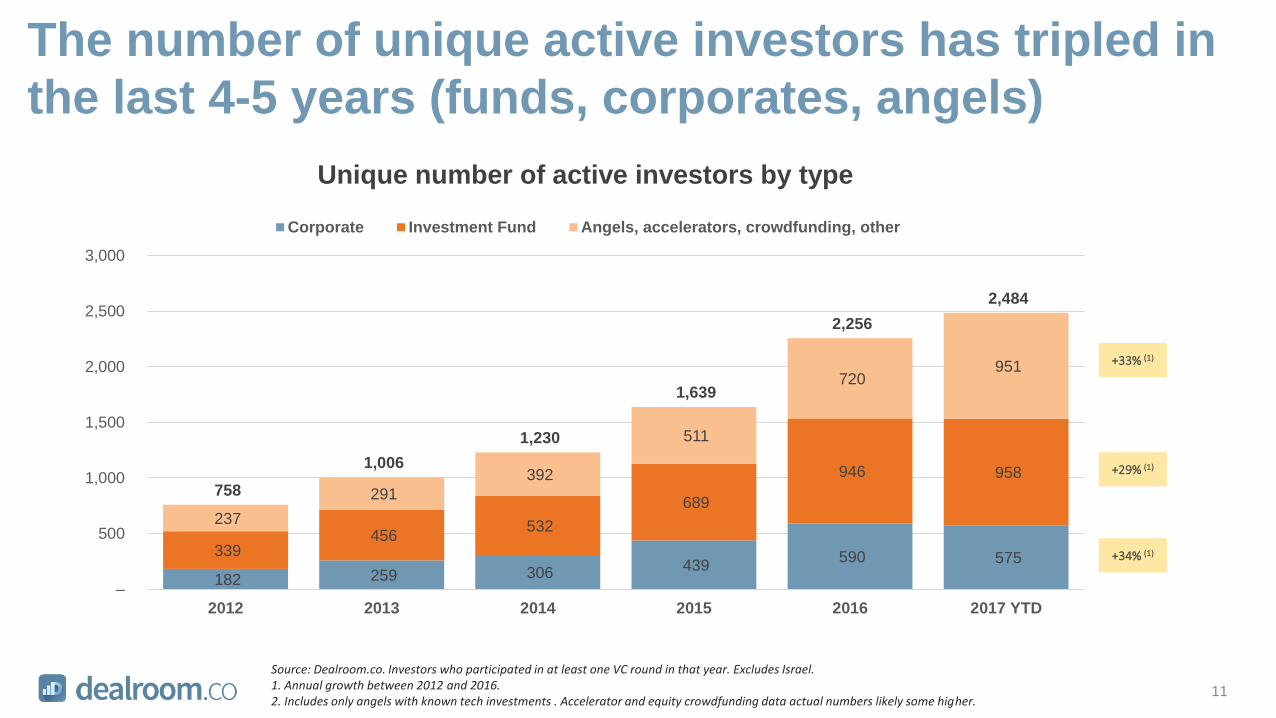
The number of unique active investors has tripled in
the last 4-5 years (funds, corporates, angels)
Source: Dealroom.co. Investors who participated in at least one VC round in that year. Excludes Israel.1. Annual growth between 2012 and 2016.2. Includes only angels with known tech investments . Accelerator and equity crowdfunding data actual numbers likely some higher.
Unique number of active investors by type
182 259 306 439 590 575 339
456 532
689
946 958
237
291
392
511
720 951
758
1,006
1,230
1,639
2,256
2,484
–
500
1,000
1,500
2,000
2,500
3,000
2012 2013 2014 2015 2016 2017 YTD
Corporate Investment Fund Angels, accelerators, crowdfunding, other
+33% (1)
+29% (1)
+34% (1)
11

€ 0.8B€ 1.2B
€ 1.8B
€ 4.4B € 4.7B
€ 3.7B € 4.0B
€ 8.3B
€ 10.4B
€ 11.2B
€ 0.1B € 0.2B € 0.3B€ 0.6B € 0.6B
–
500
1,000
1,500
2,000
2,500
3,000
3,500
€ 0.0B
€ 2.0B
€ 4.0B
€ 6.0B
€ 8.0B
€ 10.0B
€ 12.0B
2012 2013 2014 2015 2016 2012 2013 2014 2015 2016 2012 2013 2014 2015 2016
Amountinvested
Number ofrounds
Corporate investors are the fastest growing category
into European companies, by amount invested
1. U.S based funds = Funds only. Excludes investment by U.S. corporates (Microsoft, GE, …).
Corporate6x growth
Investment funds3x growth
Angel, crowdfunding5x growth
12

Investment into European companies is growing most
coming from European and Asian investors
1. U.S based funds = Funds only. Excludes investment by U.S. corporates (Microsoft, GE, …)
United States3x growth
Europe4x growth
Other6x growth
€ 1.2B€ 1.7B
€ 3.1B
€ 4.0B € 3.8B
€ 3.0B€ 3.3B
€ 6.7B
€ 9.8B
€ 10.8B
€ 0.3B € 0.3B€ 0.6B
€ 1.4B€ 2.0B
–
500
1,000
1,500
2,000
2,500
3,000
3,500
4,000
4,500
€ 0.0B
€ 2.0B
€ 4.0B
€ 6.0B
€ 8.0B
€ 10.0B
€ 12.0B
2012 2013 2014 2015 2016 2012 2013 2014 2015 2016 2012 2013 2014 2015 2016
Amountinvested
Number ofrounds
13
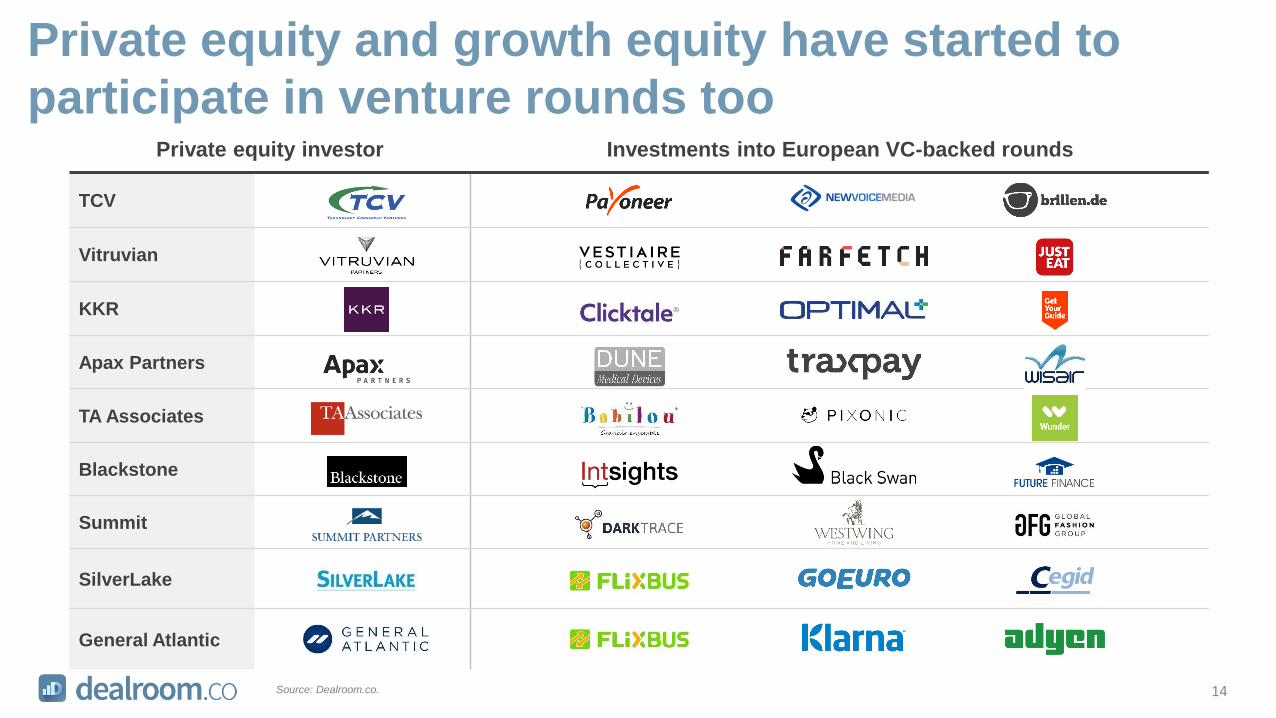
Private equity and growth equity have started to
participate in venture rounds tooPrivate equity investor Investments into European VC-backed rounds
TCV
Vitruvian
KKR
Apax Partners
TA Associates
Blackstone
Summit
SilverLake
General Atlantic
14Source: Dealroom.co.

Explore more new funds data per country
Click image to view online

Dealroom helps corporations and investment firms to identify high-potential companies early on, and to stay at the forefront of innovation
Dealroom provides data-driven intelligence and real-time insights about high-growth companies, venture capital, tech M&A
Data and software are delivered as online SaaS app, API, and bespoke research

Click here to learn more about Dealroom’s premium products
Talk to us directly via Intercom
Click image to view online