vector based datum transformation scheme for computer ...3)_2012_289-305.pdf · computer-aided...
TRANSCRIPT

Computer-Aided Design & Applications, 9(3), 2012, 289-305© 2012 CAD Solutions, LLC, http://www.cadanda.com
289
Vector Based Datum Transformation Scheme for Computer AidedMeasurement
Danny K. L. Lai1 and Matthew. M. F. Yuen2
1The Hong Kong University of Science and Technology, [email protected] Hong Kong University of Science and Technology, [email protected]
ABSTRACT
Product geometry measurement is a critical step in the product development cycle. Itprovides dimensional and tolerance verification between mechanical design andmeasurement assuring the quality of the product. Traditional measuring strategy isbased on experience rather than using a systematic approach. This paper presents avector-based datum transformation scheme to standardize the method to define themeasurement datum to improve the quality of mechanical parts. It is based on matingcondition assembly models of CAD system, to identify the dimensional andtolerancing relation between a geometric feature and the measuring datum. ThroughAssembly Mating Map and tolerance analysis, a commonly measuring datum is definedto improve a measurement strategy with the same measuring vector of assemblyfeatures.
Keywords: computer aided measurement, datum transformation, vector base.DOI: 10.3722/cadaps.2012.289-305
1 INTRODUCTION
The quality of a product is governed by its precision which is controlled by the tolerance specification.A measuring strategy is needed to ensure satisfaction of the tolerance specification. The properassignment of datum in the product engineering drawing is of paramount importance to guaranteeeffective dimensional and geometric tolerance evaluation in the measurement process. Thisrequirement becomes even more prevalent when multiple datums are used in an assembly. Each parthas its own individual datum assignment and the geometric relationship between these datums dictatethe fitting of the parts and the eventual precision of the assembled unit. The fulfillment ofdimensional and tolerance specification for individual parts does not guarantee the fulfillment oftolerance requirements for the assembled unit.
This research has proposed a method to enhance the current inspection strategy and to establish alink between design and inspection. Based on dimensioning and tolerancing of geometric models,“Vector Based Datum Transformation Scheme” can provide a formulized methodology to define a“Common Measuring Datum” for each assembly part. This datum is correlative to the function of finalapplication. Inside the proposed scheme exist two major components to identify the assembly relationbetween each assembled parts with “Assembly Mating Map”, which can define a clear assembly mating
Computer-Aided Design & Applications, 9(3), 2012, 289-305© 2012 CAD Solutions, LLC, http://www.cadanda.com
290
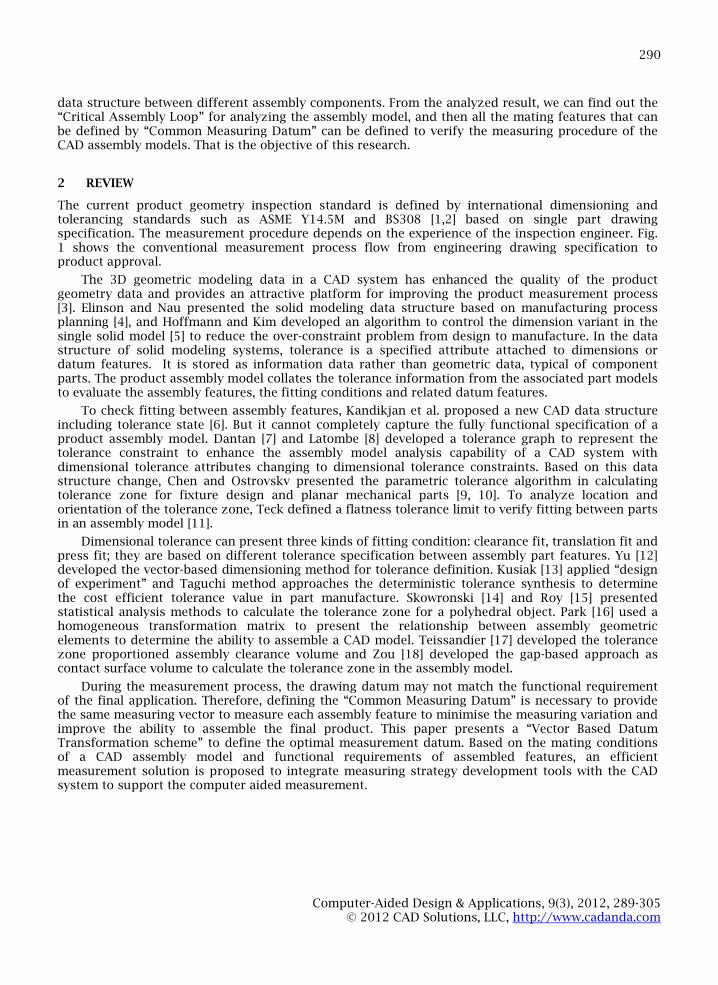
data structure between different assembly components. From the analyzed result, we can find out the“Critical Assembly Loop” for analyzing the assembly model, and then all the mating features that canbe defined by “Common Measuring Datum” can be defined to verify the measuring procedure of theCAD assembly models. That is the objective of this research.
2 REVIEW
The current product geometry inspection standard is defined by international dimensioning andtolerancing standards such as ASME Y14.5M and BS308 [1,2] based on single part drawingspecification. The measurement procedure depends on the experience of the inspection engineer. Fig.1 shows the conventional measurement process flow from engineering drawing specification toproduct approval.
The 3D geometric modeling data in a CAD system has enhanced the quality of the productgeometry data and provides an attractive platform for improving the product measurement process[3]. Elinson and Nau presented the solid modeling data structure based on manufacturing processplanning [4], and Hoffmann and Kim developed an algorithm to control the dimension variant in thesingle solid model [5] to reduce the over-constraint problem from design to manufacture. In the datastructure of solid modeling systems, tolerance is a specified attribute attached to dimensions ordatum features. It is stored as information data rather than geometric data, typical of componentparts. The product assembly model collates the tolerance information from the associated part modelsto evaluate the assembly features, the fitting conditions and related datum features.
To check fitting between assembly features, Kandikjan et al. proposed a new CAD data structureincluding tolerance state [6]. But it cannot completely capture the fully functional specification of aproduct assembly model. Dantan [7] and Latombe [8] developed a tolerance graph to represent thetolerance constraint to enhance the assembly model analysis capability of a CAD system withdimensional tolerance attributes changing to dimensional tolerance constraints. Based on this datastructure change, Chen and Ostrovskv presented the parametric tolerance algorithm in calculatingtolerance zone for fixture design and planar mechanical parts [9, 10]. To analyze location andorientation of the tolerance zone, Teck defined a flatness tolerance limit to verify fitting between partsin an assembly model [11].
Dimensional tolerance can present three kinds of fitting condition: clearance fit, translation fit andpress fit; they are based on different tolerance specification between assembly part features. Yu [12]developed the vector-based dimensioning method for tolerance definition. Kusiak [13] applied “designof experiment” and Taguchi method approaches the deterministic tolerance synthesis to determinethe cost efficient tolerance value in part manufacture. Skowronski [14] and Roy [15] presentedstatistical analysis methods to calculate the tolerance zone for a polyhedral object. Park [16] used ahomogeneous transformation matrix to present the relationship between assembly geometricelements to determine the ability to assemble a CAD model. Teissandier [17] developed the tolerancezone proportioned assembly clearance volume and Zou [18] developed the gap-based approach ascontact surface volume to calculate the tolerance zone in the assembly model.
During the measurement process, the drawing datum may not match the functional requirementof the final application. Therefore, defining the “Common Measuring Datum” is necessary to providethe same measuring vector to measure each assembly feature to minimise the measuring variation andimprove the ability to assemble the final product. This paper presents a “Vector Based DatumTransformation scheme” to define the optimal measurement datum. Based on the mating conditionsof a CAD assembly model and functional requirements of assembled features, an efficientmeasurement solution is proposed to integrate measuring strategy development tools with the CADsystem to support the computer aided measurement.

Computer-Aided Design & Applications, 9(3), 2012, 289-305© 2012 CAD Solutions, LLC, http://www.cadanda.com
291
3 PROPOSED FRAMEWORK
The design intent of a product assembly is best reflected by the assignment of tolerances, dimensionalor geometric, and the level of tolerances. The degree of precision associated with the toleranceassignment serves as a clear indicator of the priority of the geometric entity in the functionalperformance of the product assembly. “Vector Based Datum Transformation scheme” is aimed atsetting up a consistent measurement requirement to ensure the performance for a product assemblyto fully reflect its design intent.
Fig. 2 shows the process flow chart to select the “Common Measuring Datum”using the assemblyinformation and the related dimension and tolerance information to create a table for selecting amating feature of each assembly part, uses all the mating features of the assembly model to constructthe “Assembly Mating Map”. Referring to the analyzed results we can identify the “Critical AssemblyLoop” is selected by considering the functional requirement of the product.
The assembly feature inside the “Critical Assembly Loop” is a potential “Common MeasuringDatum” of each assembly part. It is a major research objective of this paper to define “CommonMeasuring Datum” to have a mating linkage between different assembly parts. All positioningdimensions are referenced to critical assembly loop features to measure all the dimension values.
Measurement criteria(Engineering drawing)
Setup a measurementenvironment
Define Datum
Measuring processcontrol
Data analysis(based on
designspecification)
Parts rework(Machining)
Assembly department
Refer to Engineering andproduction specification
Part setupOrientation
FixtureSystem
M/C
Reject
Accept
Part GeometriesMeasurementRequirement
MeasuringProcedure
Measuringcondition
Fig. 1: Traditional measurement process flow and control.

Computer-Aided Design & Applications, 9(3), 2012, 289-305© 2012 CAD Solutions, LLC, http://www.cadanda.com
292
3.1 Assembly Mating Map
Before creating the “Assembly Mating Map”, the first task is to construct the “Dimension andTolerance Table”. This is used for identifying each feature of the individual assembled parts. Thistable includes feature ID of each geometry feature, dimension, tolerance specification, design datumand mating information. Refer to the construction information, to select all related assembly geometryfeatures to prepare data to create an “Assembly Mating Map”.
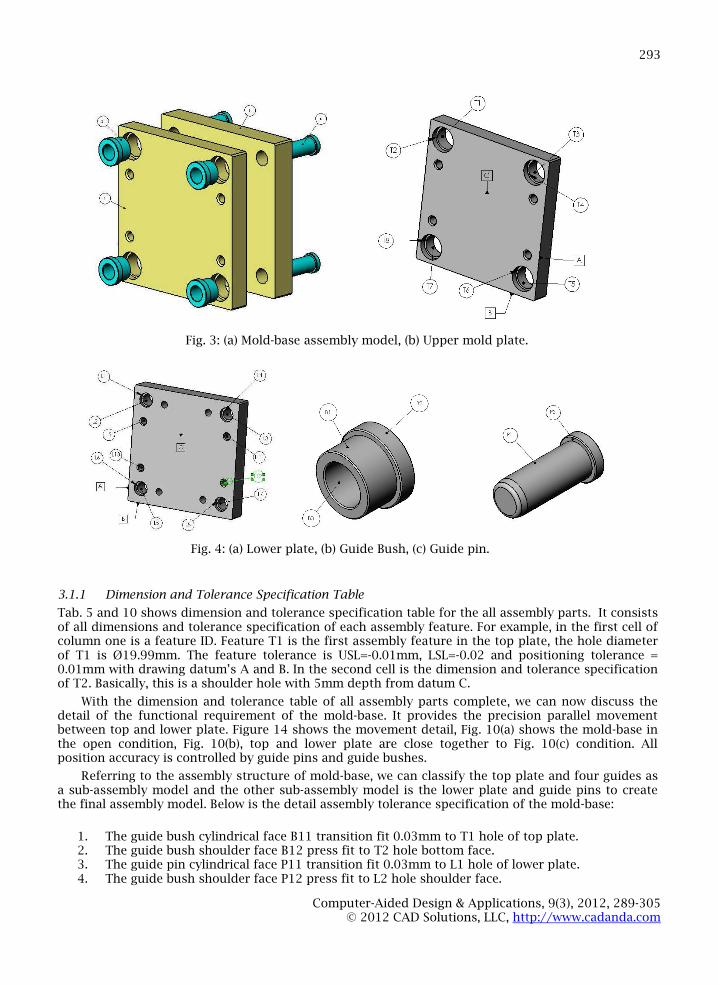
To further illustrate the function of “Assembly Mating Map”, a typical example is given todemonstrate the critical assembly loop selection using “Assembly Mating Map” in a mechanicalassembly product. Fig. 3(a) shows a mold-base assembly model for this case study and fig. 3(b) and4(a)~(c) shows all the assembly parts as 3D models and includes feature ID and design datum. In thecase study, there is a total of twenty-two assembly features related to the assembly process and therequired quantity of all assembly parts as follows:
1. Top plate X 1pc2. Guide bush X 4pcs3. Lower plate X 1pcs4. Guide pin X 4pcs
Create a dimension andtolerance table for each
assembly part
Selecting allassemblyfeatures
Construct assemblyMating Map
The part is not forassembly
Select the bestassembly loop
Selecting theCritical
assemblyloop
Select the CriticalAssembly Part
Define the commonmeasuring Datum
Fig. 2: Process flow chart of Vector Based Datum Transformation Scheme.
Computer-Aided Design & Applications, 9(3), 2012, 289-305© 2012 CAD Solutions, LLC, http://www.cadanda.com
293
3.1.1 Dimension and Tolerance Specification Table
Tab. 5 and 10 shows dimension and tolerance specification table for the all assembly parts. It consistsof all dimensions and tolerance specification of each assembly feature. For example, in the first cell ofcolumn one is a feature ID. Feature T1 is the first assembly feature in the top plate, the hole diameterof T1 is Ø19.99mm. The feature tolerance is USL=-0.01mm, LSL=-0.02 and positioning tolerance =0.01mm with drawing datum’s A and B. In the second cell is the dimension and tolerance specificationof T2. Basically, this is a shoulder hole with 5mm depth from datum C.
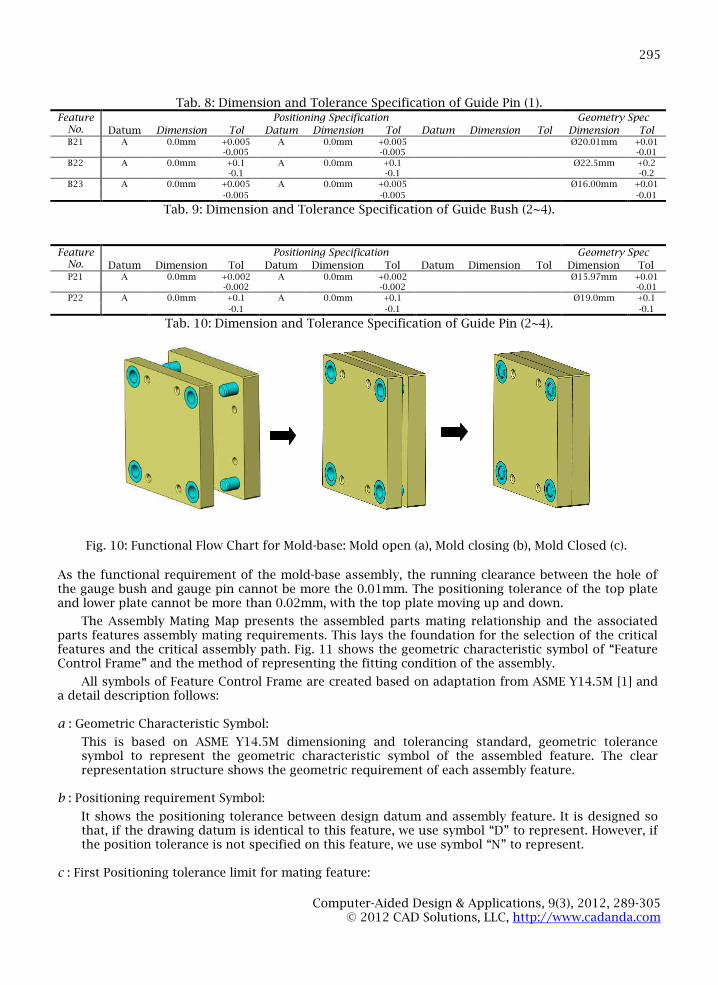
With the dimension and tolerance table of all assembly parts complete, we can now discuss thedetail of the functional requirement of the mold-base. It provides the precision parallel movementbetween top and lower plate. Figure 14 shows the movement detail, Fig. 10(a) shows the mold-base inthe open condition, Fig. 10(b), top and lower plate are close together to Fig. 10(c) condition. Allposition accuracy is controlled by guide pins and guide bushes.
Referring to the assembly structure of mold-base, we can classify the top plate and four guides asa sub-assembly model and the other sub-assembly model is the lower plate and guide pins to createthe final assembly model. Below is the detail assembly tolerance specification of the mold-base:
1. The guide bush cylindrical face B11 transition fit 0.03mm to T1 hole of top plate.2. The guide bush shoulder face B12 press fit to T2 hole bottom face.3. The guide pin cylindrical face P11 transition fit 0.03mm to L1 hole of lower plate.4. The guide bush shoulder face P12 press fit to L2 hole shoulder face.
Fig. 3: (a) Mold-base assembly model, (b) Upper mold plate.
Fig. 4: (a) Lower plate, (b) Guide Bush, (c) Guide pin.

Computer-Aided Design & Applications, 9(3), 2012, 289-305© 2012 CAD Solutions, LLC, http://www.cadanda.com
294
FeatureNo.
Positioning Specification Geometry Spec
Datum Dimension Tol Datum Dimension Tol Datum Dimension Tol Dimension TolT1 A 175.0mm +0.01 B 175.0mm +0.01 Ø19.99mm -0.01
-0.01 -0.01 -0.02
T2 A 175.0mm +0.1 B 175.0mm +0.1 C 5.0mm +0.05 Ø23.00mm +0.2-0.1 -0.1 -0.05 +0.1
T3 A 25.0mm +0.01 B 175.0mm +0.01 Ø19.99mm -0.01-0.01 -0.01 -0.02
T4 A 25.0mm +0.1 B 175.0mm +0.1 C 5.0mm +0.05 Ø23.00mm +0.2-0.1 -0.1 -0.05 +0.1
T5 A 25.0mm +0.01 B 25.0mm +0.01 Ø19.99mm -0.01-0.01 -0.01 -0.02
T6 A 25.0mm +0.1 B 25.0mm +0.1 C 5.0mm +0.05 Ø23.00mm +0.2-0.1 -0.1 -0.05 +0.1
T7 A 175.0mm +0.01 B 25.0mm +0.01 Ø19.99mm -0.01-0.01 -0.01 -0.02
T8 A 175.0mm +0.1 B 25.0mm +0.1 C 5.0mm +0.05 Ø23.00mm +0.2
-0.1 -0.1 -0.05 +0.1
Tab. 5: Dimension and Tolerance Specification of Top Plate.
FeatureNo.
Positioning Specification Geometry Spec
Datum Dimension Tol Datum Dimension Tol Datum Dimension Tol Dimension TolL1 A 25.0mm +0.01 B 175.0mm +0.01 Ø15.98mm +0.01
-0.01 -0.01 -0.01
L2 A 25.0mm +0.1 B 175.0mm +0.1 C 3.1mm +0.05 Ø19.20mm +0.2-0.1 -0.1 -0.05 -0.2
L3 A 175.0mm +0.01 B 175.0mm +0.01 Ø15.98mm +0.01-0.01 -0.01 -0.01
L4 A 175.0mm +0.1 B 175.0mm +0.1 C 3.1mm +0.05 Ø19.20mm +0.2-0.1 -0.1 -0.05 -0.2
L5 A 175.0mm +0.01 B 25.0mm +0.01 Ø15.98mm +0.01-0.01 -0.01 -0.01
L6 A 175.0mm +0.1 B 25.0mm +0.1 C 3.1mm +0.05 Ø19.20mm +0.2-0.1 -0.1 -0.05 -0.2
L7 A 25.0mm +0.01 B 25.0mm +0.01 Ø15.98mm +0.01-0.01 -0.01 -0.01
L8 A 25.0mm +0.1 B 25.0mm +0.1 C 3.1mm +0.05 Ø19.20mm +0.2-0.1 -0.1 -0.05 -0.2
L9 A 20.0mm +0.05 B 180.0mm Ø10.05mm +0.02-0.05 -0.02
L10 A 20.0mm +0.05 B 180.0mm Ø10.05mm +0.02-0.05 -0.02
L11 A 20.0mm +0.05 B 180.0mm Ø10.05mm +0.02-0.05 -0.02
L12 A 20.0mm +0.05 B 180.0mm Ø10.05mm +0.02
-0.05 -0.02
Tab. 6: Dimension and Tolerance Specification of Lower Plate.
FeatureNo.
Positioning Specification Geometry Spec
Datum Dimension Tol Datum Dimension Tol Datum Dimension Tol Dimension TolB11 A 0.0mm +0.005 A 0.0mm +0.005 Ø20.01mm +0.01
-0.005 -0.005 -0.01
B12 A 0.0mm +0.1 A 0.0mm +0.1 Ø22.5mm +0.2-0.1 -0.1 -0.2
B13 A 0.0mm +0.005 A 0.0mm +0.005 Ø17.00mm +0.01
-0.005 -0.005 -0.01
Tab. 7: Dimension and Tolerance Specification of Guide Bush (1).
FeatureNo.
Positioning Specification Geometry Spec
Datum Dimension Tol Datum Dimension Tol Datum Dimension Tol Dimension TolP11 A 0.0mm +0.002 A 0.0mm +0.002 Ø16.97mm +0.01
-0.002 -0.002 -0.01
P12 A 0.0mm +0.1 A 0.0mm +0.1 Ø19.0mm +0.1
-0.1 -0.1 -0.1
Computer-Aided Design & Applications, 9(3), 2012, 289-305© 2012 CAD Solutions, LLC, http://www.cadanda.com
295
Tab. 8: Dimension and Tolerance Specification of Guide Pin (1).Feature
No.Positioning Specification Geometry Spec
Datum Dimension Tol Datum Dimension Tol Datum Dimension Tol Dimension TolB21 A 0.0mm +0.005 A 0.0mm +0.005 Ø20.01mm +0.01
-0.005 -0.005 -0.01
B22 A 0.0mm +0.1 A 0.0mm +0.1 Ø22.5mm +0.2-0.1 -0.1 -0.2
B23 A 0.0mm +0.005 A 0.0mm +0.005 Ø16.00mm +0.01
-0.005 -0.005 -0.01
Tab. 9: Dimension and Tolerance Specification of Guide Bush (2~4).
FeatureNo.
Positioning Specification Geometry Spec
Datum Dimension Tol Datum Dimension Tol Datum Dimension Tol Dimension TolP21 A 0.0mm +0.002 A 0.0mm +0.002 Ø15.97mm +0.01
-0.002 -0.002 -0.01
P22 A 0.0mm +0.1 A 0.0mm +0.1 Ø19.0mm +0.1
-0.1 -0.1 -0.1
Tab. 10: Dimension and Tolerance Specification of Guide Pin (2~4).
As the functional requirement of the mold-base assembly, the running clearance between the hole ofthe gauge bush and gauge pin cannot be more the 0.01mm. The positioning tolerance of the top plateand lower plate cannot be more than 0.02mm, with the top plate moving up and down.
The Assembly Mating Map presents the assembled parts mating relationship and the associatedparts features assembly mating requirements. This lays the foundation for the selection of the criticalfeatures and the critical assembly path. Fig. 11 shows the geometric characteristic symbol of “FeatureControl Frame” and the method of representing the fitting condition of the assembly.
All symbols of Feature Control Frame are created based on adaptation from ASME Y14.5M [1] anda detail description follows:
a : Geometric Characteristic Symbol:
This is based on ASME Y14.5M dimensioning and tolerancing standard, geometric tolerancesymbol to represent the geometric characteristic symbol of the assembled feature. The clearrepresentation structure shows the geometric requirement of each assembly feature.
b : Positioning requirement Symbol:
It shows the positioning tolerance between design datum and assembly feature. It is designed sothat, if the drawing datum is identical to this feature, we use symbol “D” to represent. However, ifthe position tolerance is not specified on this feature, we use symbol “N” to represent.
c : First Positioning tolerance limit for mating feature:
Fig. 10: Functional Flow Chart for Mold-base: Mold open (a), Mold closing (b), Mold Closed (c).

Computer-Aided Design & Applications, 9(3), 2012, 289-305© 2012 CAD Solutions, LLC, http://www.cadanda.com
296
The first positioning tolerance limit of the relevant feature.d : Second position tolerance limit for mating feature:
The second positioning tolerance limit of the relevant feature.
e : Feature Number:
An assigned number to identify each assembly feature for each assembled part.
f : First Positioning tolerance limit for mating feature:
The first positioning tolerance limit of the relevant feature.
g : Second position tolerance limit for mating feature:
The second positioning tolerance limit of the relevant feature.
h : Mating part name:
The part name for the assembled feature.
i : Mating Feature ID:
The feature ID for assembled feature.
j : Fitting requirement:
The fit requirement for the assembly feature; we use letter “C” to represent clearance fit, “P” torepresent press fit and “T” to present transition fit.
g
Mating partname
Geometric CharacteristicSymbol
Refer ASME Y14.5M
First PositioningRequirement
Feature Datum
D = Drawing DatumN = None Positiontolerance specification
Feature Number
Upper PositioningTolerance Limit
Lower PositioningTolerance Limit
Fig. 11: Symbol for Assembly Mating Map to represent assembly mating relationship.
b c d e f h i
Matingfeature ID
Fitting requirement
C = Clearance fitP = Press fitT = Transition fit
j
Second PositioningRequirement
a
Computer-Aided Design & Applications, 9(3), 2012, 289-305© 2012 CAD Solutions, LLC, http://www.cadanda.com
297
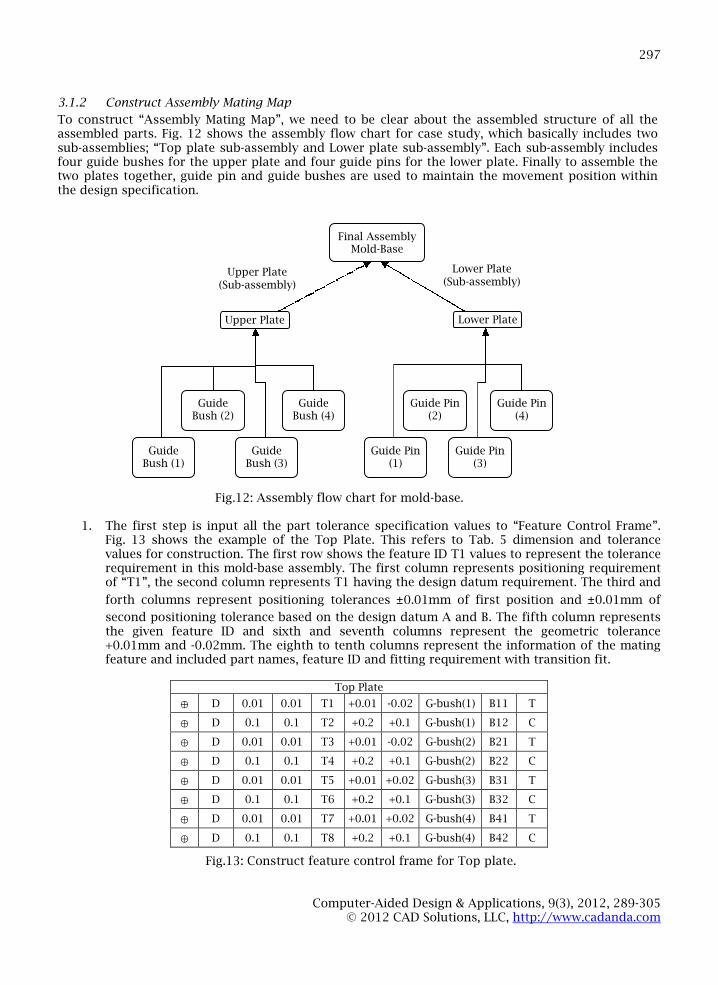
3.1.2 Construct Assembly Mating Map
To construct “Assembly Mating Map”, we need to be clear about the assembled structure of all theassembled parts. Fig. 12 shows the assembly flow chart for case study, which basically includes twosub-assemblies; “Top plate sub-assembly and Lower plate sub-assembly”. Each sub-assembly includesfour guide bushes for the upper plate and four guide pins for the lower plate. Finally to assemble thetwo plates together, guide pin and guide bushes are used to maintain the movement position withinthe design specification.
1. The first step is input all the part tolerance specification values to “Feature Control Frame”.Fig. 13 shows the example of the Top Plate. This refers to Tab. 5 dimension and tolerancevalues for construction. The first row shows the feature ID T1 values to represent the tolerancerequirement in this mold-base assembly. The first column represents positioning requirementof “T1”, the second column represents T1 having the design datum requirement. The third and
forth columns represent positioning tolerances ±0.01mm of first position and ±0.01mm of
second positioning tolerance based on the design datum A and B. The fifth column representsthe given feature ID and sixth and seventh columns represent the geometric tolerance+0.01mm and -0.02mm. The eighth to tenth columns represent the information of the matingfeature and included part names, feature ID and fitting requirement with transition fit.
Top Plate
⊕ D 0.01 0.01 T1 +0.01 -0.02 G-bush(1) B11 T
⊕ D 0.1 0.1 T2 +0.2 +0.1 G-bush(1) B12 C
⊕ D 0.01 0.01 T3 +0.01 -0.02 G-bush(2) B21 T
⊕ D 0.1 0.1 T4 +0.2 +0.1 G-bush(2) B22 C
⊕ D 0.01 0.01 T5 +0.01 +0.02 G-bush(3) B31 T
⊕ D 0.1 0.1 T6 +0.2 +0.1 G-bush(3) B32 C
⊕ D 0.01 0.01 T7 +0.01 +0.02 G-bush(4) B41 T
⊕ D 0.1 0.1 T8 +0.2 +0.1 G-bush(4) B42 C
Fig.12: Assembly flow chart for mold-base.
Fig.13: Construct feature control frame for Top plate.
Lower Plate(Sub-assembly)
Upper Plate(Sub-assembly)
GuideBush (1)
GuideBush (2)
GuideBush (3)
GuideBush (4)
Guide Pin(1)
Guide Pin(2)
Guide Pin(3)
Guide Pin(4)
Upper Plate Lower Plate
Final AssemblyMold-Base

Computer-Aided Design & Applications, 9(3), 2012, 289-305© 2012 CAD Solutions, LLC, http://www.cadanda.com
298
2. After finishing the ”Feature Control Frame” for each assembled part, the second step is togroup the “Feature Control Frame” for each sub-assembly parts together and use a solid-line tolink each mating feature. Fig. 14 shows the construction result of “Feature Control Frame” fortop plate and four guide bushes Sub-Assembly. Inside the “Feature Control Frame” is shownsome of the assembly features using a solid-line to link the mating feature of other assembledparts. For example: the guide bush feature ID B11 is mating to the top plate T1 feature withtransition fit. The benefit of this is that we clearly see the assembly data structure of each sub-assembly parts, included the fitting condition and tolerance specification of each assemblyfeature.
3. The final step to construct “Assembly Mating Map” integrate all “Feature Control Frame”together and use a solid-line to link the relating mating features. Then evaluate the “CriticalAssembly Loop” before moving forward to establish the common measuring datum. Fig. 15shows the “Assembly Mating Map” for mold-base case study. Basically, this contains two sub-assembly parts and four important mating features shown with a red solid-line. It should be apotential “Critical Assembly Loop” feature for the next step evaluation.
Fig. 14: Feature Control Frame for Top Plate and four guide bushes Sub-Assembly.

Computer-Aided Design & Applications, 9(3), 2012, 289-305© 2012 CAD Solutions, LLC, http://www.cadanda.com
299
3.1.3 Critical Assembly Loop Selection
As a result of the “Assembly Mating Map”, all assembled components have features mating to anotherassembled component. Some mating structures are closed loops in the “Assembly Mating Map”. This isa potentially Critical Assembly Loop in this assembly model, identifying the critical assembly loop ofthis assembly model. “Total Tolerance Differential Variation Algorithm” is proposed to identify theselection of the “Critical Assembly Loop”.
In selection of the Critical Assembly Loop of the assembled model, we use “Total Tolerance
Differential Variation algorithm” to calculate the total tolerance variation of each assembly loop
features. The “Critical Assembly loop” would be the minimum value of Tdf(n)
.
The equation structure “Total Tolerance Differential Variation Algorithm” is calculated from the
feature radial ”Df(n)
” of between tolerance range “Tq(n)
” and feature dimension “Df(n)
”, then sum all
feature radial “TDf(n)
” with equation (3). The minimum value of “TDf(n)
” is the “Critical Assembly Loop”.
Fig. 15: Assembly Mating Map for Mold-Base.
Computer-Aided Design & Applications, 9(3), 2012, 289-305© 2012 CAD Solutions, LLC, http://www.cadanda.com
300
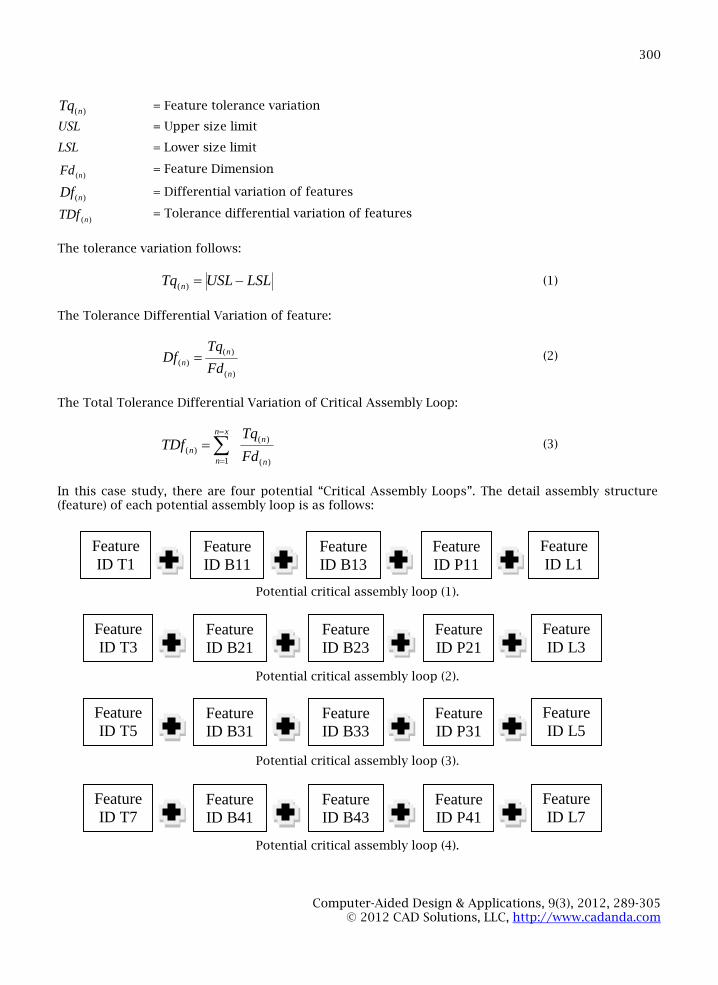
)(nTq = Feature tolerance variation
USL = Upper size limit
LSL = Lower size limit
)(nFd = Feature Dimension
)(nDf = Differential variation of features
)(nTDf = Tolerance differential variation of features
The tolerance variation follows:
LSLUSLTq n )( (1)
The Tolerance Differential Variation of feature:
)(
)(
)(
n
n
nFd
TqDf (2)
The Total Tolerance Differential Variation of Critical Assembly Loop:
)(
)(
1)(
n
nxn
nn
Fd
TqTDf
(3)
In this case study, there are four potential “Critical Assembly Loops”. The detail assembly structure(feature) of each potential assembly loop is as follows:
Potential critical assembly loop (1).
Potential critical assembly loop (2).
Potential critical assembly loop (3).
Potential critical assembly loop (4).
FeatureID T1
FeatureID B11
FeatureID B13
FeatureID P11
FeatureID L1
FeatureID T7
FeatureID B41
FeatureID B43
FeatureID P41
FeatureID L7
FeatureID T5
FeatureID B31
FeatureID B33
FeatureID P31
FeatureID L5
FeatureID T3
FeatureID B21
FeatureID B23
FeatureID P21
FeatureID L3

Computer-Aided Design & Applications, 9(3), 2012, 289-305© 2012 CAD Solutions, LLC, http://www.cadanda.com
301
Refer to required features dimensioning and tolerancing values of four potential “Critical AssemblyLoops”. We substitute those data to equation (3) “Total Tolerance Differential Variation Algorithm” tocalculate each TDF value and select the minimum value of “Critical Assembly Loop”.
Calculating the result and comparing with the result of all the TDF values, Critical Assembly Loop(1) is minimum value “0.04977” (Tab. 16), therefore the feature ID “T1” for top plate, “B11” or “B13”for Guide Bush, “P11” for Guide pin and “L1” for lower plate is the “Common Measuring Datum” ofeach assembled part.
Feature ID USL LSL Tq Fd TDf
T1 -0.01 -0.02 0.01 19.99 0.0005
B11 0.01 -0.01 0.02 16.97 0.001252
B13 0.01 -0.01 0.02 17.00 0.00125
P11 0.01 -0.01 0.02 15.97 0.001252
L1 0.01 -0.01 0.02 23 0.00087
TDf(n) 0.004977
Feature ID USL LSL Tq Fd TDf
T3 -0.01 -0.02 0.01 19.99 0.0005
B21 0.01 -0.01 0.02 15.97 0.001252
B23 0.01 -0.01 0.02 16.00 0.00125
P21 0.01 -0.01 0.02 15.97 0.001252
L3 0.01 -0.01 0.02 23 0.00087
TDf(n) 0.005125
Feature ID USL LSL Tq Fd TDf
T5 -0.01 -0.02 0.01 19.99 0.0005
B31 0.01 -0.01 0.02 15.97 0.001252
B33 0.01 -0.01 0.02 16.00 0.00125
P31 0.01 -0.01 0.02 15.97 0.001252
L5 0.01 -0.01 0.02 23 0.00087
TDf(n) 0.005125
Feature ID USL LSL Tq Fd TDf
T5 -0.01 -0.02 0.01 19.99 0.0005
B31 0.01 -0.01 0.02 15.97 0.001252
B33 0.01 -0.01 0.02 16.00 0.00125
P31 0.01 -0.01 0.02 15.97 0.001252
L5 0.01 -0.01 0.02 23 0.00087
TDf(n) 0.005125
Tab. 16: TDf calculated result of Potential Critical Assembly Loop (1).
Tab. 17: TDf calculated result of Potential Critical Assembly Loop (2).
Tab. 18: TDf calculated result of Potential Critical Assembly Loop (3).
Tab. 19: TDf calculated result of Potential Critical Assembly Loop (4).

Computer-Aided Design & Applications, 9(3), 2012, 289-305© 2012 CAD Solutions, LLC, http://www.cadanda.com
302
4 CRITICAL ASSEMBLY PART SELECTION
Normally in a mechanical product, some components have impact on the functional result. Differentprecision areas can be devised to represent this. But, not all the assembled components have impacton the final result, which is the critical component of this product and is important to themanufacturing decision making of industry. The final part of “Vector Based Datum Transformationscheme” uses a calculating method to find the “Critical Assembly Part” to define a measurementstrategy in the manufacturing process.
Inside the “Critical Assembly Loop”, one assembly component would be the “Critical AssemblyPart”, therefore we consider all related assembly features of each assembly part of the dimensioning
and feature tolerance to calculate the “Critical Assembly Part”. Equation (7) TDpxy(n) and (8) TDfxy(n)
calculate the Total of position tolerance rate and feature tolerance rate of each assembly part. Afterthat, we use equation (9) to find out the total rate of “CAP”.
Finally, selection of the assembly part with minimum “CAP” value is a “Critical Assembly Part” ofthe study assembly model. In this case study, the top and lower plate are potentially the “CriticalAssembly Part” and through equation (9) we calculate which parts have minimum “CAP” value withdetails shown in tab. 24 and 25.
)(nPq = Positioning tolerance variation
)(nPqx = Feature tolerance variation of X-axis
)(nPqy = Feature tolerance variation of Y-axis
)(nPd = Positioning Dimension
)(nPdx = Positioning Dimension of X-axis
)(nPdy = Positioning Dimension of Y-axis
)(nTDf = Total tolerance differential variation of feature
)(nTDp = Total position tolerance differential variation
)(nTDpx = Total position tolerance differential variation of X-axis
)(nTDpy = Total position tolerance differential variation of Y-axis
)(nTDpxy = Total positioning tolerance differential variation of two-dimension
)(nTDfxy = Total features tolerance differential variation of two-dimension
Fn = Number of feature in the assembled component
CAP = Critical Assembly Part
The Tolerance Differential Variation of position:
)(
)(
)(
n
n
nPd
PqTDp (4)

Computer-Aided Design & Applications, 9(3), 2012, 289-305© 2012 CAD Solutions, LLC, http://www.cadanda.com
303
Position tolerance Differential Variation of X-axis:
)(
)(
)(
n
n
nPdx
PqxTDpx (5)
Position tolerance Differential Variation of Y-axis:
)(
)(
)(
n
n
nPdy
PqyTDpy (6)
Total positioning tolerance Differential Variation of two-dimension:
)(
)(
)(
)(
)(
n
n
n
n
nPdy
Pqy
Pdx
PqxTDpxy (7)
Total features tolerance Differential Variation of two-dimension:
)(
)(
)(
)(
)(
n
n
n
n
nFdy
Tqy
Fdx
TqxTDfxy (8)
The “Critical Assembly Part” is defined by:
Fn
TDfxyTDpxy
CAP
xn
nn
xn
nn
1)(
1)(
(9)
Tab. 20 and 21 use “Vector Based Differential Tolerance Variation algorithm” to find out “CriticalAssembly Part” in this study. Referring to the calculated result, the Top Plate is minimum CAP value0.0002013 compared with the Lower Plate CAP 0.0002284. Therefore, the Top Plate is the “CriticalAssembly Part” in this case study.
Feature No. TDfxy TDpxy
T1 2.5025E-07 1.30612E-08T2 1.89036E-05 1.30612E-08T3 2.5025E-07 9.14286E-08T4 1.89036E-05 9.14286E-08T5 2.5025E-07 0.00000064T6 1.89036E-05 0.000064T7 2.5025E-07 9.14286E-08T8 1.89036E-05 9.14286E-08
Sum 7.66154E-05 8.44278E-05CAP 0.0002013
Tab. 20: Calculate the Critical Assembly Part for Top Plate.

Computer-Aided Design & Applications, 9(3), 2012, 289-305© 2012 CAD Solutions, LLC, http://www.cadanda.com
304
Feature No. TDfxy TDpxy
T1 1.56641E-06 9.14286E-08T2 0.000434028 9.14286E-08T3 1.56641E-06 1.30612E-08T4 0.000434028 1.30612E-08T5 1.56641E-06 9.14286E-08T6 0.000434028 9.14286E-08T7 1.56641E-06 0.00000064T8 0.000434028 0.000064
Sum 0.001742377 8.44278E-05CAP 0.0002284
Tab. 21: Calculate the Critical Assembly Part value of Lower plate.
5 CONCLUSION
In a common product development cycle, design, manufacturing, inspection and assembly are thecritical functional activities. The current research focuses on establishing the data communicationlinkage between different stages. Therefore, CAD/CAM/CAE systems can be used to support productdesign and manufacturing. In this proposal, “Vector Based Differential Tolerance Variation scheme” isproposed to develop an enhanced measuring and manufacturing strategy in order to improve thetolerancing control and ability to assemble a final product. The following are the major contributionsof this research:
Standardized methodology in defining the measuring strategy to stabilize quality controlprocedures and minimize human mistakes is proposed. The defined common datum relates tothe function of product application.
An efficient assembly data structure representation scheme to include the fitting anddimensioning and tolerancing requirement of assembled parts is proposed.
Using “Assembly Mating Map” and “Vector Based Differential Tolerance Variation Scheme” candefine the “Critical Assembly Loop” and “Critical Assembly Part” systematically, which is basedon the dimensioning and tolerancing functional applications to develop measuring andproduction process planning in order to increase the ability to assemble a final product.
Proposed scheme is sutable for regular object in define the measuring strategy. The non-regular feature, such as freeform object would be for development in future research.
6 REFERENCES
[1] The American Society of Mechanical Engineers, ASME Y14.5M-1994 Dimensioning andTolerancing, 1994.
[2] British Standards Institution, BS308-1-1993 Geometrical tolerancing, 1993.[3] Griffith, G. K.: Geometric dimensioning and tolerancing: applications and inspection, Prentice
Hall, 2002.[4] Alexei, E.; Dana, S. N.: Feature base Similarity Assessment of Solid Models, ACM symposium on
solid modeling an application, 1997.[5] Hoffmann, C. M.; Kim, J. J.: Toward valid Parametric CAD model, Computer Aided Design 33,
2001, 81-90.[6] Kandikjan, T.; Shah, J. J.; Davidson, K.: A mechanism for validating dimensioning and tolerancing
schemes in CAD systems, Computer Aided Design 33, 2001, 721-735.
Computer-Aided Design & Applications, 9(3), 2012, 289-305© 2012 CAD Solutions, LLC, http://www.cadanda.com
305
[7] Dantan, J. Y.; Mathieu, L.; Ballu, A.; Martin, P.: Tolerance synthesis: quantifier notion and virtualboundary, Computer Aided Design 37, 2005, 231-240.
[8] Latombe, J. C.; Wilson, R. H.; Cazals, F.: Assembly sequencing with toleranced parts, ComputerAided Design, 29, 1997, 159-174.
[9] Chen, F. I.; n Goldberg, K.; Overmars, M. H.; Halperin, Dan,;. Bohringer, Karl. F.; Zhuang, Yan,:Computing tolerance Parameters for Fixturing and feeding, Assembly Automation, 22(2),2002,163-172.
[10] Berman, Y. O.; Joskowicz, L.: Tolerance envelopes of planar mechanical parts with parametrictolerance, Computer Aided Design 37, 2005, 531-544.
[11] Teck, T. B.; Kumar, S. A.; Subramanian, V.: A CAD integrated analysis of flatness in a formTolerance zone, Computer Aided Design, 33, 2001, 853-865.
[12] YU, K. M.; TAN, S. T.; YUEN, M. F.: A review of automatic dimensioning and tolerancing schemes,Engineering with Computers 10, 1994, 63-80.
[13] Kusiak, A.; Feng, C. X.: Deterministic tolerance synthesis: a comparative study, Computer AidedDesign 27, 1995, 759-768.
[14] Skowronski, V. J.; Turner, J. U.; Using Monte-Carlo variance reduction in statistical tolerancesynthesis, Computer Aided Design 29, 1997, 53-69.
[15] Roy, U.; Li, B.: Representation and interpretation of geometric tolerance for Polyhedral objects-1.form tolerance, Computer Aided Design 33, 1998, 151~161.
[16] Park, S. H.; Lee, K. W.: Verification of assimilability between toleranced parts, Computer AidedDesign 30, 1998, 95-104.
[17] Teissandier, D.; Couétard, Y.; Gérard, A.: A computer aided tolerancing model: proportionedassembly clearance volume, Computer Aided Design 31, 1999, 805-817.
[18] Zou, Z.; Morse, E. P.: A gap-based approach to capture fitting condition for mechanical assembly,Computer Aided Design 36, 2004, 691-700.