vascular study group of new england - the vascular … study group of new england 15th semi-annual...
TRANSCRIPT

Vascular Study Group of New England
15th Semi-Annual Meeting
October 28, 2010
Dartmouth-Hitchcock Medical Center
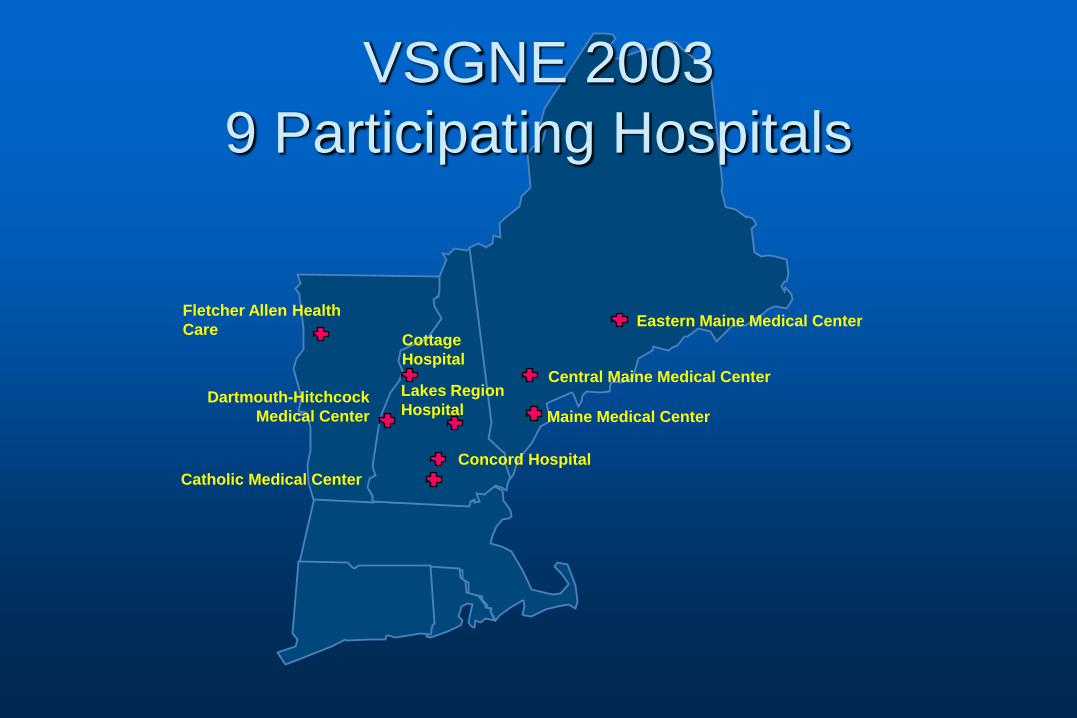
Dartmouth-Hitchcock
Medical Center
Fletcher Allen Health
Care Eastern Maine Medical Center
Maine Medical Center
Catholic Medical Center
Concord Hospital
Lakes Region
Hospital
Cottage
Hospital Central Maine Medical Center
VSGNE 2003
9 Participating Hospitals
Dartmouth-Hitchcock
Medical Center
Fletcher Allen
Health Care
Eastern Maine Medical Center
Maine Medical Center
Catholic Medical Center
Concord Hospital
Lakes Region
Hospital
Cottage
Hospital Central Maine Medical Center
Mercy Hospital
U. Mass. Medical Center
Elliot Hospital
Tufts Medical Center Boston Medical Center
St. Francis Hospital
Massachusetts General Hospital
Rutland Regional
Medical Center
Maine General Medical Center
Caritas St. Anne’s Hospital
Yale-New Haven
Hospital
Baystate Medical Center
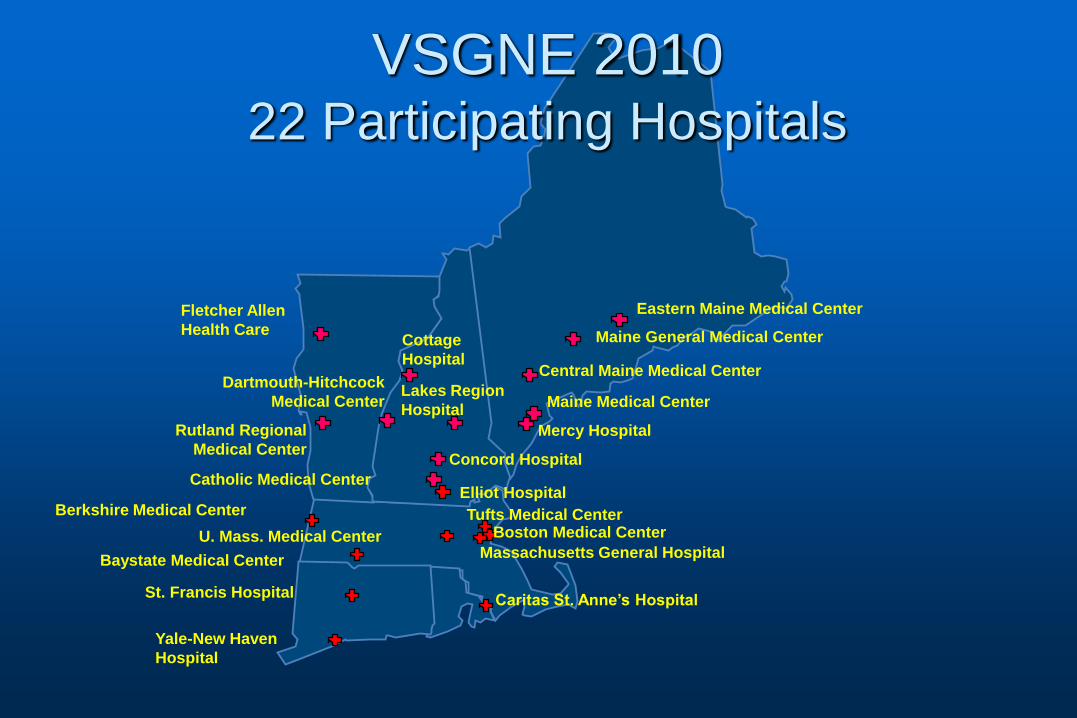
VSGNE 2010 22 Participating Hospitals
Berkshire Medical Center

Dartmouth-Hitchcock
Medical Center
Fletcher Allen
Health Care
Eastern Maine Medical Center
Maine Medical Center
Catholic Medical Center
Concord Hospital
Lakes Region
Hospital
Cottage
Hospital Central Maine Medical Center
Mercy Hospital
U. Mass. Medical Center
Elliot Hospital
Tufts Medical Center Boston Medical Center
St. Francis Hospital
Massachusetts General Hospital
Rutland Regional
Medical Center
Maine General Medical Center
Caritas St. Anne’s Hospital
Yale-New Haven
Hospital
Baystate Medical Center
VSGNE 2010 22 Participating Hospitals
Berkshire Medical Center
12 Community - 10 Academic
25 – 950 Hospital Beds
“Real World Practice”
Maine
Central Maine Medical Center, Lewiston
Pietro Guadalupi, MD
Allan M. Ingraham, MD
Mark Lanzieri, MD
Steven Levin, MD
Pamela R. Rietschel, MD
Sarat Vaddineni, MD
Eastern Maine Medical Center, Bangor
Robert A. Cambria, MD
Robert A. Clough, MD
Charles E. Dixon, MD
Larry D. Flanagan, MD
Lisa Floyd, MD
Terrance K. Fournier, MD
John W. Hallett, MD
Felix Hernandez, Jr., MD
Dennis Ng, MD
Andrew Sherwood, MD
Peter Ver Lee, MD
Maine General Medical Center, Augusta, ME
Christobal G. Alvarado, MD
Mark E. Bolduc, MD
Maine Medical Center, Portland
Georges S. Abourjaily, MD
Christopher Baker, MD
Paul H.S. Bloch, MD
Scott A. Buchanan, MD
David Burkey, MD
David Butzel, MD
Rajiv Desai, MD
Jeffrey E. Florman, MD
Neal C. Hadro, MD
Robert Hawkins, MD
Christopher Healey, MD
William E. Herbert, MD
Peter Higgins, ND
Douglas L. Jicha, MD
Jens Eldrup-Jorgensen, MD
Usman Nasir-Khan, MD
Eddie Kwan, MD
Walter Keller, DO
John Wahlig, MD
Mercy Hospital, Portland
Paul H.S. Bloch, MD
Robert Hawkins, MD
Christopher Healey, MD
William E. Herbert, MD
Jens Eldrup-Jorgensen, MD
New Hampshire
Catholic Medical Center, Manchester
Yvon Baribeau, MD
David Charlesworth, MD
William Clutterbuck, MD
Patricia Furey, MD
Patrick A. Mahon, MD
Benjamin M. Westbrook, MD
Concord Hospital, Concord
Eric Leefmans, MD
Joseph P. Meyer, MD
Richard Murphy, MD
Seth Resnicoff, MD
William Tanski, MD
Cottage Hospital, Woodsville
Christopher S. Danielson, DO
Kenneth S. Danielson, MD
Dartmouth-Hitchcock Med Ctr, Lebanon
Christopher Alessi, MD
Jack L. Cronenwett, MD
Mark F. Fillinger, MD
Philip P. Goodney, MD
Brian W. Nolan, MD
Richard J. Powell, MD
Eva M. Rzucidlo, MD
Marc C. Schermerhorn, MD
David Stone, MD
Daniel B. Walsh, MD
Mark C. Wyers, MD
Robert M. Zwolak, MD
Elliot Hospital, Manchester
Larry Hoepp, MD
William Wilson, MD
Lakes Region General Hospital, Laconia
Samuel C. Aldridge, MD
Robert Anderson, MD
Glenn Fusonie, MD
John H. Vignati, MD
Vermont
Fletcher Allen Health Care, Burlington
Julie E. Adams, MD
Daniel J. Bertges, MD
Christopher Morris, MD
Kenneth Najarian, MD
Vermont Continued:
Fletcher Allen Health Care, Burlington Continued
David Pilcher, MD
Todd Peebles, MD
Michael Ricci, MD
Andrew C. Stanley, MD
Georg Steinthorsson, MD
Steven R. Shackford, MD
Rutland Regional Medical Center, Rutland
Matthew Conway, MD
J. Christian Higgins, MD
Baxter Holland, MD
Brad Jimmo, MD
John Louras, MD
Victor Pisanelli, MD
Massachusetts
Baystate Medical Center, Springfield
Mark Hirko, MD
Berkshire Medical Center, Pittsfield
Eugene L. Curletti, MD
Michael S. Cohn, MD
José M. Heisecke, MD
Christian R. Galvez-Padilla, MD
Parvis J. Sadighi, MD
Boston Medical Center, Boston
Alik Farber, MD
Jeffrey Kalish, MD
Palma Shaw, MD
Jonathan Woodson, MD
Massachusetts General Hospital, Boston
Richard Cambria, MD
Mark F. Conrad, MD
Virendra I Patel, MD
Tufts Medical Center, Boston
Kevin Daly, MD
James Estes, MD
James Halin, MD
Mark D. Iafrati, MD
Wiliam C. Mackey, MD
Stephen Maloney, MD
Thomas O’Donnell, MD
Noah Rosen, MD
Calin Vasiliu, MD
Andrew Weintraub, MD
St Anne’s Hospital, Fall River
David Bigatel, MD
Ibrahim G. Eid, MD
Martin Fogle, MD
Massachusettes Continued:
University of Massachusetts Medical Center,
Worcester
Elias Arous, MD
Rocco Ciocca, MD
Mohammad Eslami, MD
Subhash Gulati, MD
Louis Messina, MD
William P. Robinson III, MD
Andres Schanzer, MD
Stephens Taylor, MD
Richard Whitten, MD
Connecticut
St. Francis Hospital, Hartford
Scott Fecteau, MD
Steven Ruby, MD
Eugene D. Sullivan MD
Yale New Haven Hospital, New Haven
Melih Arici, MD
John Aruny, MD
Jeptha Curtis, MD
Alan Dardik, MD
Ralph DeNatale, MD
John Forrest, MD
Richard Gusberg, MD
Faisal Hasan, MD
Jeffrey Hnath, MD
Jeffrey Indes, MD
Carlos Mena, MD
Hamid Mojibian, MD
Bart Muhs, MD
Jeffrey Pollak, MD
Eric Reiner, MD
Michael Remetz, MD
Bauer Sumpio, MD
Tom Sweeney, MD
Craig Thomson, MD
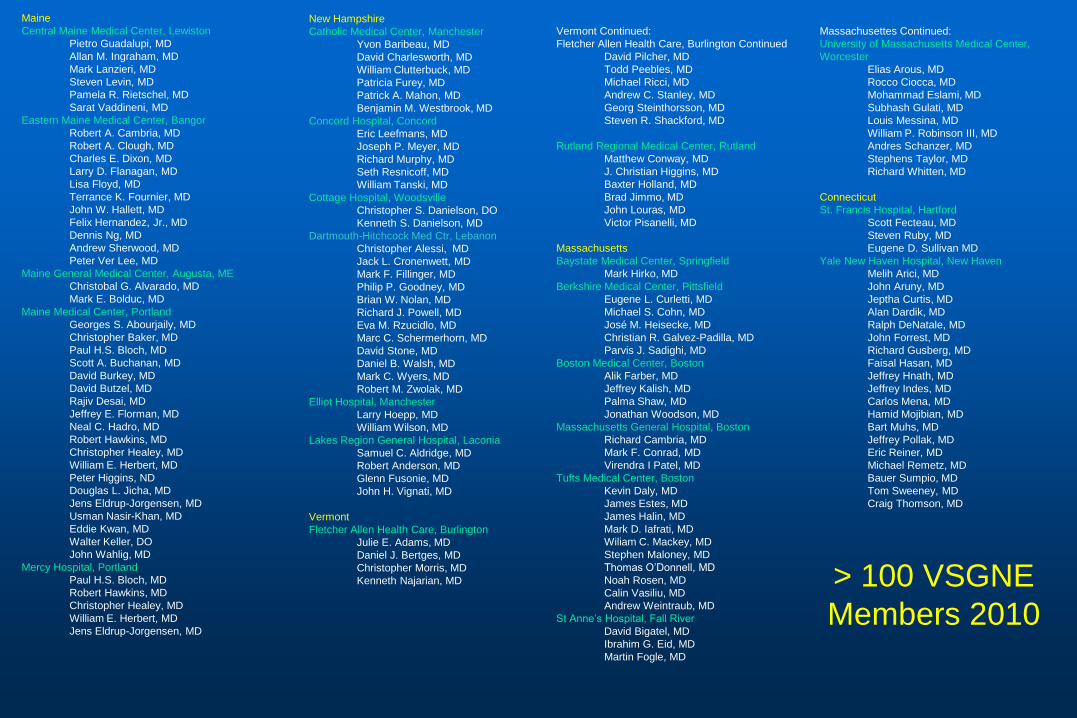
> 100 VSGNE
Members 2010
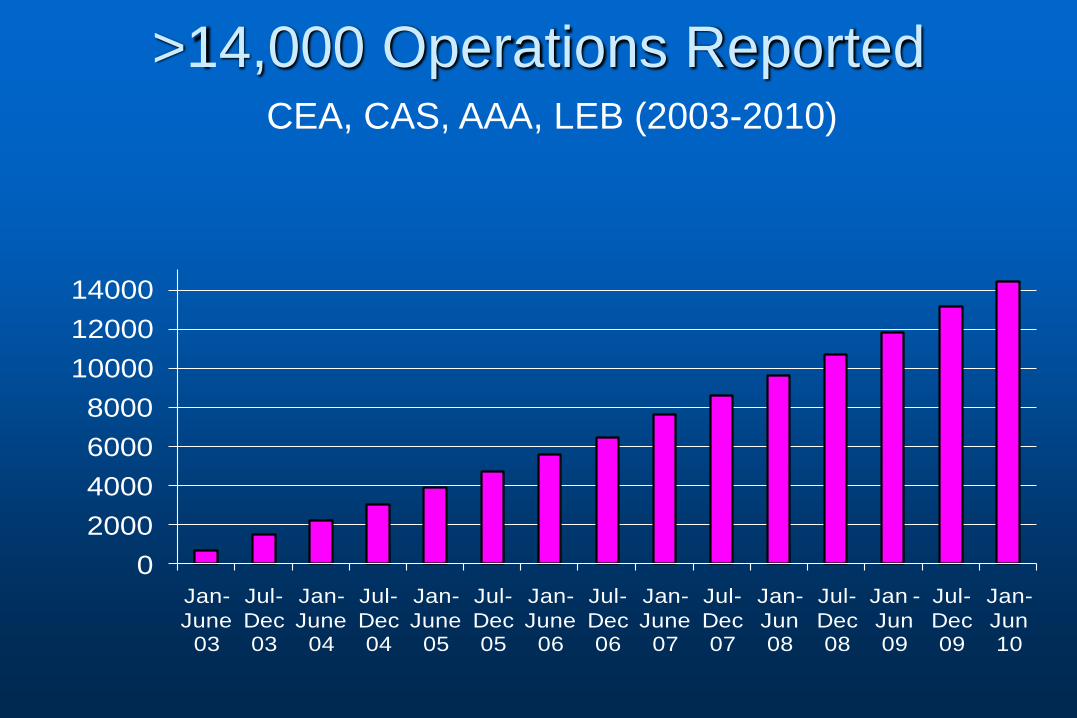
>14,000 Operations Reported
0
2000
4000
6000
8000
10000
12000
14000
Jan-
June 03
Jul-
Dec 03
Jan-
June 04
Jul-
Dec 04
Jan-
June 05
Jul-
Dec 05
Jan-
June 06
Jul-
Dec 06
Jan-
June 07
Jul-
Dec 07
Jan-
Jun 08
Jul-
Dec 08
Jan -
Jun 09
Jul-
Dec 09
Jan-
Jun 10
CEA, CAS, AAA, LEB (2003-2010)
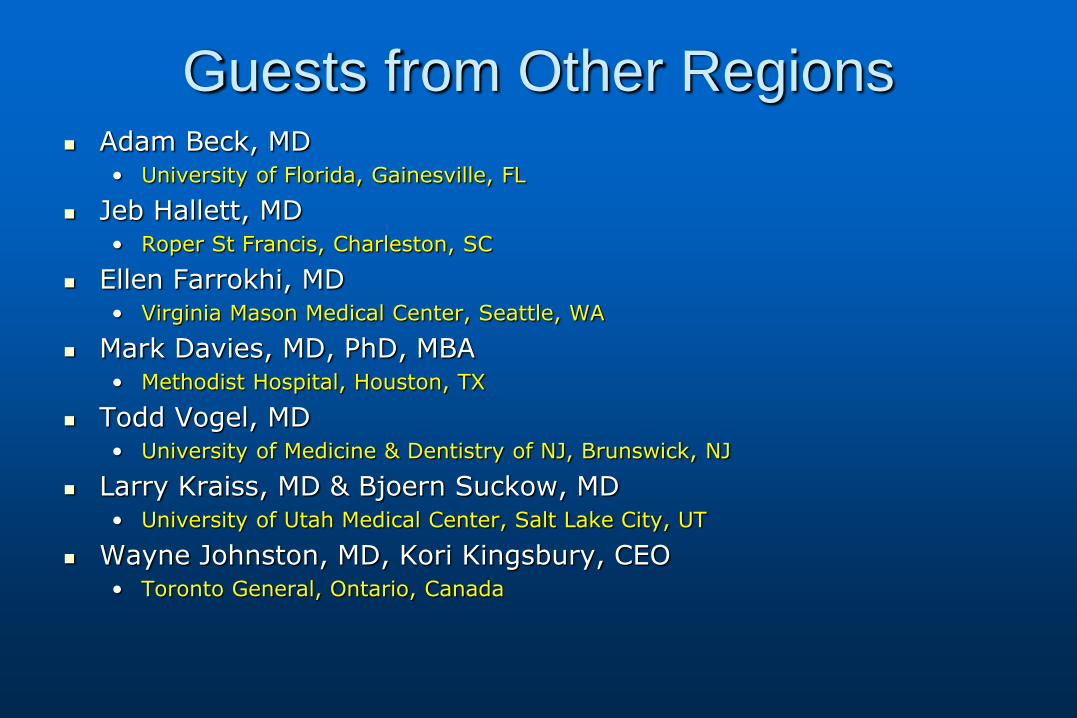
Guests from Other Regions Adam Beck, MD
• University of Florida, Gainesville, FL
Jeb Hallett, MD • Roper St Francis, Charleston, SC
Ellen Farrokhi, MD • Virginia Mason Medical Center, Seattle, WA
Mark Davies, MD, PhD, MBA • Methodist Hospital, Houston, TX
Todd Vogel, MD • University of Medicine & Dentistry of NJ, Brunswick, NJ
Larry Kraiss, MD & Bjoern Suckow, MD • University of Utah Medical Center, Salt Lake City, UT
Wayne Johnston, MD, Kori Kingsbury, CEO • Toronto General, Ontario, Canada

Sample of Quality Reports
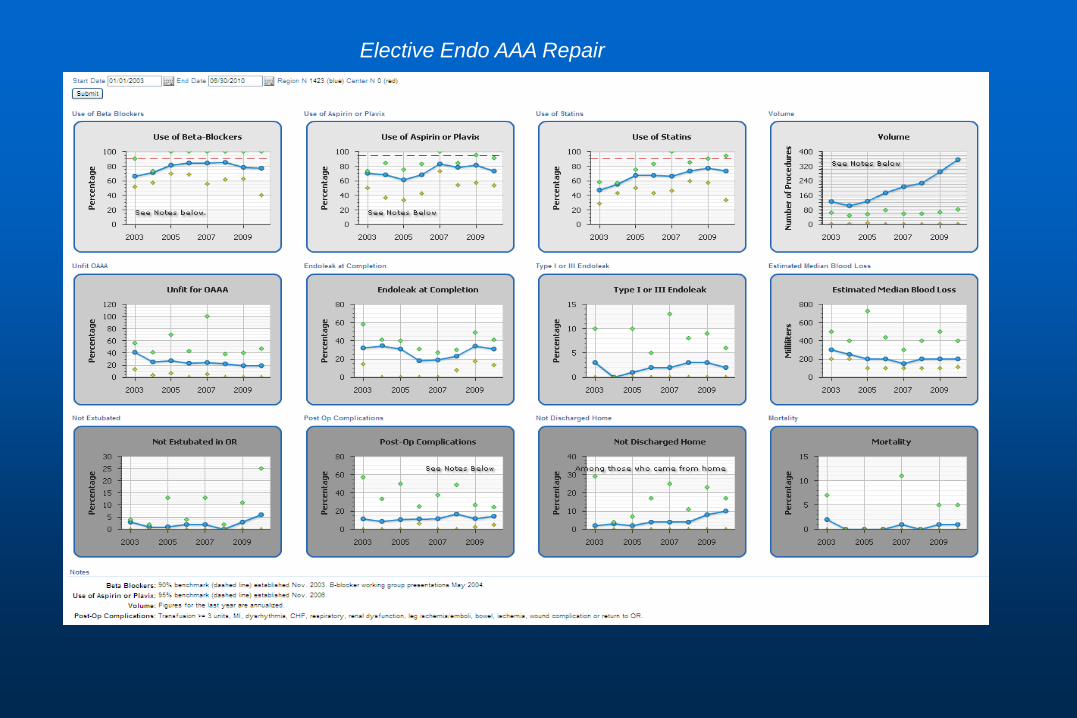
Elective Endo AAA Repair

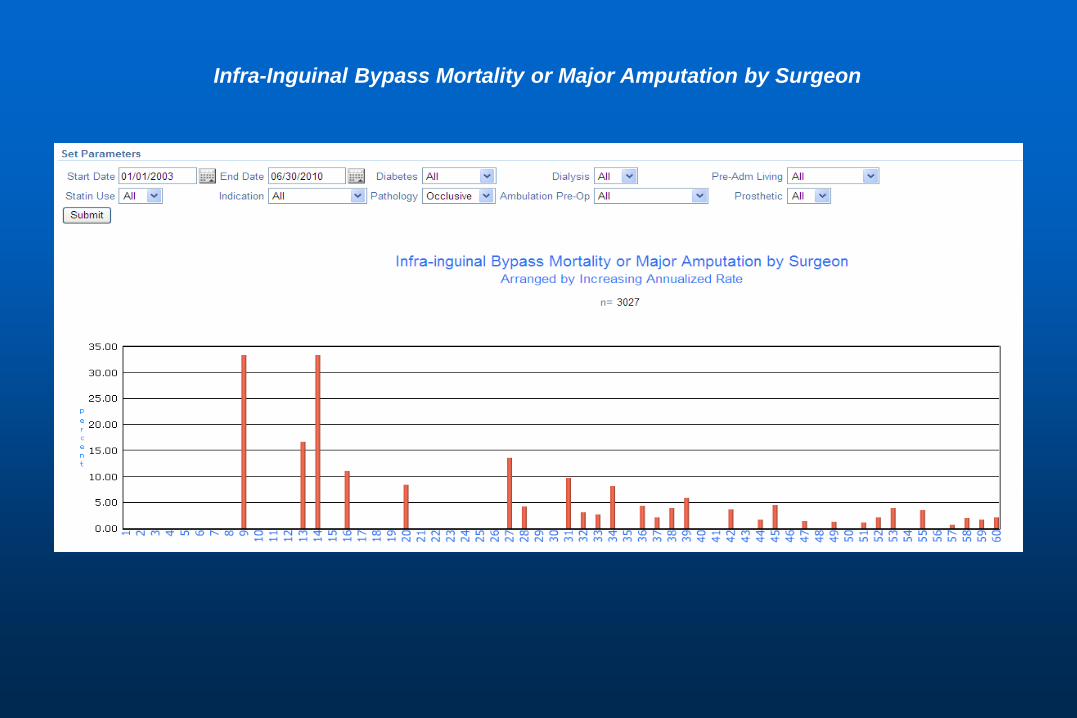
Infra-Inguinal Bypass Mortality or Major Amputation by Surgeon
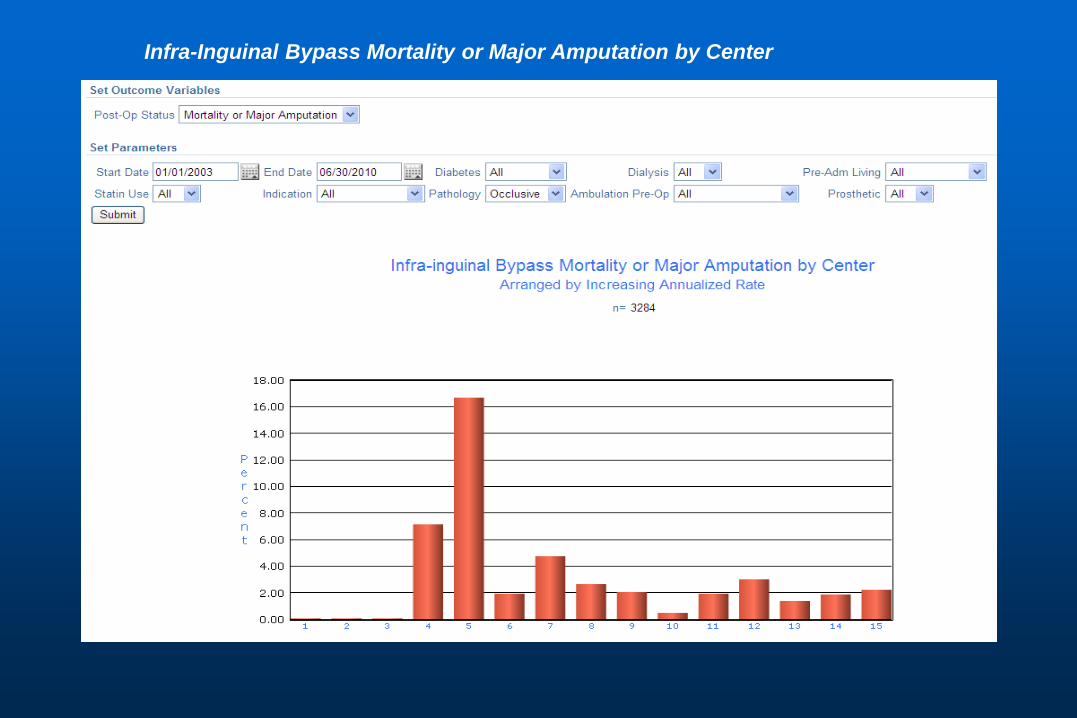
Infra-Inguinal Bypass Mortality or Major Amputation by Center
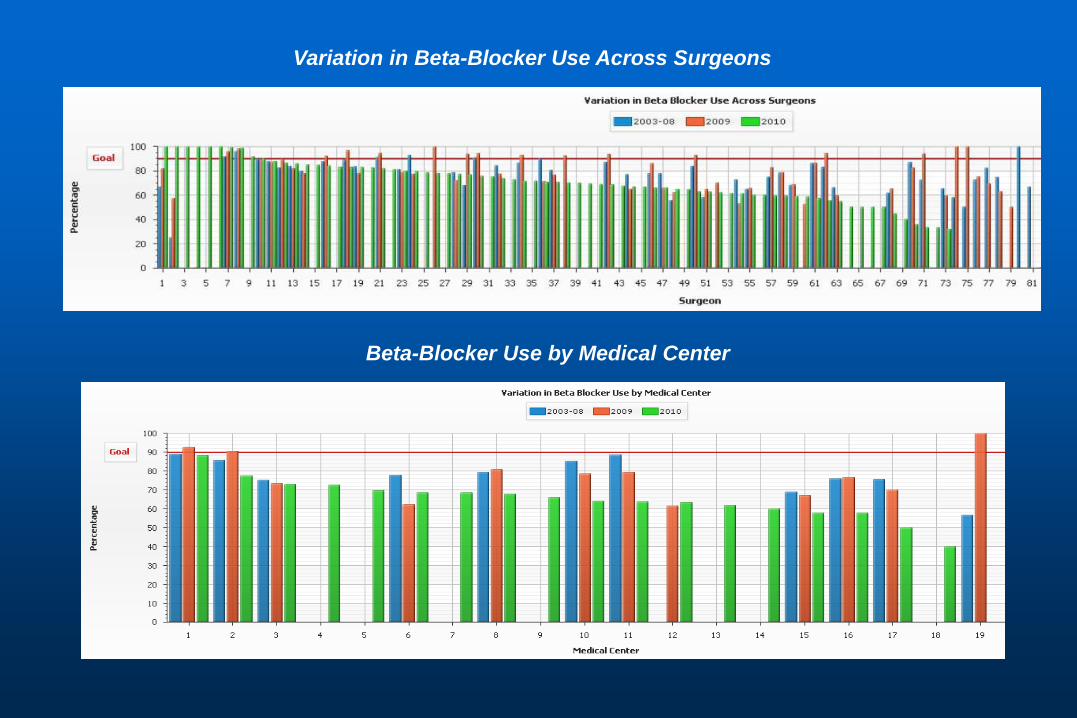
Variation in Beta-Blocker Use Across Surgeons
Beta-Blocker Use by Medical Center
Agenda - Administrative Topics
Version 1.7 upgrades, supra vs. infra-inguinal procedures
PVI form
One year follow-up, multiple follow-ups
EVAR, ? 2 or 3 year follow-up point
Review final TEVAR, Dialysis form
Potential primary amputation module
Validation by hospital audits
Printing reports for semi-annual meetings

Version 1.7 Software Update
New fields for all procedures:
• Skin prep type
• Stroke (as post-op complication)
CEA - drain
PVI – bivaliruden
CAS
• Medicare health insurance claim number
• Rankin score for stroke
• Arterographic stenosis
Version 1.7 Software Update
Save button on all web input pages
Follow-up form editing/deletion allowed
Multiple follow-up visits allowed
Audit log for all user actions (eg, delete)
18 existing fields updated (eg, extubation)
Unit conversions for Canadian centers
Separated supra- from infra-inguinal LEB
• Paper forms in folders
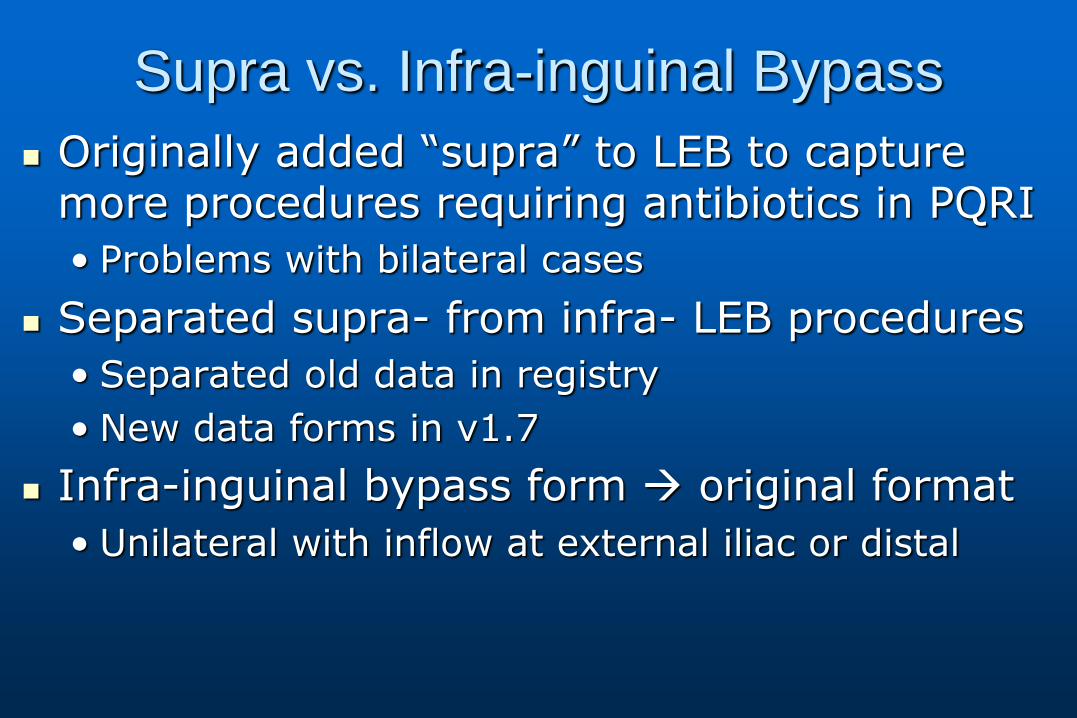
Supra vs. Infra-inguinal Bypass
Originally added “supra” to LEB to capture more procedures requiring antibiotics in PQRI
• Problems with bilateral cases
Separated supra- from infra- LEB procedures
• Separated old data in registry
• New data forms in v1.7
Infra-inguinal bypass form original format
• Unilateral with inflow at external iliac or distal
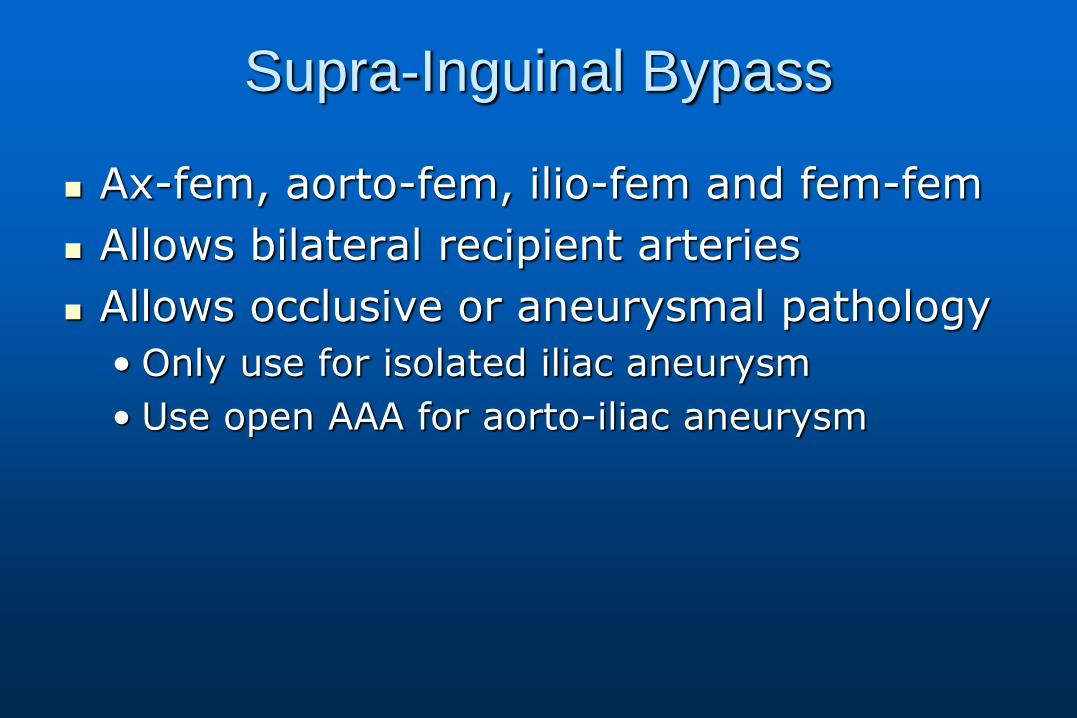
Supra-Inguinal Bypass
Ax-fem, aorto-fem, ilio-fem and fem-fem
Allows bilateral recipient arteries
Allows occlusive or aneurysmal pathology
• Only use for isolated iliac aneurysm
• Use open AAA for aorto-iliac aneurysm

PVI Data Entry 126
87 83
64
42 38
26 26 24
21
15
8 6
3
0
20
40
60
80
100
120
140
1 2 3 4 5 6 7 8 9 10 11 12 13 14
January – June, 2010
Hospital
Num
ber
of P
rocedure
s
Any issues with PVI forms or data entry?
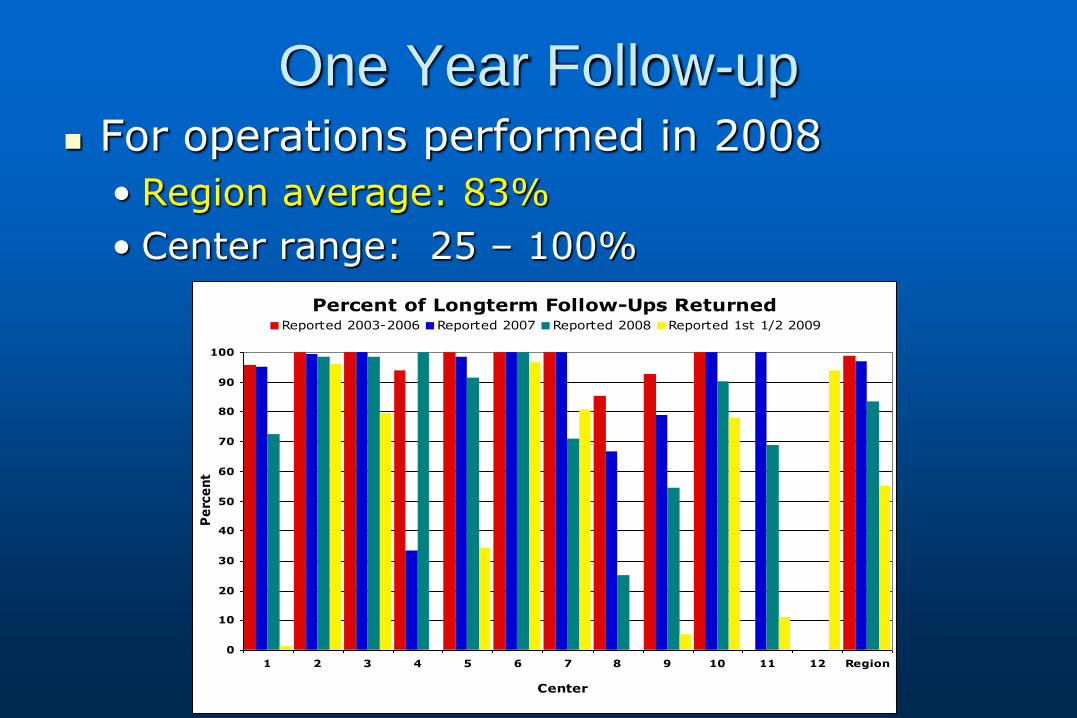
One Year Follow-up For operations performed in 2008
• Region average: 83%
• Center range: 25 – 100%
Percent of Longterm Follow-Ups Returned
0
10
20
30
40
50
60
70
80
90
100
1 2 3 4 5 6 7 8 9 10 11 12 Region
Center
Pe
rce
nt
Reported 2003-2006 Reported 2007 Reported 2008 Reported 1st 1/2 2009
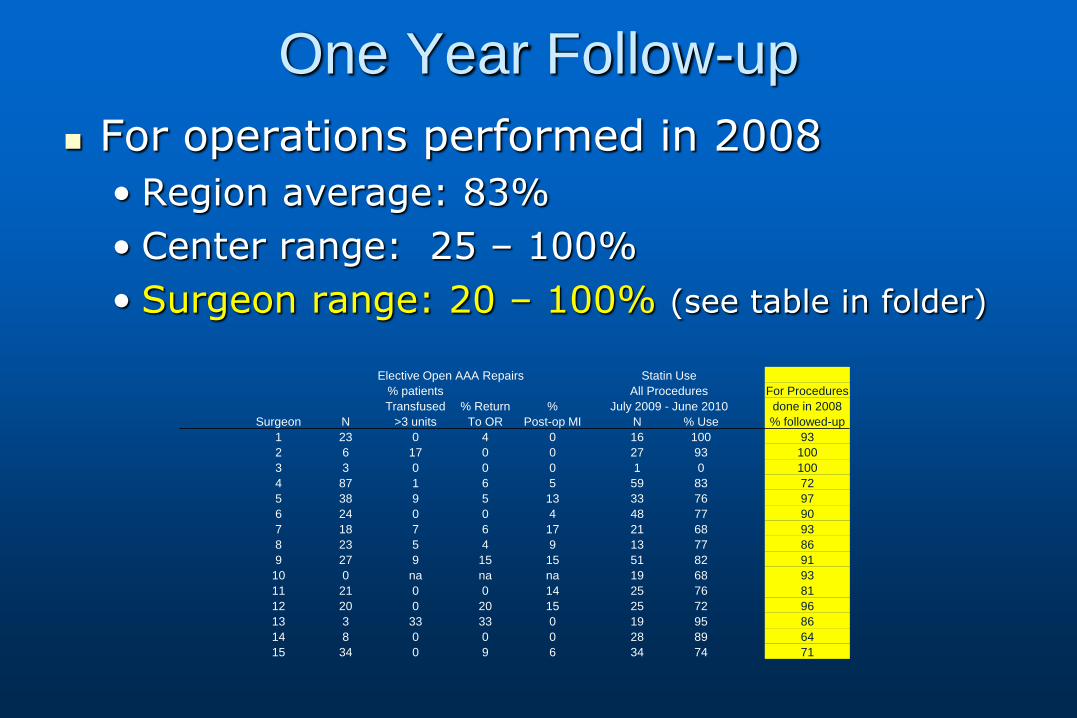
One Year Follow-up
For operations performed in 2008
• Region average: 83%
• Center range: 25 – 100%
• Surgeon range: 20 – 100% (see table in folder)
Elective Open AAA Repairs Statin Use
% patients All Procedures For Procedures
Transfused % Return % July 2009 - June 2010 done in 2008
Surgeon N >3 units To OR Post-op MI N % Use % followed-up
1 23 0 4 0 16 100 93
2 6 17 0 0 27 93 100
3 3 0 0 0 1 0 100
4 87 1 6 5 59 83 72
5 38 9 5 13 33 76 97
6 24 0 0 4 48 77 90
7 18 7 6 17 21 68 93
8 23 5 4 9 13 77 86
9 27 9 15 15 51 82 91
10 0 na na na 19 68 93
11 21 0 0 14 25 76 81
12 20 0 20 15 25 72 96
13 3 33 33 0 19 95 86
14 8 0 0 0 28 89 64
15 34 0 9 6 34 74 71
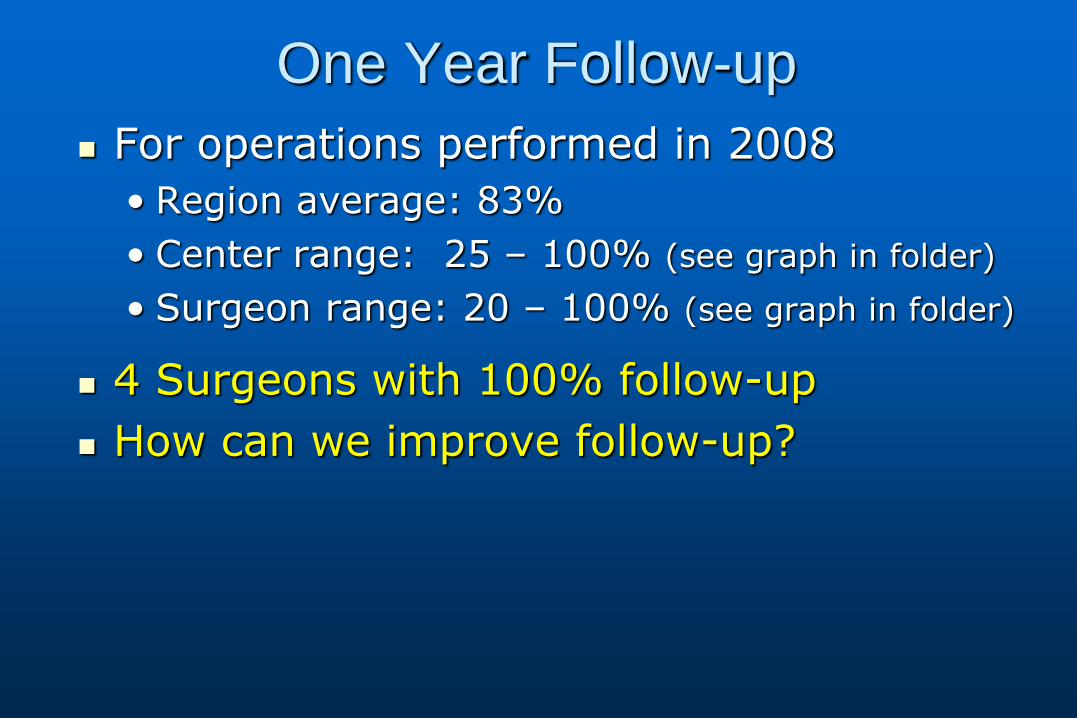
One Year Follow-up
For operations performed in 2008
• Region average: 83%
• Center range: 25 – 100% (see graph in folder)
• Surgeon range: 20 – 100% (see graph in folder)
4 Surgeons with 100% follow-up
How can we improve follow-up?
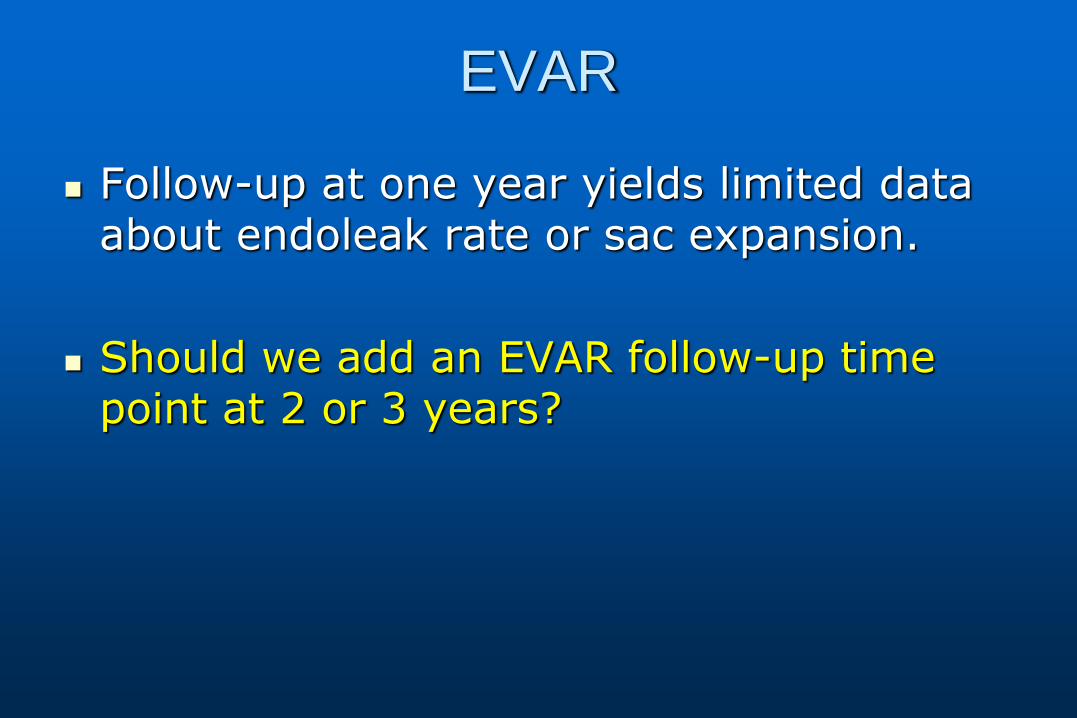
EVAR
Follow-up at one year yields limited data about endoleak rate or sac expansion.
Should we add an EVAR follow-up time point at 2 or 3 years?
New Forms for Review
Dialysis access
TEVAR
In folder, being prepared for web by M2S
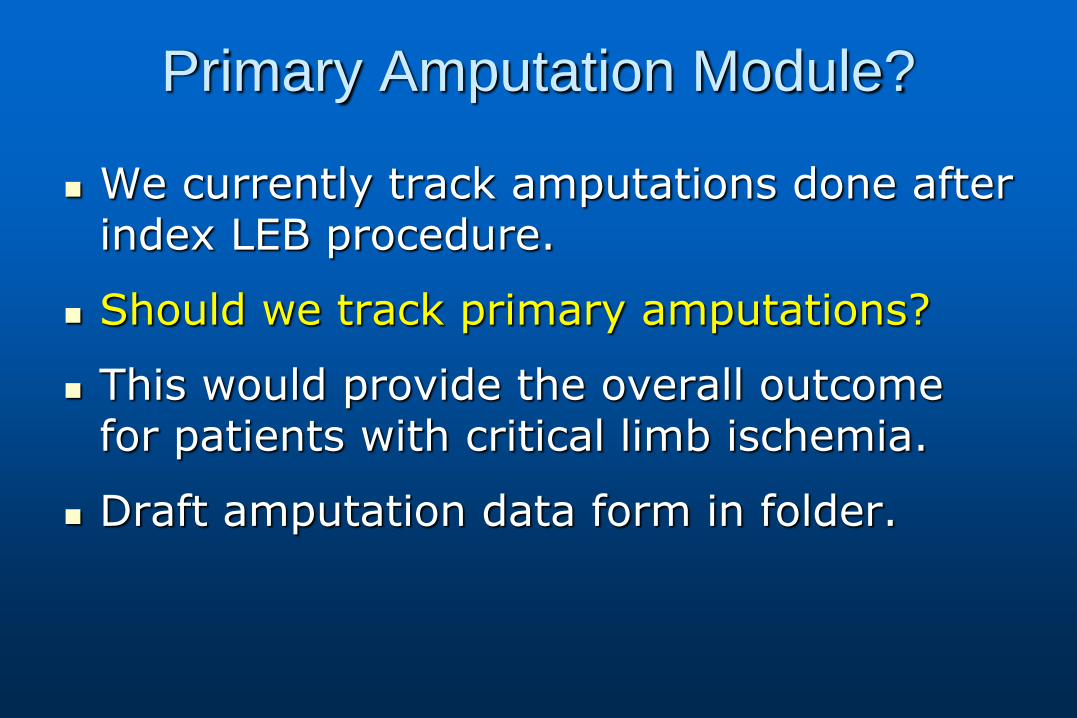
Primary Amputation Module?
We currently track amputations done after index LEB procedure.
Should we track primary amputations?
This would provide the overall outcome for patients with critical limb ischemia.
Draft amputation data form in folder.
VSGNE Oct,2007- Dec, 2009 Case Validation
•Validation guarantees the accuracy and completeness of our data
•Improves the value of the registry
•07-09 is the third series of VSGNE validations
•Conducted internally by VSG-PSO staff
•Processing of validation files is now codified and documented for replication in other VSG-PSO regions
•Incorporating SSN in 07-09 series to tie into social security death index
7/27/2011 JH Higgins MS
7/27/2011 JH Higgins MS
7/27/2011 JH Higgins MS
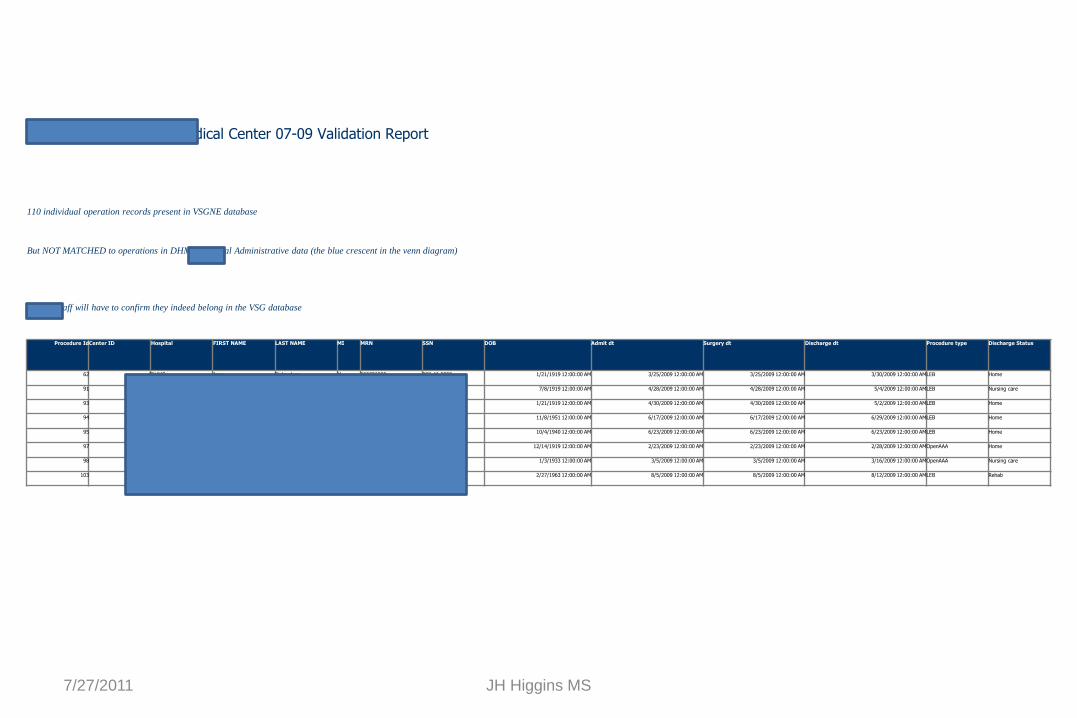
Dartmouth-Hitchcock Medical Center 07-09 Validation Report
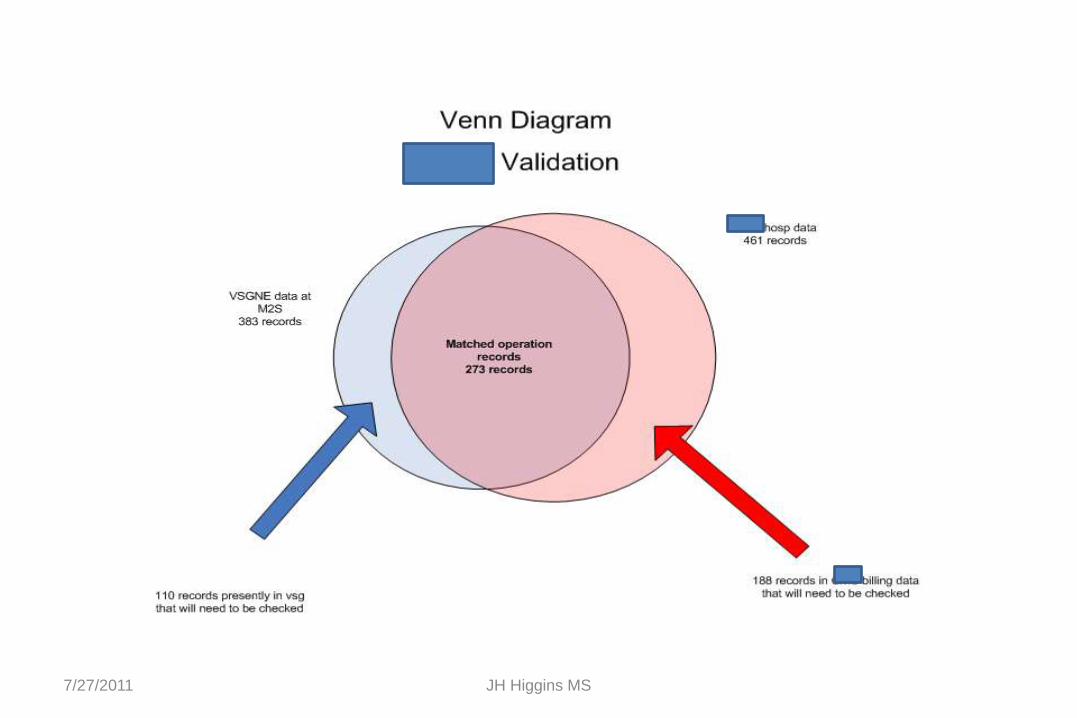
110 individual operation records present in VSGNE database
But NOT MATCHED to operations in DHMC Hospital Administrative data (the blue crescent in the venn diagram)
DHMC staff will have to confirm they indeed belong in the VSG database
Procedure Id Center ID Hospital FIRST NAME LAST NAME MI MRN SSN DOB Admit dt Surgery dt Discharge dt Procedure type Discharge Status
62 4 DHMC Joan Richardson M 500736293 007-46-2838 1/21/1919 12:00:00 AM 3/25/2009 12:00:00 AM 3/25/2009 12:00:00 AM 3/30/2009 12:00:00 AM LEB Home
91 4 DHMC Pearl Syles I 002000891 009-22-0703 7/8/1919 12:00:00 AM 4/28/2009 12:00:00 AM 4/28/2009 12:00:00 AM 5/4/2009 12:00:00 AM LEB Nursing care
93 4 DHMC Joan Richardson M 500736293 007-46-2838 1/21/1919 12:00:00 AM 4/30/2009 12:00:00 AM 4/30/2009 12:00:00 AM 5/2/2009 12:00:00 AM LEB Home
94 4 DHMC Anthony Nunes W 003976107 009-40-0361 11/8/1951 12:00:00 AM 6/17/2009 12:00:00 AM 6/17/2009 12:00:00 AM 6/29/2009 12:00:00 AM LEB Home
95 4 DHMC Erika Peoples 505491050 021-38-4703 10/4/1940 12:00:00 AM 6/23/2009 12:00:00 AM 6/23/2009 12:00:00 AM 6/23/2009 12:00:00 AM LEB Home
97 4 DHMC Mihoko Welch 505328773 576-56-3838 12/14/1919 12:00:00 AM 2/23/2009 12:00:00 AM 2/23/2009 12:00:00 AM 2/28/2009 12:00:00 AM OpenAAA Home
98 4 DHMC Helen Ahearn C 001505957 008-20-1497 1/3/1933 12:00:00 AM 3/5/2009 12:00:00 AM 3/5/2009 12:00:00 AM 3/16/2009 12:00:00 AM OpenAAA Nursing care
103 4 DHMC Russell Lachance 505554915 001-50-7955 2/27/1963 12:00:00 AM 8/5/2009 12:00:00 AM 8/5/2009 12:00:00 AM 8/12/2009 12:00:00 AM LEB Rehab
7/27/2011 JH Higgins MS
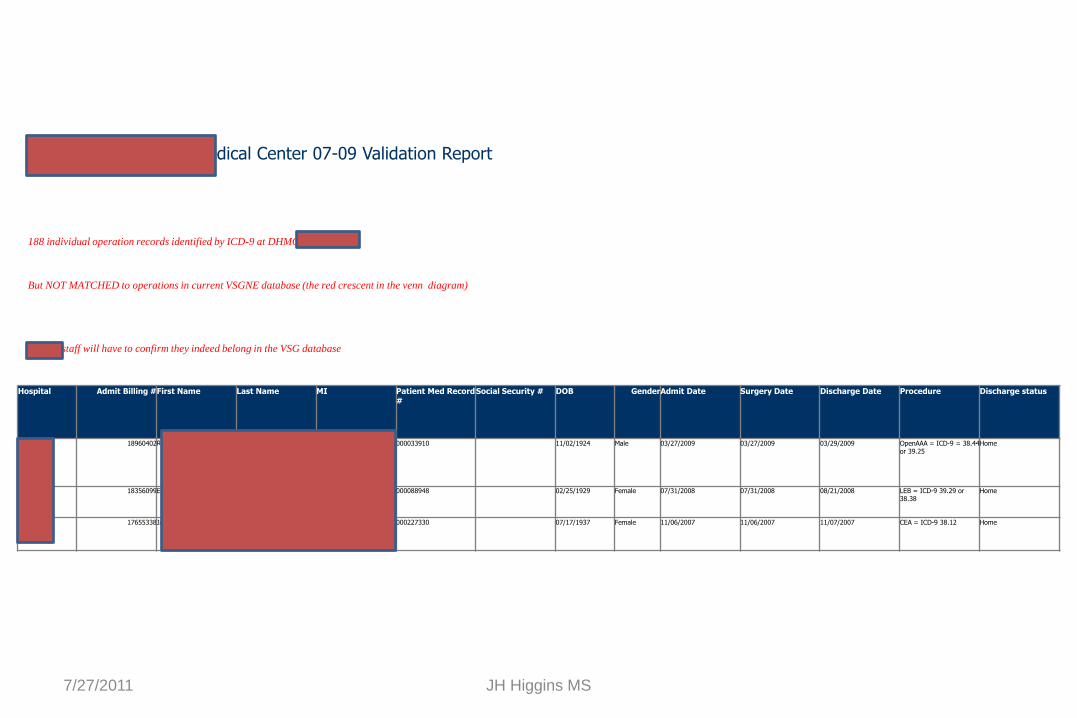
Dartmouth-Hitchcock Medical Center 07-09 Validation Report
188 individual operation records identified by ICD-9 at DHMC
But NOT MATCHED to operations in current VSGNE database (the red crescent in the venn diagram)
DHMC staff will have to confirm they indeed belong in the VSG database
Hospital Admit Billing # First Name Last Name MI Patient Med Record #
Social Security # DOB Gender Admit Date Surgery Date Discharge Date Procedure Discharge status
DHMC 18960402 RICHARD FORD A 000033910 11/02/1924 Male 03/27/2009 03/27/2009 03/29/2009 OpenAAA = ICD-9 = 38.44 or 39.25
Home
DHMC 18356099 ERLENE GREENE M 000088948 02/25/1929 Female 07/31/2008 07/31/2008 08/21/2008 LEB = ICD-9 39.29 or 38.38
Home
DHMC 17655338 JANICE WHITE 000227330 07/17/1937 Female 11/06/2007 11/06/2007 11/07/2007 CEA = ICD-9 38.12 Home
7/27/2011 JH Higgins MS
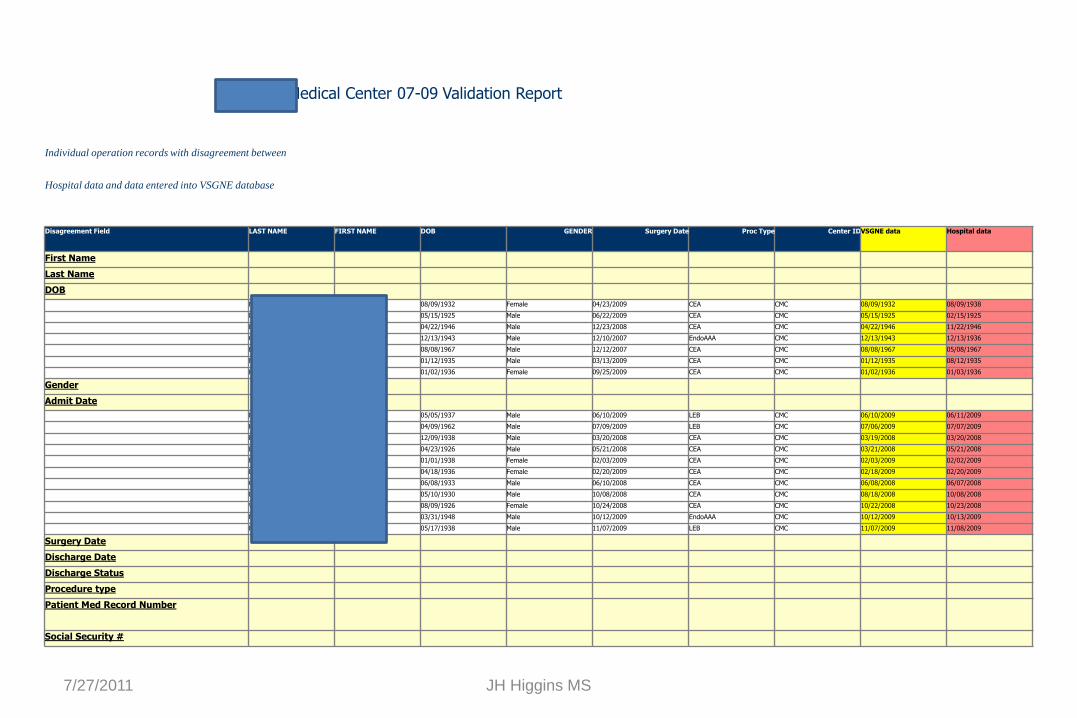
Catholic Medical Center 07-09 Validation Report
Individual operation records with disagreement between
Hospital data and data entered into VSGNE database
Disagreement Field LAST NAME FIRST NAME DOB GENDER Surgery Date Proc Type Center ID VSGNE data Hospital data
First Name
Last Name
DOB
Murto Irene 08/09/1932 Female 04/23/2009 CEA CMC 08/09/1932 08/09/1938
Duclos Gerard 05/15/1925 Male 06/22/2009 CEA CMC 05/15/1925 02/15/1925
Byrd Ronald 04/22/1946 Male 12/23/2008 CEA CMC 04/22/1946 11/22/1946
Cashman Laurence 12/13/1943 Male 12/10/2007 EndoAAA CMC 12/13/1943 12/13/1936
Buffett Scott 08/08/1967 Male 12/12/2007 CEA CMC 08/08/1967 05/08/1967
Murphy Albert 01/12/1935 Male 03/13/2009 CEA CMC 01/12/1935 08/12/1935
Kasper Rosemary 01/02/1936 Female 09/25/2009 CEA CMC 01/02/1936 01/03/1936
Gender
Admit Date
Haley James 05/05/1937 Male 06/10/2009 LEB CMC 06/10/2009 06/11/2009
Hogsett Tony 04/09/1962 Male 07/09/2009 LEB CMC 07/06/2009 07/07/2009
Barry John 12/09/1938 Male 03/20/2008 CEA CMC 03/19/2008 03/20/2008
Balentine James 04/23/1926 Male 05/21/2008 CEA CMC 03/21/2008 05/21/2008
Fifield Catherine 01/01/1938 Female 02/03/2009 CEA CMC 02/03/2009 02/02/2009
Dumais Betty 04/18/1936 Female 02/20/2009 CEA CMC 02/18/2009 02/20/2009
Gonzalez Hugo 06/08/1933 Male 06/10/2008 CEA CMC 06/08/2008 06/07/2008
Letourneau Archie 05/10/1930 Male 10/08/2008 CEA CMC 08/18/2008 10/08/2008
Whiting Helen 08/09/1926 Female 10/24/2008 CEA CMC 10/22/2008 10/23/2008
Morin Francis 03/31/1948 Male 10/12/2009 EndoAAA CMC 10/12/2009 10/13/2009
Holt Robert 05/17/1938 Male 11/07/2009 LEB CMC 11/07/2009 11/08/2009
Surgery Date
Discharge Date
Discharge Status
Procedure type
Patient Med Record Number
Social Security #
Validation – Next Steps
Hospital receives report of potential data entry errors
• Review patient identifiers, dates
• Edit patient data online if appropriate
Hospital receives reports of potentially missing procedures
• Review procedures
• Enter procedure online if appropriate
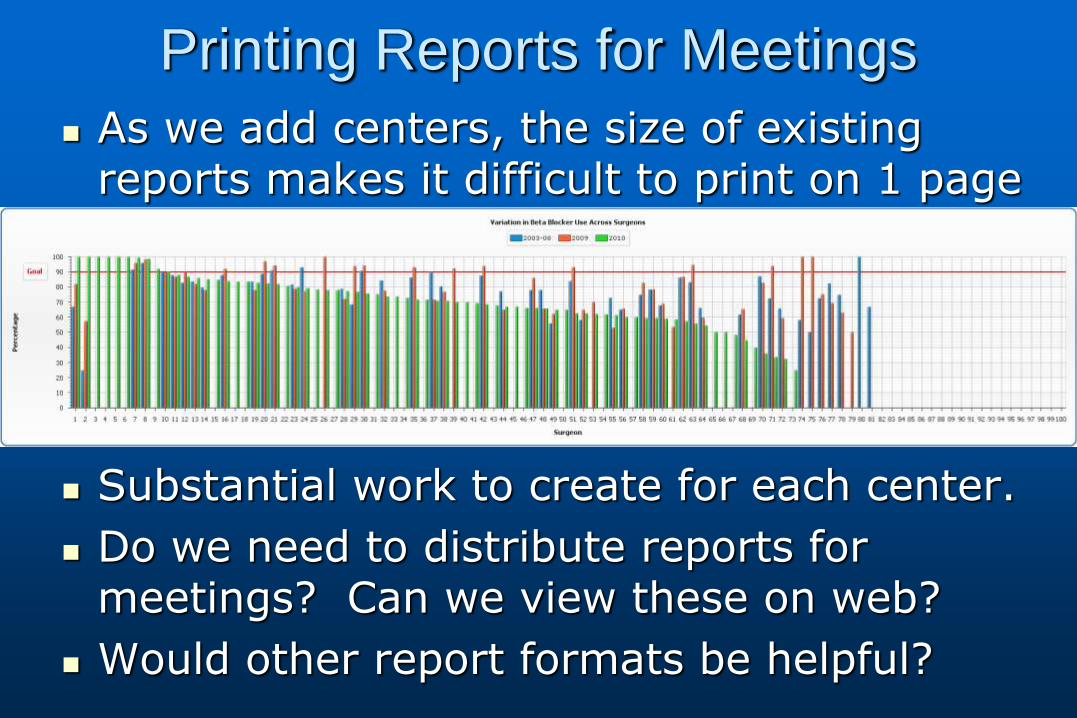
Printing Reports for Meetings
As we add centers, the size of existing reports makes it difficult to print on 1 page
Substantial work to create for each center.
Do we need to distribute reports for meetings? Can we view these on web?
Would other report formats be helpful?
PQRI Update
For 2009 data, successful MDs should receive payment in November, 2010
Issues:
• Some MDs submitted wrong TIN or NPI
• CMS counts all procedures relevant to peri-op antibiotics in denominator
Not all these operations are recorded in VSGNE
Must submit on 80% of all cases, not just VSGNE
If high number of general surgery or cases not recorded in VSGNE, may not achieve 80%
PQRI Reporting
Improvements for 2010
• General web form being developed to enter basic information for procedures that require antibiotic reporting that are not recorded in VSGNE, for retrospective entry this year
• Method to audit CPT claims data for surgeons to ensure that they have submitted 80% of relevant procedures for PQRI reporting
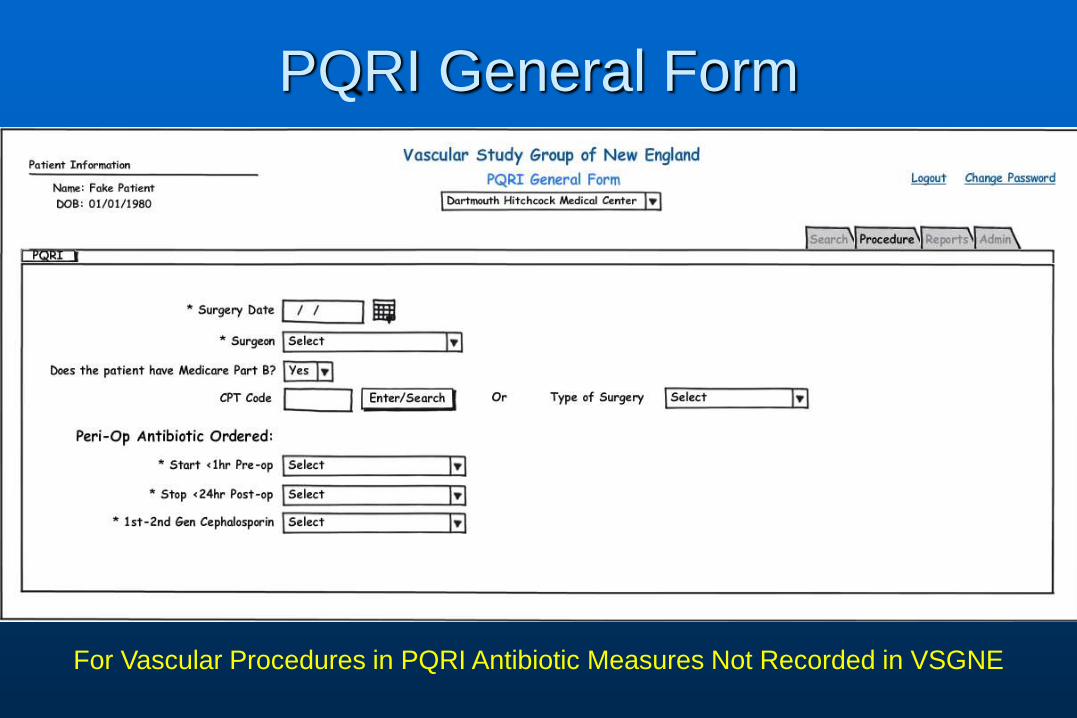
PQRI General Form
For Vascular Procedures in PQRI Antibiotic Measures Not Recorded in VSGNE

PQRI General Form
Only Vascular Procedures (Not general, cardiac or thoracic procedures)
PQRI Reporting
Need more vascular specific PQRI measures
• Working with SVS to submit measures this year
Possible New Measures for PQRI
Outcome measures (in hospital)
• Stroke of death after CEA/CAS in asympt pt
• Death after elective AAA repair for <5.5 cm
Process measures
• Discharged on statin after CEA, LEB
• Anti-platelet Rx pre- and post- CEA, CAS
• Surveillance CT in year after EVAR
• Surveillance duplex in year after vein LEB

Statin Working Group
for the Vascular Study Group of New
England (VSGNE)
Andres Schanzer MD, Brian Nolan MD, David Stone MD, Robert
Hawkins MD, Joseph Meyer MD, Richard Powell MD
October 28th, 2010

Goal
1. To evaluate the role and
use of statins in VSGNE
patients
2. To increase statin-use in
VSGNE patients
1. To evaluate the role and
use of statins in VSGNE
patients

Is statin-use an important
quality metric in the VSGNE
?
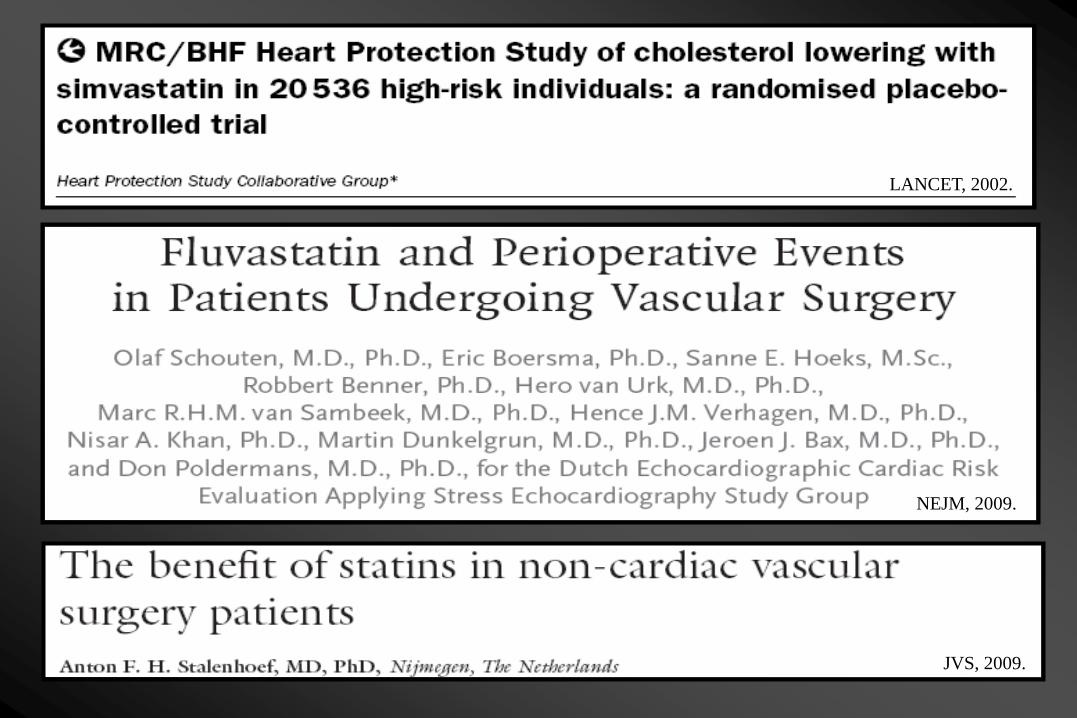
LANCET, 2002.
NEJM, 2009.
JVS, 2009.
LANCET, 2002.

In patients with PAD, 22% risk reduction for MACE
in simvastatin group
HPS, Lancet, 2002.
NEJM, 2009.
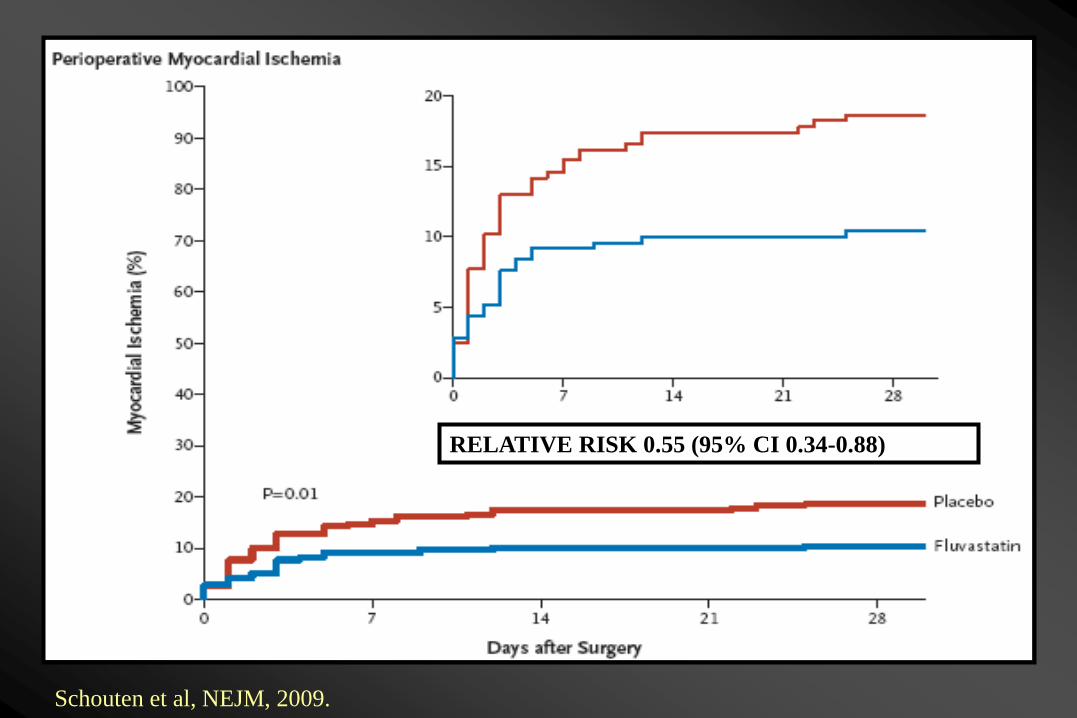
RELATIVE RISK 0.55 (95% CI 0.34-0.88)
Schouten et al, NEJM, 2009.
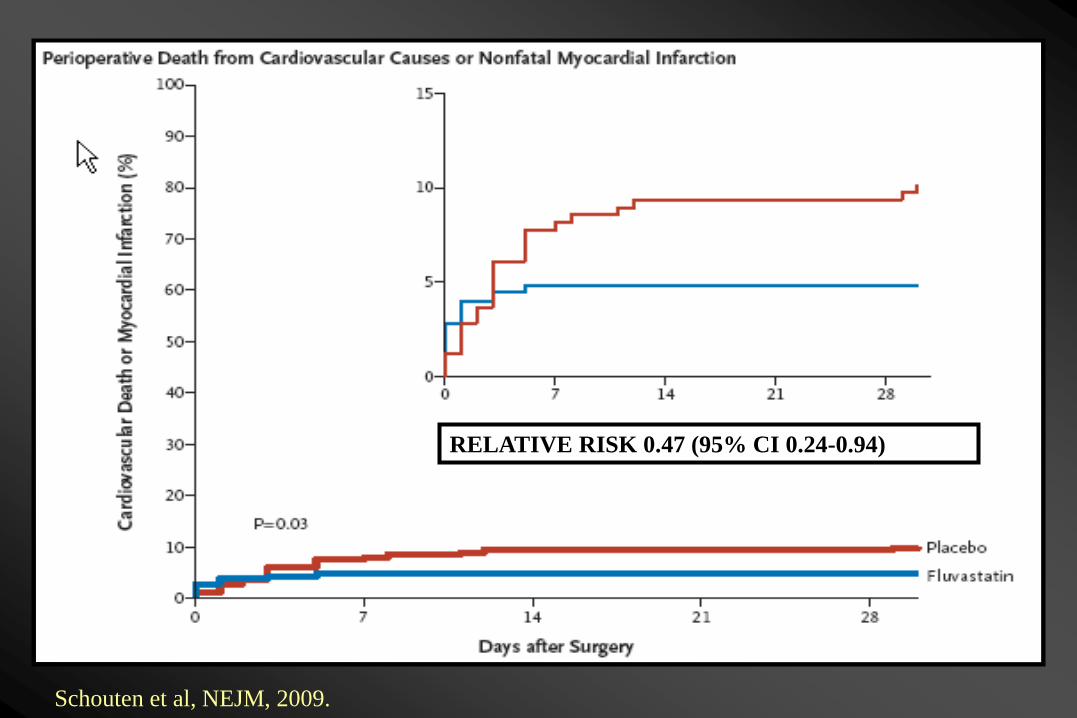
RELATIVE RISK 0.47 (95% CI 0.24-0.94)
Schouten et al, NEJM, 2009.
JVS, 2009.
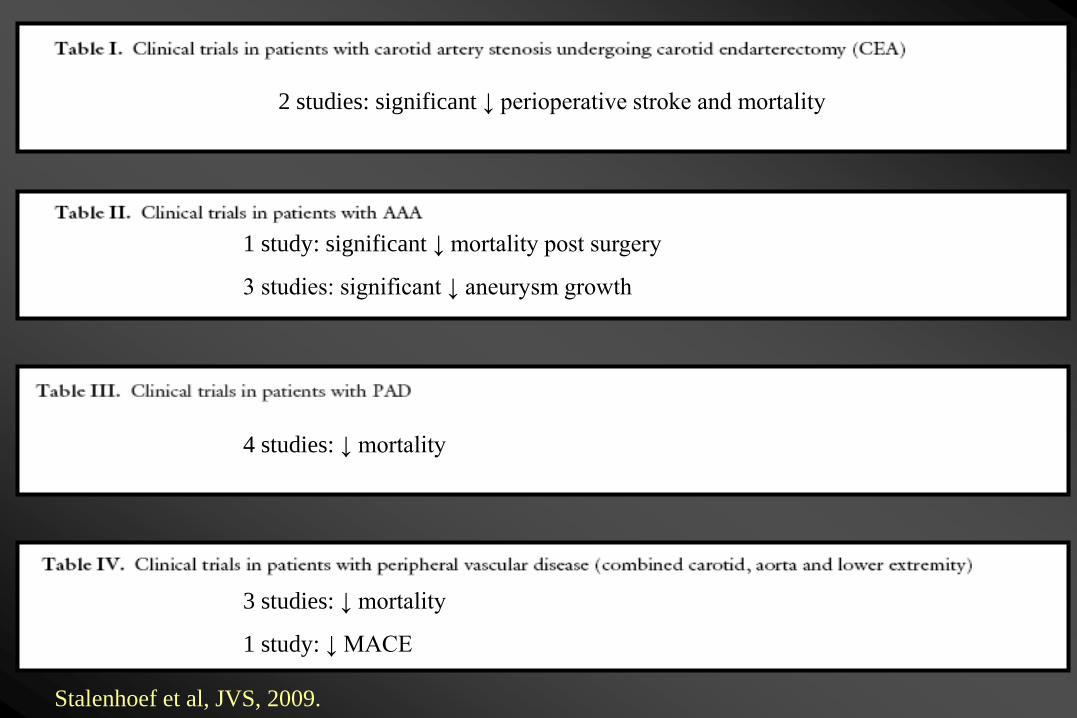
2 studies: significant ↓ perioperative stroke and mortality
1 study: significant ↓ mortality post surgery
3 studies: significant ↓ aneurysm growth
4 studies: ↓ mortality
Stalenhoef et al, JVS, 2009.
3 studies: ↓ mortality
1 study: ↓ MACE

How is our statin-use in
the VSGNE ?
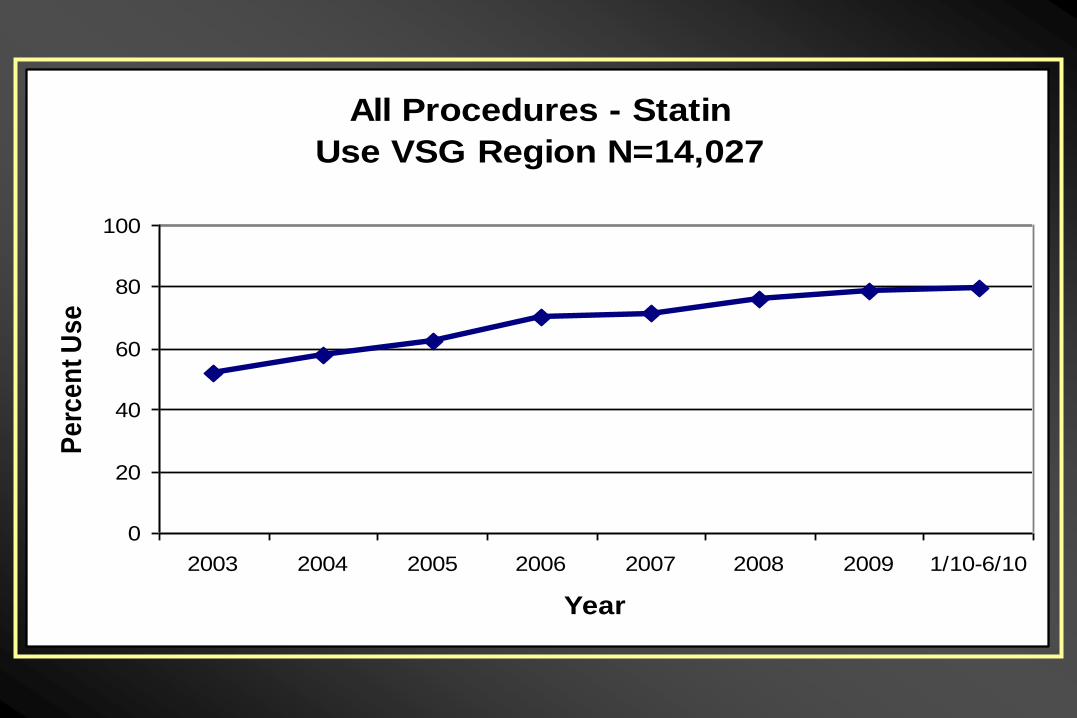
All Procedures - Statin
Use VSG Region N=14,027
0
20
40
60
80
100
2003 2004 2005 2006 2007 2008 2009 1/10-6/10
Year
Pe
rce
nt
Us
e
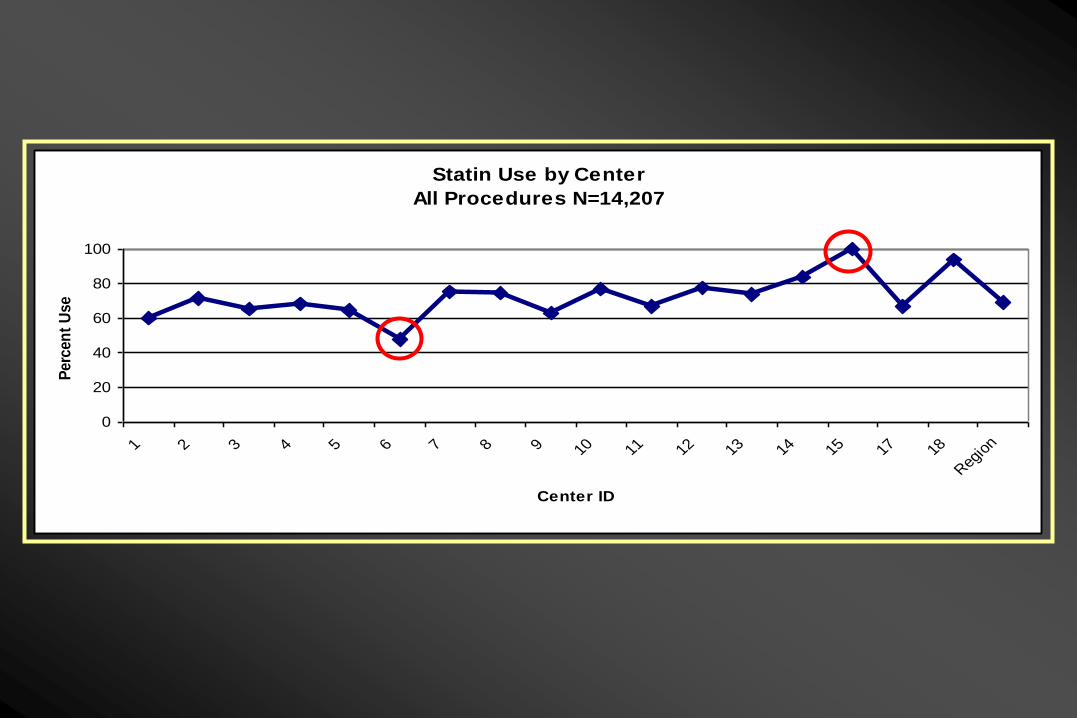
Statin Use by Center
All Procedures N=14,207
0
20
40
60
80
100
1 2 3 4 5 6 7 8 9 10 11 12 13 14 15 17 18
Reg
ion
Center ID
Perc
en
t U
se

Statin Use by Surgeon All Procedures
0
20
40
60
80
100
1 2 3 4 5 6 7 8 9 10 11 12 13 14 15 16 17 18 19 20 21 22 23 24 25 26 27 28 29 30 31 32 33 34 35 36 37 38 39 40 41 42 43 44 45 46 47 48 49 50 51 52 53 54 55 56 57 58 59 60 61 62 63 64 65 66 67 68 69 70
Surgeon
Pe
rce
nt
Us
e

Statin Administration--Safety
Blood enzymes (x upper limit of normal)
STATIN (10,269)
PLACEBO (10,267)
Liver: ALT>3xULN 77 (0.8%) 65 (0.6%)
Muscle: CK >10xULN 9 (0.09%) 5 (0.05%)
HPS, Lancet, 2002.
LANCET, 2002.
NEJM, 2009.
89%
94%
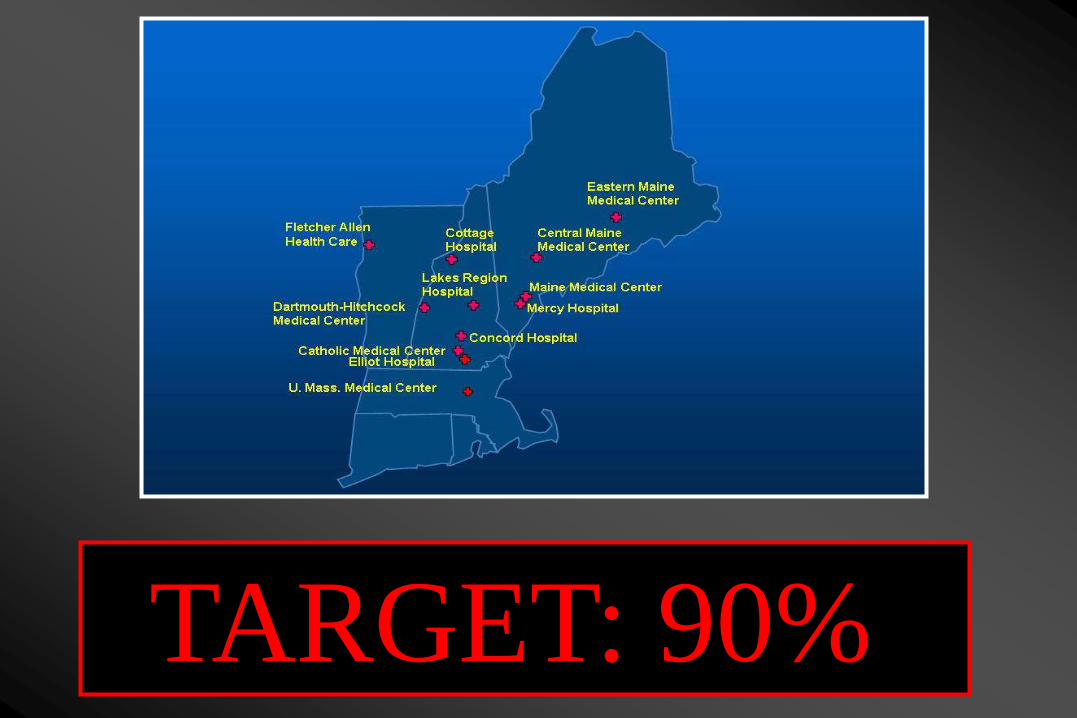
TARGET: 90%

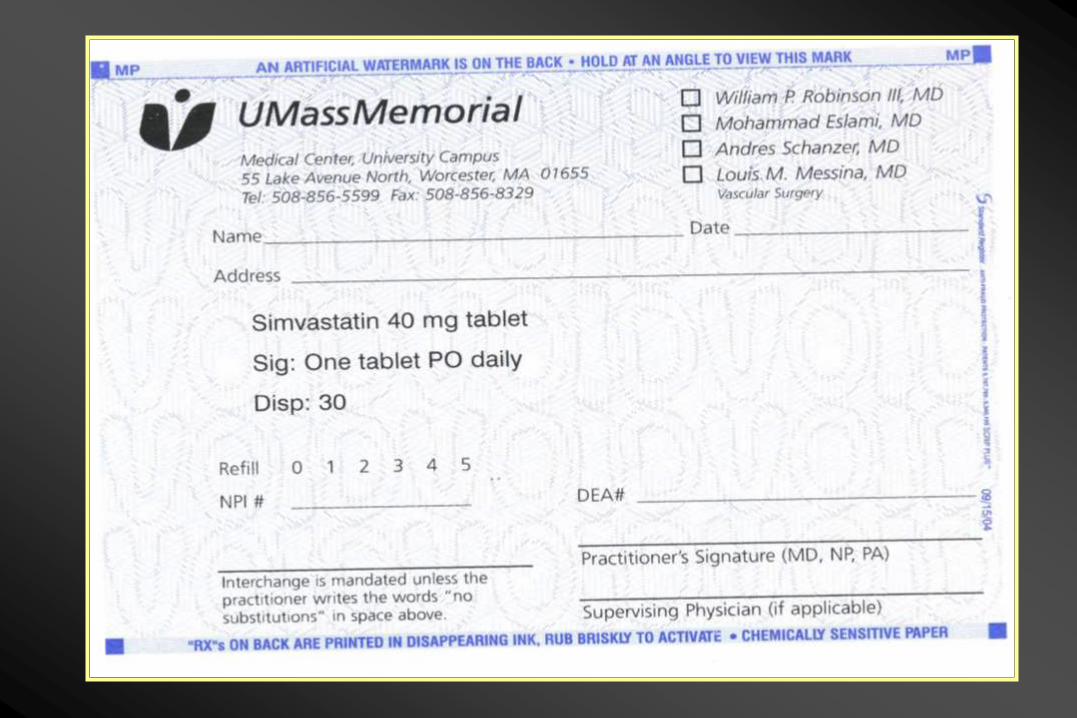
Statin Administration
• Who: Any patient with vascular disease
• Drug: Simvastatin
• Dose: 40 mg po daily
• Timing: Ideally 4 week prior to surgery
– Data to suggest any time before is better than none
• Necessary testing: ALT, AST, CPK baseline and
at 6 weeks
• Duration: Lifelong
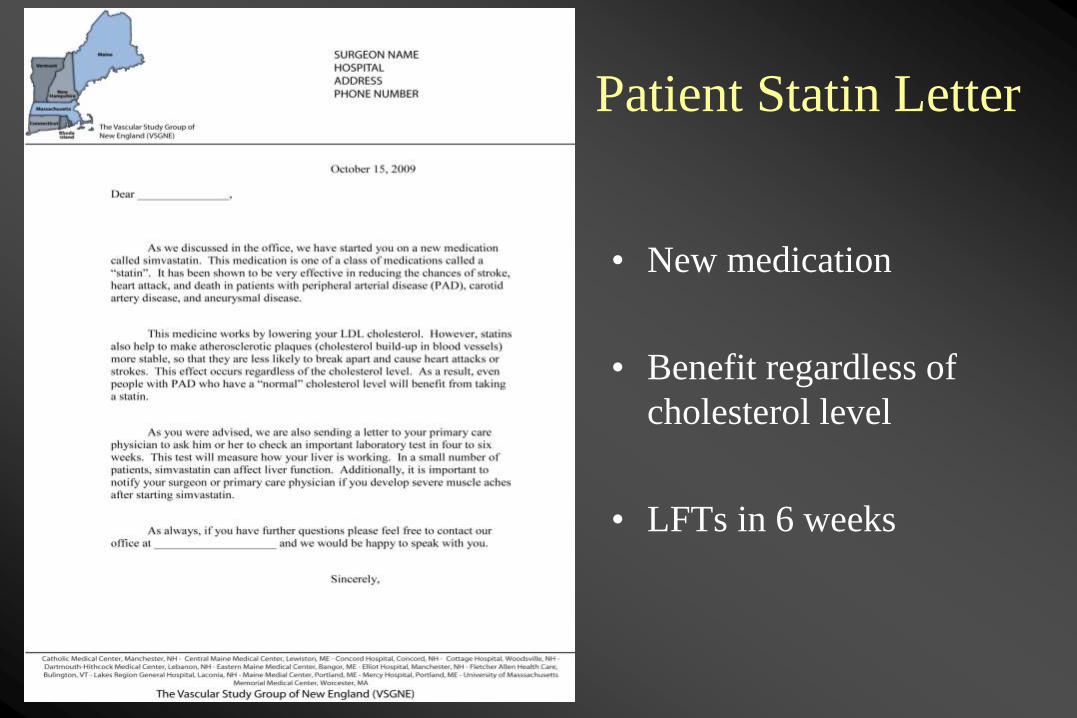
Patient Statin Letter
• New medication
• Benefit regardless of
cholesterol level
• LFTs in 6 weeks
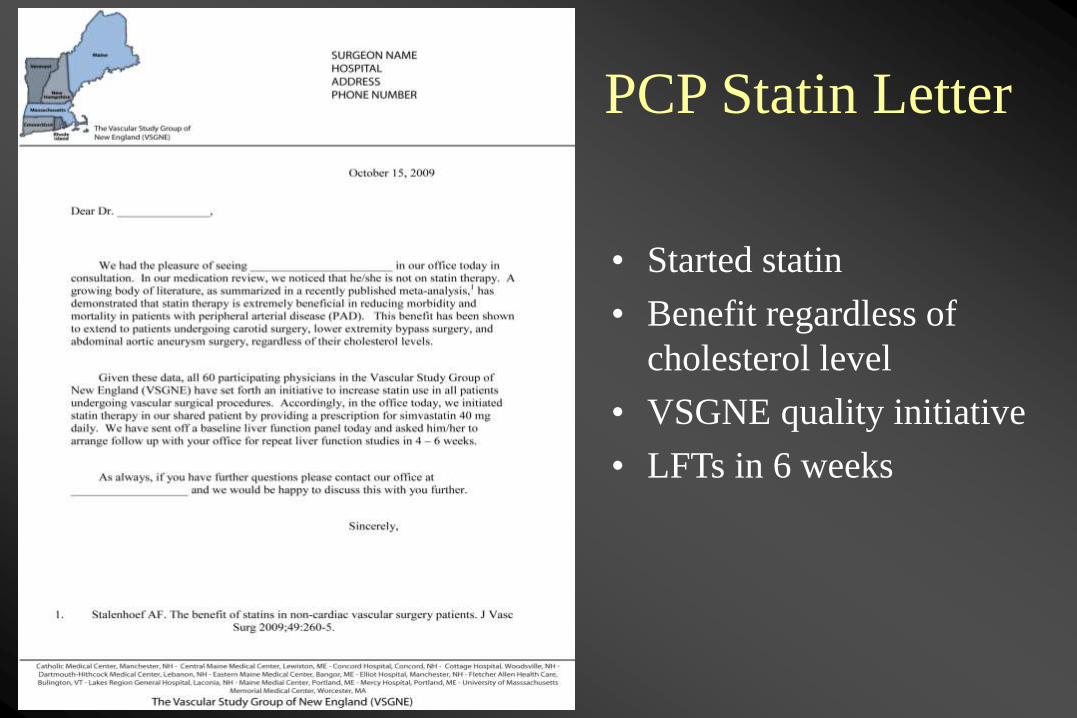
PCP Statin Letter
• Started statin
• Benefit regardless of
cholesterol level
• VSGNE quality initiative
• LFTs in 6 weeks

PCP Allergy
Letter
• Patient reports statin
allergy
• Benefit regardless of
cholesterol level
• VSGNE quality initiative
• Reconsider allergy
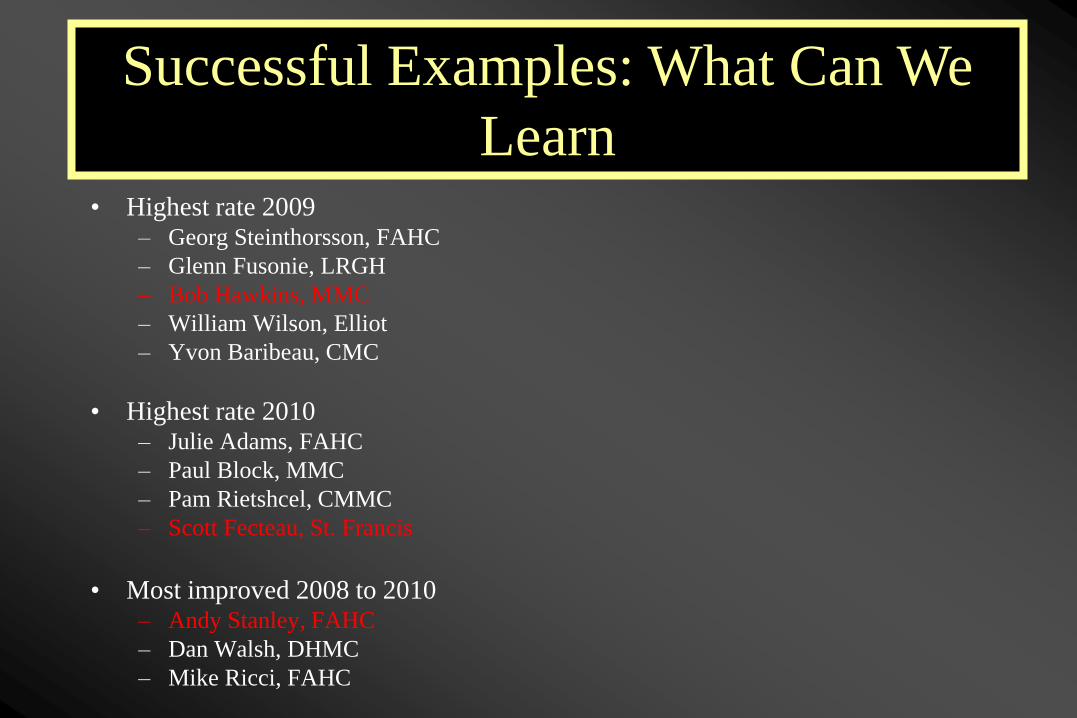
Successful Examples: What Can We
Learn • Highest rate 2009
– Georg Steinthorsson, FAHC
– Glenn Fusonie, LRGH
– Bob Hawkins, MMC
– William Wilson, Elliot
– Yvon Baribeau, CMC
• Highest rate 2010 – Julie Adams, FAHC
– Paul Block, MMC
– Pam Rietshcel, CMMC
– Scott Fecteau, St. Francis
• Most improved 2008 to 2010 – Andy Stanley, FAHC
– Dan Walsh, DHMC
– Mike Ricci, FAHC
Yale-New Haven Hospital/M2S Data
Integration
Jeffrey Indes M.D.
Medical Director VSGNE (YNHH)
October 28, 2010
• David Naccarato – Sr System Analyst (YNHH Lab IT)
• Marcelo Adaos - Periop System Administrator (YNHH OR IT)
• Pamela Hunt - Periop Project Manager (YNHH OR IT)
• Ke Zhang – R&D Project Manager (M2S)
• Deborah MacAulay- Account Executive (M2S)
• Diane Collins RN- Performance Manager (YNHH)
• Jennifer Young RN- Clinical Data Abstractor (YNHH)
• Jeffrey Indes MD- Medical Director (YNHH)
• Bauer Sumpio MD-Director YNHH-HVC Vascular Service
Data Integration
Multidisciplinary Team
• Yale New Haven Hospital (YNHH) began data entry into M2S Vascular Registry through VSGNE on September 1, 2010
• Physician compliance with data entry (Vasc, IR, Int. Cards)
• Improved user friendliness
• Accuracy of data entry
• Patient demographics sent to M2S to allow for a “pick list” of patient name or medical record number
• Abstractors can easily search for cases
Data Integration Importance

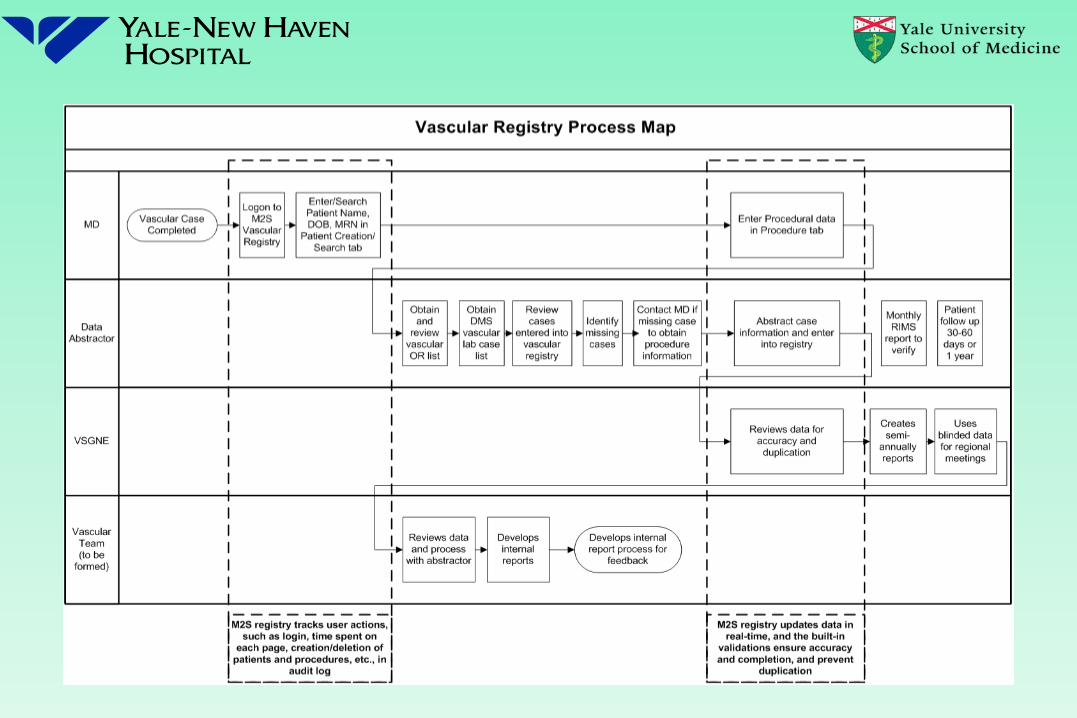
OR/Interventional Lab Data Extract
Workflow • Sequel server (SQL) query extracts the data from the OR
Centricity Perioperative system database and the interventional labs scheduling databases
• The data is saved in a Comma Separated Values (CSV) format
• Secure File Transfer Protocol (SFTP) function transmits the information in a secure channel to M2S (Required Hospital approval/ IT security approval)
• M2S integrates this data into their database
• A task schedule program runs both programs at 08:00 am with a 10 minute difference.

OR Schedule and Lab Schedule Upload
• Daily schedules uploaded to M2S automatically
• Lab schedule refreshes every 6 hours
• OR schedule refreshes every 24 hours
• M2S purges the patient database every 30 days
removing non-vascular registry cases
Data Validation and Processing by M2S
• Set up SFTP folder on M2S server for data transfer to ensure the security of patient data
• Validate every record to prevent creating duplication
• Automated notification to customer whenever mismatches or errors occur
• Automated notification to customer if a scheduled data transfer didn’t occur

Snapshot of YNHH/M2S Data
Integration

Thank You
Update on perioperative
Beta-Blocker Protocol
Jens Eldrup-Jorgensen, MD
Chief, Division of Vascular Surgery, MMC
Professor of Surgery, Tufts Univ Sch Med
Director, Vascular Center, MMC
Metoprolol 25 mg po BID
2003 Regimen
Metoprolol 25 mg po BID
Advantages –
selective agent
low dose- minimal chance of side effects
liver metabolism - not renal
available in IV formulation

Metoprolol 25 mg po BID
Disadvantages –
low dose – minimal clinical effect
some reports favor bisoprolol
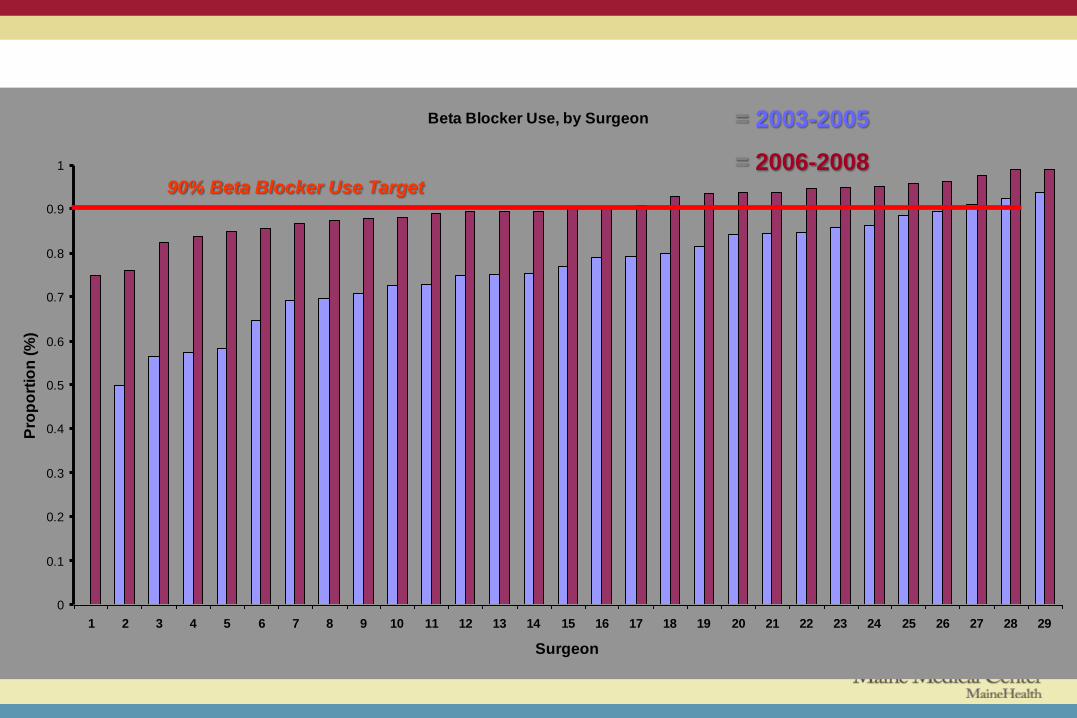
Increases Across All Surgeons Beta Blocker Use, by Surgeon
0
0.1
0.2
0.3
0.4
0.5
0.6
0.7
0.8
0.9
1
1 2 3 4 5 6 7 8 9 10 11 12 13 14 15 16 17 18 19 20 21 22 23 24 25 26 27 28 29
Surgeon
Pro
po
rtio
n (
%)
90% Beta Blocker Use Target
= 2003-2005
= 2006-2008

Beta Blocker Use Across Centers
Beta Blocker Use, By Center
63%
72%
76%
81%85%
88%86%
90% 90% 91% 91%94%
0
0.1
0.2
0.3
0.4
0.5
0.6
0.7
0.8
0.9
1
1 2 3 4 5 6
Center
Pro
po
rtio
n
90% Beta Blocker Use Target
= 2003-2005
= 2006-2008
0%
10%
20%
30%
40%
50%
60%
70%
80%
90%
100%
Jan-
Mar
03
April-
June
03
July-
Sept
03
Oct-
Dec
03
Jan-
Mar
04
April-
June
04
July-
Sept
04
Oct-
Dec
04
Jan-
Mar
05
April-
June
05
July-
Sept
05
Oct-
Dec
05
Jan-
Mar
06
April-
June
06
July-
Sept
06
Oct-
Dec
06
Jan-
Mar
07
April-
June
07
July-
Sept
07
Oct-
Dec
07
Jan-
Mar
08
Apr-
Jun
08
July-
Sept
08
Oct-
Dec
08
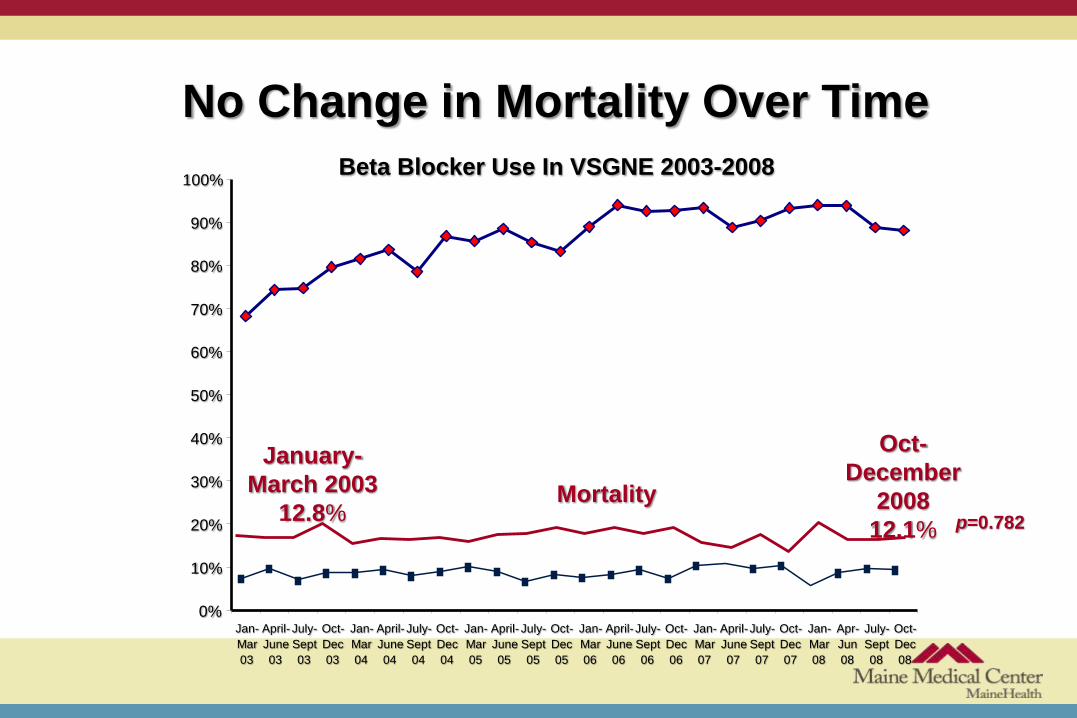
Beta Blocker Use In VSGNE 2003-2008
January-
March 2003
12.8%
Oct-
December
2008
12.1% p=0.782
Mortality
No Change in Mortality Over Time
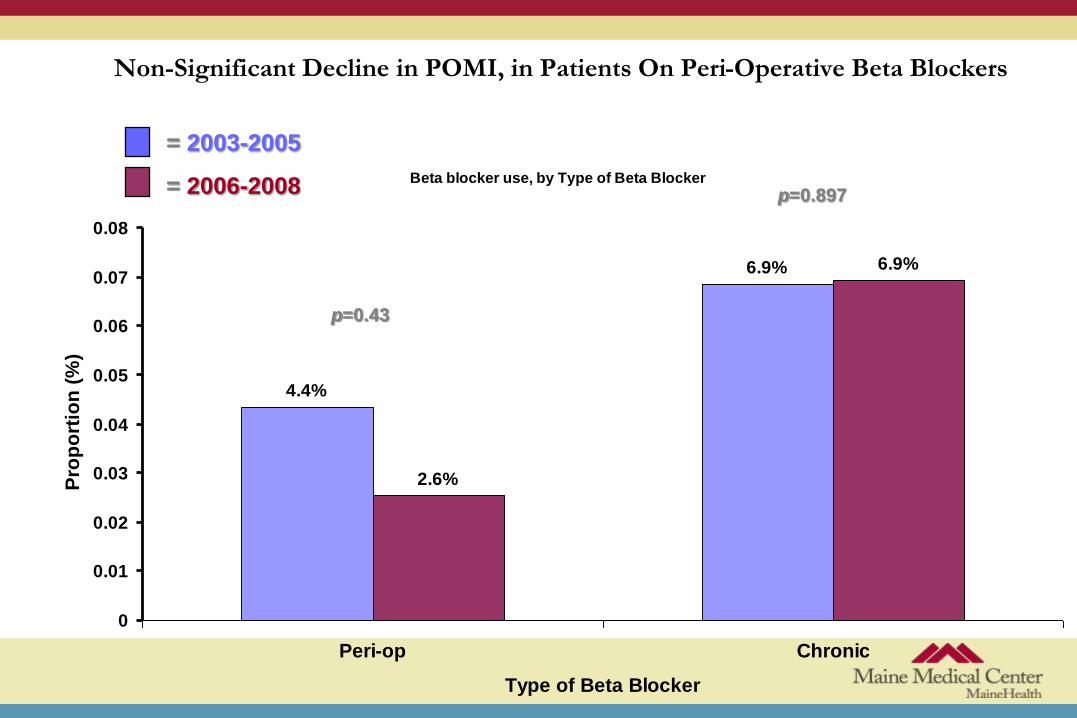
Non-Significant Decline in POMI, in Patients On Peri-Operative Beta Blockers
Beta blocker use, by Type of Beta Blocker
4.4%
6.9%
2.6%
6.9%
0
0.01
0.02
0.03
0.04
0.05
0.06
0.07
0.08
Peri-op Chronic
Type of Beta Blocker
Pro
po
rtio
n (
%)
p=0.43
p=0.897
= 2003-2005
= 2006-2008

Increase in Chronic and Perioperative Beta Blockers
54%57% 54%
59%64% 61%
20%25%
31%
33%
28%31%
0
0.25
0.5
0.75
2003 2004 2005 2006 2007 2008
Year
Pro
po
rtio
n (
%)
p<0.01
p<0.01
CHRONIC BETA BLOCKERS
PERI-OP BETA BLOCKERS
0%
10%
20%
30%
40%
50%
60%
70%
80%
90%
100%
Jan-
Mar
03
April-
June
03
July-
Sept
03
Oct-
Dec
03
Jan-
Mar
04
April-
June
04
July-
Sept
04
Oct-
Dec
04
Jan-
Mar
05
April-
June
05
July-
Sept
05
Oct-
Dec
05
Jan-
Mar
06
April-
June
06
July-
Sept
06
Oct-
Dec
06
Jan-
Mar
07
April-
June
07
July-
Sept
07
Oct-
Dec
07
Jan-
Mar
08
Apr-
Jun
08
July-
Sept
08
Oct-
Dec
08
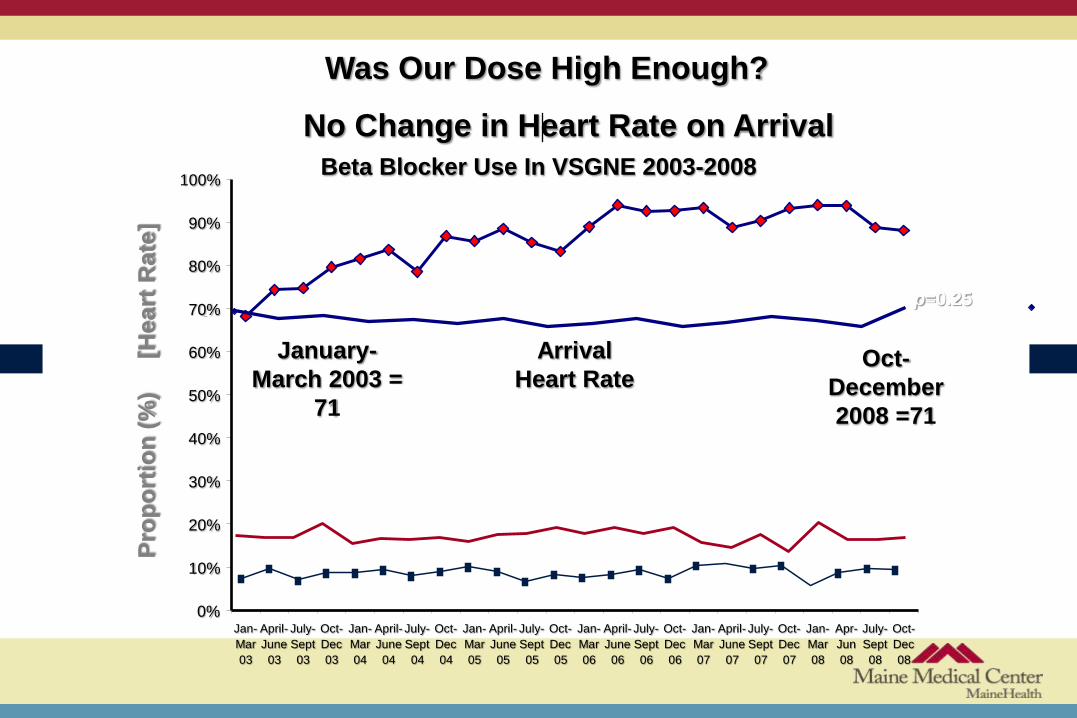
Beta Blocker Use In VSGNE 2003-2008
January-
March 2003 =
71
Oct-
December
2008 =71
p=0.25
Arrival
Heart Rate
Was Our Dose High Enough?
No Change in Heart Rate on Arrival P
rop
ort
ion
(%
)
[H
eart
Rate
]
Pre op Management
VSGNE Questions
• This was a successful process improvement initiative
• There was no impact on clinical outcomes
Pre op Management VSGNE Questions
Why was there no effect on cardiovascular outcomes?
• Beta blockers are most effective in high risk patients
undergoing high risk operations
• We had a high incidence of high risk patients on chronic
beta blockers
• Much of our improvement was in low risk patients
• There was minimal impact on HR
Pre op Management
Guidelines for pre-op management:
European Soc Card/Euro Soc Anesthesiology
Conclusions
Significant reduction in perioperative ischemia, MI, and cardiac mortality
Risk reduction more marked in high risk patients
Does not decrease risk in low risk patients and may be harmful
Debatable in intermediate risk patients
Treatment onset and choice of doses are limited
Ischemia and troponin are reduced and long term outcome improved in patients with lower heart rate
Pre op Management
Guidelines for pre-op management:
European Soc Cardiology/Eur Anesthesiology
Recommendations
Beta blocker should be titrated
Start 30 day and at least 7 day preoperatively
Bisoprolol 2.5 mg or Metoprolol 50 mg daily
titrated to HR 60-70
Duration of therapy unknown

Pre op Management
ACC/AHA Guidelines
Beta blocker
I. Continue BB in pts currently taking
IIa. Start titrated BB in pts with CAD or high risk (RCRI>1)
IIb. Usefulness uncertain in intermediate (RCRI-1) to low risk (RCRI-0)
Pre op Management
VSGNE Questions
Perioperative BB therapy
• Should we risk stratify patients before starting beta
blocker??
• Or should we not give to low risk patients?

Pre op Management
VSGNE Questions
Perioperative BB therapy
• Should we use a different beta blocker??
• Bisoprolol vs metoprolol.

Pre op Management
VSGNE Questions
Perioperative BB therapy
• Should we use a different dose??
• 25 mg BID is a low dose.
• Does not affect HR (?MI)
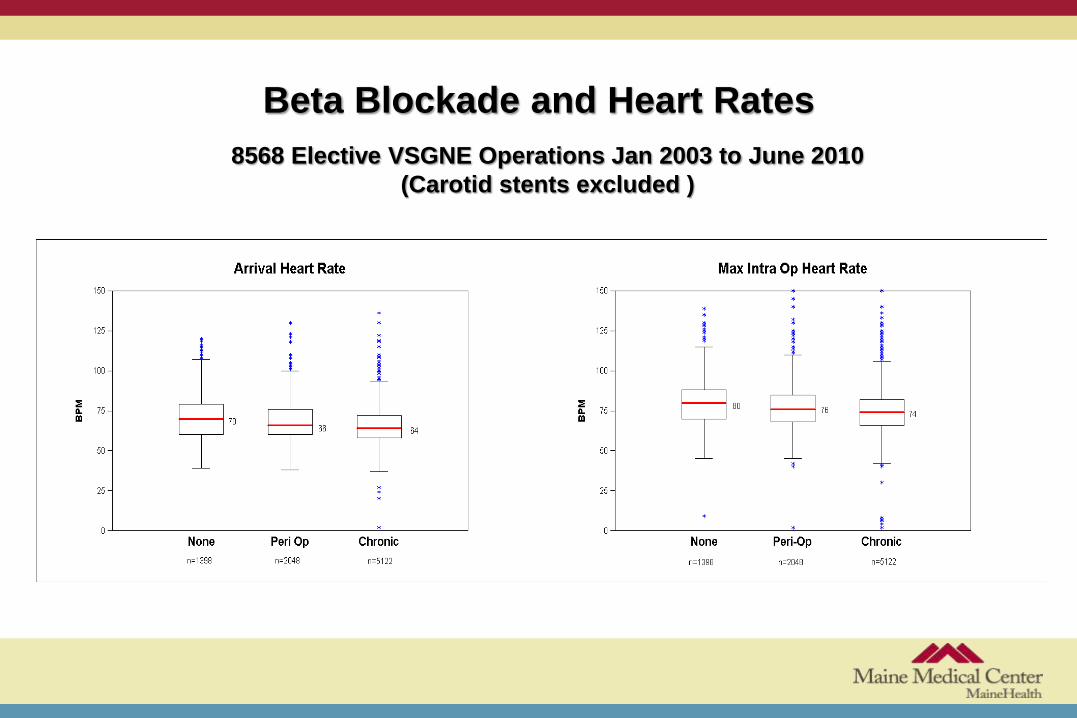
Beta Blockade and Heart Rates
8568 Elective VSGNE Operations Jan 2003 to June 2010
(Carotid stents excluded )

Pre op Management
VSGNE Questions
Perioperative BB therapy
• Should we titrate the dose to heart rate??
• Decreased heart rate tend to correlate with
decreased postop MI.
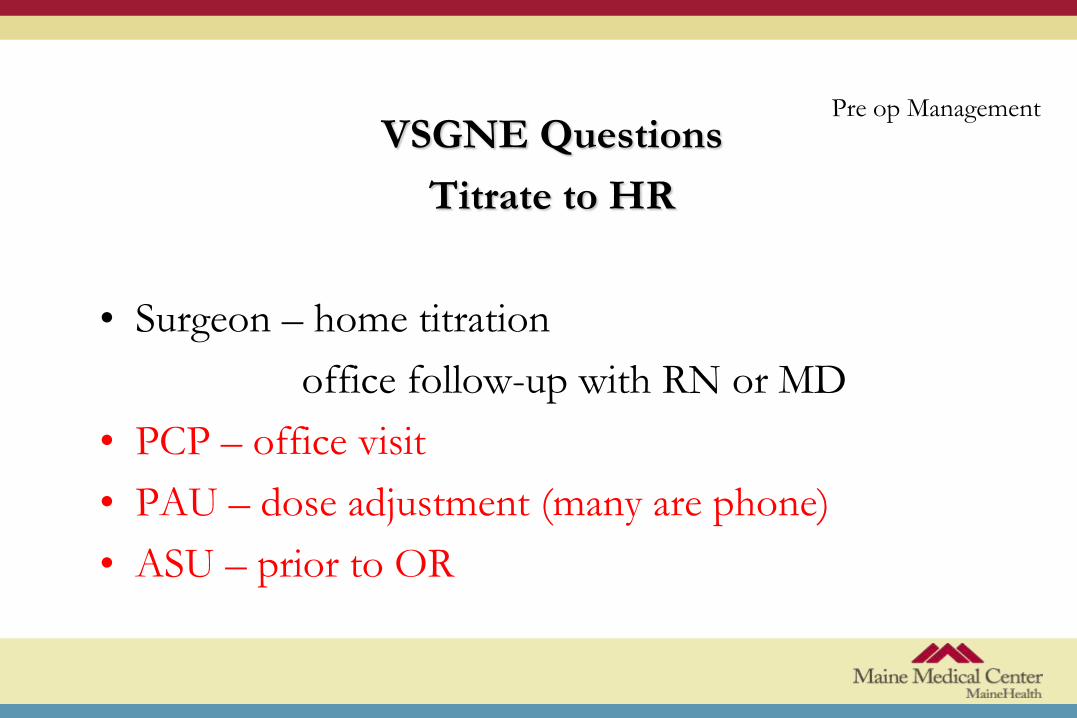
Pre op Management
VSGNE Questions
Titrate to HR
• Surgeon – home titration
office follow-up with RN or MD
• PCP – office visit
• PAU – dose adjustment (many are phone)
• ASU – prior to OR
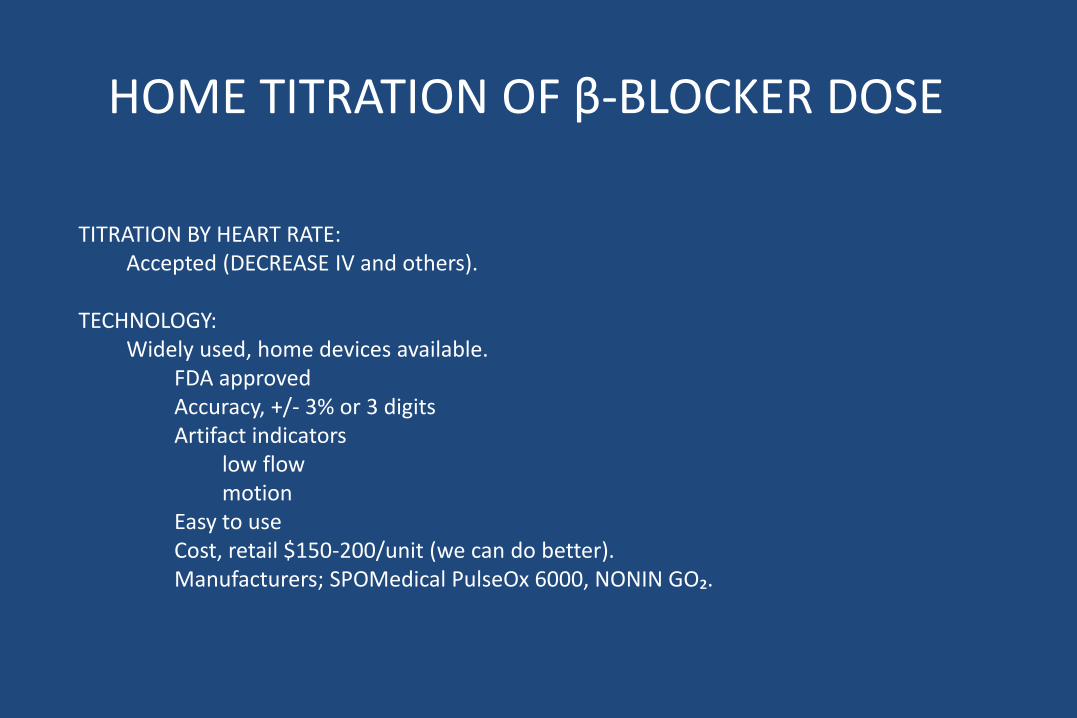
HOME TITRATION OF β-BLOCKER DOSE
TITRATION BY HEART RATE: Accepted (DECREASE IV and others). TECHNOLOGY: Widely used, home devices available. FDA approved Accuracy, +/- 3% or 3 digits Artifact indicators low flow motion Easy to use Cost, retail $150-200/unit (we can do better). Manufacturers; SPOMedical PulseOx 6000, NONIN GO₂.

HOME TITRATION OF β-BLOCKER DOSE
BABY STEPS Pilot: Identify device(s) Obtain 20 (10 each). Instruct and send home with typical patients not on β-blocker to use daily for one week. Verify appropriate use in office. Protocol: Target Population Dose, Drug and HR parameters Start time pre-op ?IRB
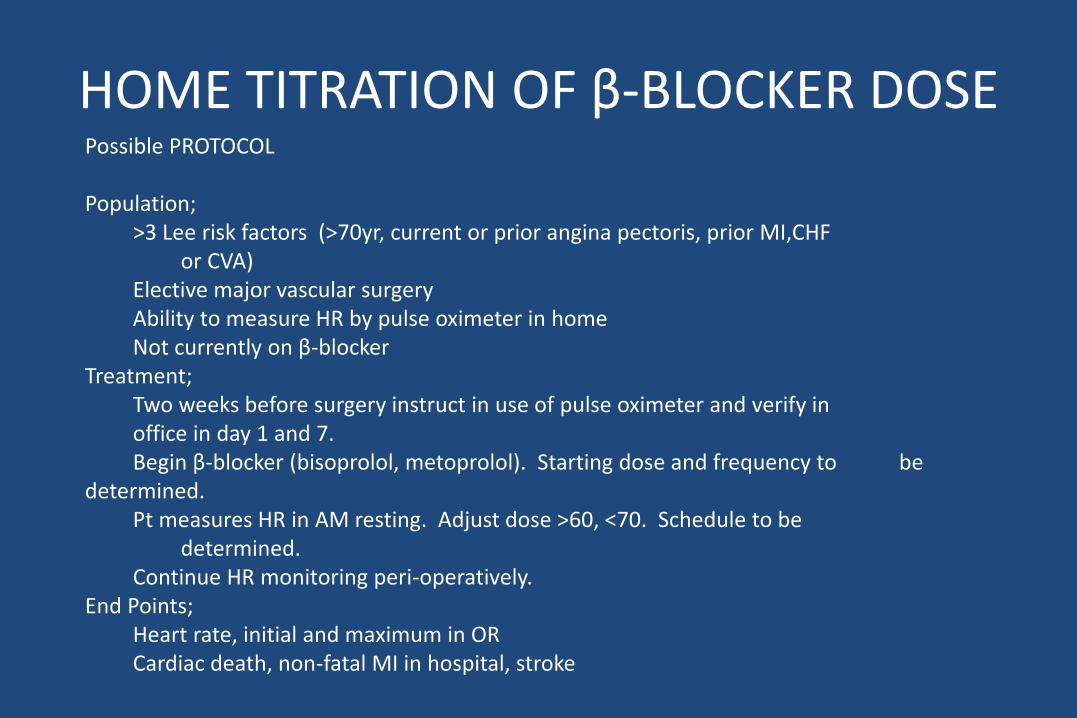
HOME TITRATION OF β-BLOCKER DOSE Possible PROTOCOL Population; >3 Lee risk factors (>70yr, current or prior angina pectoris, prior MI,CHF or CVA) Elective major vascular surgery Ability to measure HR by pulse oximeter in home Not currently on β-blocker Treatment; Two weeks before surgery instruct in use of pulse oximeter and verify in office in day 1 and 7. Begin β-blocker (bisoprolol, metoprolol). Starting dose and frequency to be determined. Pt measures HR in AM resting. Adjust dose >60, <70. Schedule to be determined. Continue HR monitoring peri-operatively. End Points; Heart rate, initial and maximum in OR Cardiac death, non-fatal MI in hospital, stroke

Community-based Registries
for QI and Comparative
Effectiveness
A Challenging Partnership
Ellen Farrokhi, M.D.
Virginia Mason Medical Center
Rationale
• Adverse outcomes and errors are a part of clinical care
• Quality monitoring and improvement
– Good for
• Patients
• Payers
• Surgeons
• OR is a profit and a loss center
• Most surgeons have no meaningful benchmarking
• Registries for QI can also be used to address comparative
effectiveness

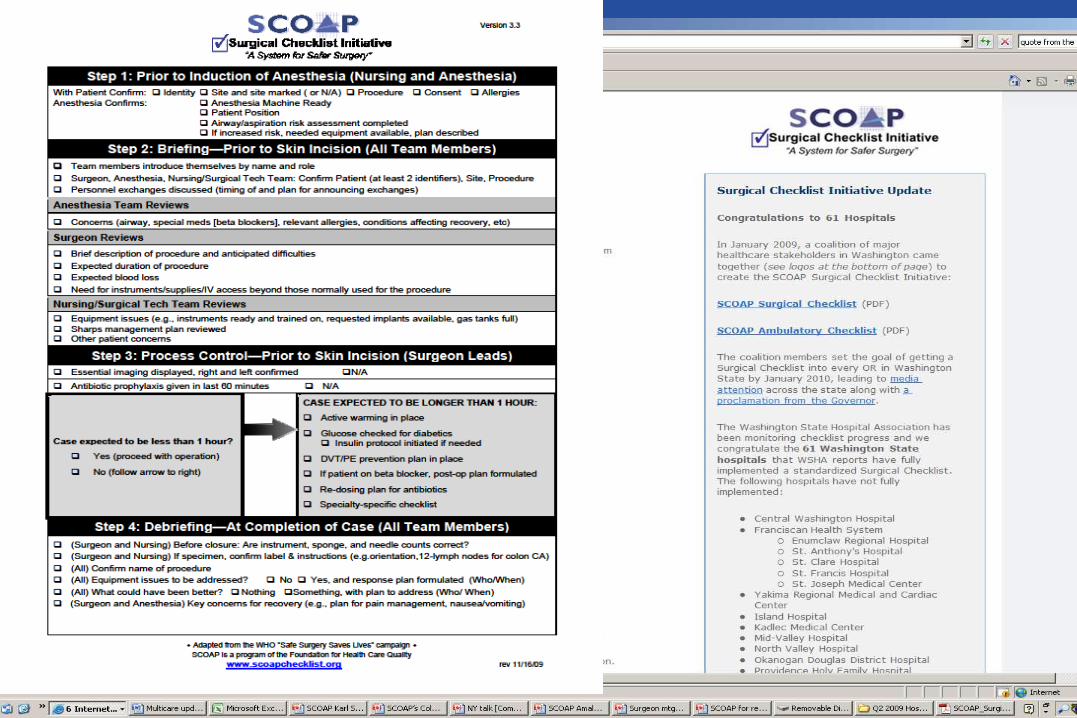
What is SCOAP?
• A surgeon-led collaborative using a data driven quality surveillance and response system to deliver more appropriate, safer and higher quality surgical care across the Pacific Northwest
• How does it work? – Surveillance of surgical process and outcome metrics that are relevant to
patients and surgeons-fed back to clinicians
– Active change using ;
• Checklists
• Standard orders
• Education programs
• Benchmarks

Seattle Spokane
Yakima
•
Wenatchee
Richland
The Scope of SCOAP
Port
Townsend
Sunnyside
Aberdeen Kirkland
Portland
Longview
Port
Angeles Mt Vernon
Tacoma
Olympia
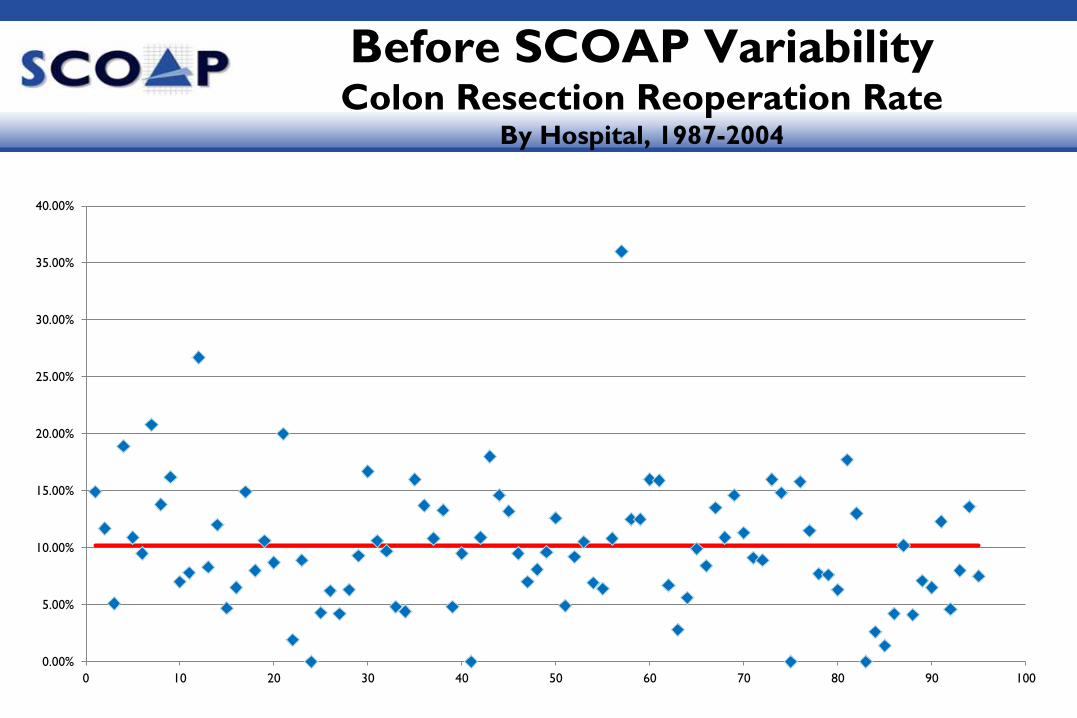
Before SCOAP Variability Colon Resection Reoperation Rate
By Hospital, 1987-2004
0.00%
5.00%
10.00%
15.00%
20.00%
25.00%
30.00%
35.00%
40.00%
0 10 20 30 40 50 60 70 80 90 100
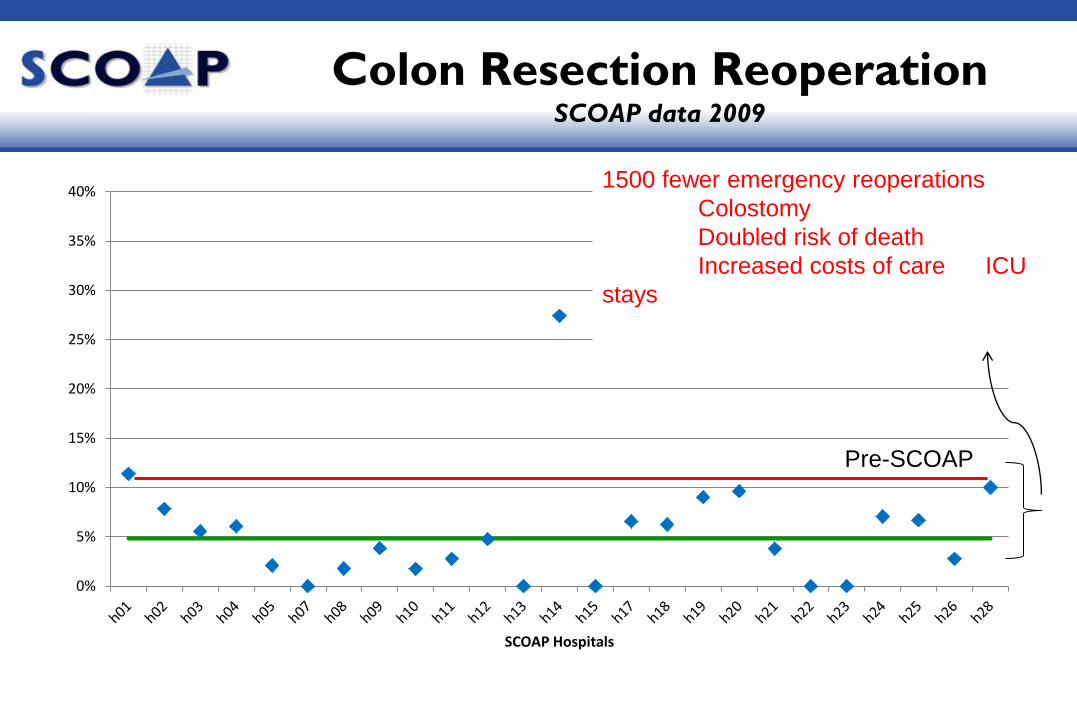
Colon Resection Reoperation SCOAP data 2009
0%
5%
10%
15%
20%
25%
30%
35%
40%
SCOAP Hospitals
Pre-SCOAP
1500 fewer emergency reoperations
Colostomy
Doubled risk of death
Increased costs of care ICU
stays
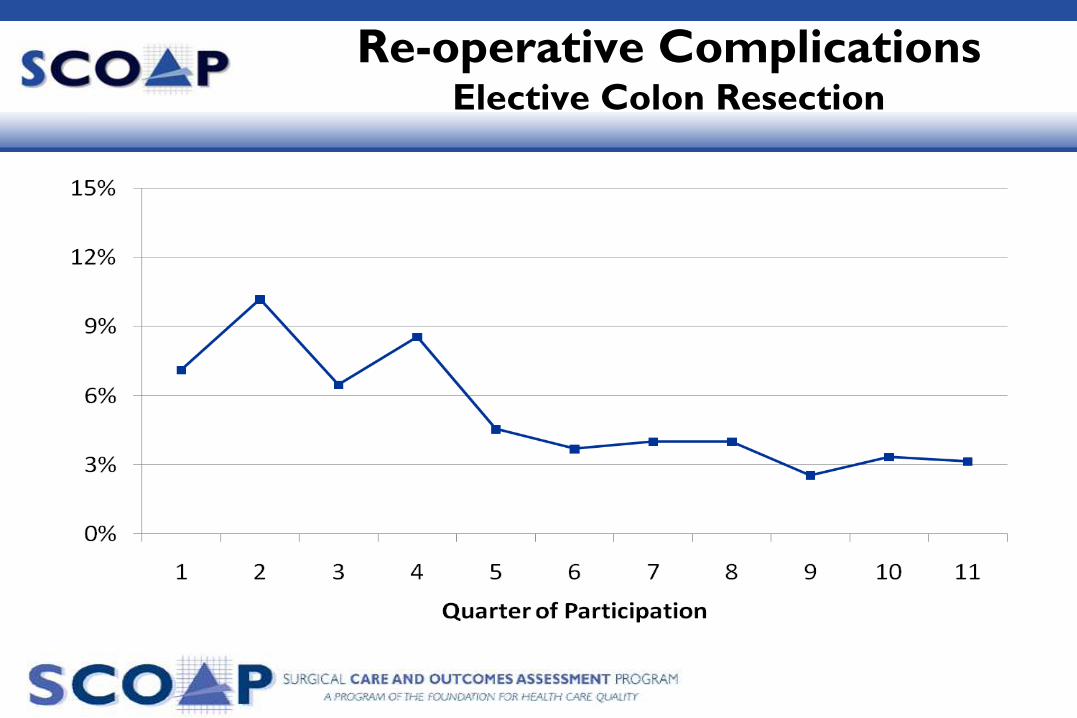
Re-operative Complications Elective Colon Resection

Testing for Leak in OR Prevents Reoperation After OR
0%
20%
40%
60%
80%
100%
Q1 06 Q2 Q3 Q4 Q1 07 Q2 Q3 Q4 Q1 08 Q2 Q3 Q4
(Denominator)
Clinician
Engagement
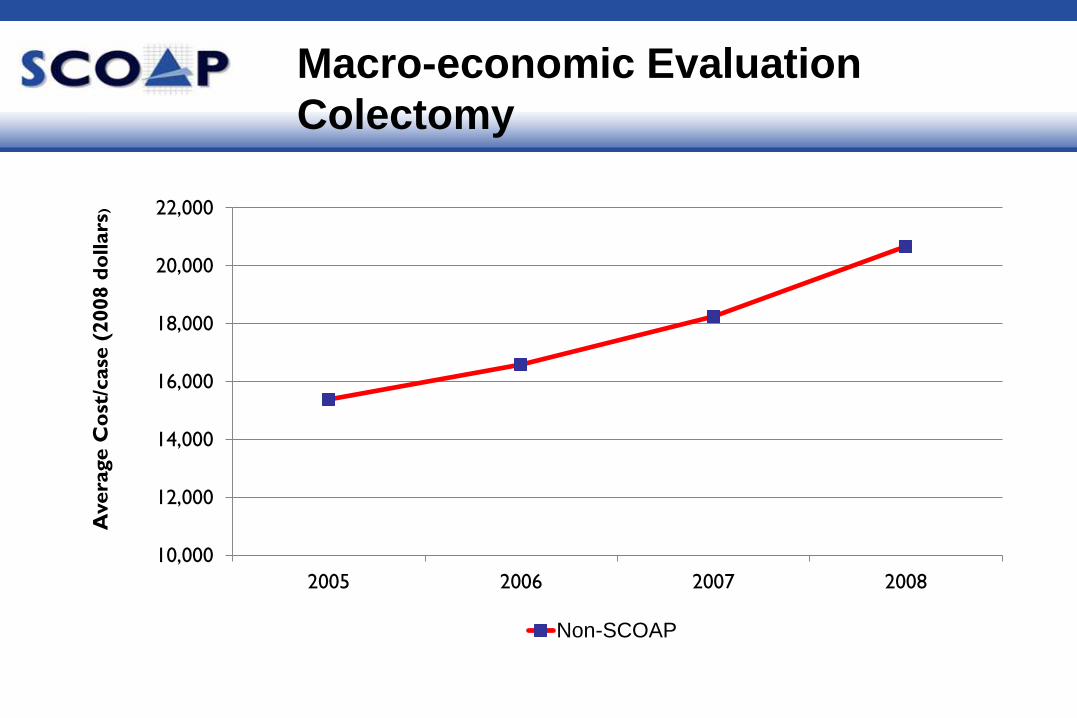
10,000
12,000
14,000
16,000
18,000
20,000
22,000
2005 2006 2007 2008
Avera
ge C
ost
/case
(2008 d
ollars
)
Non-SCOAP
Macro-economic Evaluation
Colectomy
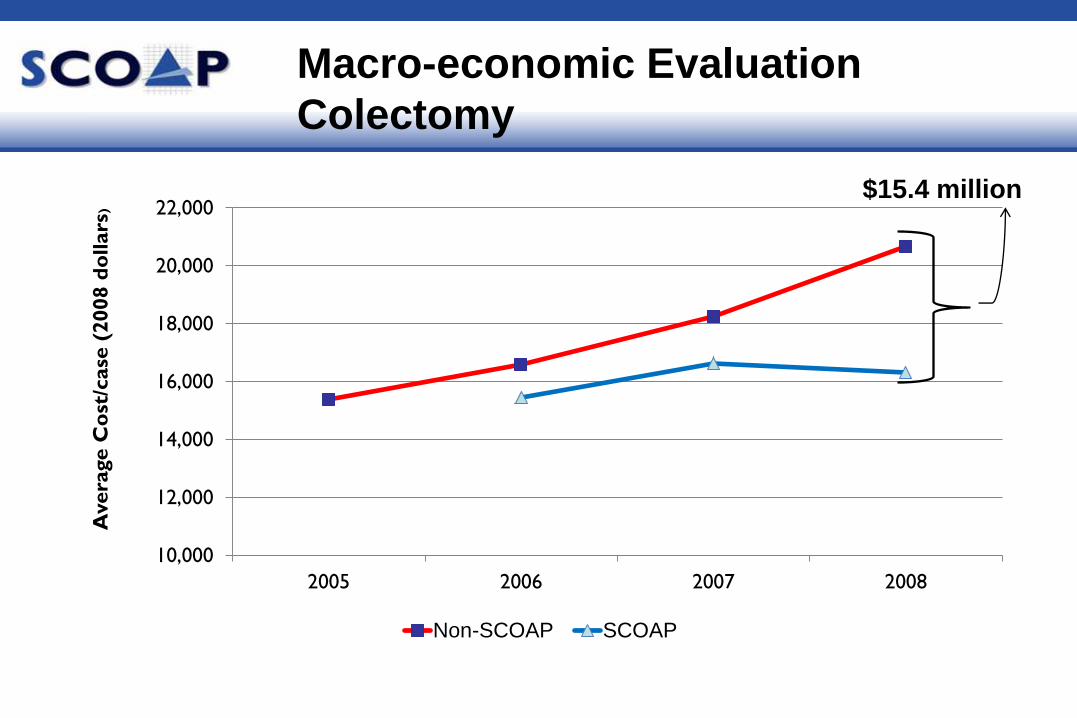
10,000
12,000
14,000
16,000
18,000
20,000
22,000
2005 2006 2007 2008
Avera
ge C
ost
/case
(2008 d
ollars
)
Non-SCOAP SCOAP
Macro-economic Evaluation
Colectomy
$15.4 million

$10,000
$12,000
$14,000
$16,000
$18,000
$20,000
$22,000
$24,000
2006 2007 2008
Non-SCOAP SCOAP
Macro-economic Evaluation
Gastric Bypass
$20.8 million
Calculated Savings-$60 million/4 yrs
Reduced LOS
Reduced intensity of care
Macroeconomic Impact
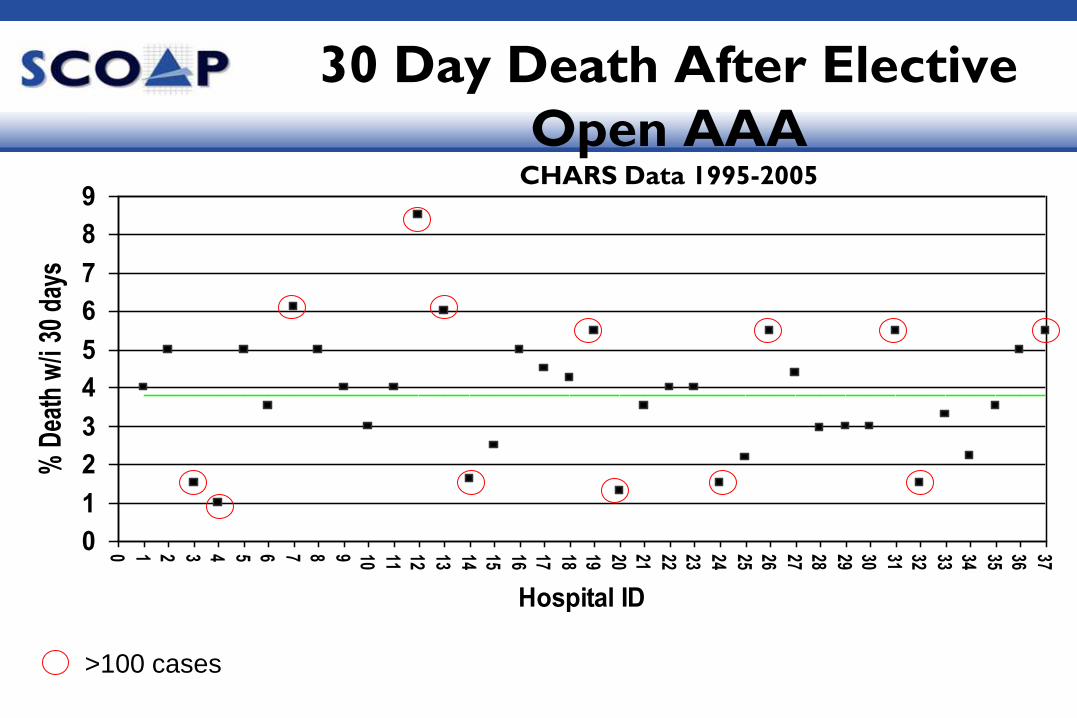
30 Day Death After Elective
Open AAA CHARS Data 1995-2005
0
1
2
3
4
5
6
7
8
9
0 1 2 3 4 5 6 7 8 9 10 11 12 13 14 15 16 17 18 19 20 21 22 23 24 25 26 27 28 29 30 31 32 33 34 35 36 37
Hospital ID
% D
eath
w/i
30 d
ays
>100 cases
Vascular Interventions SCOAP
A Community Working Together to Improve
the Quality of Vascular Care
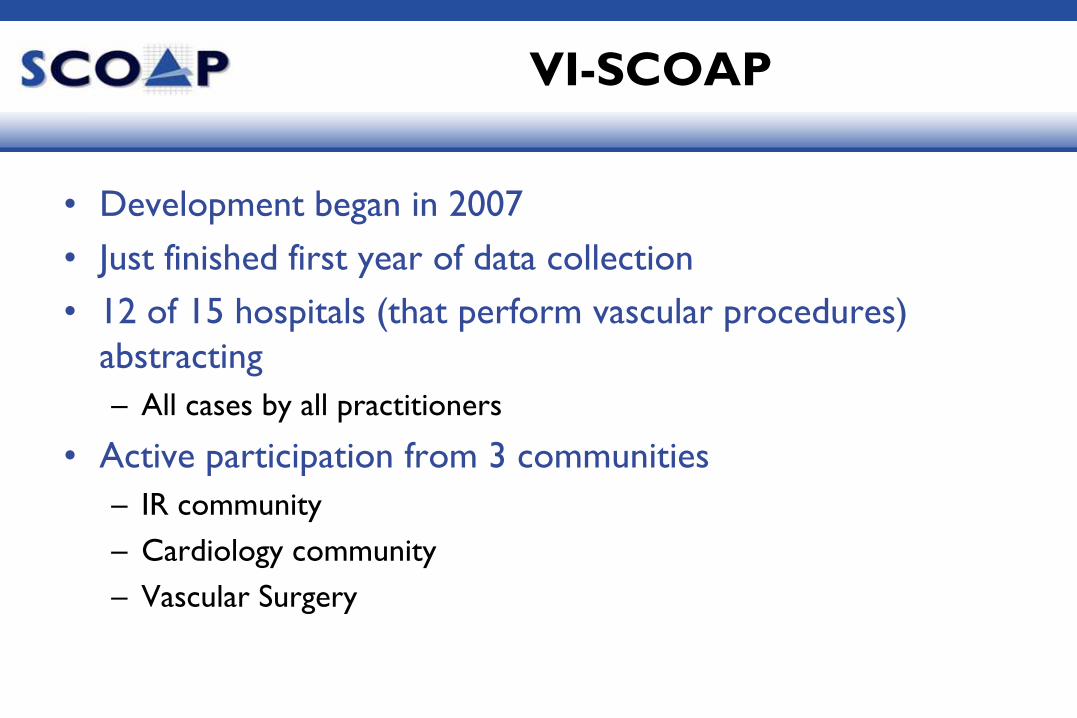
VI-SCOAP
• Development began in 2007
• Just finished first year of data collection
• 12 of 15 hospitals (that perform vascular procedures)
abstracting
– All cases by all practitioners
• Active participation from 3 communities
– IR community
– Cardiology community
– Vascular Surgery
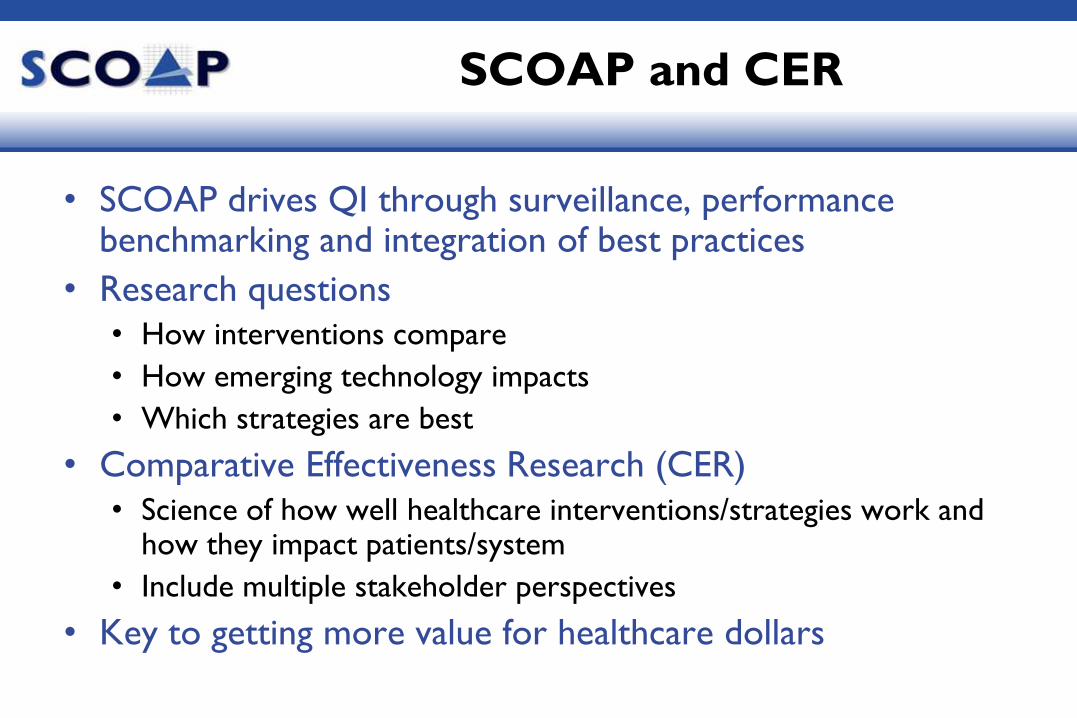
SCOAP and CER
• SCOAP drives QI through surveillance, performance benchmarking and integration of best practices
• Research questions
• How interventions compare
• How emerging technology impacts
• Which strategies are best
• Comparative Effectiveness Research (CER)
• Science of how well healthcare interventions/strategies work and how they impact patients/system
• Include multiple stakeholder perspectives
• Key to getting more value for healthcare dollars
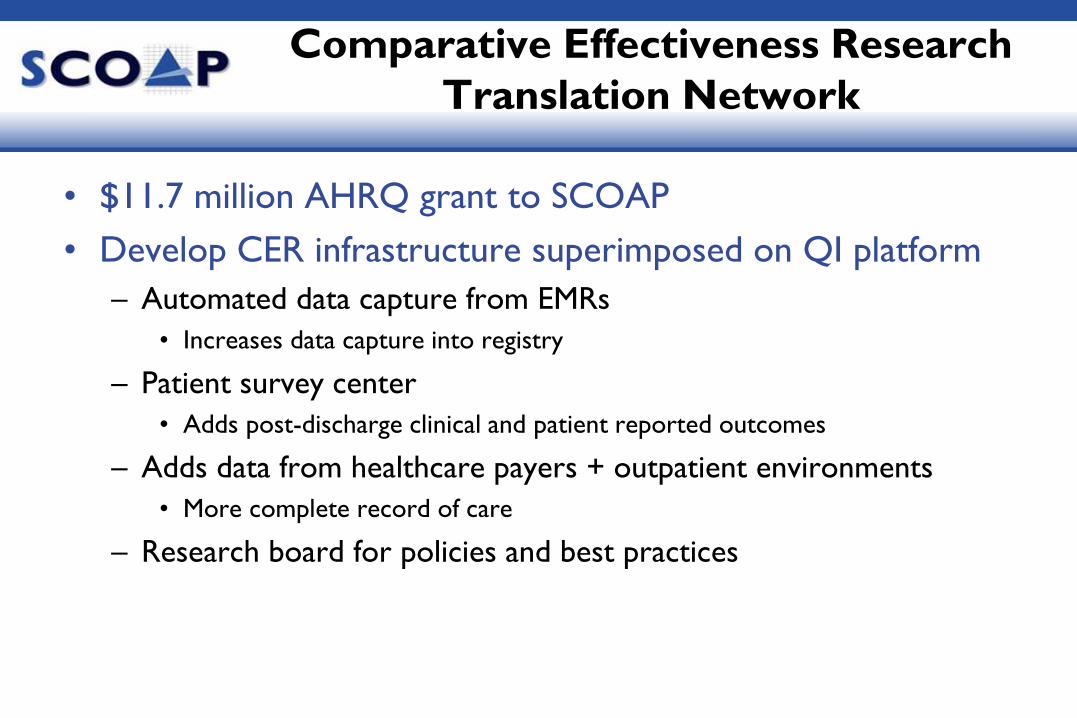
Comparative Effectiveness Research
Translation Network
• $11.7 million AHRQ grant to SCOAP
• Develop CER infrastructure superimposed on QI platform
– Automated data capture from EMRs
• Increases data capture into registry
– Patient survey center
• Adds post-discharge clinical and patient reported outcomes
– Adds data from healthcare payers + outpatient environments
• More complete record of care
– Research board for policies and best practices

SCOAP CERTN
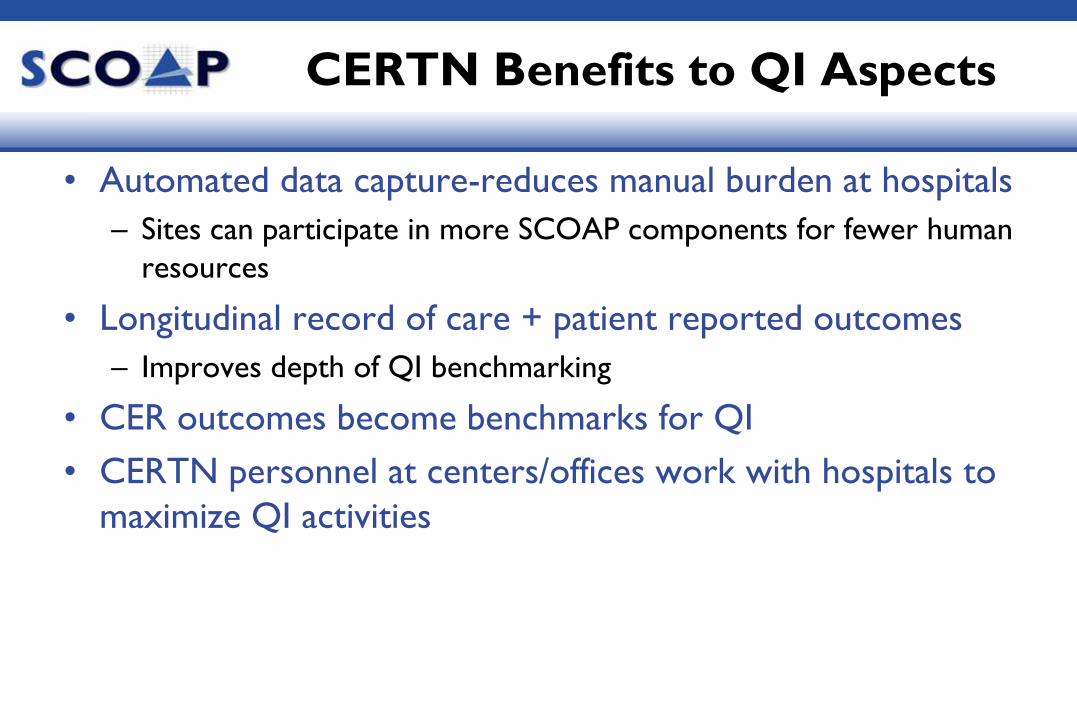
CERTN Benefits to QI Aspects
• Automated data capture-reduces manual burden at hospitals
– Sites can participate in more SCOAP components for fewer human
resources
• Longitudinal record of care + patient reported outcomes
– Improves depth of QI benchmarking
• CER outcomes become benchmarks for QI
• CERTN personnel at centers/offices work with hospitals to
maximize QI activities
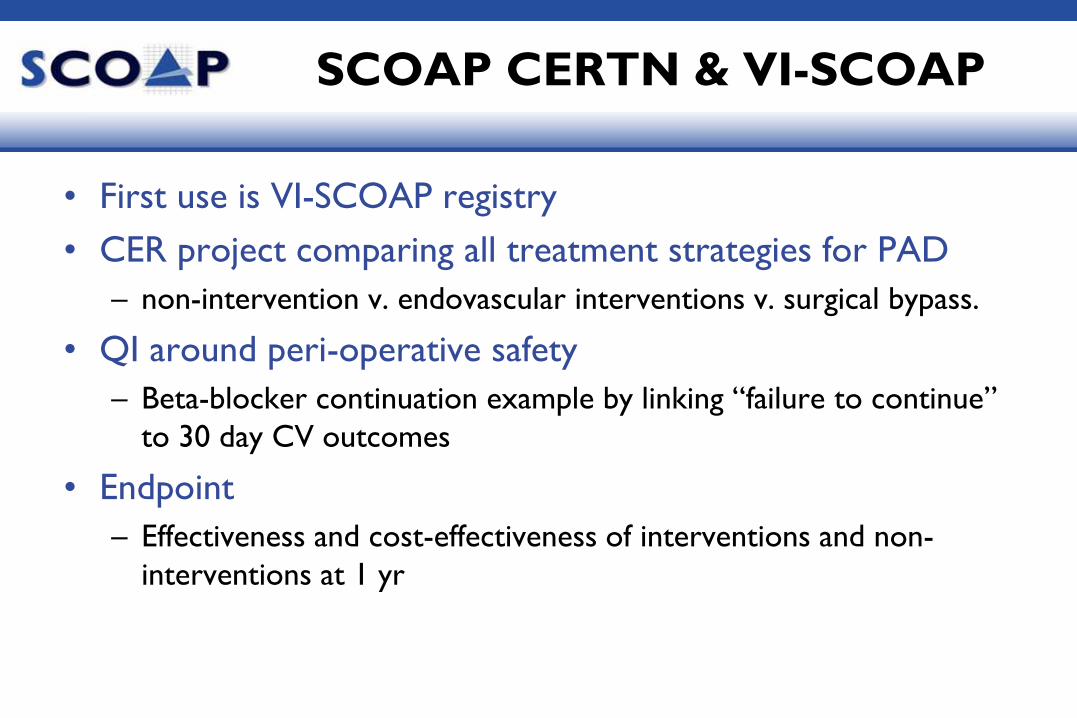
SCOAP CERTN & VI-SCOAP
• First use is VI-SCOAP registry
• CER project comparing all treatment strategies for PAD
– non-intervention v. endovascular interventions v. surgical bypass.
• QI around peri-operative safety
– Beta-blocker continuation example by linking “failure to continue”
to 30 day CV outcomes
• Endpoint
– Effectiveness and cost-effectiveness of interventions and non-
interventions at 1 yr
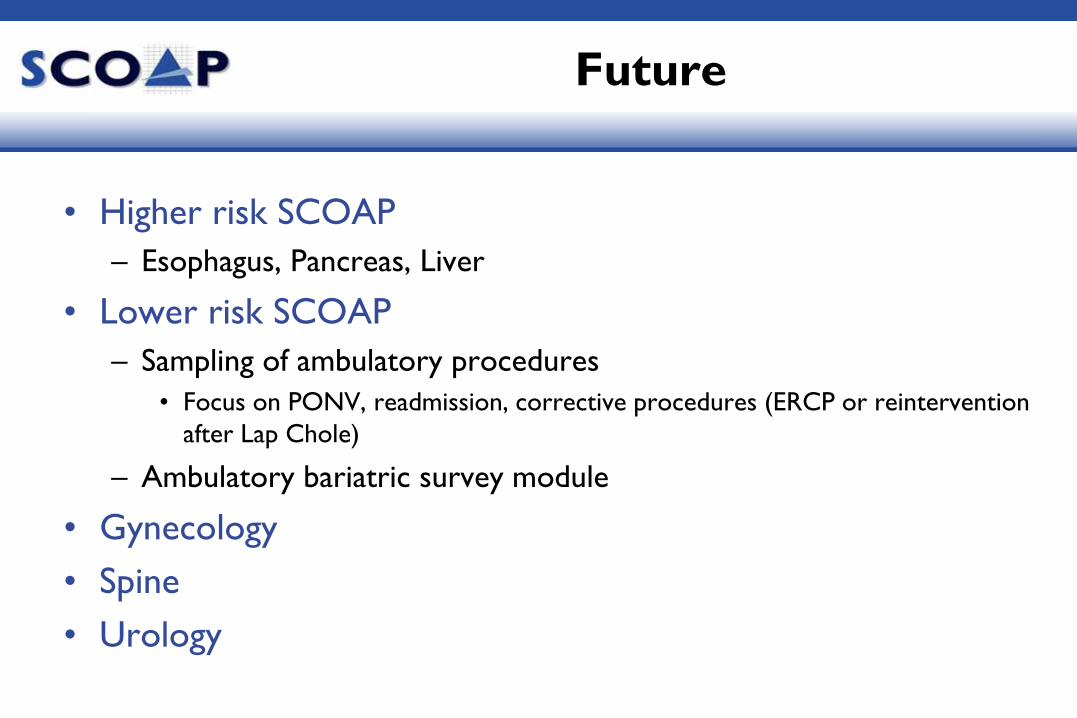
Future
• Higher risk SCOAP
– Esophagus, Pancreas, Liver
• Lower risk SCOAP
– Sampling of ambulatory procedures
• Focus on PONV, readmission, corrective procedures (ERCP or reintervention
after Lap Chole)
– Ambulatory bariatric survey module
• Gynecology
• Spine
• Urology

To Find Out More
www.scoap.org

Quality Improvement
Reducing Complication Rates
Open AAA Repair
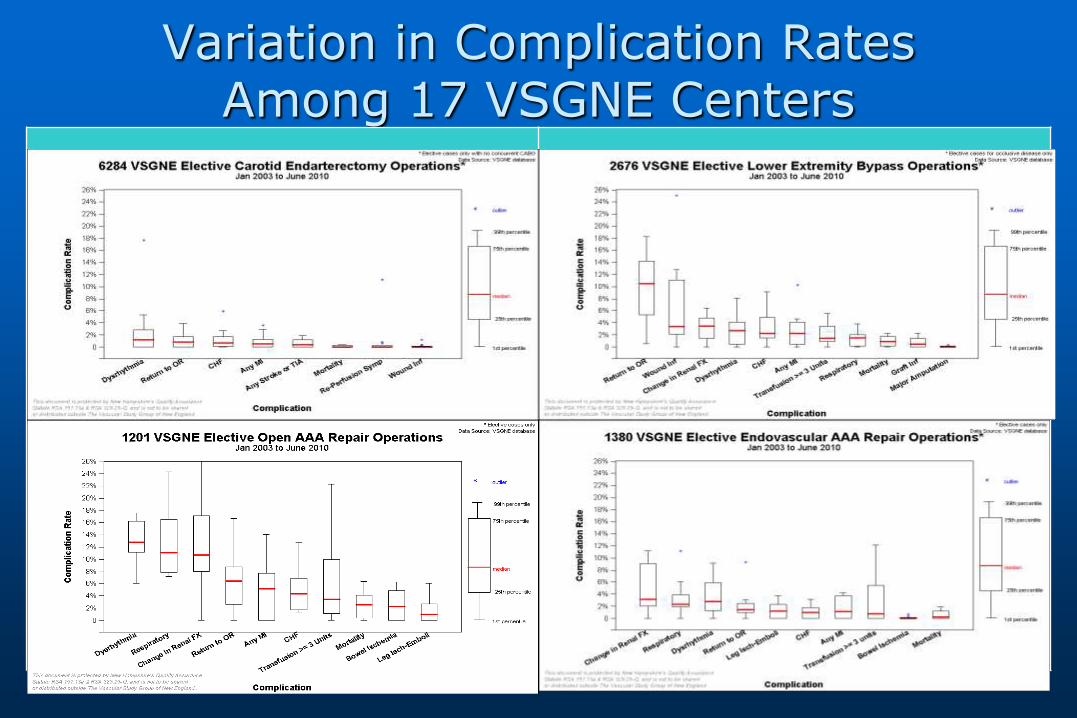
Variation in Complication Rates Among 17 VSGNE Centers
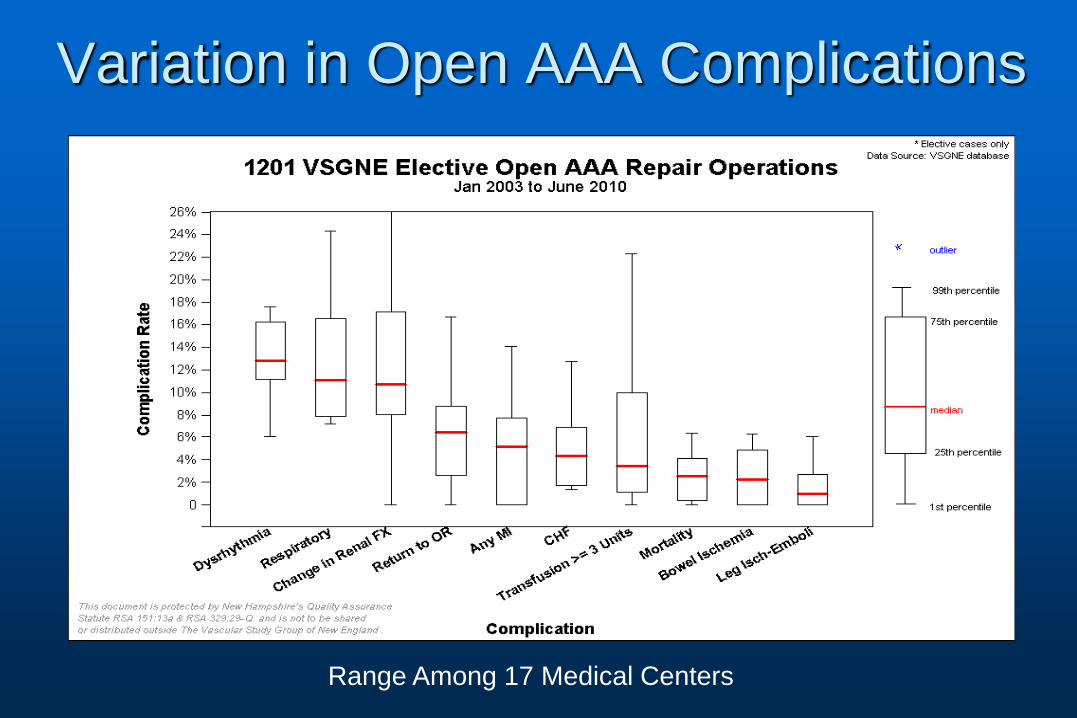
Variation in Open AAA Complications
Range Among 17 Medical Centers
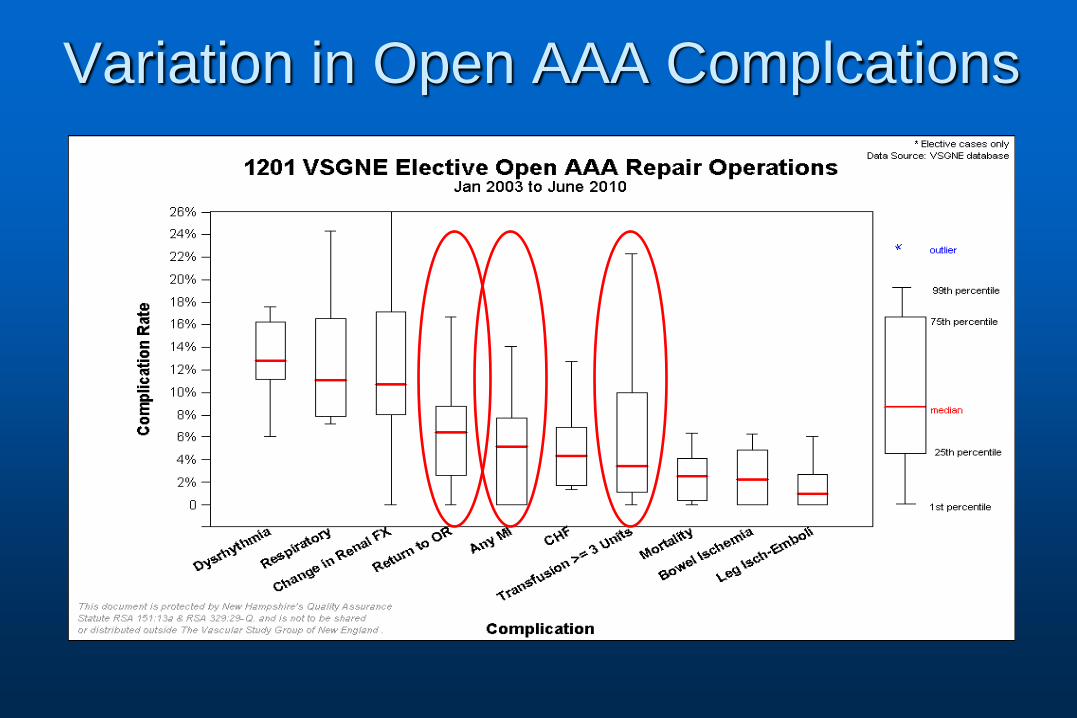
Variation in Open AAA Complcations
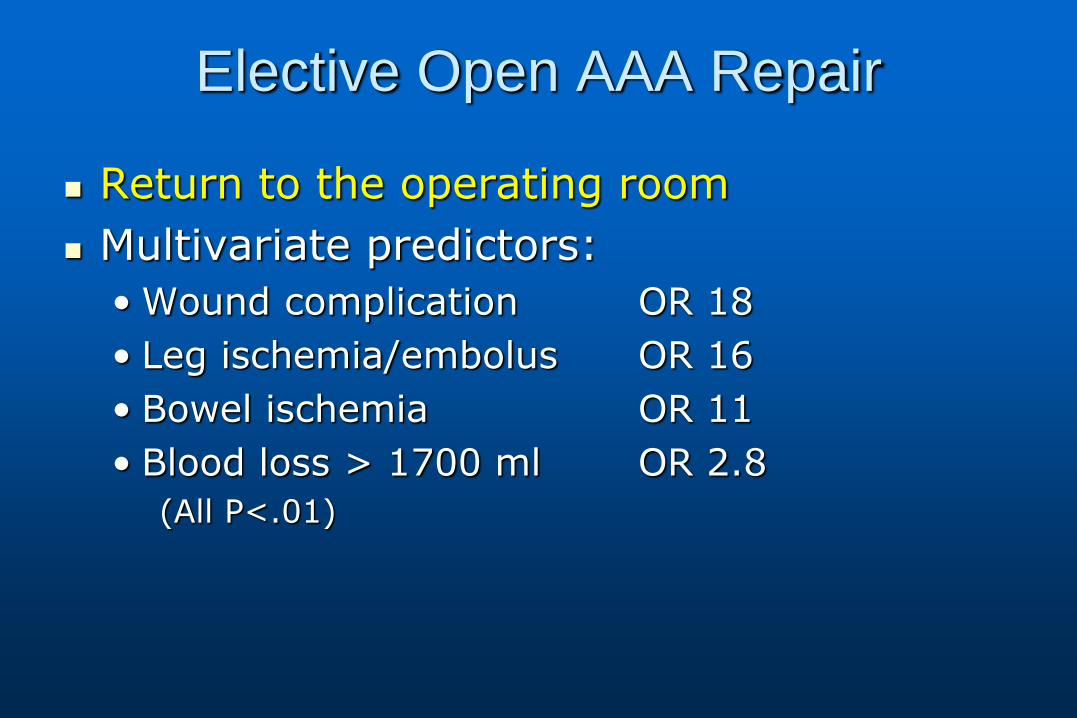
Elective Open AAA Repair
Return to the operating room
Multivariate predictors:
• Wound complication OR 18
• Leg ischemia/embolus OR 16
• Bowel ischemia OR 11
• Blood loss > 1700 ml OR 2.8
(All P<.01)
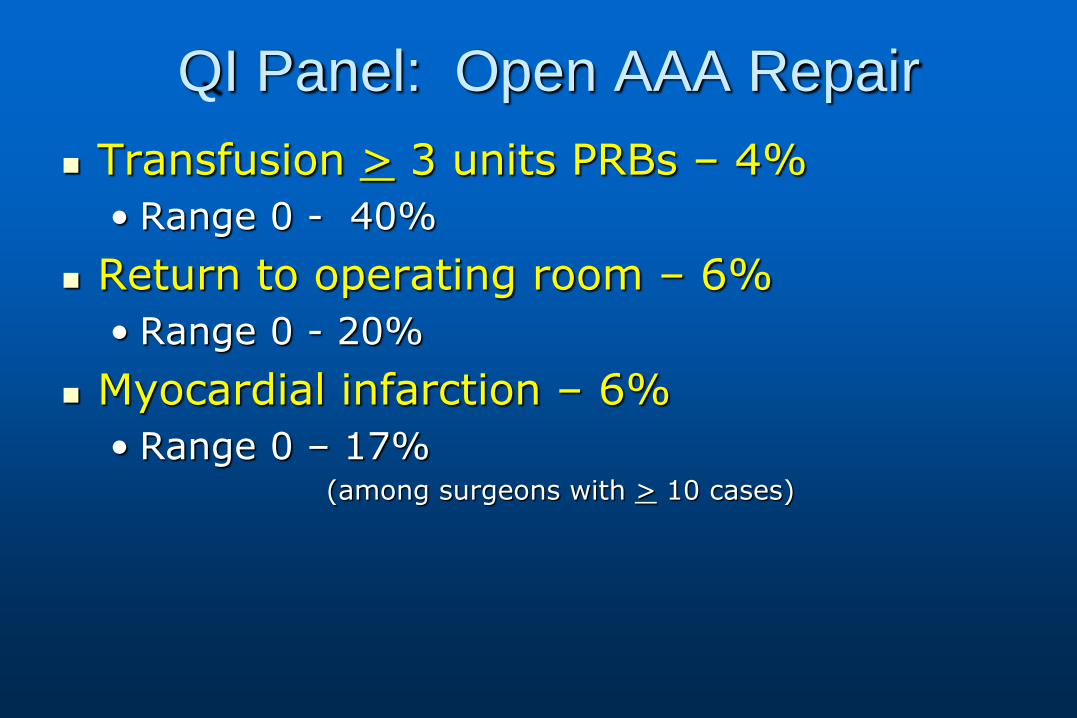
QI Panel: Open AAA Repair
Transfusion > 3 units PRBs – 4%
• Range 0 - 40%
Return to operating room – 6%
• Range 0 - 20%
Myocardial infarction – 6%
• Range 0 – 17% (among surgeons with > 10 cases)

Quality Improvement Topics
Post-op glucose management – Brian Nolan
Pre-op imaging for CEA – Brian Nolan
Predicting outcome after AAA rupture – Will Robinson
Wound infection after LEB – Jeff Kalish
Smoking cessation – Andy Hoel
LOS and complications – David Kuwayama
Functional outcome after amputation – Bjorn Suckow
Post-Operative Blood Glucose Management Update
Brian W. Nolan, MD, MS
Post-op Glucose Management
• Initial analysis
– Prevalence of diabetes in vascular patients
– Outcomes of diabetics
• QI effort over last several years surrounding management of post-operative blood glucose in diabetic patients.
– Fletcher-Allen
Question
• Can protocol based care improve post-operative glucose control and outcomes?
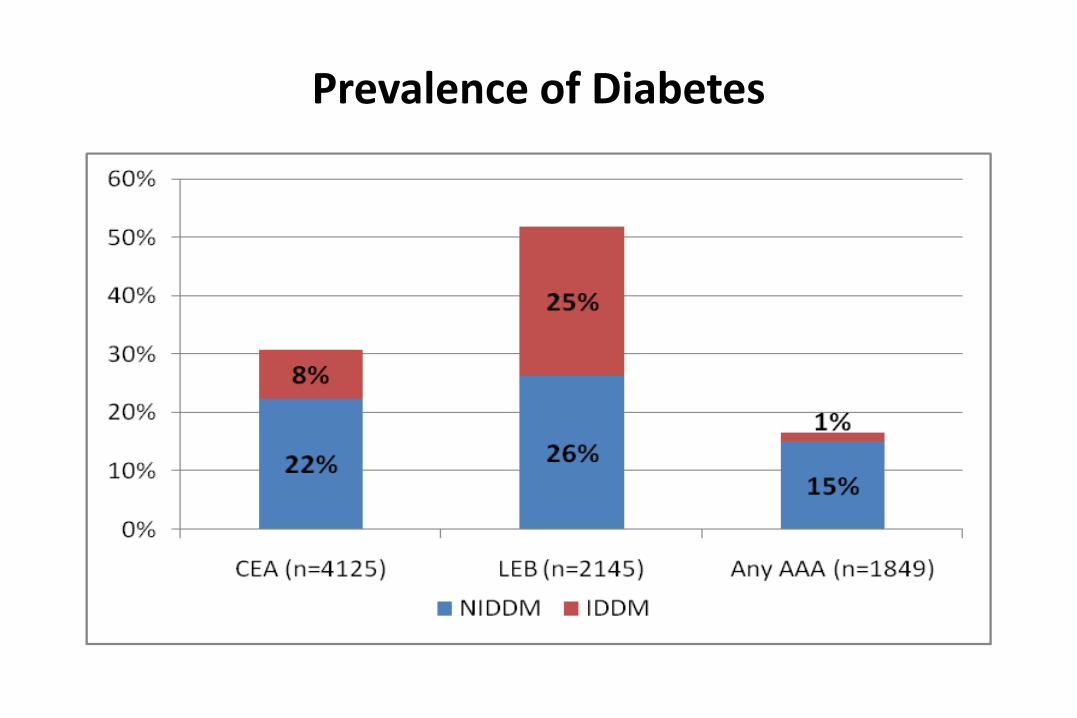
Prevalence of Diabetes

Post-Operative Complication Rates Po
st-O
p M
.A.E
. Rat
e
*
* p<0.05
*
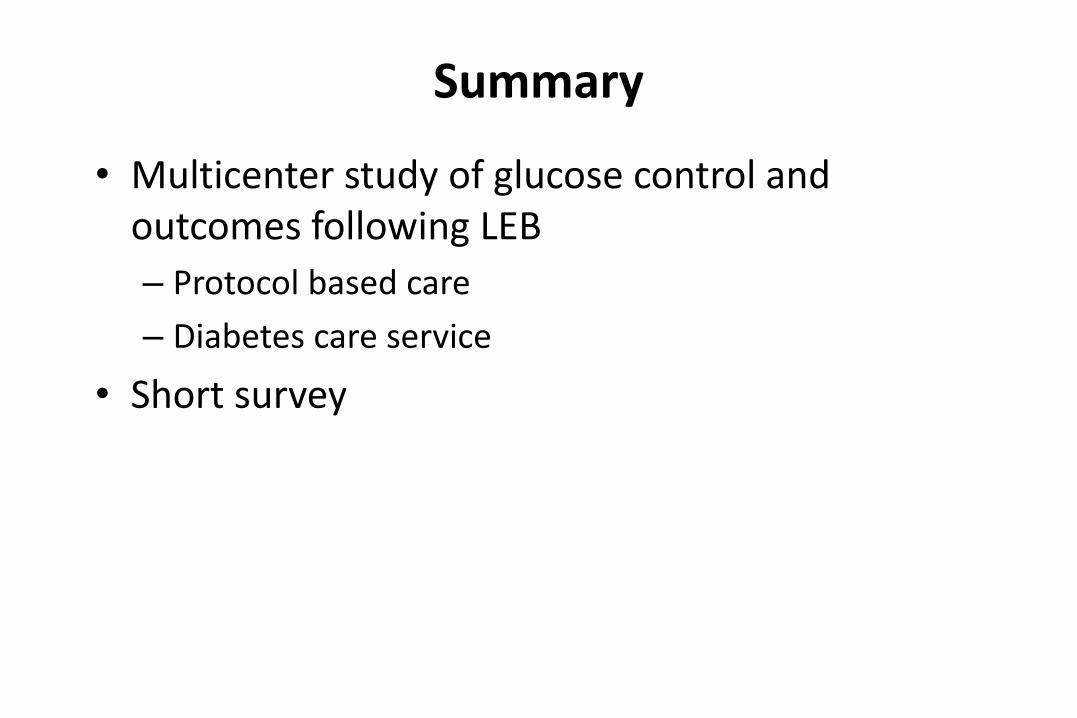
Summary
• Multicenter study of glucose control and outcomes following LEB
– Protocol based care
– Diabetes care service
• Short survey
Preoperative Imaging for CEA
Brian W. Nolan, MD, MS and David Kuwayama, MD
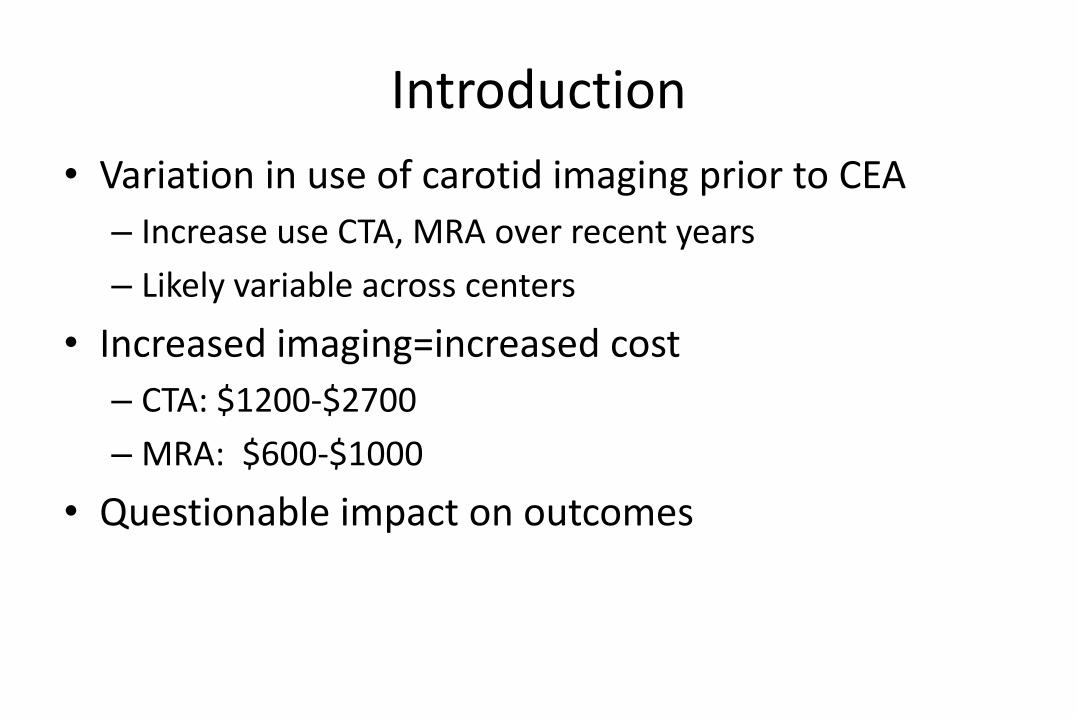
Introduction
• Variation in use of carotid imaging prior to CEA
– Increase use CTA, MRA over recent years
– Likely variable across centers
• Increased imaging=increased cost
– CTA: $1200-$2700
– MRA: $600-$1000
• Questionable impact on outcomes
Question
• Is more better? Does additional pre-operative imaging improve outcomes of CEA?
Aims • Describe pre-operative imaging across time and center.
• Determine risk adjusted outcomes by imaging modality.

Sample
• 6,379 CEA at 12 centers, 2003-2009
• Exclusions…
– 118; concomitant CABG
– 3; missing outcomes data
– 12; missing imaging data
• N=6,246; analytic sample
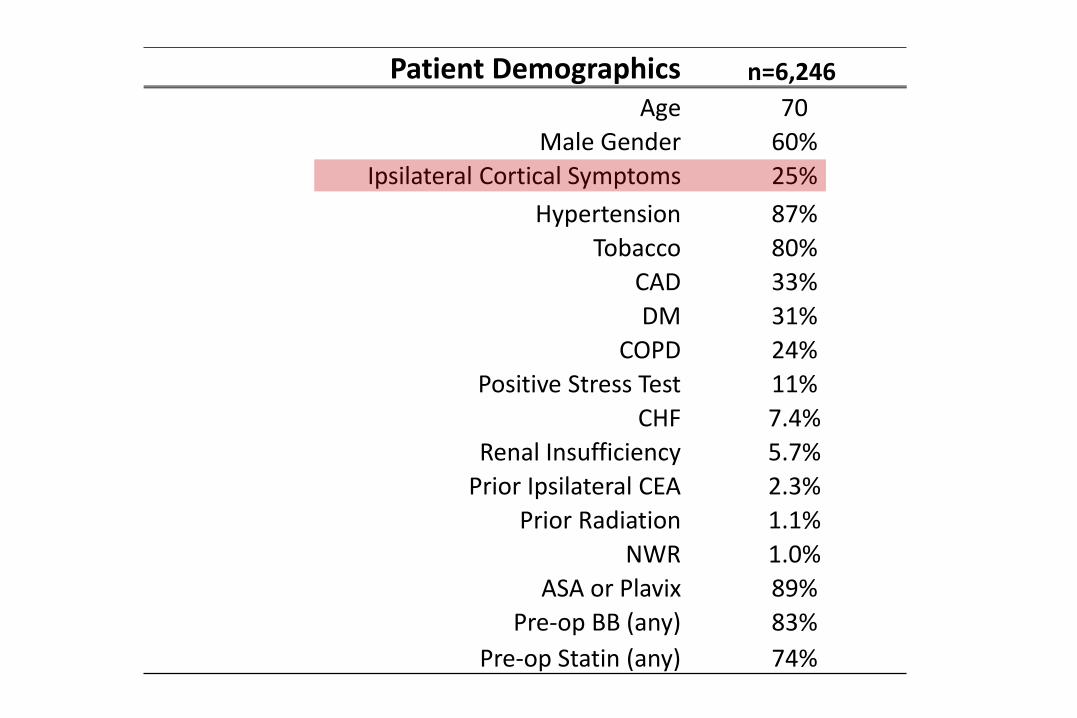
Patient Demographics n=6,246
Age 70
Male Gender 60%
Ipsilateral Cortical Symptoms 25%
Hypertension 87%
Tobacco 80%
CAD 33%
DM 31%
COPD 24%
Positive Stress Test 11%
CHF 7.4%
Renal Insufficiency 5.7%
Prior Ipsilateral CEA 2.3%
Prior Radiation 1.1%
NWR 1.0%
ASA or Plavix 89%
Pre-op BB (any) 83%
Pre-op Statin (any) 74%
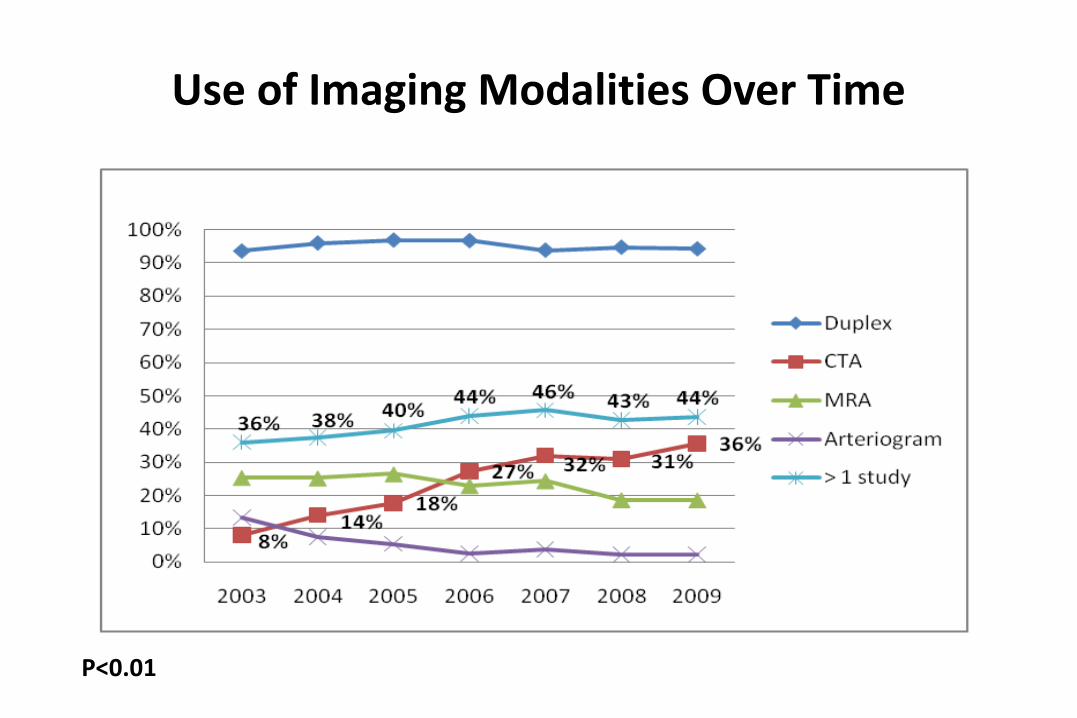
Use of Imaging Modalities Over Time
*
*
*
P<0.01
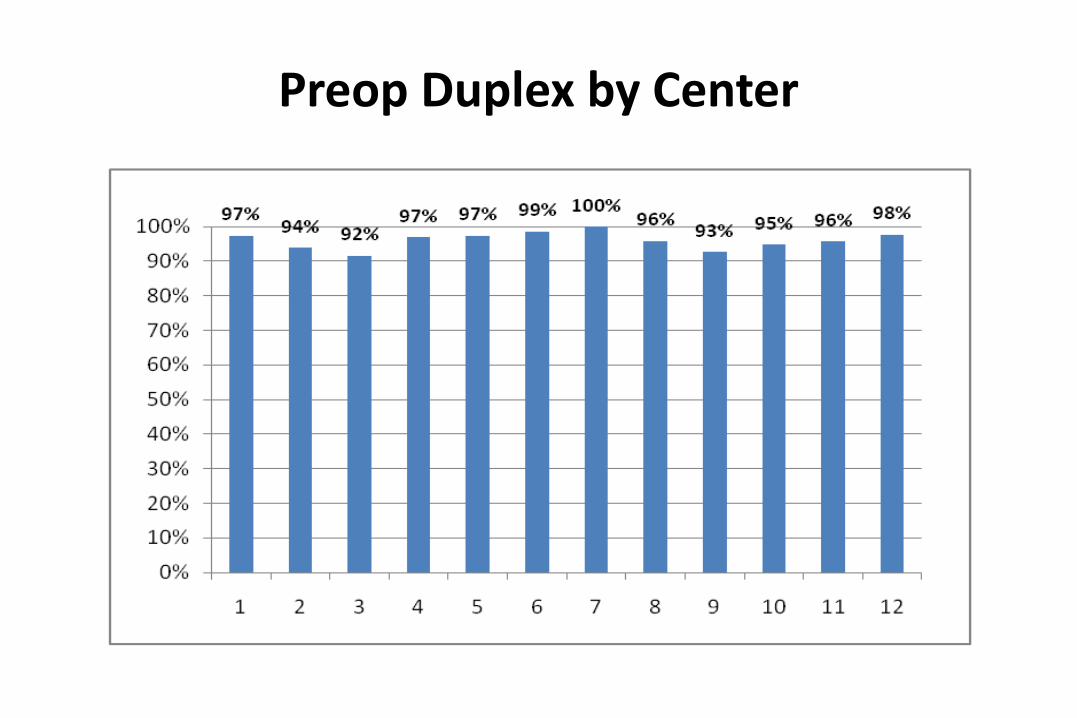
Preop Duplex by Center

Preop CTA by Center
25%
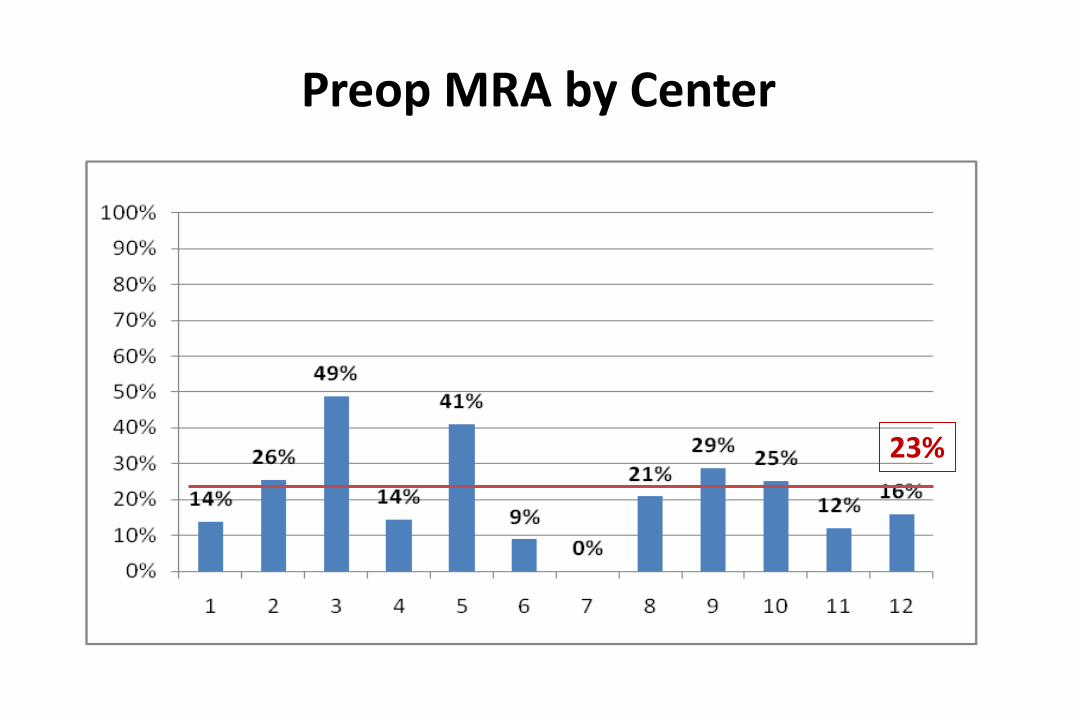
Preop MRA by Center
23%
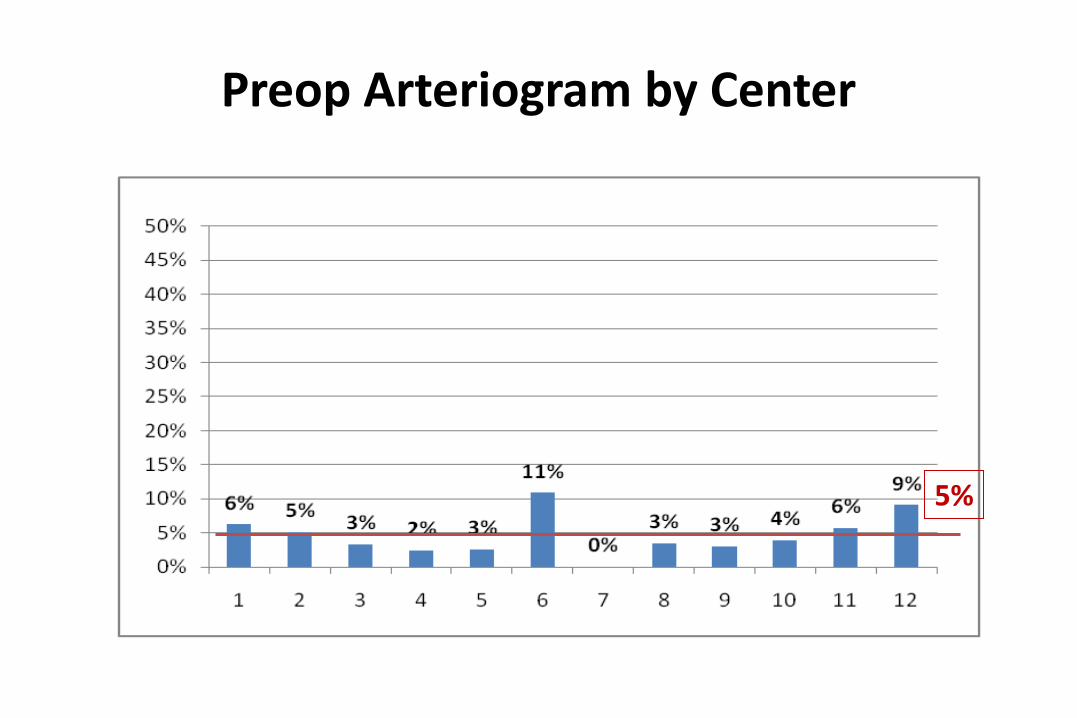
Preop Arteriogram by Center
5%
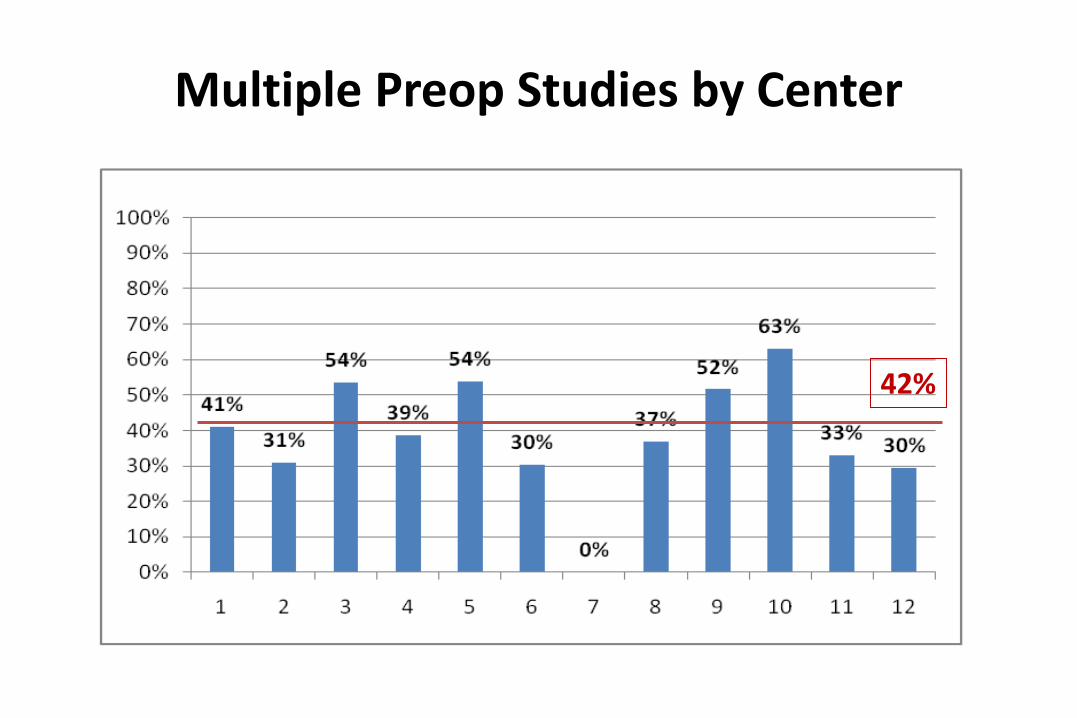
Multiple Preop Studies by Center
42%
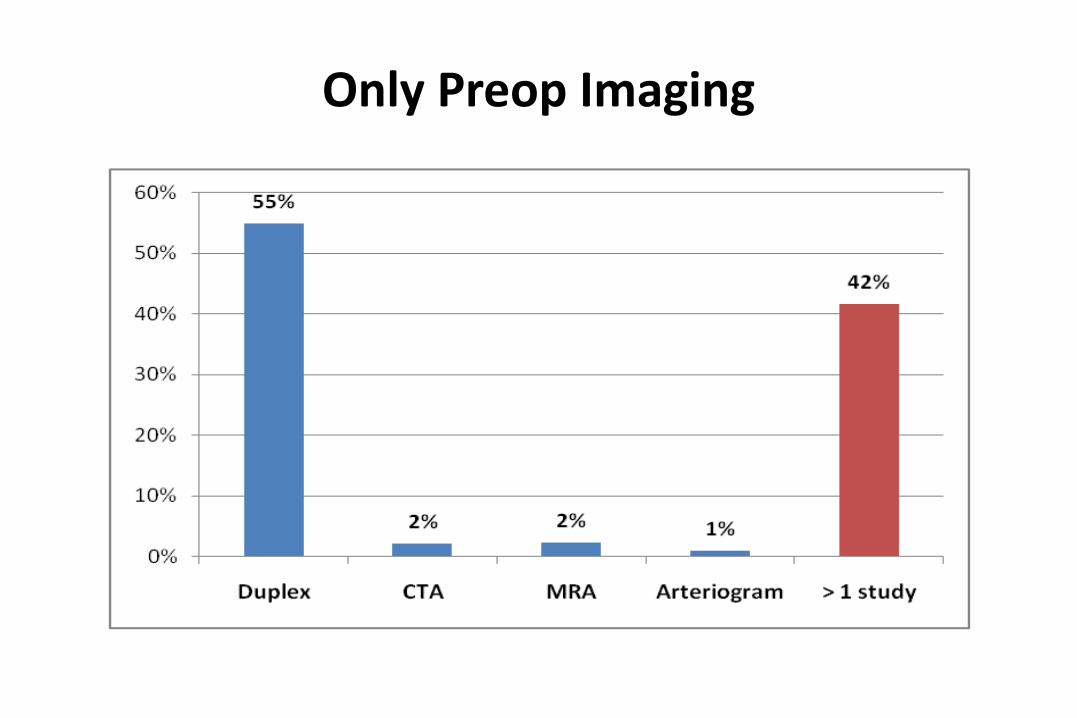
Only Preop Imaging
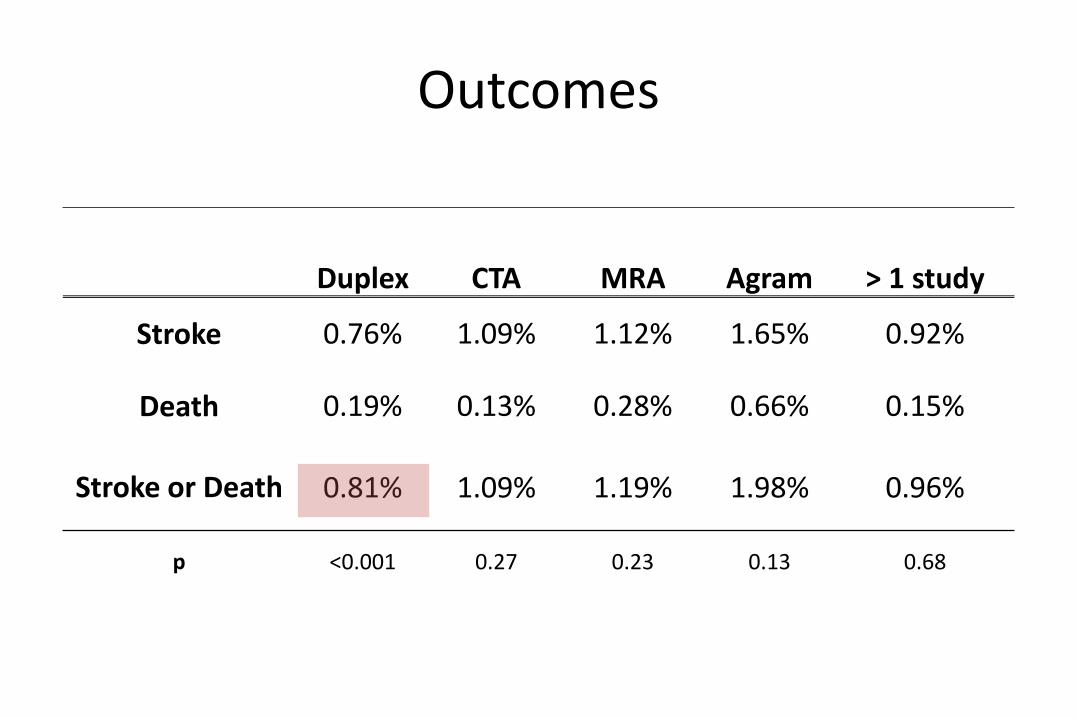
Outcomes
Duplex CTA MRA Agram > 1 study
Stroke 0.76% 1.09% 1.12% 1.65% 0.92%
Death 0.19% 0.13% 0.28% 0.66% 0.15%
Stroke or Death 0.81% 1.09% 1.19% 1.98% 0.96%
p <0.001 0.27 0.23 0.13 0.68
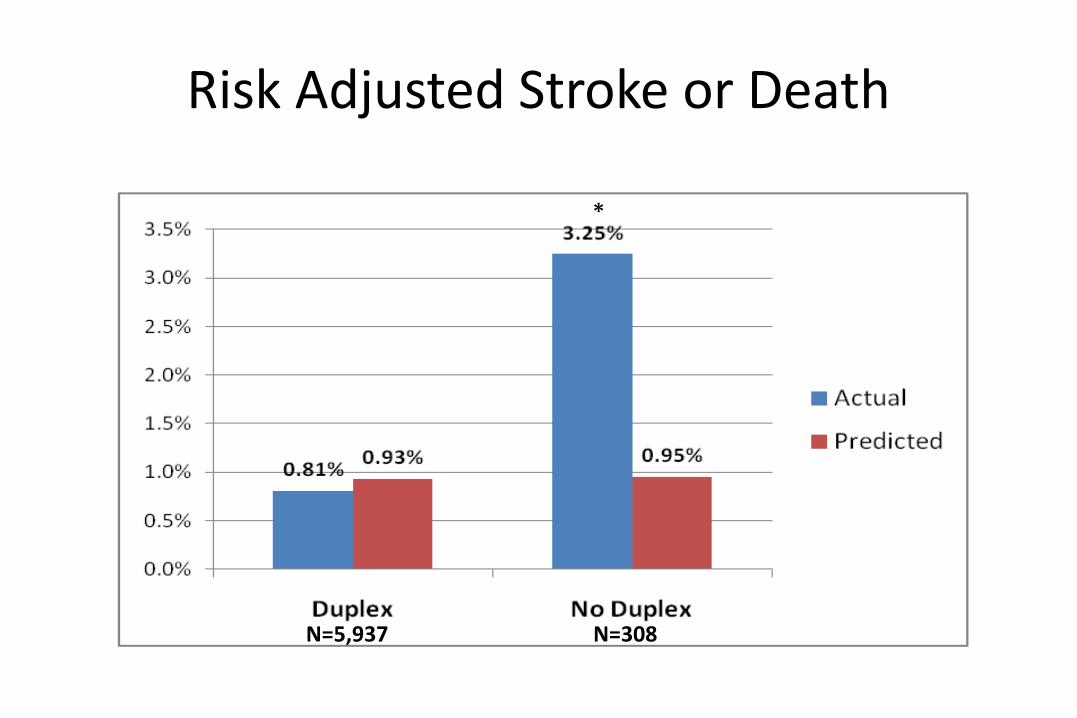
Risk Adjusted Stroke or Death
N=308 N=5,937
*
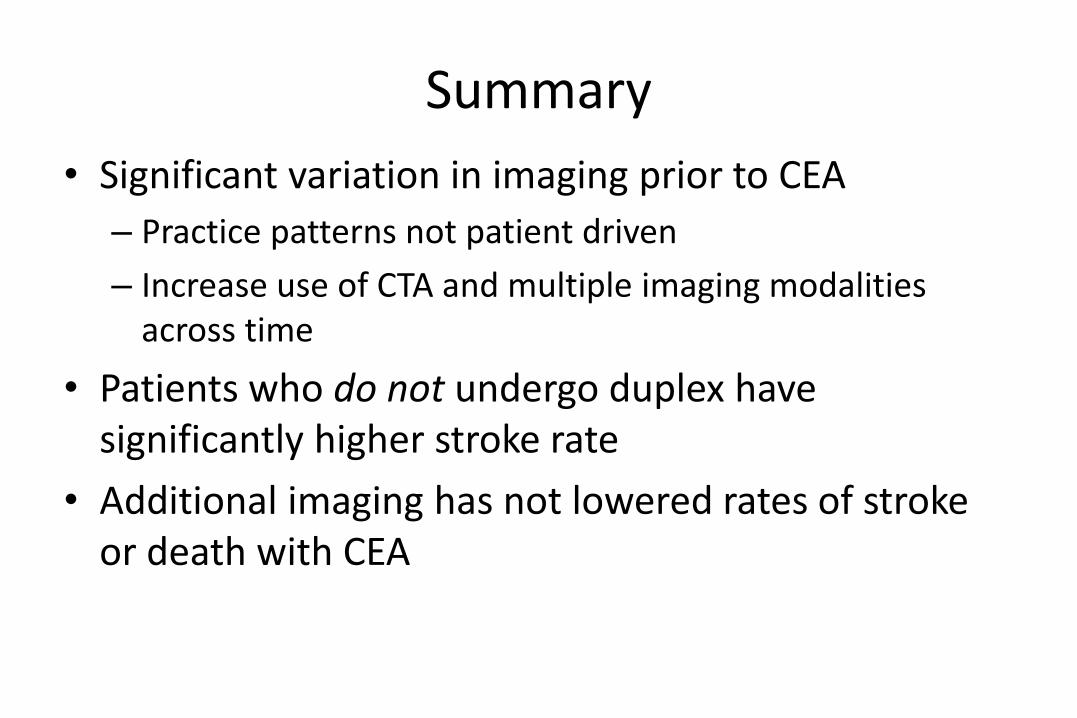
Summary
• Significant variation in imaging prior to CEA
– Practice patterns not patient driven
– Increase use of CTA and multiple imaging modalities across time
• Patients who do not undergo duplex have significantly higher stroke rate
• Additional imaging has not lowered rates of stroke or death with CEA
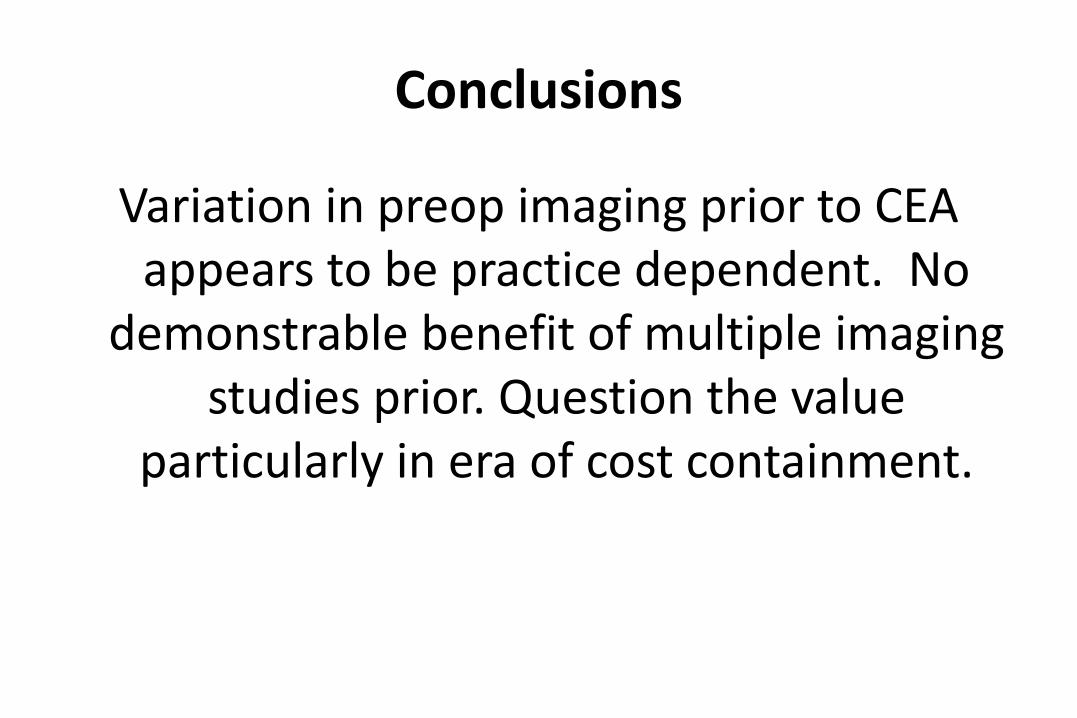
Conclusions
Variation in preop imaging prior to CEA appears to be practice dependent. No
demonstrable benefit of multiple imaging studies prior. Question the value
particularly in era of cost containment.
Derivation and Internal Validation of a
Practical Risk Score for Mortality after
Open Repair of Ruptured Abdominal
Aortic Aneurysms in a U.S. Regional
Cohort and Comparison to Existing
Models
William P. Robinson III MD1, Andres Schanzer MD1, Youfu Li MD1, Brian Nolan MD2,
Philip Goodney MD2, Mohammad Eslami, MD1, Louis M. Messina MD1, Jack L. Cronenwett,
MD2
1Univ. of Massachusetts Medical School
Worcester, MA 2Dartmouth-Hitchcock Medical Center
Lebanon, NH
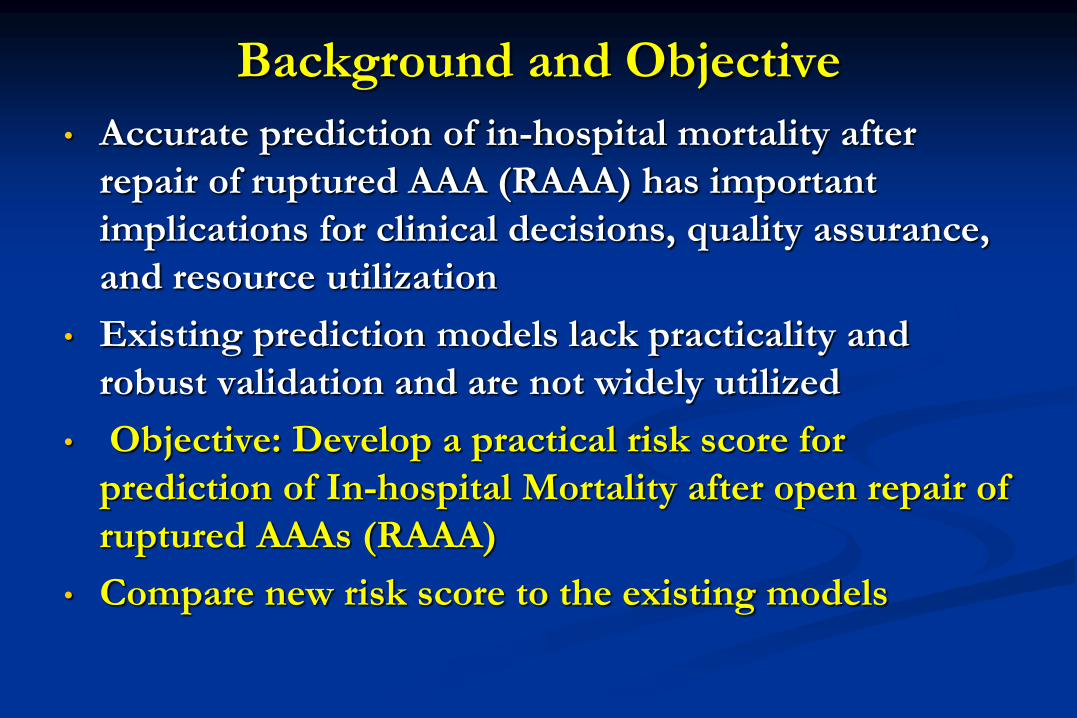
Background and Objective
• Accurate prediction of in-hospital mortality after
repair of ruptured AAA (RAAA) has important
implications for clinical decisions, quality assurance,
and resource utilization
• Existing prediction models lack practicality and
robust validation and are not widely utilized
• Objective: Develop a practical risk score for
prediction of In-hospital Mortality after open repair of
ruptured AAAs (RAAA)
• Compare new risk score to the existing models

Methods Vascular Study Group of New England (VSGNE): Prospectively
collected data from 11 academic and community centers
242 patients underwent open repair of RAAA from 2003-2009 and
were randomly assigned to either a derivation (n=164) or to a
validation set (n=78)
Univariate and multivariate analysis via logistic regression
Significant predictors were assigned integer weights to generate a
integer risk score for mortality after repair RAAA
Discrimination and calibration of VSGNE RAAA Risk Score were
tested in the derivation and validation set via area under ROC curve
(c-statistic) and Hosmer -Lemenshow test
Glasgow Aneurysm Score, Hardman Index, Vancouver Score, and
Edinburg Aneurysm Score tested in VSGNE cohort
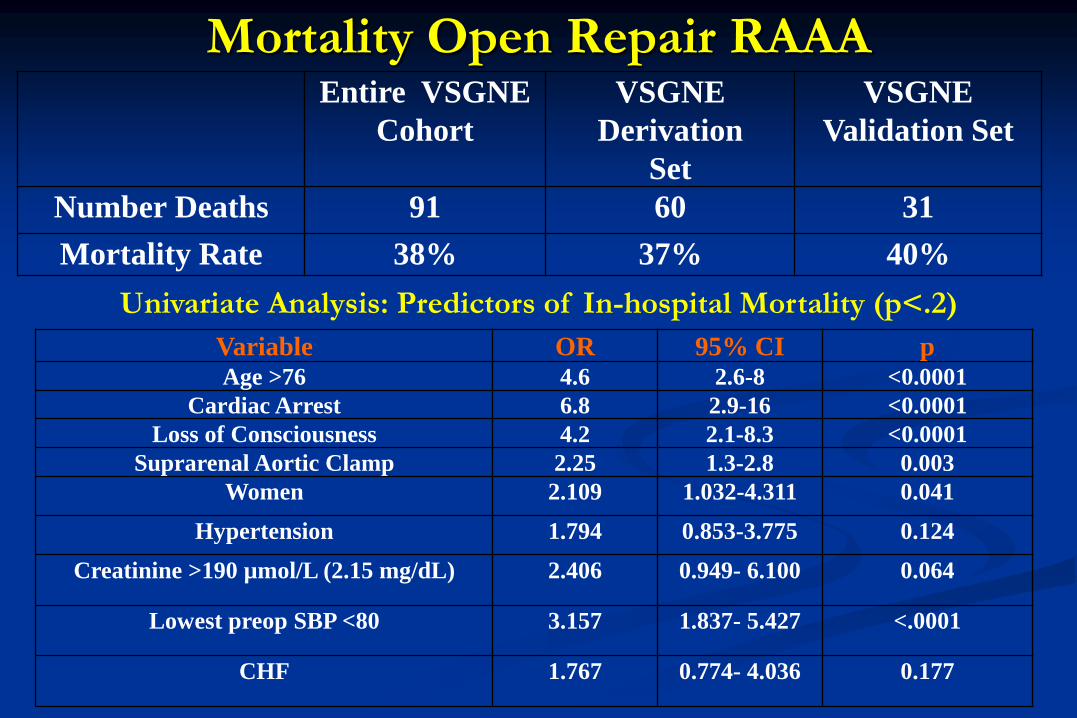
Mortality Open Repair RAAA
Entire VSGNE
Cohort
VSGNE
Derivation
Set
VSGNE
Validation Set
Number Deaths 91 60 31
Mortality Rate 38% 37% 40%
Univariate Analysis: Predictors of In-hospital Mortality (p<.2)
Variable OR 95% CI p Age >76 4.6 2.6-8 <0.0001
Cardiac Arrest 6.8 2.9-16 <0.0001
Loss of Consciousness 4.2 2.1-8.3 <0.0001
Suprarenal Aortic Clamp 2.25 1.3-2.8 0.003
Women 2.109 1.032-4.311 0.041
Hypertension 1.794 0.853-3.775 0.124
Creatinine >190 µmol/L (2.15 mg/dL) 2.406 0.949- 6.100 0.064
Lowest preop SBP <80 3.157 1.837- 5.427 <.0001
CHF 1.767 0.774- 4.036 0.177
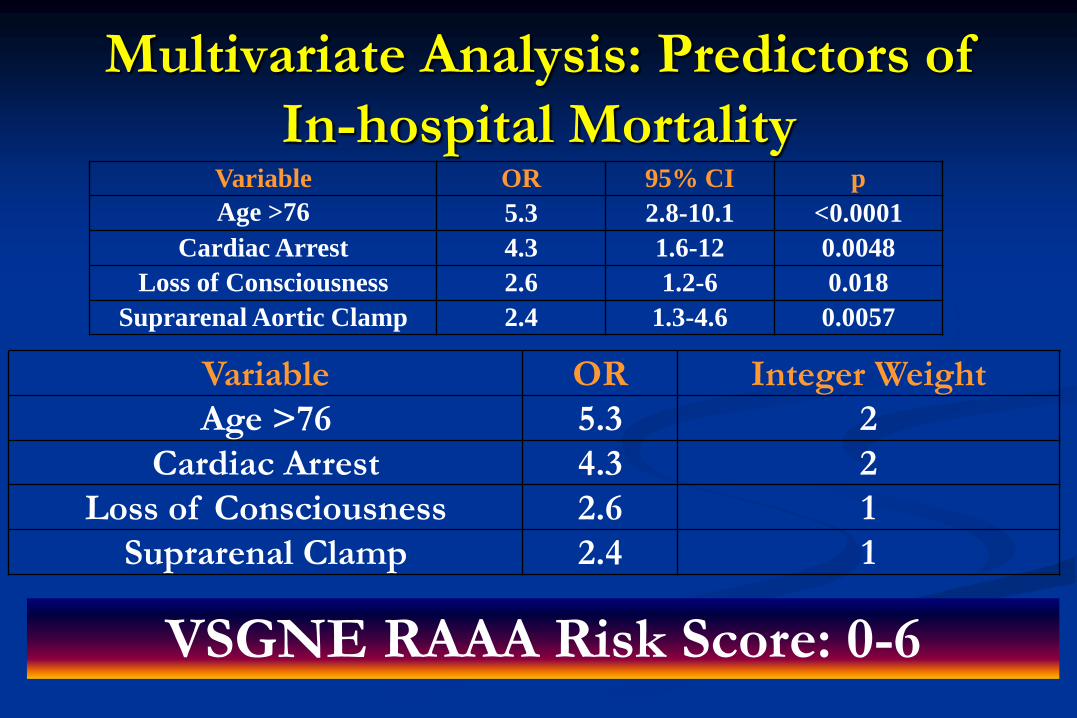
Multivariate Analysis: Predictors of
In-hospital Mortality
Variable OR 95% CI p
Age >76 5.3 2.8-10.1 <0.0001
Cardiac Arrest 4.3 1.6-12 0.0048
Loss of Consciousness 2.6 1.2-6 0.018
Suprarenal Aortic Clamp 2.4 1.3-4.6 0.0057
Variable OR Integer Weight
Age >76 5.3 2
Cardiac Arrest 4.3 2
Loss of Consciousness 2.6 1
Suprarenal Clamp 2.4 1
VSGNE RAAA Risk Score: 0-6
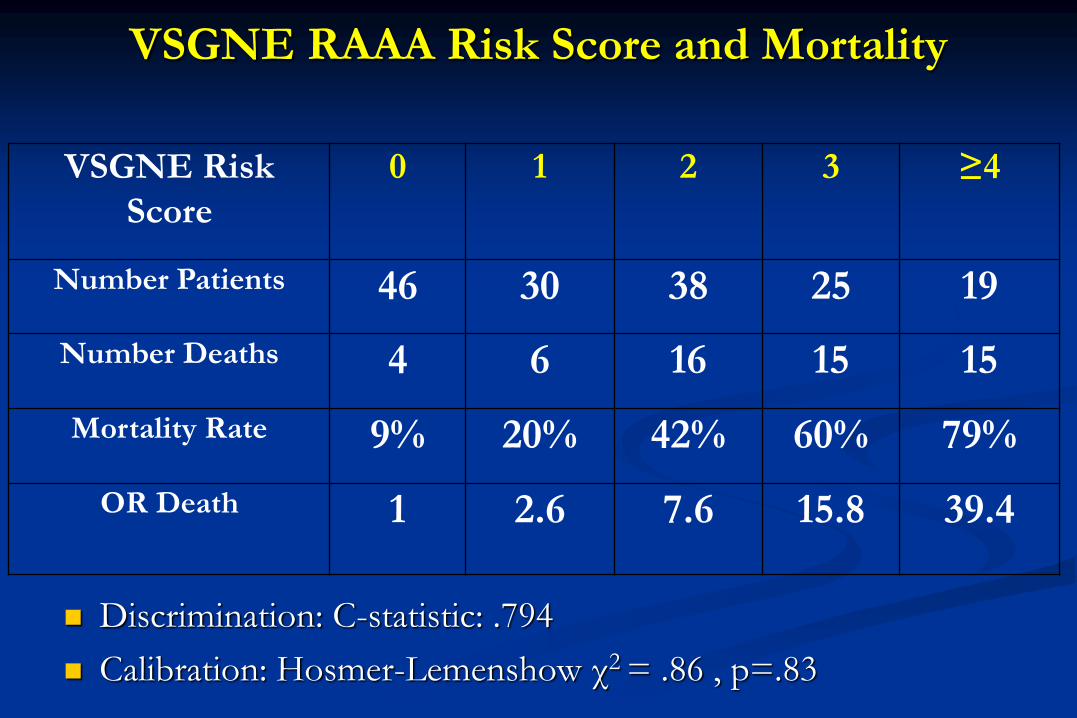
VSGNE RAAA Risk Score and Mortality
Discrimination: C-statistic: .794
Calibration: Hosmer-Lemenshow χ2 = .86 , p=.83
VSGNE Risk
Score
0 1 2 3 ≥4
Number Patients 46 30 38 25 19
Number Deaths 4 6 16 15 15
Mortality Rate 9% 20% 42% 60% 79%
OR Death 1 2.6 7.6 15.8 39.4
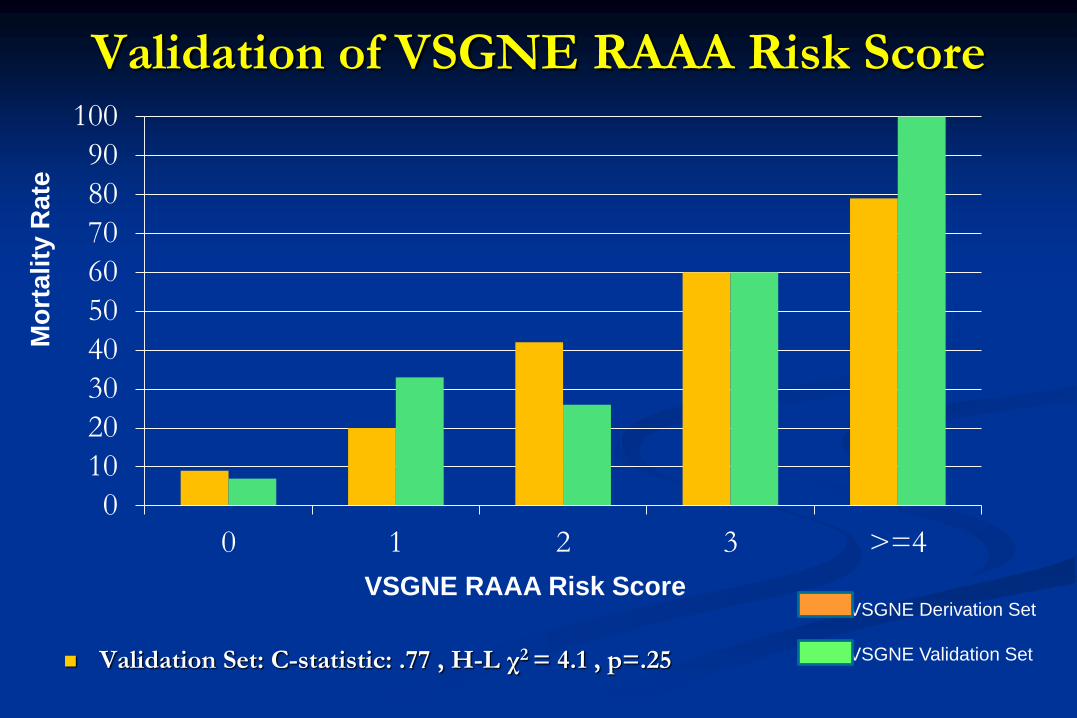
Validation of VSGNE RAAA Risk Score
Validation Set: C-statistic: .77 , H-L χ2 = 4.1 , p=.25
0
10
20
30
40
50
60
70
80
90
100
0 1 2 3 >=4
VSGNE Derivation Set
VSGNE Validation Set
VSGNE RAAA Risk Score
Mo
rtality
Rate
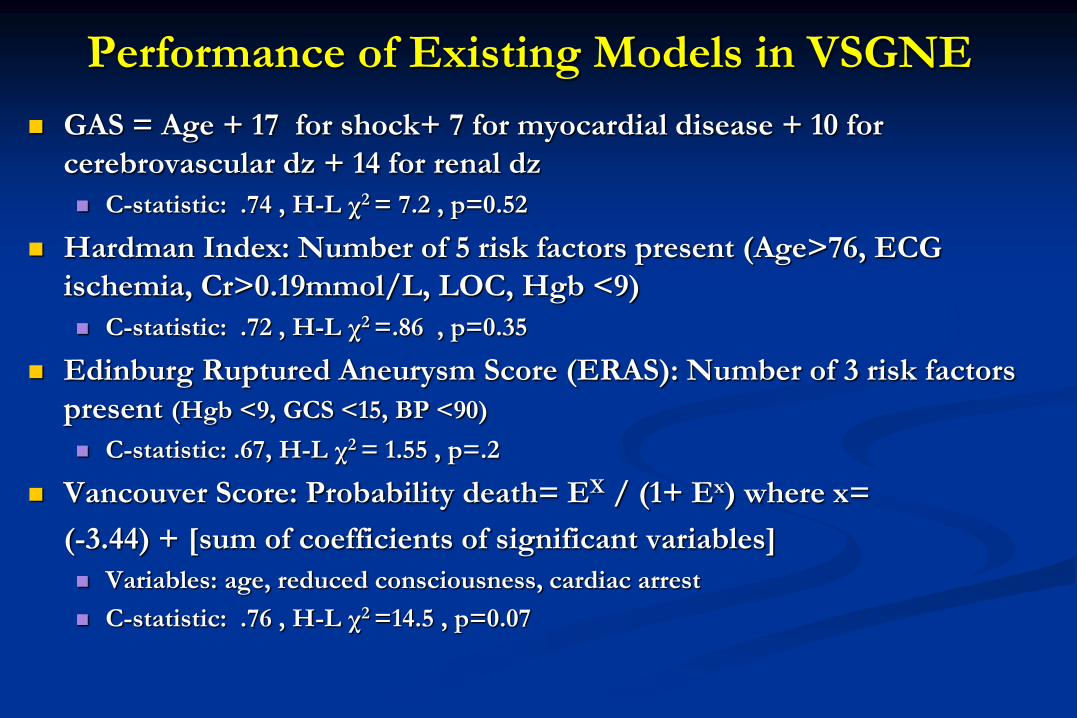
Performance of Existing Models in VSGNE
GAS = Age + 17 for shock+ 7 for myocardial disease + 10 for
cerebrovascular dz + 14 for renal dz
C-statistic: .74 , H-L χ2 = 7.2 , p=0.52
Hardman Index: Number of 5 risk factors present (Age>76, ECG
ischemia, Cr>0.19mmol/L, LOC, Hgb <9)
C-statistic: .72 , H-L χ2 =.86 , p=0.35
Edinburg Ruptured Aneurysm Score (ERAS): Number of 3 risk factors
present (Hgb <9, GCS <15, BP <90)
C-statistic: .67, H-L χ2 = 1.55 , p=.2
Vancouver Score: Probability death= EX / (1+ Ex) where x=
(-3.44) + [sum of coefficients of significant variables]
Variables: age, reduced consciousness, cardiac arrest
C-statistic: .76 , H-L χ2 =14.5 , p=0.07
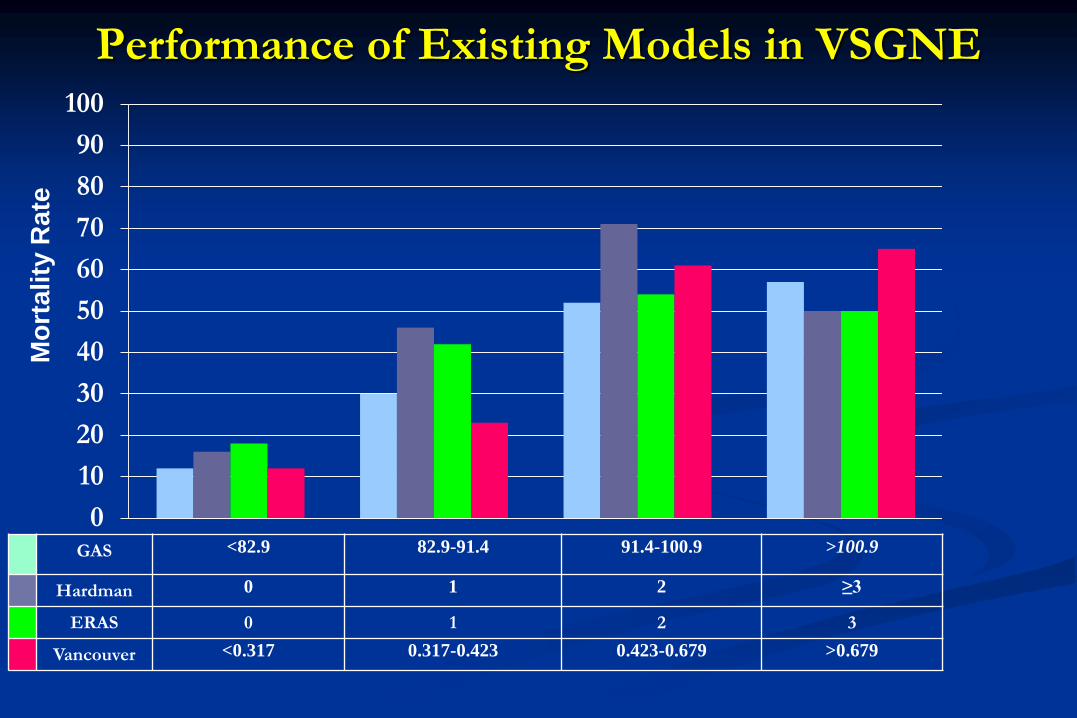
Performance of Existing Models in VSGNE
0
10
20
30
40
50
60
70
80
90
100
GAS <82.9 82.9-91.4 91.4-100.9 >100.9
Hardman 0 1 2 ≥3
ERAS 0 1 2 3
Vancouver <0.317 0.317-0.423 0.423-0.679 >0.679
Mo
rtality
Rate
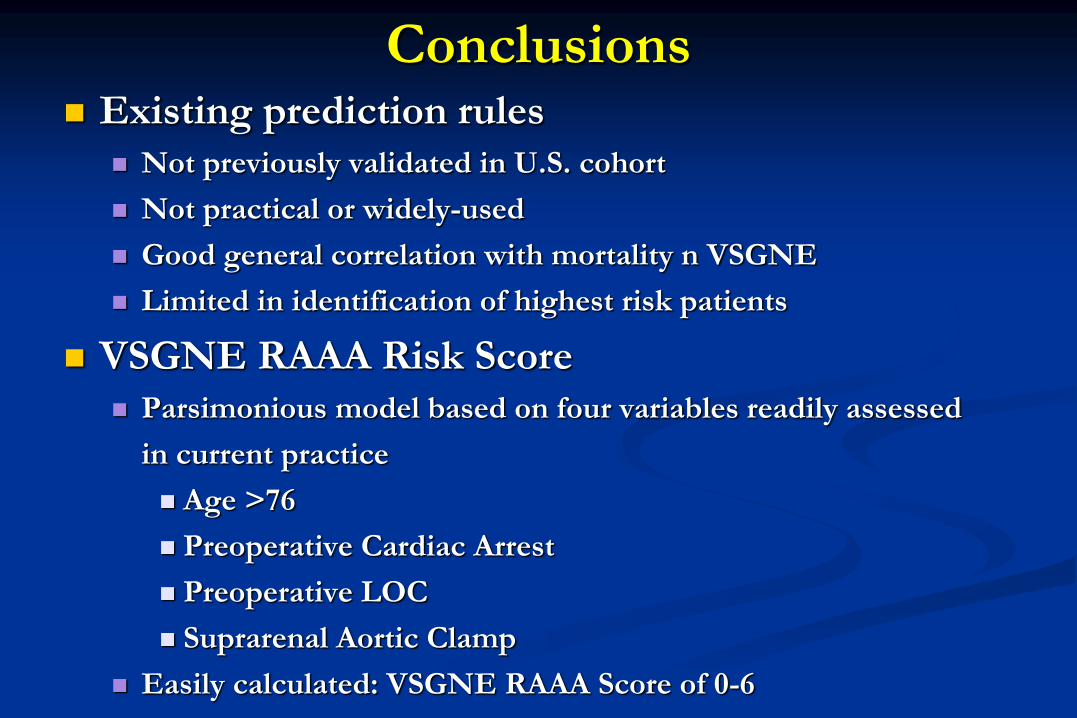
Conclusions Existing prediction rules
Not previously validated in U.S. cohort
Not practical or widely-used
Good general correlation with mortality n VSGNE
Limited in identification of highest risk patients
VSGNE RAAA Risk Score
Parsimonious model based on four variables readily assessed
in current practice
Age >76
Preoperative Cardiac Arrest
Preoperative LOC
Suprarenal Aortic Clamp
Easily calculated: VSGNE RAAA Score of 0-6
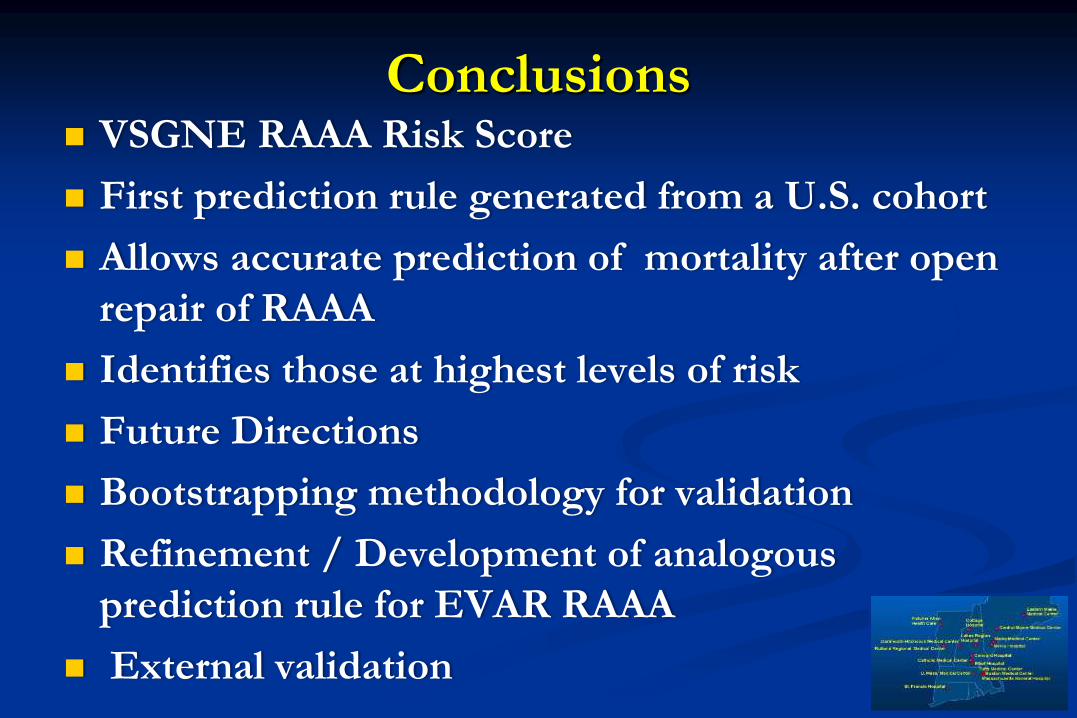
Conclusions VSGNE RAAA Risk Score
First prediction rule generated from a U.S. cohort
Allows accurate prediction of mortality after open
repair of RAAA
Identifies those at highest levels of risk
Future Directions
Bootstrapping methodology for validation
Refinement / Development of analogous
prediction rule for EVAR RAAA
External validation
Thank you

Predictors of Wound Infection after
Lower Extremity Bypass
On behalf of the Vascular Study Group of New England
Jeffrey Kalish, Alik Farber,
Naomi Hamburg, Rob Eberhardt, Denis Rybin,
Gheorge Doros, Jack Cronenwett, Andres Schanzer
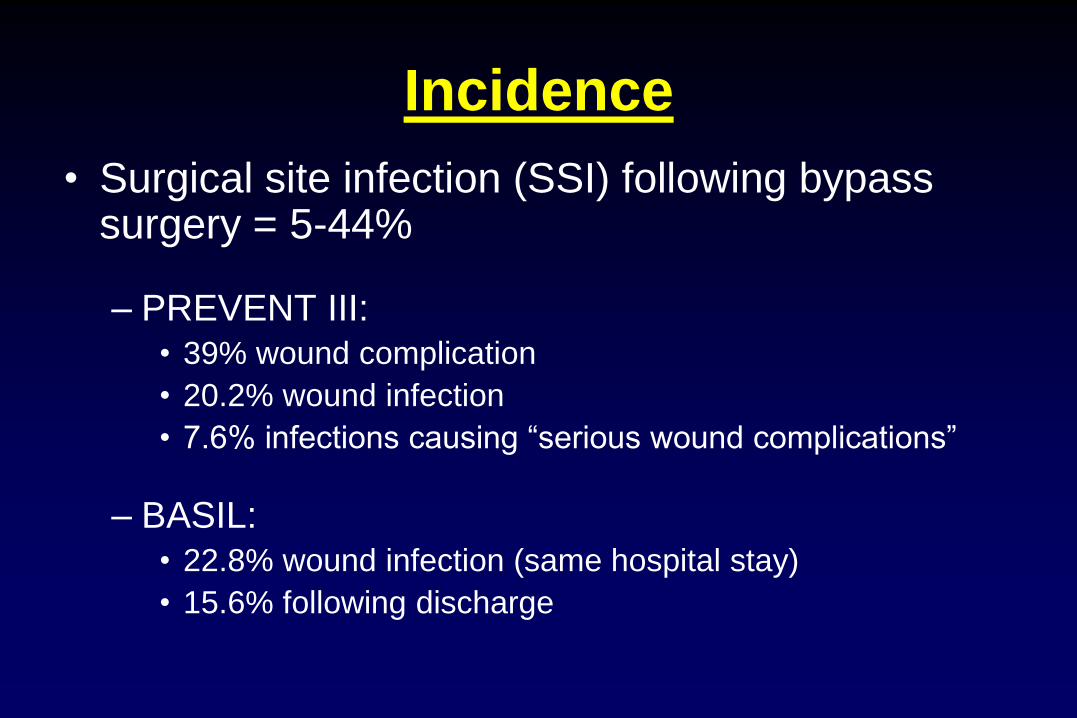
Incidence
• Surgical site infection (SSI) following bypass surgery = 5-44%
– PREVENT III: • 39% wound complication
• 20.2% wound infection
• 7.6% infections causing “serious wound complications”
– BASIL: • 22.8% wound infection (same hospital stay)
• 15.6% following discharge
Impact of Infections
• Morbidity to patient
• ↑ hospital LOS
• ↑ utilization of post-discharge services
• ↓ quality of life
• May lead to graft infection
• May lead to higher amputation rate and mortality

Risk Factors
• Female gender
• Oral anticoagulants
• Advanced age
• Obesity
• Dialysis-dependence
• Diabetes
Study Goals
1. Identify risk factors (pre-operative and intra-
operative) for wound infection
2. Determine if wound infection influences post-
operative outcomes
Definition
• Wound Infection = “culture positive or requiring
antibiotic treatment”
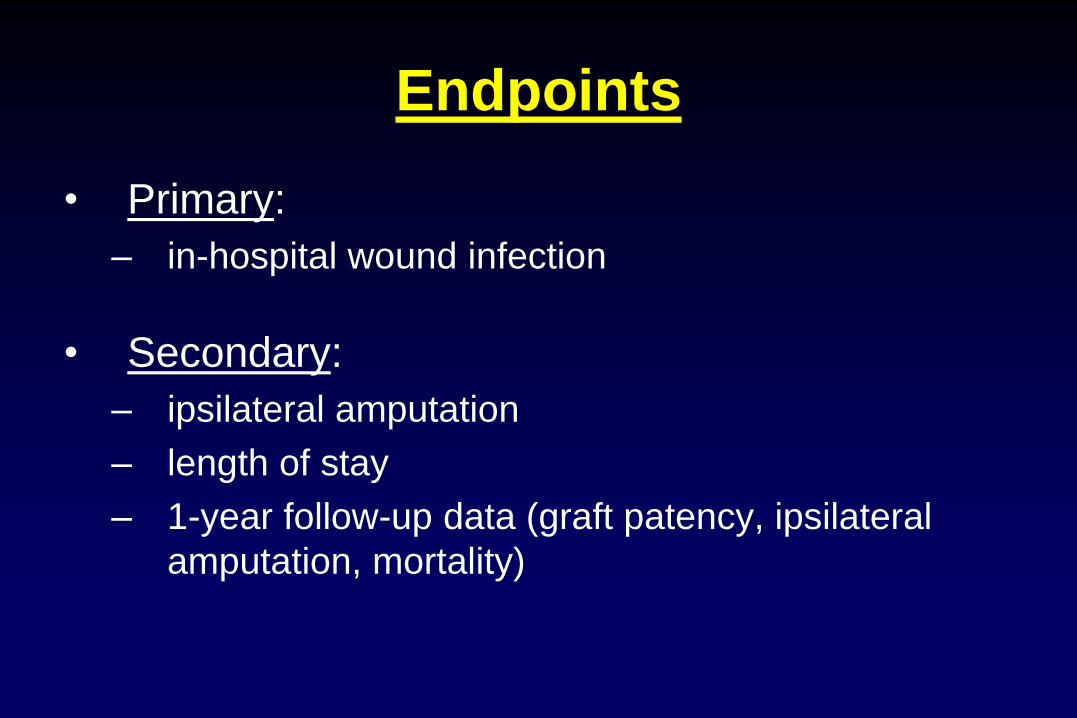
Endpoints
• Primary:
– in-hospital wound infection
• Secondary:
– ipsilateral amputation
– length of stay
– 1-year follow-up data (graft patency, ipsilateral
amputation, mortality)
Statistical Analysis
• Two-sample t-test
• Fischer’s Exact test
• Multivariate logistic regression
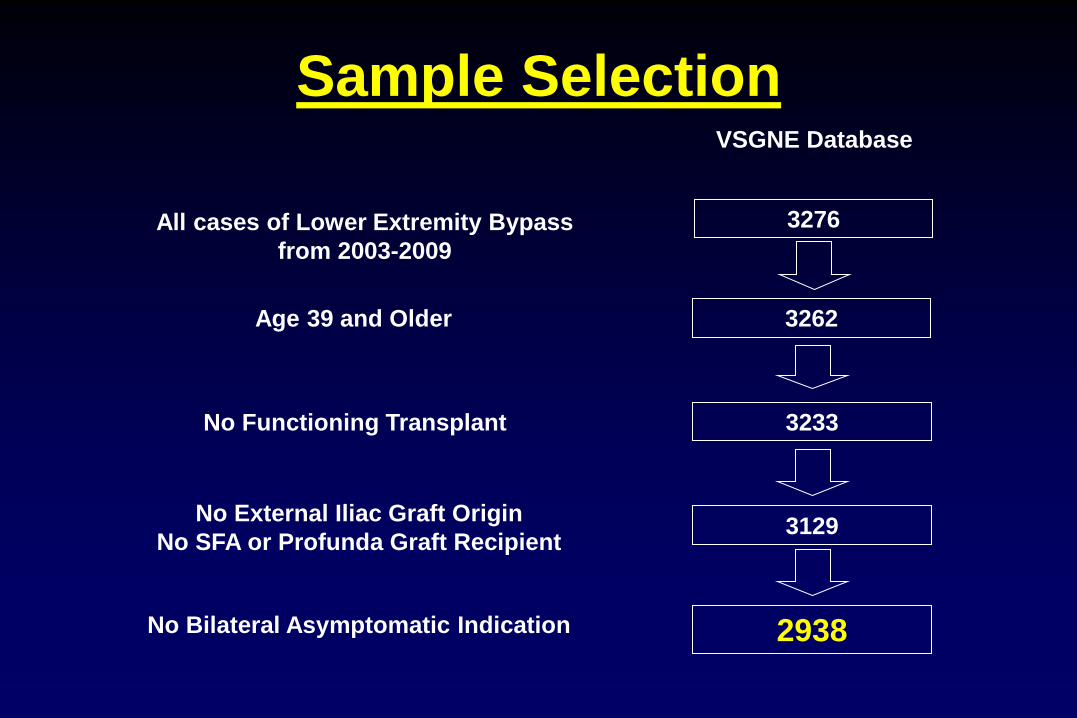
Sample Selection
All cases of Lower Extremity Bypass
from 2003-2009
No Bilateral Asymptomatic Indication
Age 39 and Older
No Functioning Transplant
3276
3129
3262
3233
VSGNE Database
2938
No External Iliac Graft Origin
No SFA or Profunda Graft Recipient
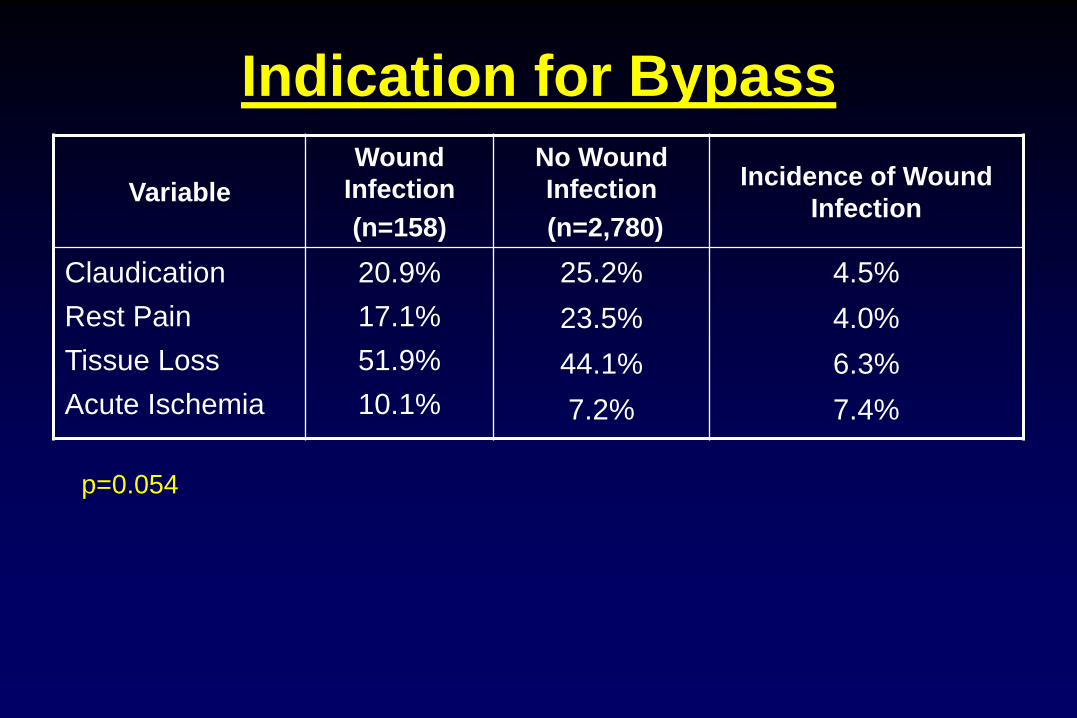
Indication for Bypass
Variable
Wound
Infection
(n=158)
No Wound
Infection
(n=2,780)
Incidence of Wound
Infection
Claudication
Rest Pain
Tissue Loss
Acute Ischemia
20.9%
17.1%
51.9%
10.1%
25.2%
23.5%
44.1%
7.2%
4.5%
4.0%
6.3%
7.4%
p=0.054
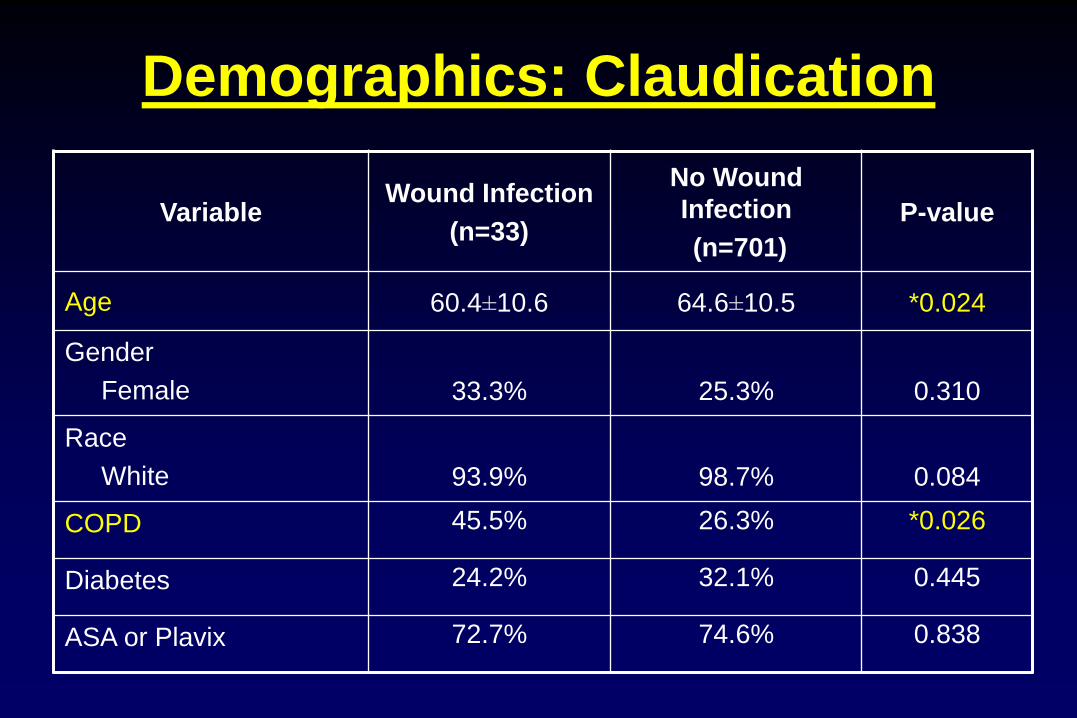
Variable Wound Infection
(n=33)
No Wound
Infection
(n=701)
P-value
Age 60.4±10.6 64.6±10.5 *0.024
Gender
Female
33.3%
25.3%
0.310
Race
White
93.9%
98.7%
0.084
COPD 45.5% 26.3% *0.026
Diabetes 24.2% 32.1% 0.445
ASA or Plavix 72.7% 74.6% 0.838
Demographics: Claudication
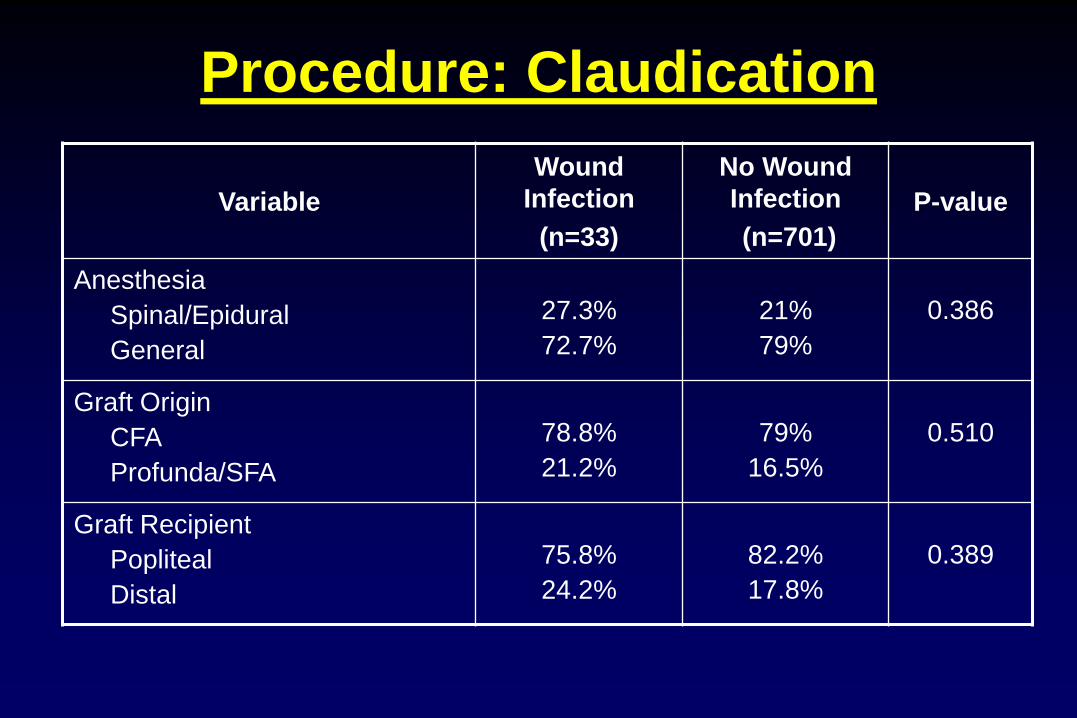
Procedure: Claudication
Variable
Wound
Infection
(n=33)
No Wound
Infection
(n=701)
P-value
Anesthesia
Spinal/Epidural
General
27.3%
72.7%
21%
79%
0.386
Graft Origin
CFA
Profunda/SFA
78.8%
21.2%
79%
16.5%
0.510
Graft Recipient
Popliteal
Distal
75.8%
24.2%
82.2%
17.8%
0.389
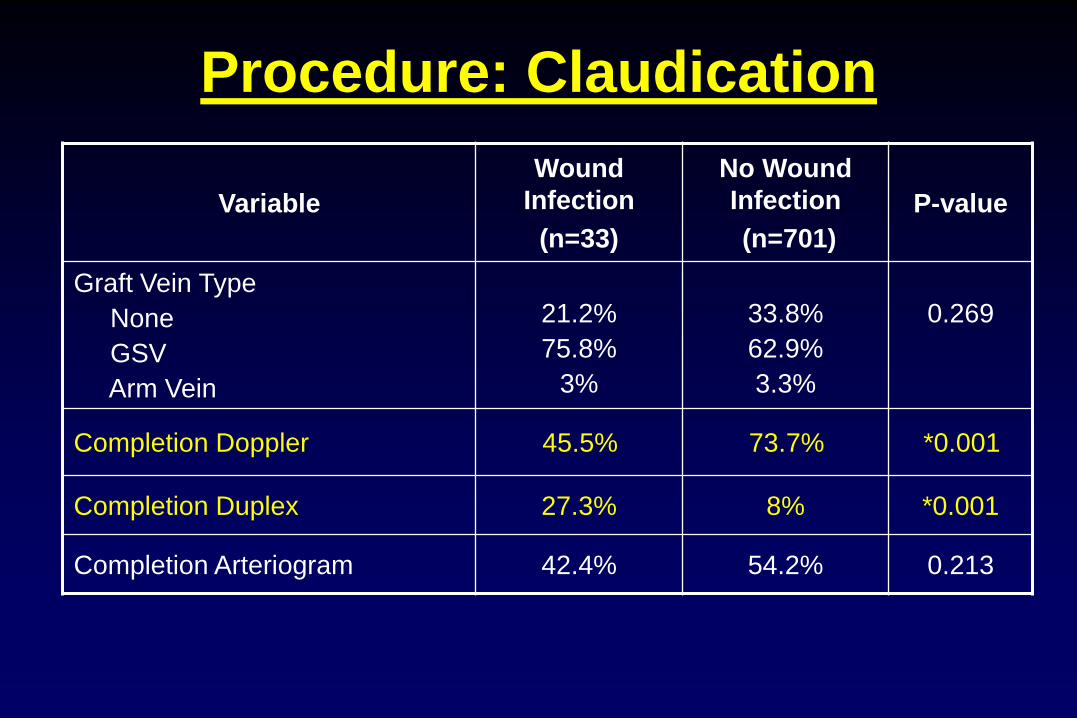
Procedure: Claudication
Variable
Wound
Infection
(n=33)
No Wound
Infection
(n=701)
P-value
Graft Vein Type
None
GSV
Arm Vein
21.2%
75.8%
3%
33.8%
62.9%
3.3%
0.269
Completion Doppler 45.5% 73.7% *0.001
Completion Duplex 27.3% 8% *0.001
Completion Arteriogram 42.4% 54.2% 0.213
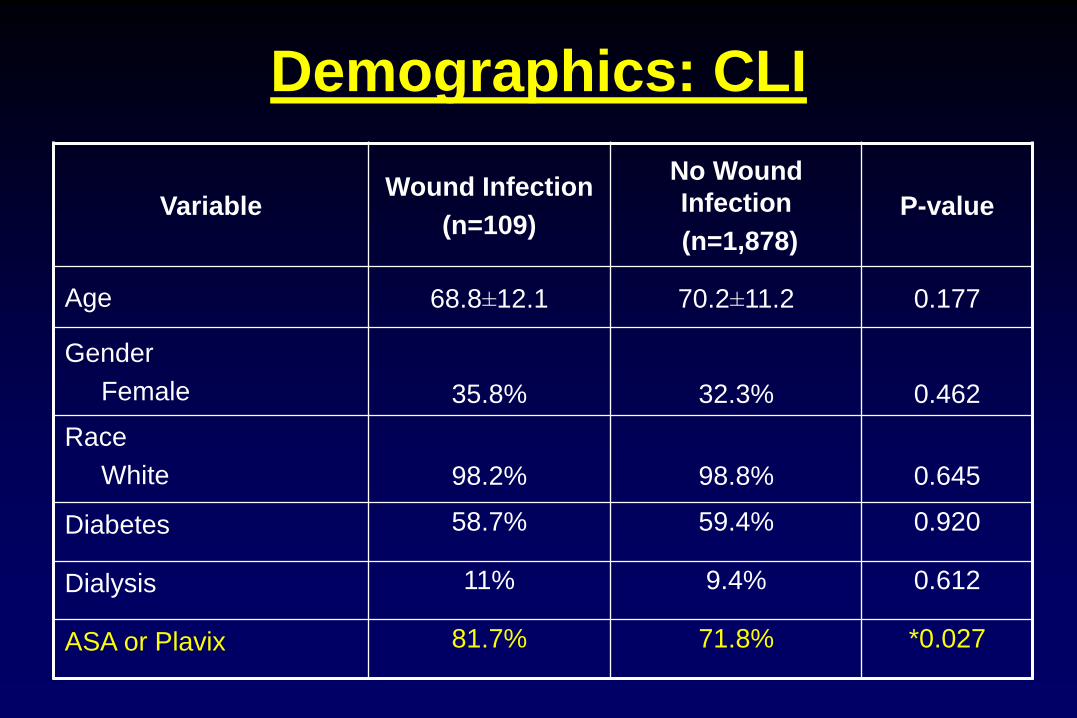
Variable Wound Infection
(n=109)
No Wound
Infection
(n=1,878)
P-value
Age 68.8±12.1 70.2±11.2 0.177
Gender
Female
35.8%
32.3%
0.462
Race
White
98.2%
98.8%
0.645
Diabetes 58.7% 59.4% 0.920
Dialysis 11% 9.4% 0.612
ASA or Plavix 81.7% 71.8% *0.027
Demographics: CLI
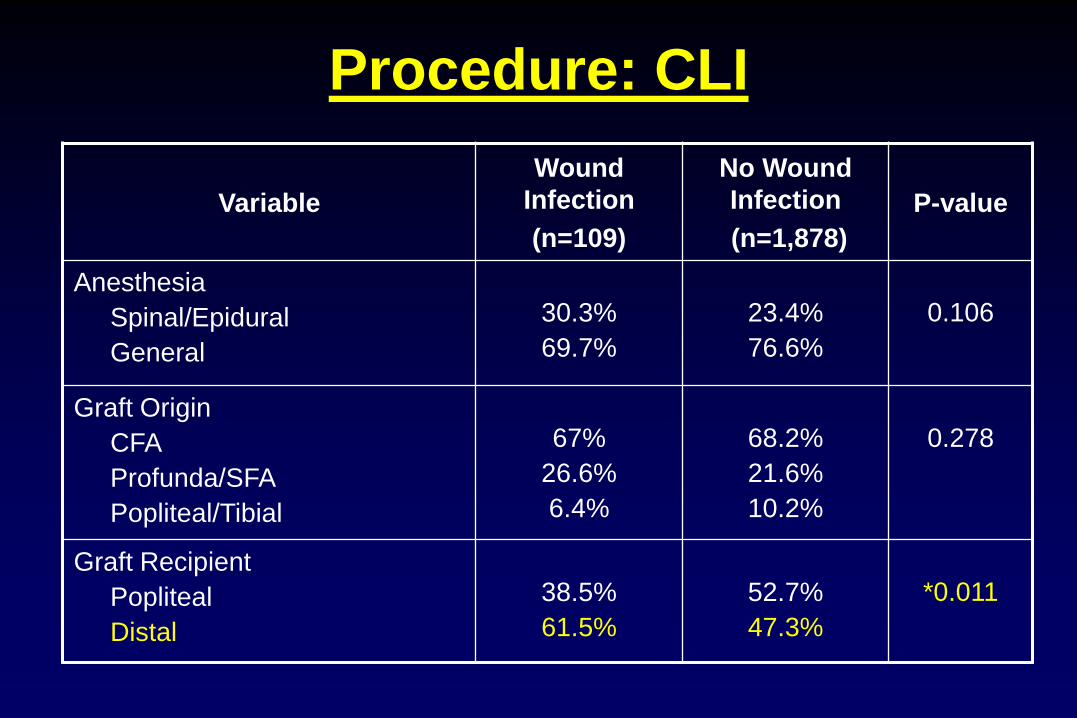
Procedure: CLI
Variable
Wound
Infection
(n=109)
No Wound
Infection
(n=1,878)
P-value
Anesthesia
Spinal/Epidural
General
30.3%
69.7%
23.4%
76.6%
0.106
Graft Origin
CFA
Profunda/SFA
Popliteal/Tibial
67%
26.6%
6.4%
68.2%
21.6%
10.2%
0.278
Graft Recipient
Popliteal
Distal
38.5%
61.5%
52.7%
47.3%
*0.011
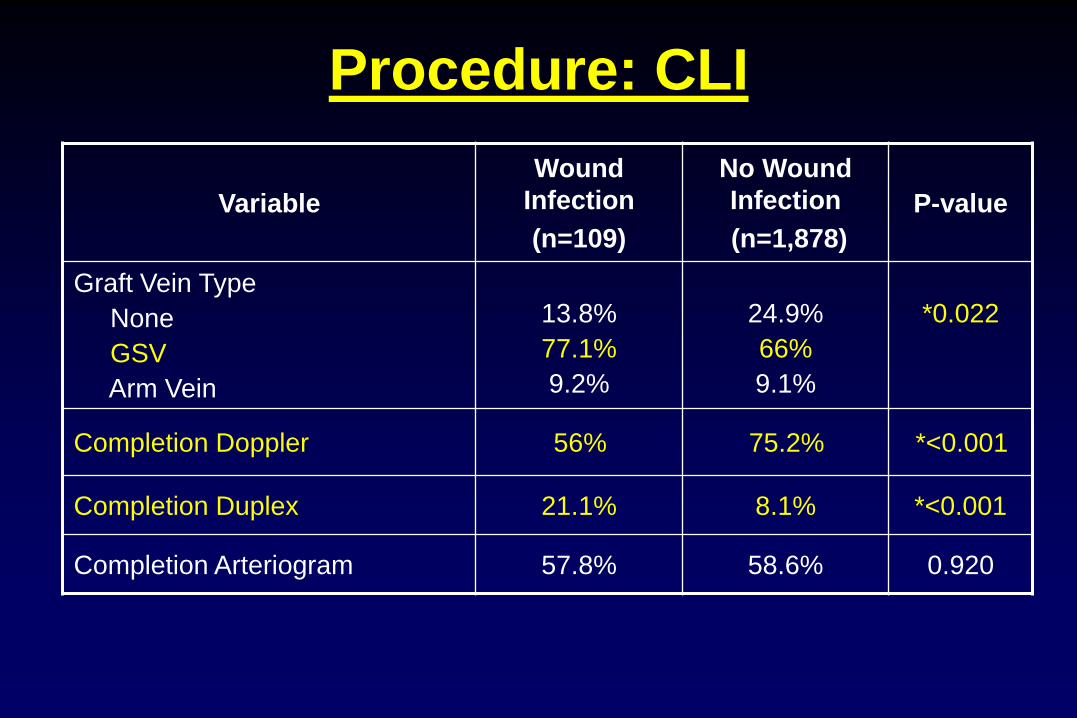
Procedure: CLI
Variable
Wound
Infection
(n=109)
No Wound
Infection
(n=1,878)
P-value
Graft Vein Type
None
GSV
Arm Vein
13.8%
77.1%
9.2%
24.9%
66%
9.1%
*0.022
Completion Doppler 56% 75.2% *<0.001
Completion Duplex 21.1% 8.1% *<0.001
Completion Arteriogram 57.8% 58.6% 0.920
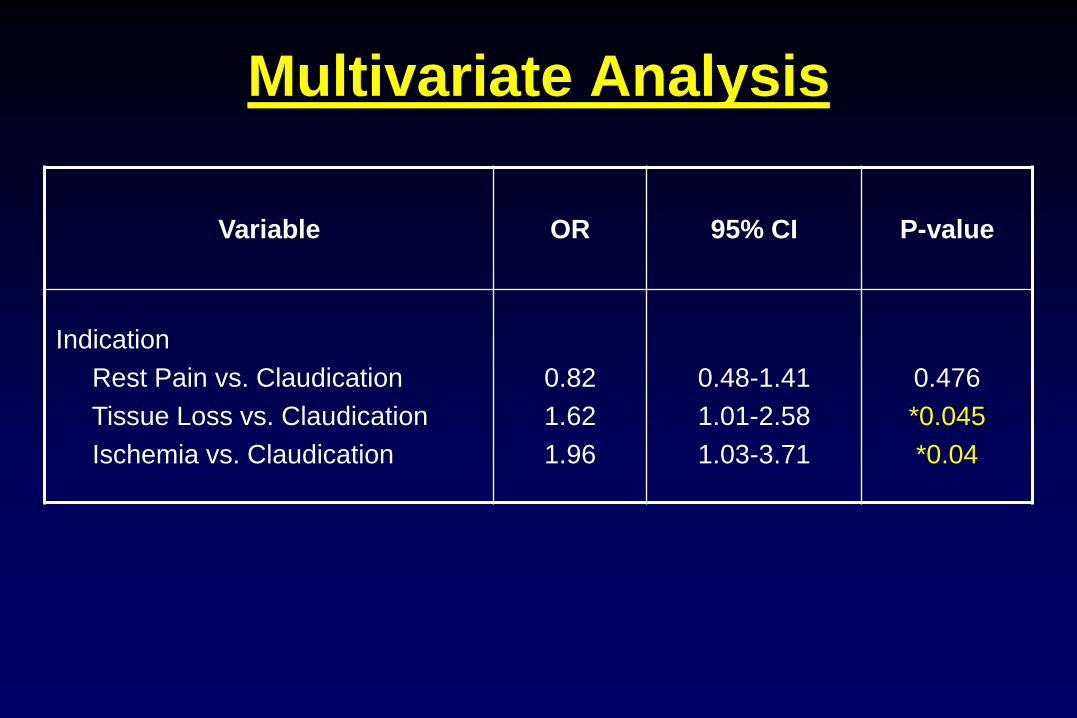
Multivariate Analysis
Variable OR 95% CI P-value
Indication
Rest Pain vs. Claudication
Tissue Loss vs. Claudication
Ischemia vs. Claudication
0.82
1.62
1.96
0.48-1.41
1.01-2.58
1.03-3.71
0.476
*0.045
*0.04

Multivariate: Claudication
Variable OR 95% CI P-value
Age <55 vs. ≥55 2.60 1.22-5.55 *0.013
Duplex 2.53 1.02-6.27 *0.046
COPD 2.24 1.09-4.62 *0.029
Doppler 0.40 0.18-0.88 *0.023
C-statistic of the final model 0.71 (full model 0.77)

Multivariate: CLI
Variable OR 95% CI P-value
Duplex 2.15 1.26-3.64 *0.005
Age <55 vs. ≥55 1.75 1.00-3.05 *0.049
Graft Recipient:
Distal vs. Popliteal 1.64 1.09-2.45 *0.017
ASA or Plavix 1.58 0.95-2.61 0.075
Anesthesia:
Spinal/Epidural vs. Gen’l 1.50 0.97-2.32 0.066
Doppler 0.51 0.34-0.77 *0.001
C-statistic of the final model 0.67 (full model 0.68)
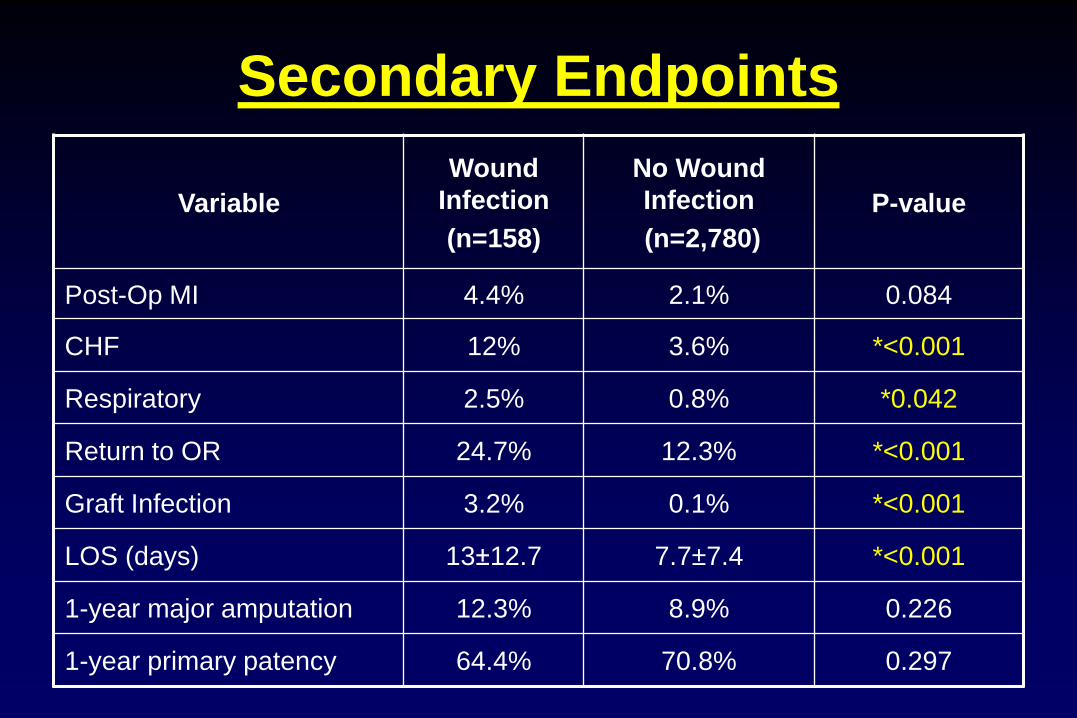
Secondary Endpoints
Variable
Wound
Infection
(n=158)
No Wound
Infection
(n=2,780)
P-value
Post-Op MI 4.4% 2.1% 0.084
CHF 12% 3.6% *<0.001
Respiratory 2.5% 0.8% *0.042
Return to OR 24.7% 12.3% *<0.001
Graft Infection 3.2% 0.1% *<0.001
LOS (days) 13±12.7 7.7±7.4 *<0.001
1-year major amputation 12.3% 8.9% 0.226
1-year primary patency 64.4% 70.8% 0.297
Completion Duplex / Doppler
• 74% of completion duplex studies done in 1 center
(remainder spread over 11 centers)
– This center is high-volume, and has high wound infection rate
• more complicated cases?
• center-specific?
• sterility issue?
• Doppler story?

Summary
1. Higher risk of wound infection with CLI vs.
claudication
2. Risks for Claudicants = COPD, younger age
3. Risks for CLI = distal target, younger age
4. Uncertain duplex / doppler relationship

Summary
• Wound infection
– ↑ LOS
– may have association with graft infection and other
post-op morbidities
– may have effect on 1-year amputation and 1-year
graft patency
Limitations
• No details about wound infections
• Self-reporting and chart review
• Limited to in-hospital infections (not
readmissions after discharge)
• Heavily influenced by centers with higher rates
of infection
Charlton Memorial Hospital Charlton Memorial Hospital
A potential quality improvement initiative
Andrew Hoel, MD
10.28.2010
Smoking cessation in post-operative
vascular surgery patients

• Smoking is a significant modifiable risk factor for vascular disease:
• 2x risk of claudication sx
• 3x risk of abdominal aortic aneurysm
• Continued smoking is associated with significant morbidity following
vascular procedures:
• 3x increased risk of graft failure with continued smoking
• 10x increased risk major amputation with continued smoking
Smoking as a risk factor
Kannel WB. Geriatrics 28:61-68. 1973
Willigendael EM. JVS 42:67-74. 2005..
Lederle FA. Arch int med. 160:1425-1430. 2000
Lassila R. Acta Chir Scand. 154:635-640. 1988
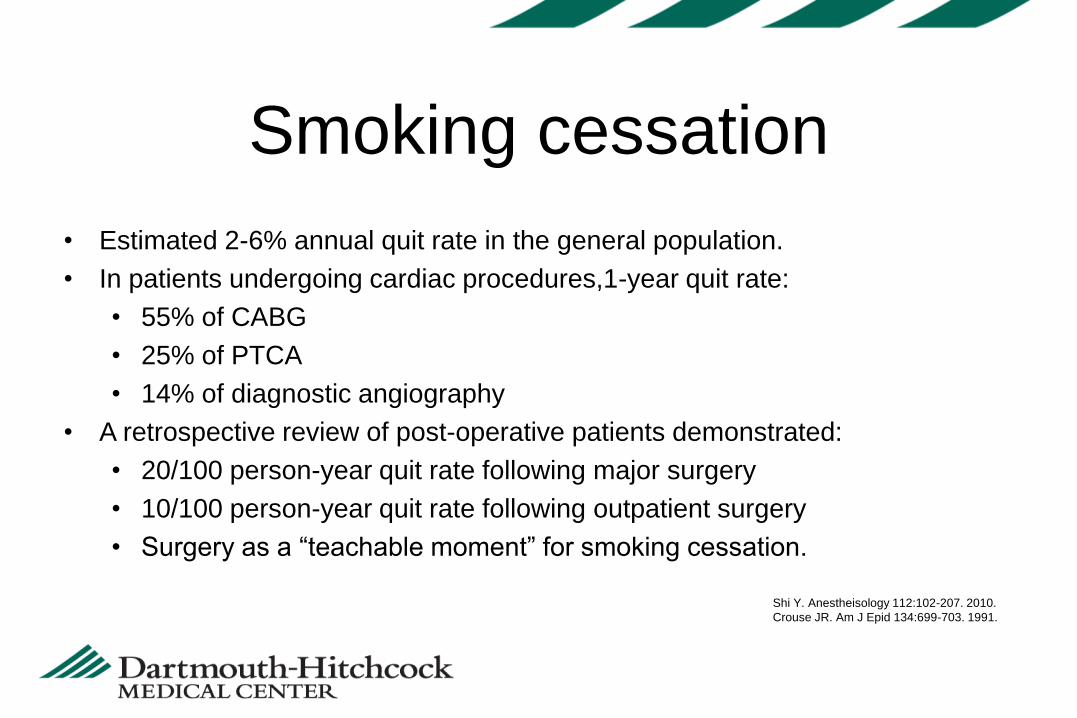
• Estimated 2-6% annual quit rate in the general population.
• In patients undergoing cardiac procedures,1-year quit rate:
• 55% of CABG
• 25% of PTCA
• 14% of diagnostic angiography
• A retrospective review of post-operative patients demonstrated:
• 20/100 person-year quit rate following major surgery
• 10/100 person-year quit rate following outpatient surgery
• Surgery as a “teachable moment” for smoking cessation.
Smoking cessation
Shi Y. Anestheisology 112:102-207. 2010.
Crouse JR. Am J Epid 134:699-703. 1991.
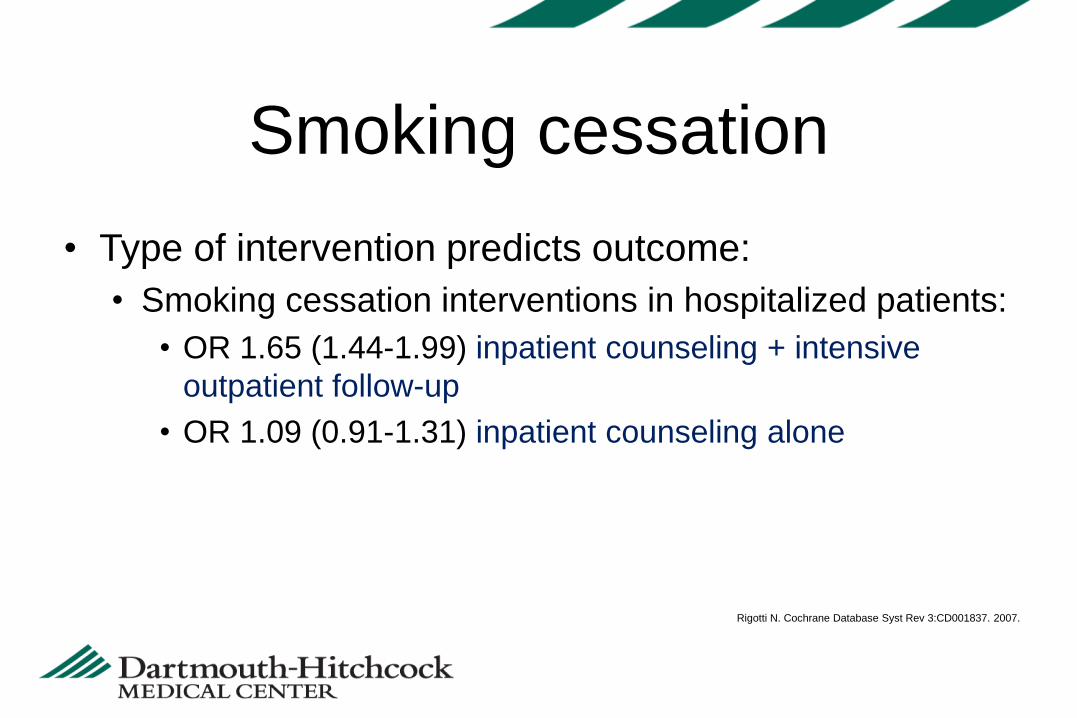
• Type of intervention predicts outcome:
• Smoking cessation interventions in hospitalized patients:
• OR 1.65 (1.44-1.99) inpatient counseling + intensive
outpatient follow-up
• OR 1.09 (0.91-1.31) inpatient counseling alone
Smoking cessation
Rigotti N. Cochrane Database Syst Rev 3:CD001837. 2007.

• Reviewed 12,864
patients in VSGNE of
which 12,813 had
smoking status
documented.
Smoking cessation in VSGNE
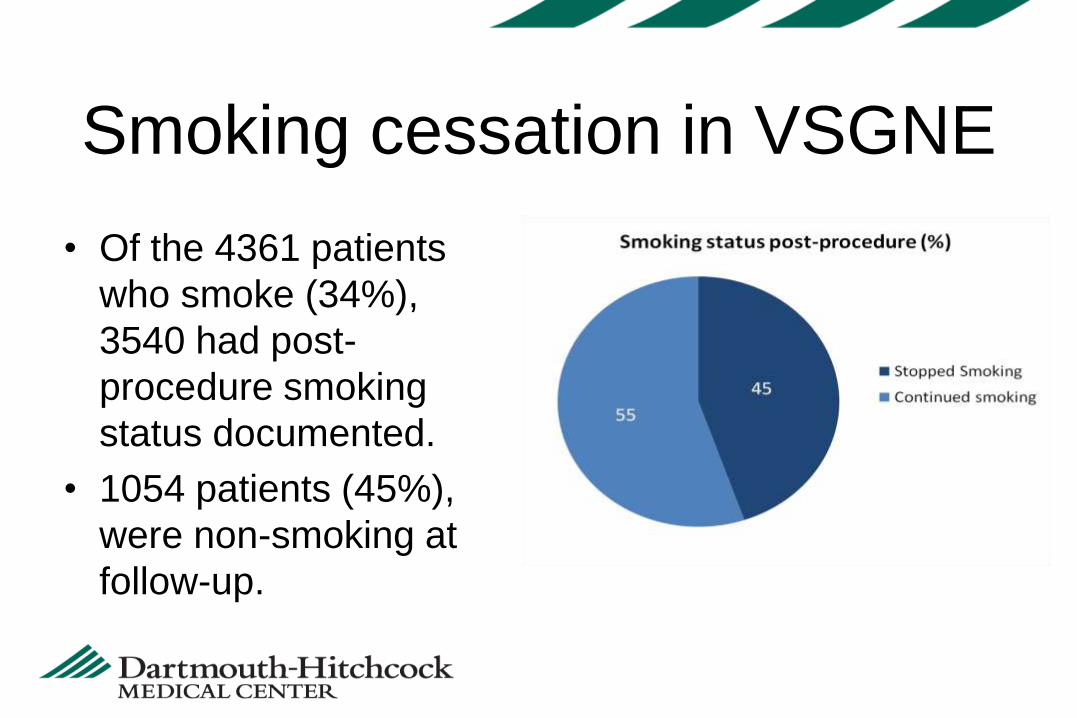
• Of the 4361 patients
who smoke (34%),
3540 had post-
procedure smoking
status documented.
• 1054 patients (45%),
were non-smoking at
follow-up.
Smoking cessation in VSGNE
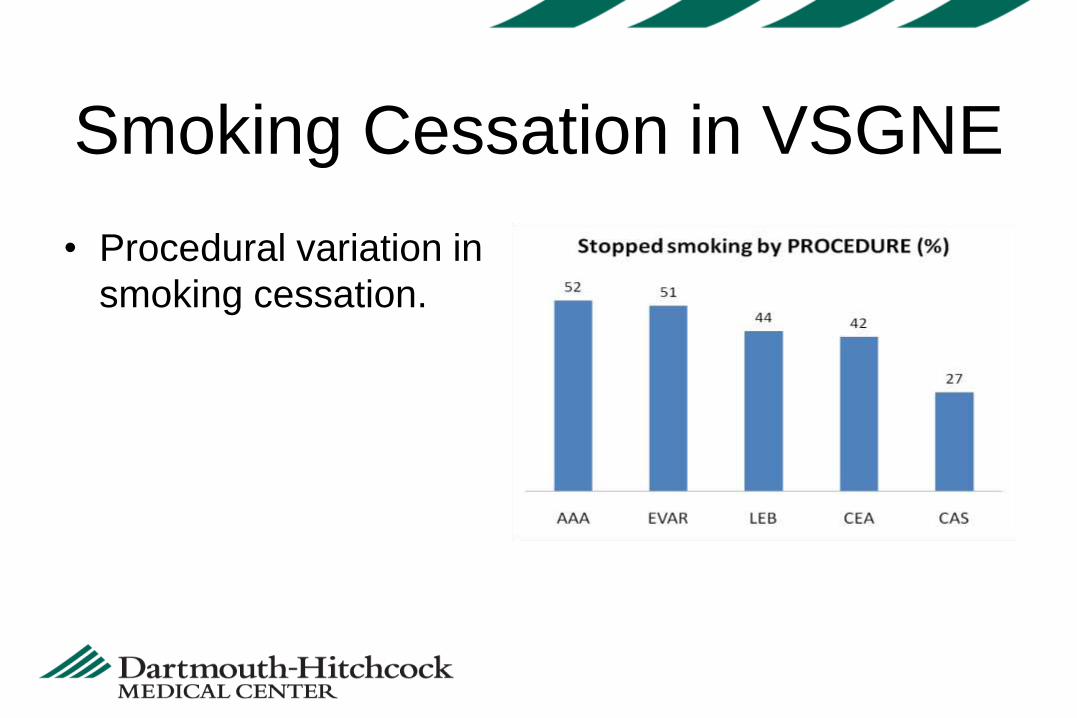
• Procedural variation in
smoking cessation.
Smoking Cessation in VSGNE
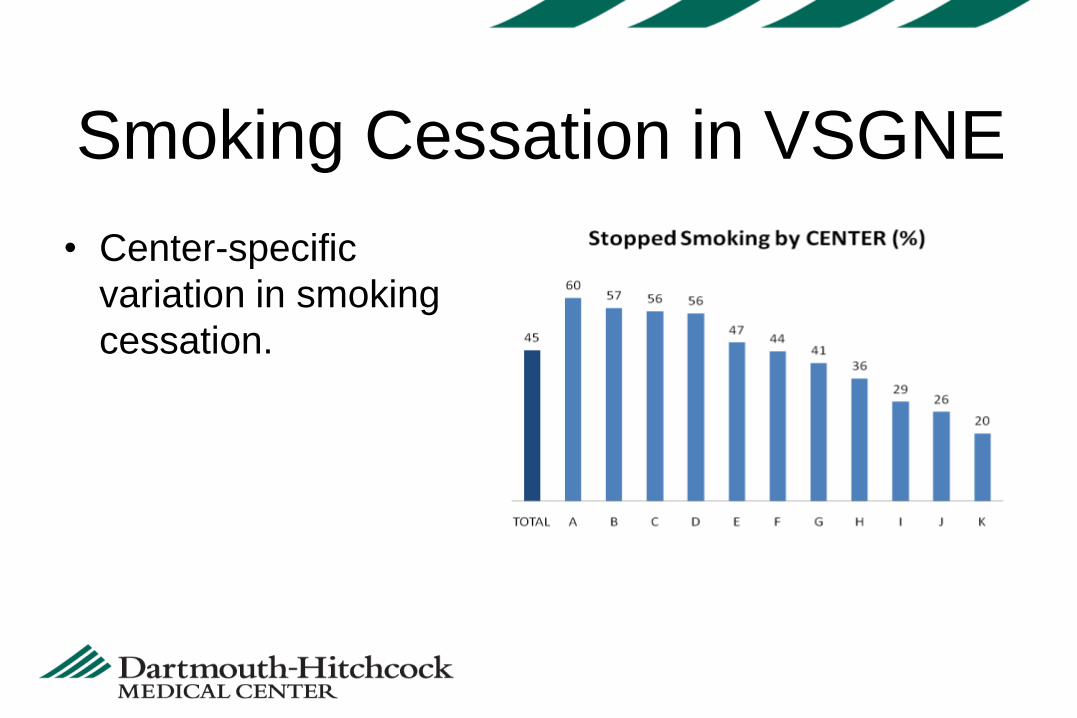
• Center-specific
variation in smoking
cessation.
Smoking Cessation in VSGNE
Objectives:
• Delineate factors associated with smoking cessation.
• Query institutional practices for smoking cessation.
• Identify areas for improvement in smoking cessation.
Smoking Cessation in VSGNE

Predictors of Length of Stay
in the VSGNE Cohort
David Kuwayama, MD; Margaret Russell; Yuanyuan
Zhao; Jack Cronenwett, MD
Dartmouth Hitchcock Medical Center

• Post-operative length of stay (LOS) is a major
determinant of in-hospital costs
• Minimizing LOS without harming patient outcomes is
an important goal in an era of cost containment
Categories of operation
• Carotid endarterectomy (primary, not concurrent with
CABG)
• Lower extremity bypass (non-emergent, for CLI)
• Open AAA (elective including symptomatic)
• EVAR (elective including symptomatic)
• Length of stay has decreased over time for some, but
not all, procedures
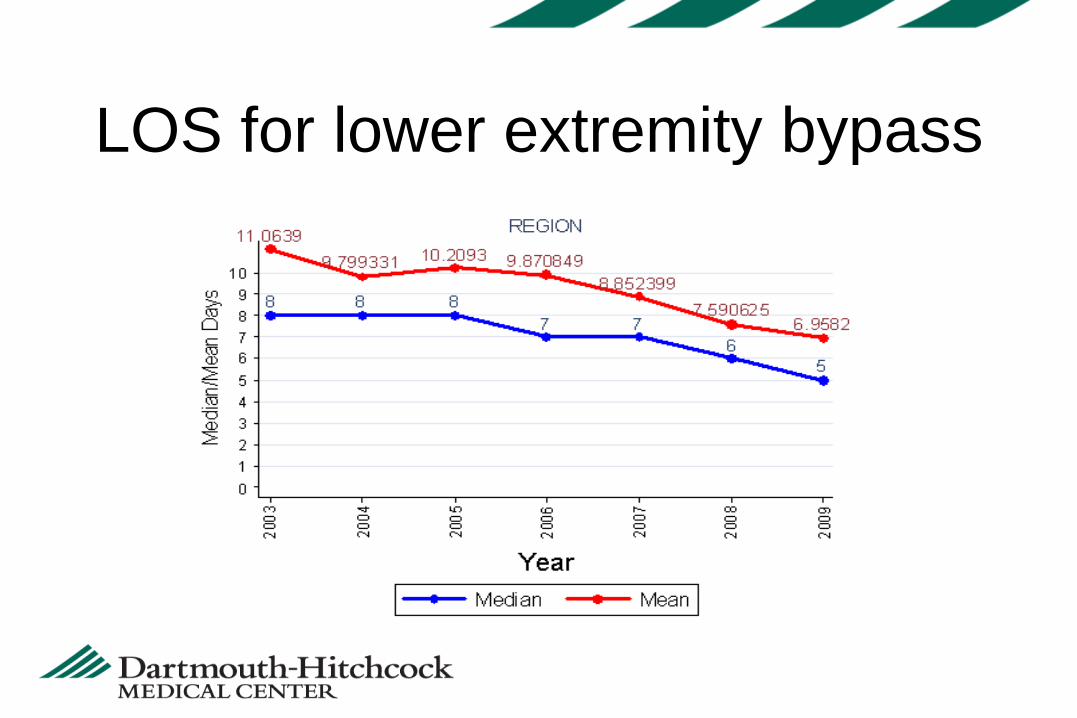
LOS for lower extremity bypass
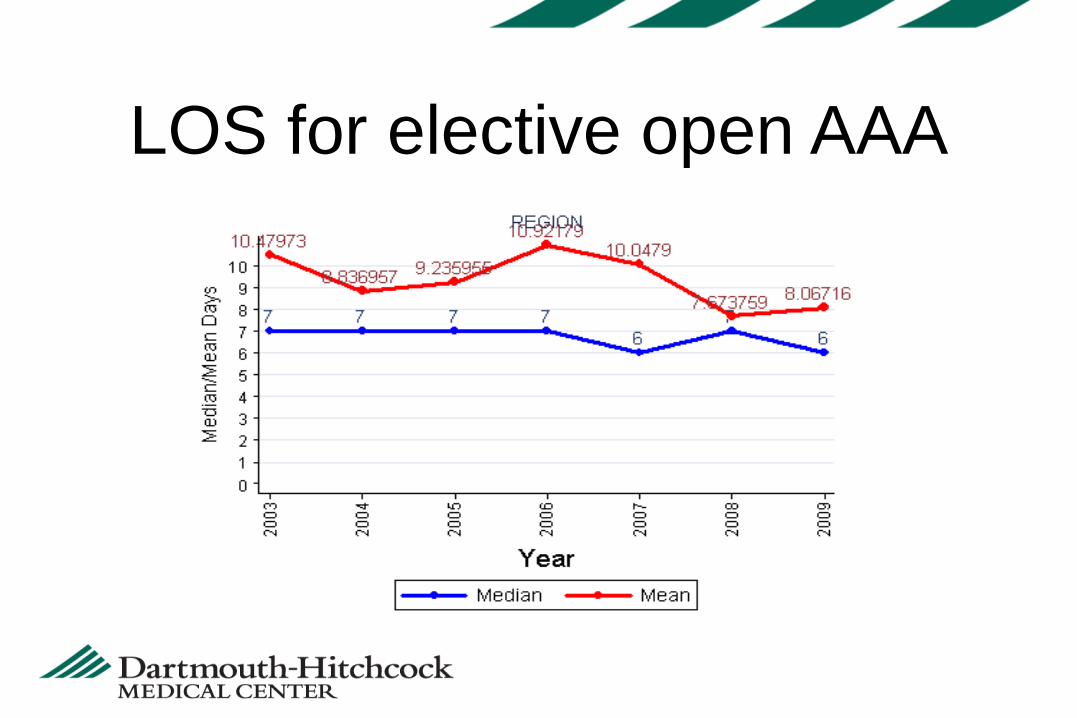
LOS for elective open AAA

• Utilizing the VSGNE database, we hope to identify
center, provider, and patient related factors
associated with increased LOS
Variability by center

203

204

205
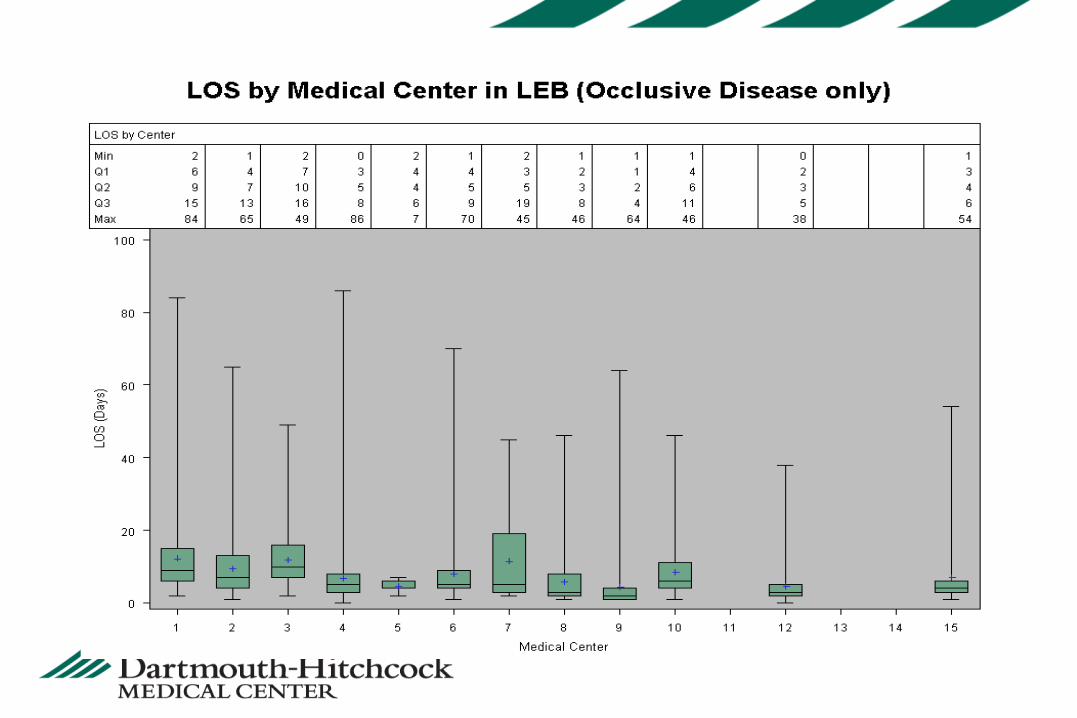
206

Variability by provider
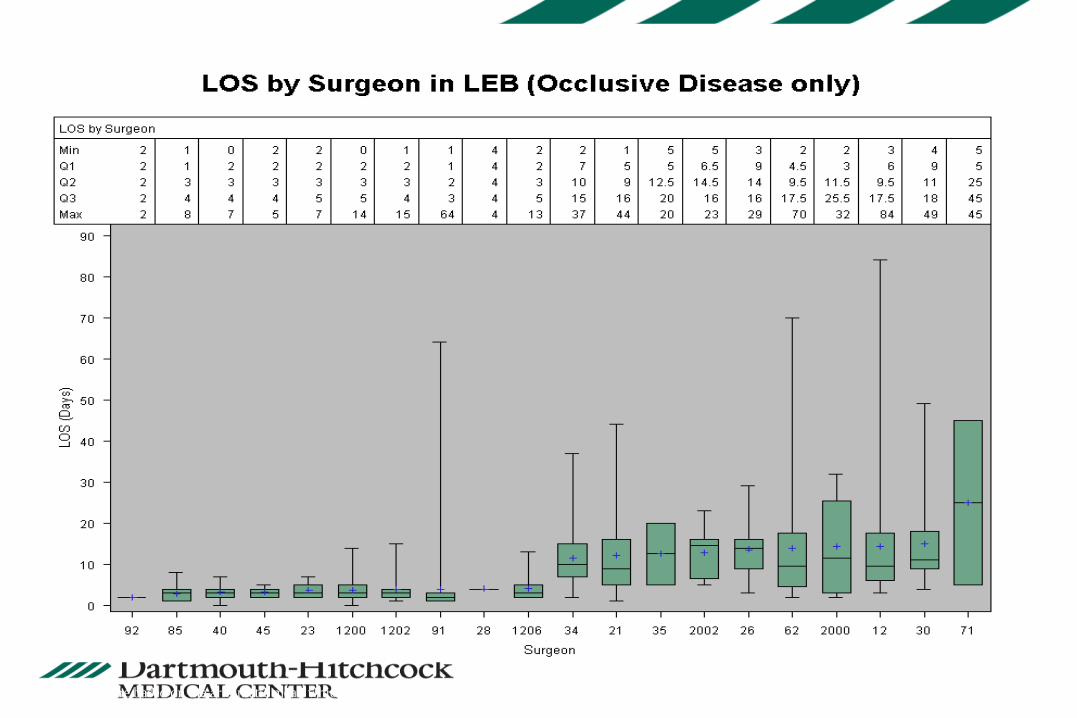
* This figure based on the arithmetic mean which should not be the same from the geometric mean.

Variability by complication
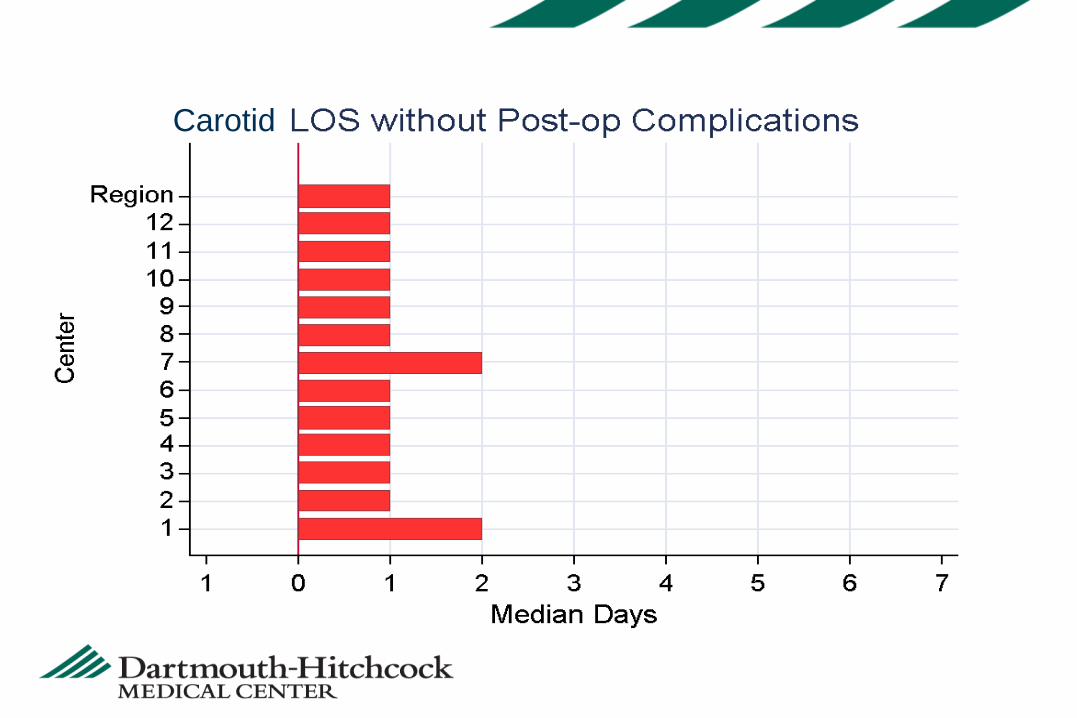
Carotid
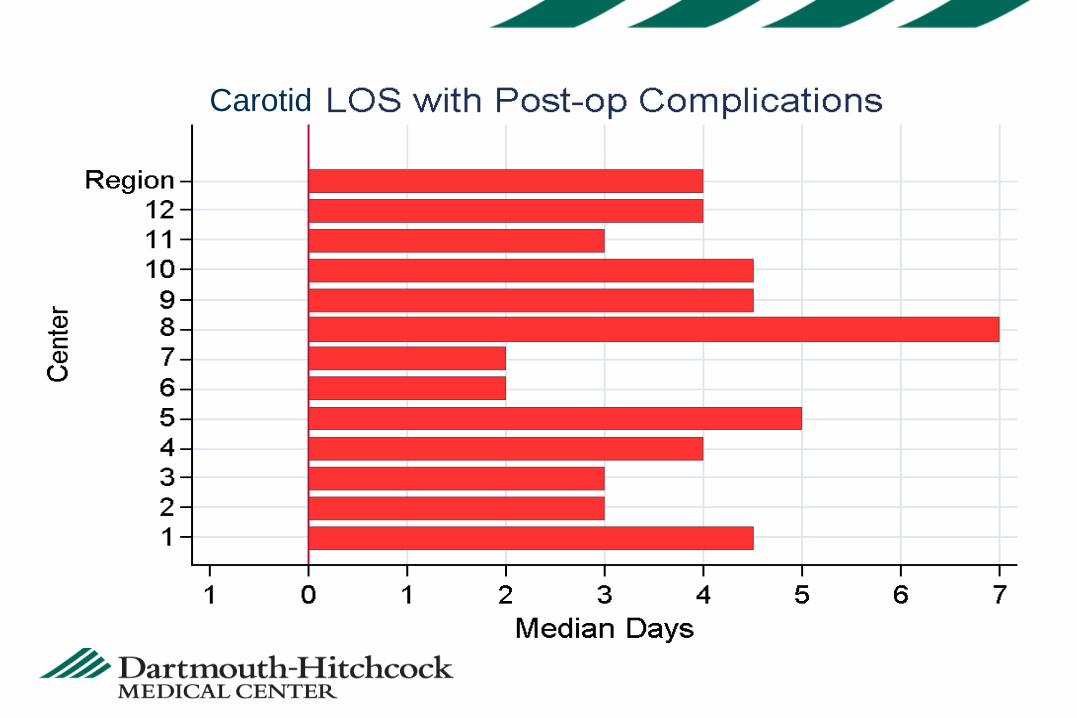
Carotid

Functional Outcome after
Amputation in Lower Extremity
Bypass Patients
Quality Improvement Topic
VSGNE Fall Meeting 2010
Bjoern Suckow, MD
Purpose
• Provide overview of current project
• Outline rationale for collecting index amputations in
the VSGNE

Introduction – A Little About Me
• General Surgery Resident at Univ. of Utah
• 2-year research commitment
– Mentor: Larry Kraiss, MD
• Masters of Science in Clinical Investigation
• Interest in Quality Measurement and Functional
Outcomes
• Collaboration with VSGNE
– Mentors: Philip Goodney, Jack Cronenwett, and Others

Background
• CLI - nearly one million elderly Americans
• Over 100,000 major amputations annually
• Amputation
– Commonly feared
– Higher incidence
• Hemodialysis
• Diabetes
• Low socio-economic status
• Older age
• Limited data describing functional outcome after
amputation

Background
• VSGNE
–Amputation captured as an outcome of
LEB patients
• VSGNE also captures:
–Living status
–Ambulation Status
Our Project
• Goal
–Characterize functional outcome of
patients who undergo amputation
–Describe pre- and peri-operative risk
factors associated with a “good functional
outcome”
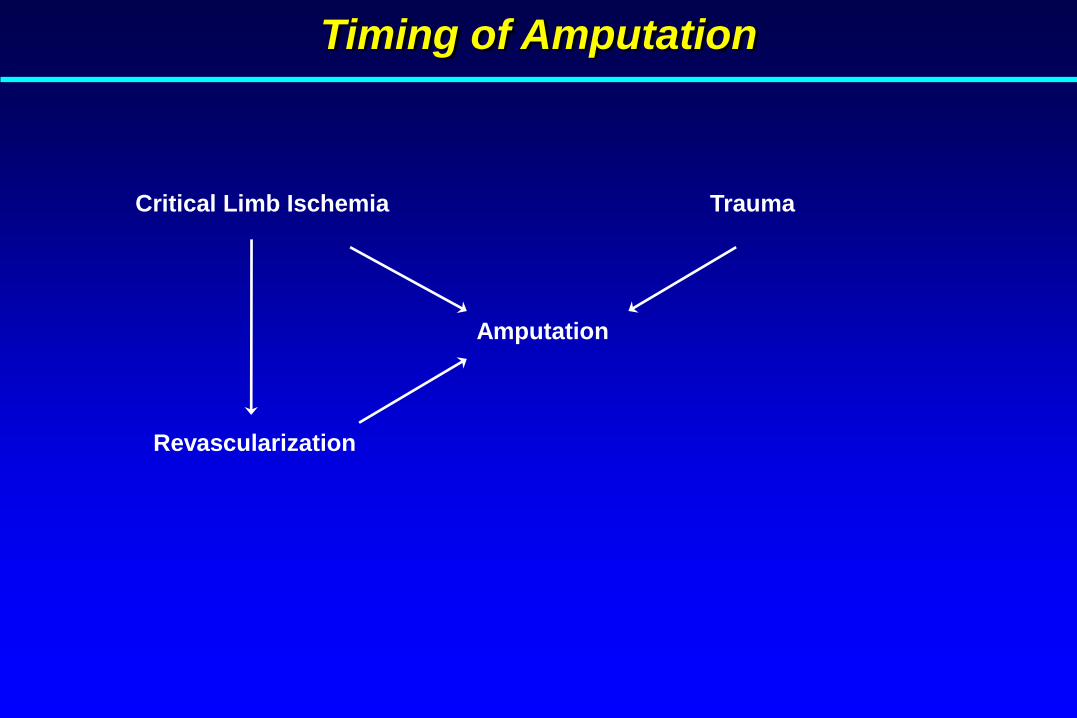
Timing of Amputation
Critical Limb Ischemia
Revascularization
Trauma
Amputation
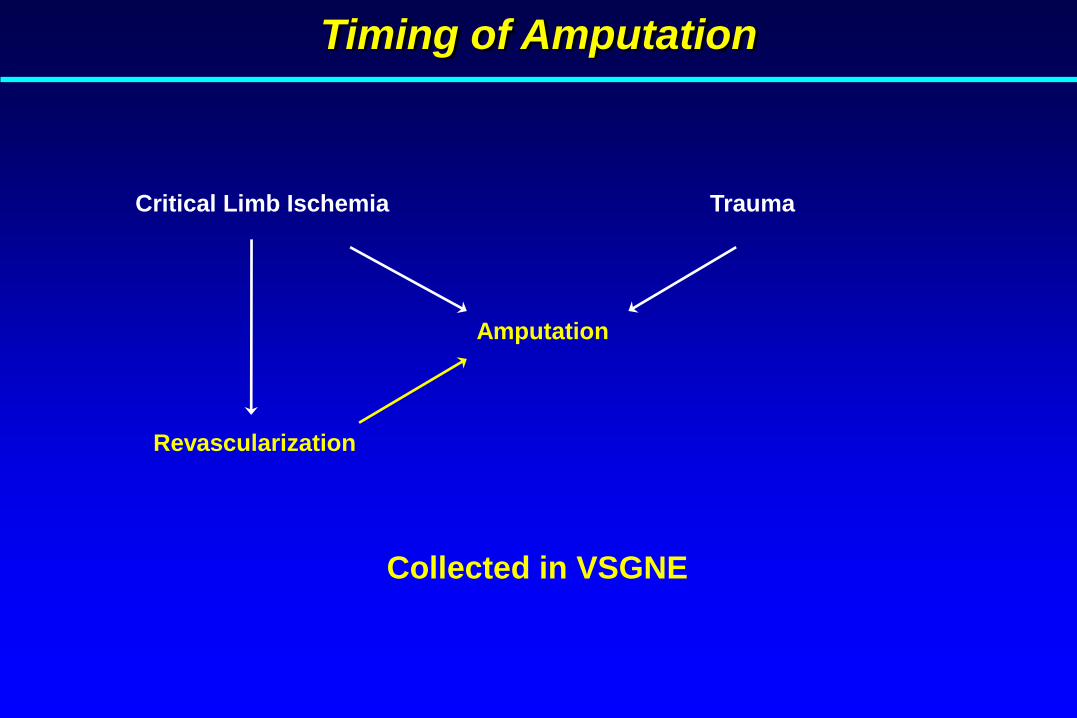
Timing of Amputation
Critical Limb Ischemia
Revascularization
Trauma
Amputation
Collected in VSGNE
Our Project
• Goal
– Characterize functional outcome of patients who undergo
amputation
– Describe pre- and peri-operative risk factors associated with a
“good functional outcome”
Our Project
• Goal
– Characterize functional outcome of patients who undergo
amputation after lower extremity bypass
– Describe pre- and peri-operative risk factors associated with a
“good functional outcome” (defined as independent ambulation
and living at home)
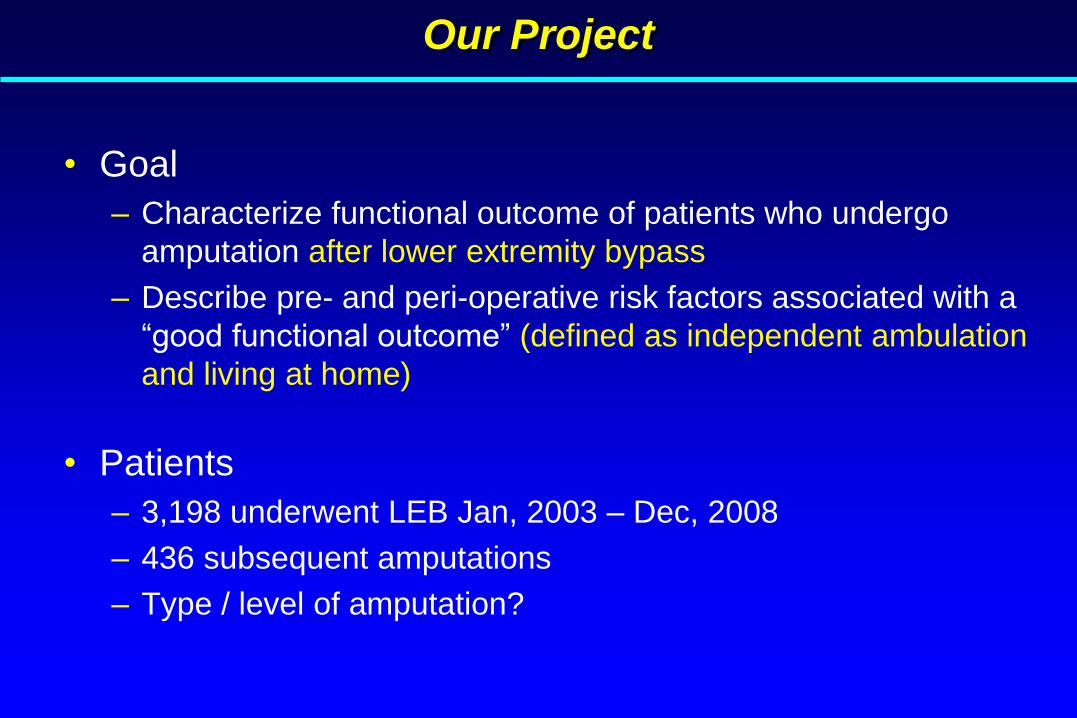
Our Project
• Goal
– Characterize functional outcome of patients who undergo
amputation after lower extremity bypass
– Describe pre- and peri-operative risk factors associated with a
“good functional outcome” (defined as independent ambulation
and living at home)
• Patients
– 3,198 underwent LEB Jan, 2003 – Dec, 2008
– 436 subsequent amputations
– Type / level of amputation?
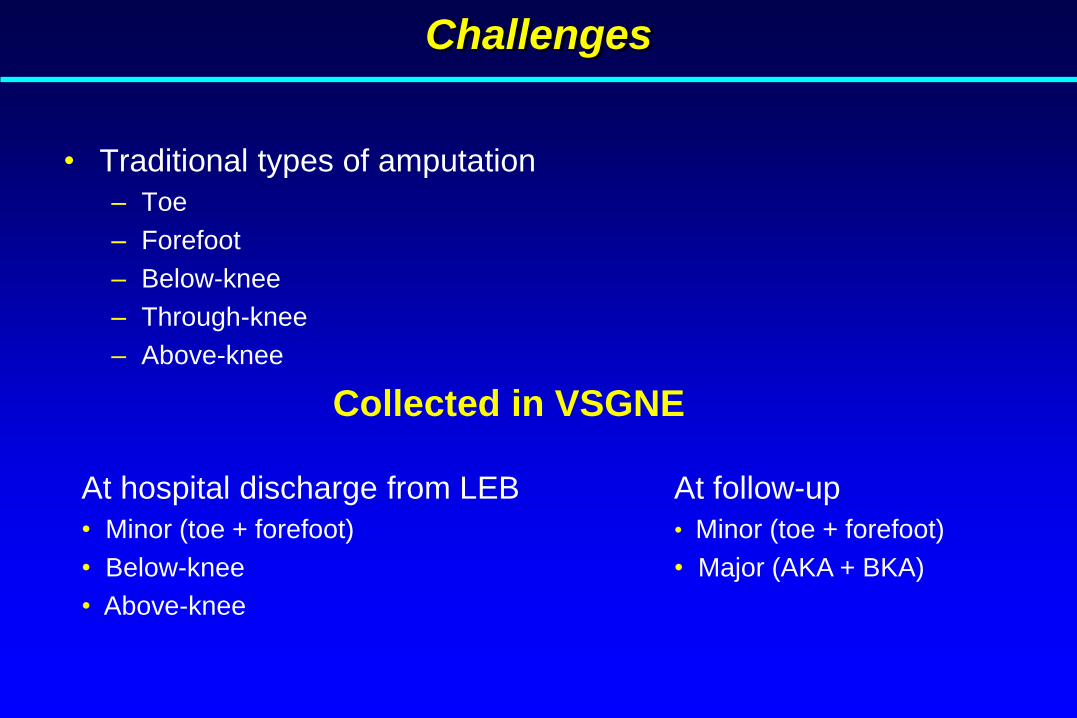
Challenges
• Traditional types of amputation
– Toe
– Forefoot
– Below-knee
– Through-knee
– Above-knee
Collected in VSGNE
At hospital discharge from LEB
• Minor (toe + forefoot)
• Below-knee
• Above-knee
At follow-up
• Minor (toe + forefoot)
• Major (AKA + BKA)

Initial Analysis
Functional Outcome
• Only 24 known BKA patients
• 143 major amputation patients – combination of AKA and BKA
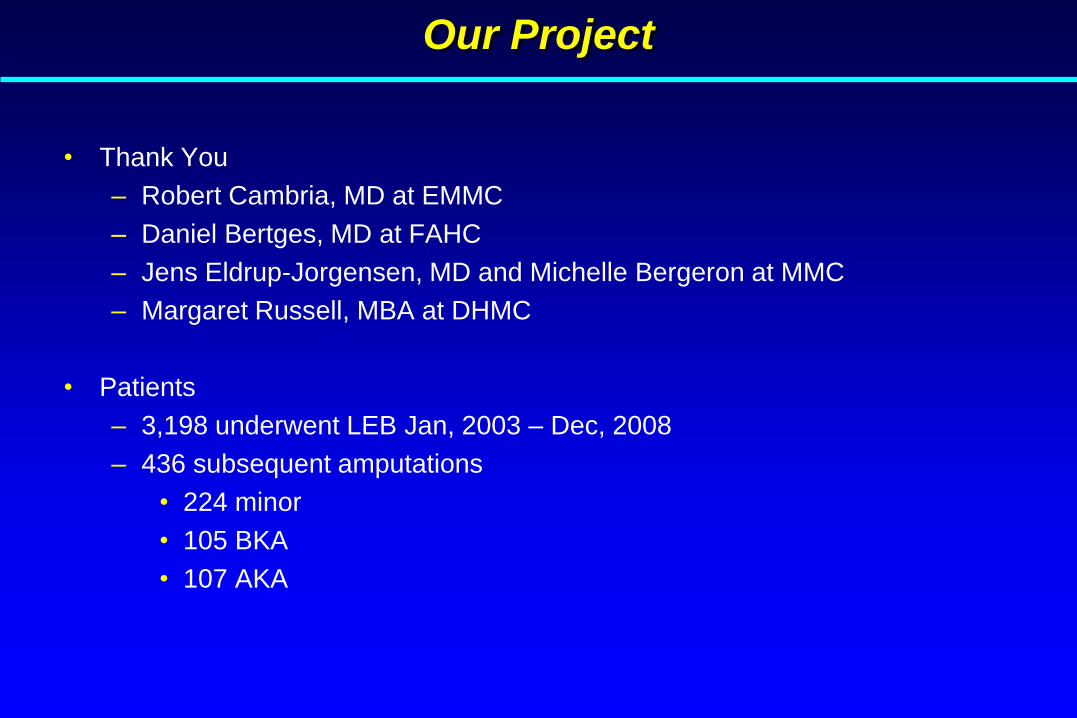
Our Project
• Thank You
– Robert Cambria, MD at EMMC
– Daniel Bertges, MD at FAHC
– Jens Eldrup-Jorgensen, MD and Michelle Bergeron at MMC
– Margaret Russell, MBA at DHMC
• Patients
– 3,198 underwent LEB Jan, 2003 – Dec, 2008
– 436 subsequent amputations
• 224 minor
• 105 BKA
• 107 AKA

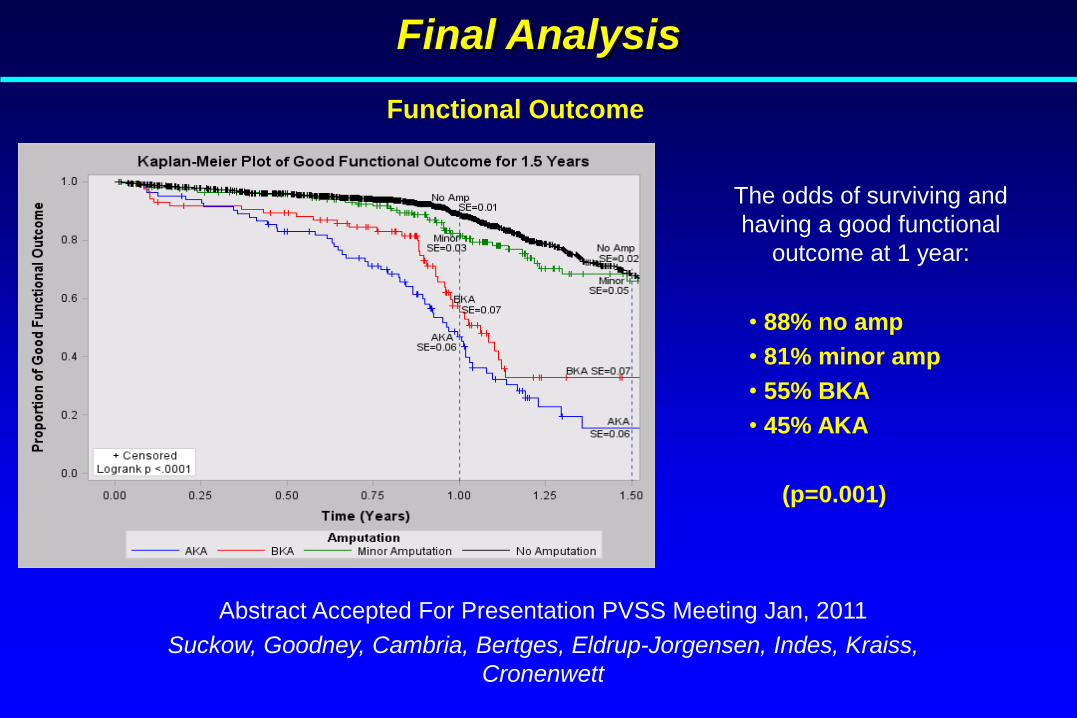
Final Analysis
Functional Outcome
The odds of surviving and
having a good functional
outcome at 1 year:
• 88% no amp
• 81% minor amp
• 55% BKA
• 45% AKA
(p=0.001)
Final Analysis
Functional Outcome
The odds of surviving and
having a good functional
outcome at 1 year:
• 88% no amp
• 81% minor amp
• 55% BKA
• 45% AKA
(p=0.001)
Abstract Accepted For Presentation PVSS Meeting Jan, 2011
Suckow, Goodney, Cambria, Bertges, Eldrup-Jorgensen, Indes, Kraiss,
Cronenwett
Future Directions
• Available Data
– Missing primary amputations
– Incomplete levels / types of amputation
• Outcome Measures
– Collecting ambulation and living status
– Missing patient-centered metric
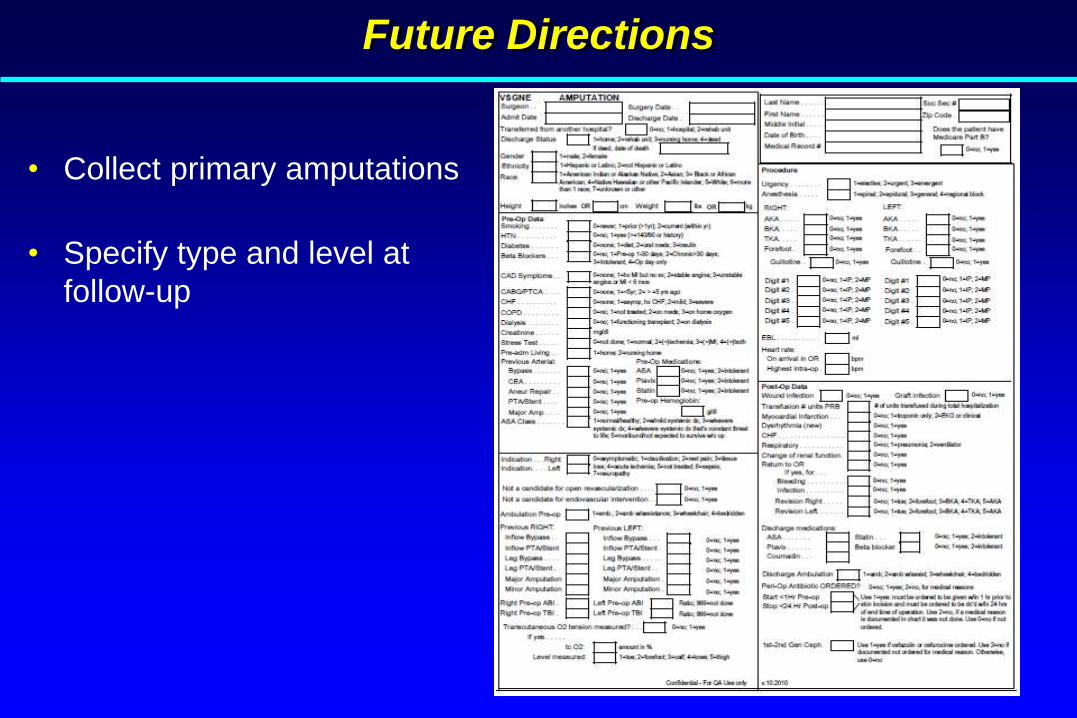
Future Directions
• Collect primary amputations
• Specify type and level at
follow-up

Thank You