variations in and measurements of health ib geography ii
TRANSCRIPT
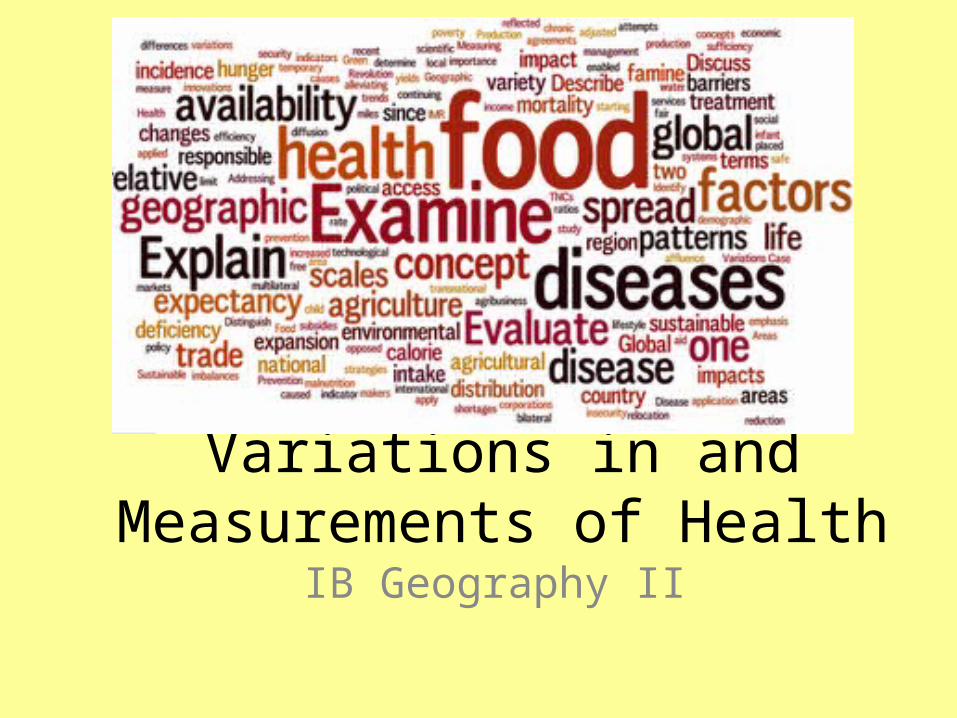
Variations in and Measurements of Health
IB Geography II

Objectives• By the end of these guided notes, students will be
able to:– Understand and calculate the different ways of
measuring the health of a population. – Evaluate the strengths and limitations of indicators used
to measure health. – Describe variations in health as reflected by
changes in life expectancy national and global scales since 1950.
– Explain patterns and trends in terms of differences in income and lifestyle.

The World Health Organization defines health as ‘a state of complete physical, mental and social well-being’.
What is health?
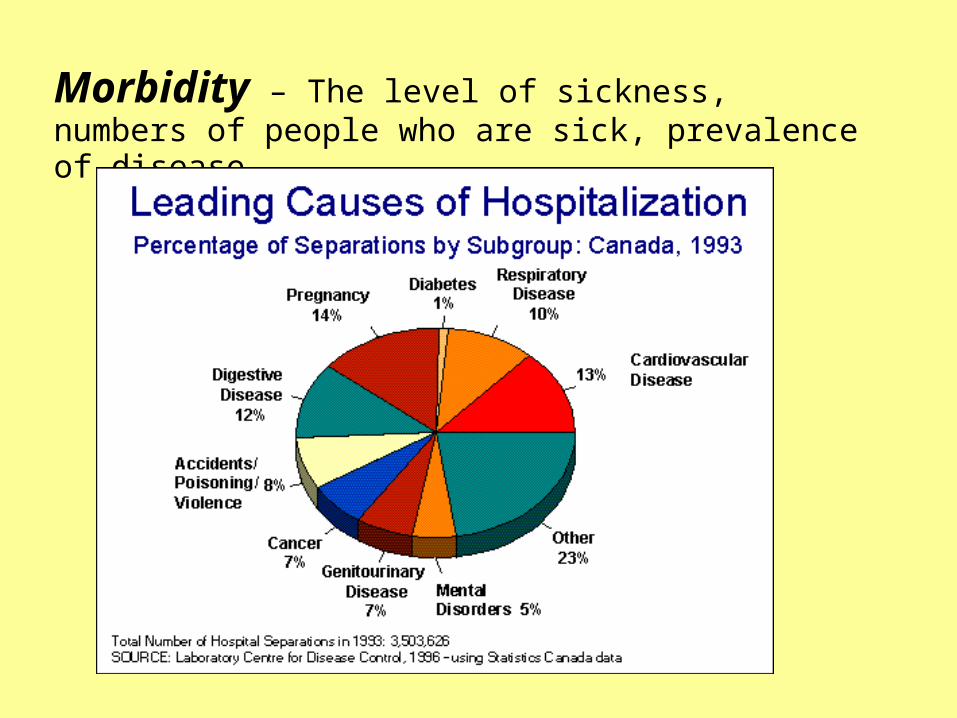
Morbidity – The level of sickness, numbers of people who are sick, prevalence of disease.
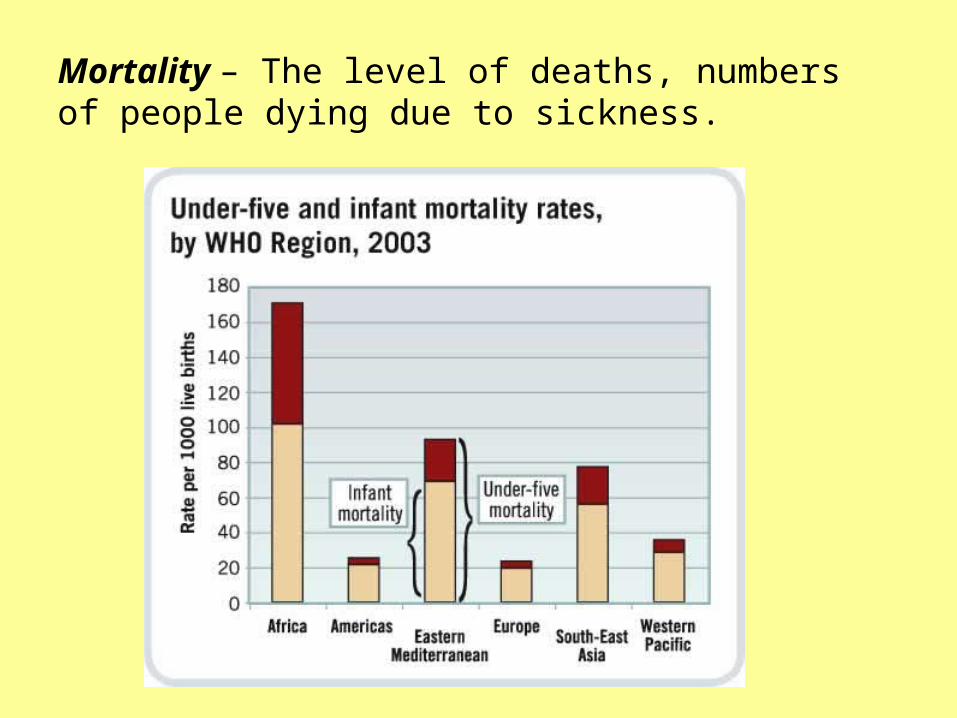
Mortality – The level of deaths, numbers of people dying due to sickness.
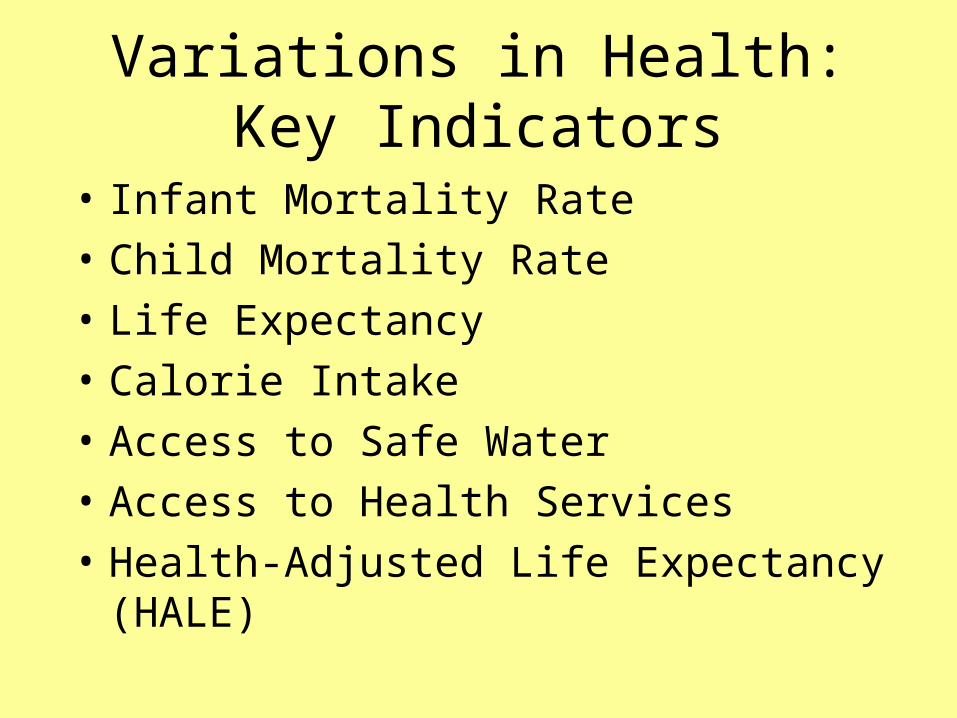
Variations in Health: Key Indicators
• Infant Mortality Rate• Child Mortality Rate • Life Expectancy • Calorie Intake • Access to Safe Water• Access to Health Services • Health-Adjusted Life Expectancy (HALE)

Infant Mortality Rate
Total # of deaths of children < 1 year old________________________________ per 1000
Total # of Live Births
Infant Mortality Rate
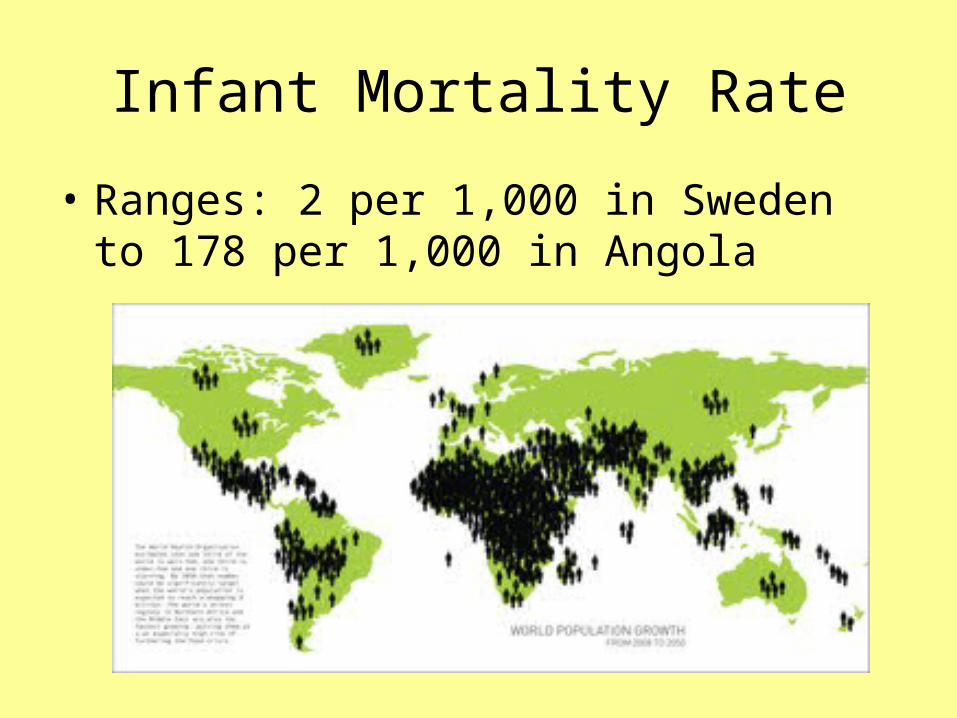
• Ranges: 2 per 1,000 in Sweden to 178 per 1,000 in Angola
Child Mortality Rate
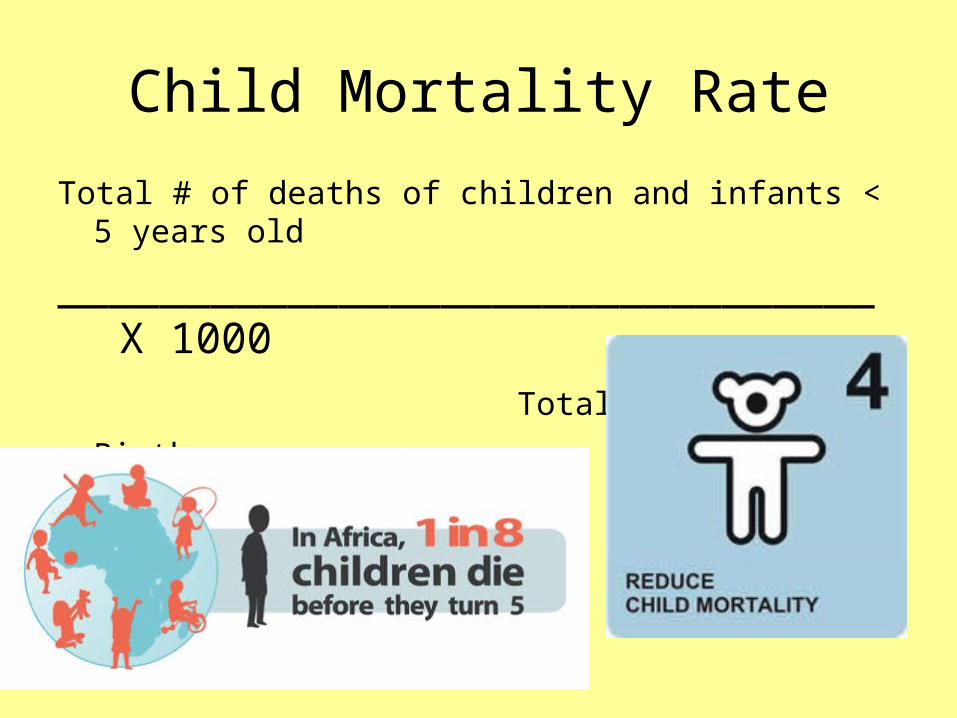
Total # of deaths of children and infants < 5 years old
________________________________ X 1000 Total # of Live Births

Infant Mortality Rate/Child Mortality Rate
• Advantages – IMR/CMR are good
measures of human welfare because it reflects household income, nutrition, maternal age and education, housing conditions, and sanitation
• Disadvantages – Not all data is collected,
some births go undocumented, so deaths would go undocumented as well.
– If it is collected by a household survey, national birth and death registration systems may be unreliable, AIDS epidemic, civil war and migration lead to further inaccuracy in Africa

Life Expectancy
• The average number of years that a person can be expected to live if demographic factors remain unchanged
• Ranges from 45-80 globally • Males < Female • Life expectancy globally has increased since
1950 due to greater food production, more clean water, better living conditions, and better health care.

Advantages of using Life Expectancy
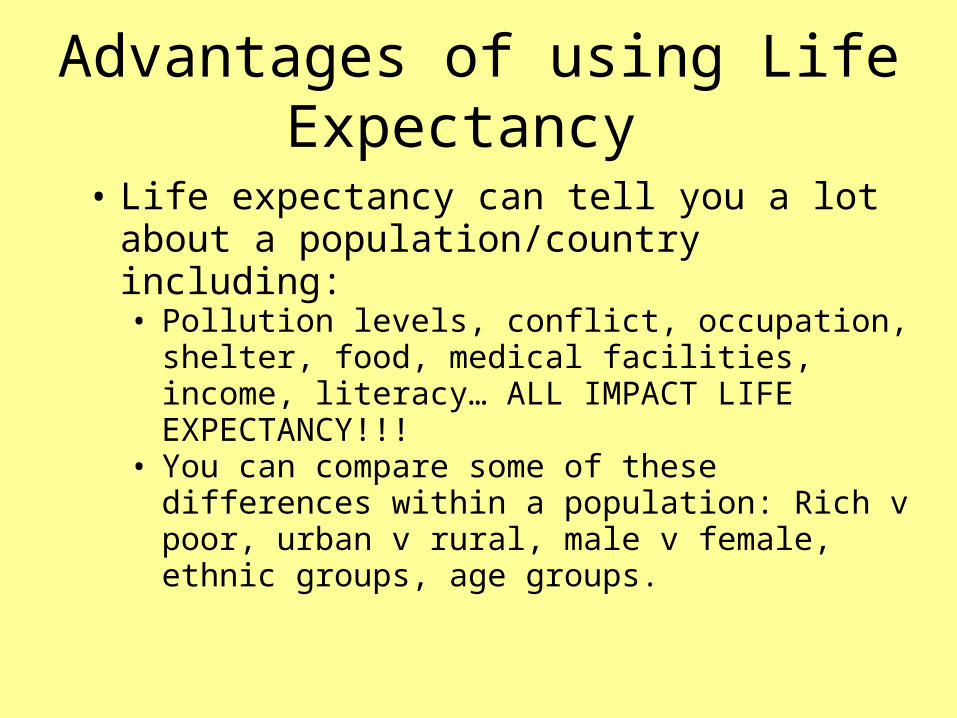
• Life expectancy can tell you a lot about a population/country including: • Pollution levels, conflict, occupation, shelter, food,
medical facilities, income, literacy… ALL IMPACT LIFE EXPECTANCY!!!
• You can compare some of these differences within a population: Rich v poor, urban v rural, male v female, ethnic groups, age groups.

Limitations to using Life Expectancy
• Considers only length of life, not number of years spent living in poor health
• YLDs (years lived with a disability) • DALYs (disability adjusted life expectancy): the
sum of years of potential life lost due to premature mortality and the years of productive life lost due to disability
• It is just an average, there can be regional/urban-rural variations

Calorie Intake
• WHO outlines that the recommended calorie intake is: – Men: 2500 per day– Women: 2000 per day
• Afghanistan: 1,500 per day per person
• USA: 3,774 per day per person

Advantages of Calorie Intake
• Can tell you a lot about the food system in a given country, and it can be linked to other health indicators and social indicators like income.

Limitations to Calorie Intake
• Does not take nutrient consumption into account – Example: eating 1,000 calories worth of apples is
very different from eating 1,000 calories worth of chips
• It is not linked to calorie requirement – Example: Construction worker who works 12
hours a day in the heat and cold doing manual labor will need more calories than an accountant who sits at his desk for 8 hours a day

Chronic v. Acute Food Shortage
Chronic
Occurring over a long period of time
• Acute
Occurring over a short period of time

Access to Safe Water
• Access to water that is affordable, in sufficient quantity and available without excessive effort and time
• Directly related to poverty • Often caused by governments failing in the ability to
finance sanitation and water systems• In 2008, 2.6 billion people had no access to a toilet,
and 1.1 billion were defecating in the open • Inadequate sewage and water systems spread
infections like cholera and viral hepatitis

Access to Safe Water
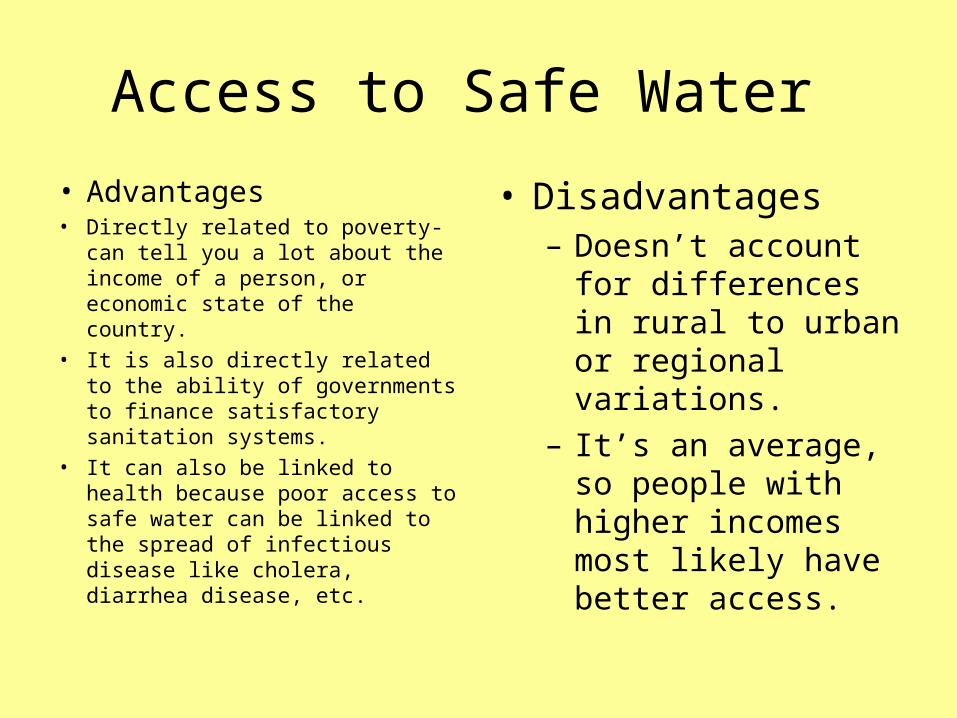
• Advantages• Directly related to poverty- can
tell you a lot about the income of a person, or economic state of the country.
• It is also directly related to the ability of governments to finance satisfactory sanitation systems.
• It can also be linked to health because poor access to safe water can be linked to the spread of infectious disease like cholera, diarrhea disease, etc.
• Disadvantages– Doesn’t account for
differences in rural to urban or regional variations.
– It’s an average, so people with higher incomes most likely have better access.

Access to Health Services
• Usually measured in the number of people per doctor, health worker or hospital per every 10,000 in the population
Country Switzerland Brazil Ethiopia
Physicians per 10,000
40 17 .5
Hospital Beds per 10,000
55 24 2
Health Expenditure $ per capita
4,417 674 26


Access to Health Services
• Advantages– Can show you how much
money is being spent per individual by giving data on health beds, medication, physicians per person in the population.
• Disadvantages– Doesn’t account for
differences in rural to urban or regional variations.
– It’s an average, so people with higher incomes most likely have better access.
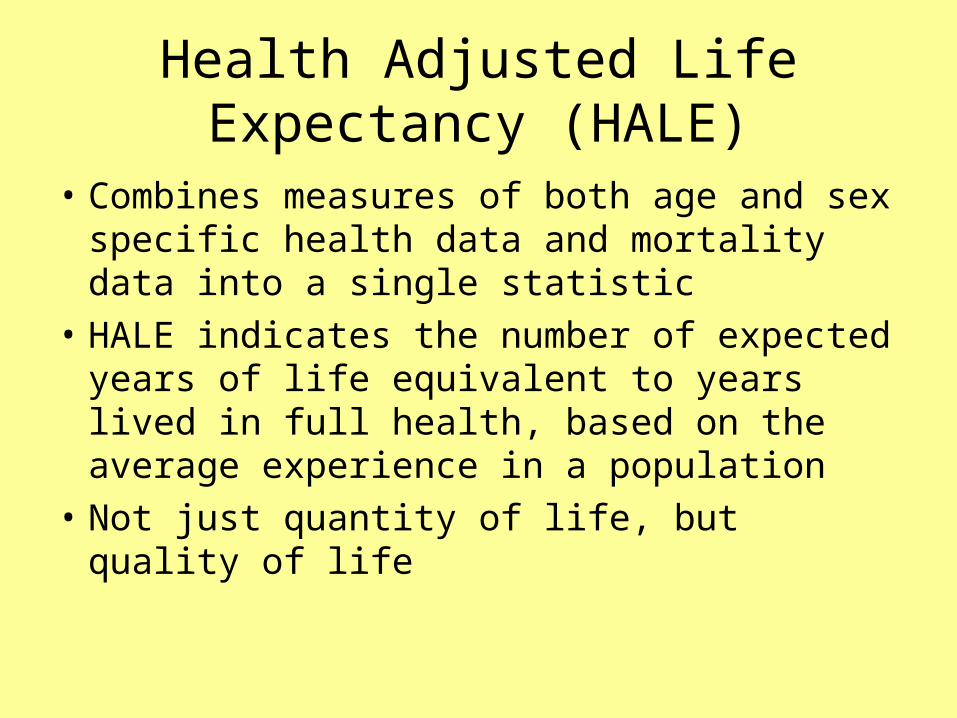
Health Adjusted Life Expectancy (HALE)
• Combines measures of both age and sex specific health data and mortality data into a single statistic
• HALE indicates the number of expected years of life equivalent to years lived in full health, based on the average experience in a population
• Not just quantity of life, but quality of life


Calculating HALE
• The WHO uses life expectancy + Sullivan’s Method to compute the HALE for countries
• Sullivan’s Method: the number of remaining years, at a particular age, which an individual can expect to live in a healthy state
• Method includes weight assigned to each type of disability, depending on severity
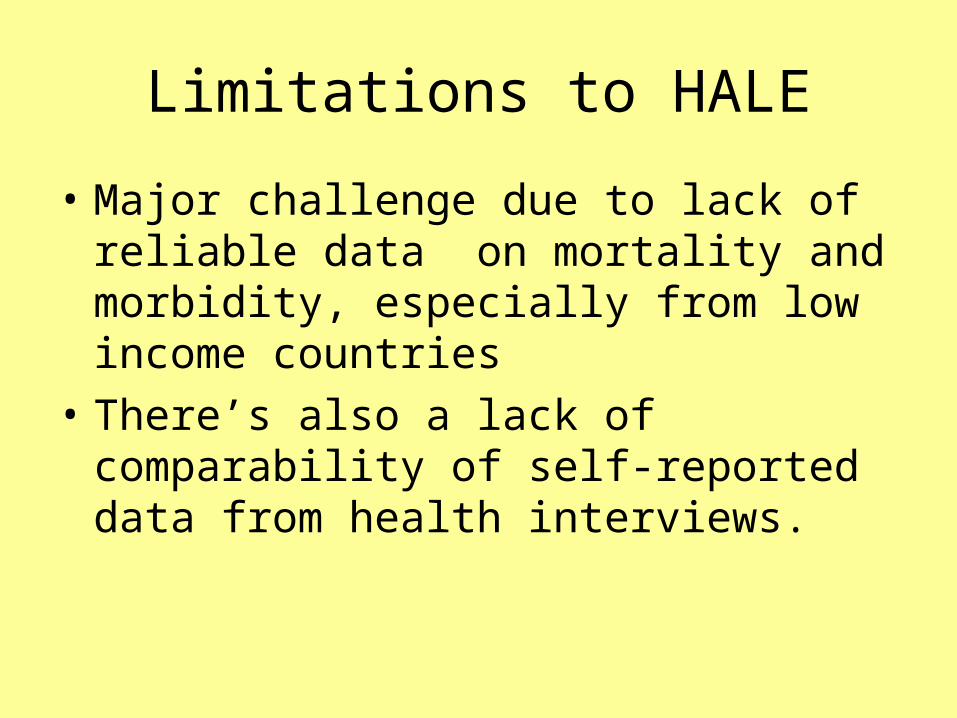
Limitations to HALE
• Major challenge due to lack of reliable data on mortality and morbidity, especially from low income countries
• There’s also a lack of comparability of self-reported data from health interviews.
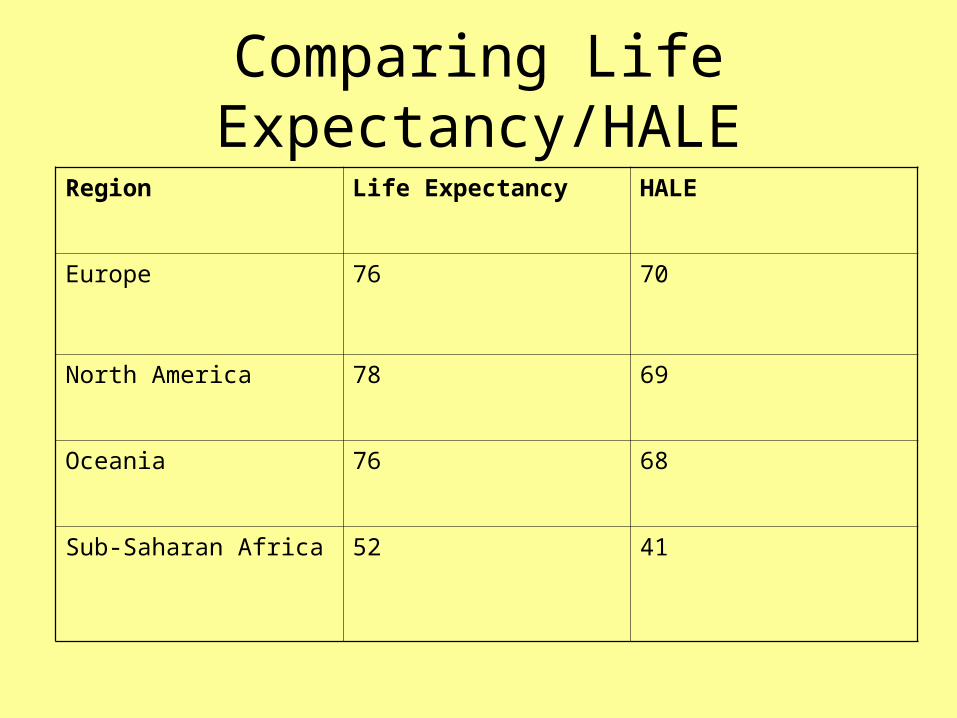
Comparing Life Expectancy/HALERegion Life Expectancy HALE
Europe 76 70
North America 78 69
Oceania 76 68
Sub-Saharan Africa 52 41

Epidemiology – The study of the factors affecting the health, morbidity and mortality of populations. Closely linked to Geography as the factors will vary spatially and will be place specific.

• As health improves, morbidity and mortality fall thus life expectancy increases.
• This is called epidemiological (health) transition (Omran 1971).– This model focuses on both health and morbidity.– Changes will be apparent through modernization.– Changes will appear at different times depending on each
country and its developmental processes.
The Epidemiological Transition Model (Health Transition)

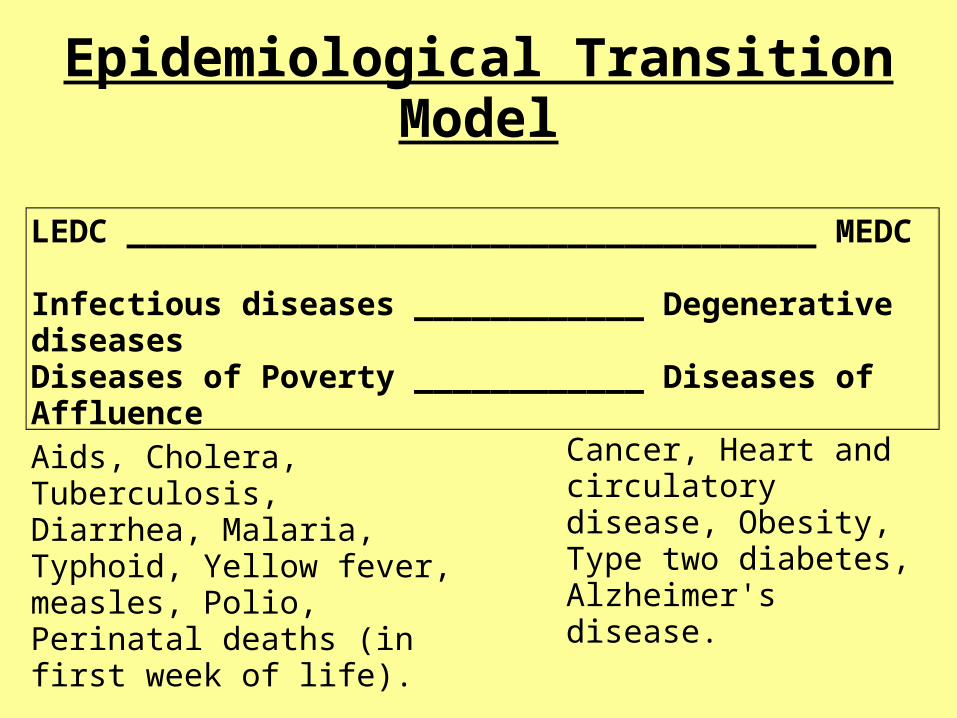
Epidemiological Transition Model
LEDC ____________________________________ MEDC
Infectious diseases ____________ Degenerative diseasesDiseases of Poverty ____________ Diseases of Affluence
Aids, Cholera, Tuberculosis, Diarrhea, Malaria, Typhoid, Yellow fever, measles, Polio, Perinatal deaths (in first week of life).
Cancer, Heart and circulatory disease, Obesity, Type two diabetes, Alzheimer's disease.

Demographic Transition Model v. Epidemiological Transition Model
• Similarities – Both deal with how countries develop over time.
• Differences – epidemiological transition model focuses more on
the reasons for development through health and not solely on births and deaths.

Similarities and DifferencesEpidemiological Transition Model (Health model) Demographic Transition Model

Disease Categories
Endogenetic (from inside)Congenital diseases from birth and degenerative diseases resulting from old age.
Exogenetic (from outside)Environmental conditions, social habits and hazards.

Exogenetic Factors LEDCS and MEDCS compared
LEDC •Nutrition (being underweight) •The environment (unsafe water, sanitation and hygiene)•Poor living standards •Social norms and disease such as HIV/AIDS (unsafe sex).
MEDC •Lifestyle causing high blood pressure (stress)•Physical inactivity (heart disease, diabetes)•Leisure activities (tobacco, alcohol, and drugs) •Nutrition (being overweight, high cholesterol levels, low fruit and vegetable intake).

Global Variations in Health and Income 1950

Global Variations in Health and Income 1980
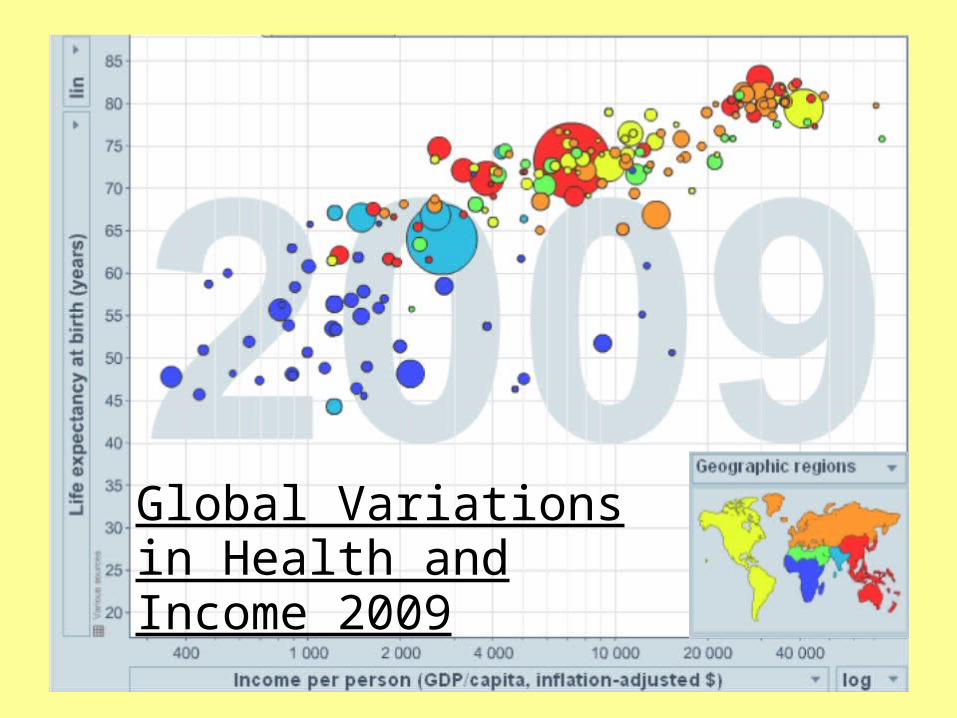
Global Variations in Health and Income 2009