variability of mass transport into polar stratosphere and winter cold air outbreaks in mid-latitudes...
TRANSCRIPT

Variability of Mass Transport into Polar Stratosphere and Winter Cold Air
Outbreaks in Mid-latitudes
Variability of Mass Transport into Polar Stratosphere and Winter Cold Air
Outbreaks in Mid-latitudes
Ming CaiDepartment of Earth, Ocean, and Atmospheric Science,
Florida State University
Ming CaiDepartment of Earth, Ocean, and Atmospheric Science,
Florida State University
Acknowledgement: Huug M. van den Dool, Y-Y Yu, R-C Ren
Grant Support: NOAA CPO: NA10OAR4310168
11

• Prognostic component: Dynamical prediction for (extratropic) stratospheric anomalies using CFS.
Status: Zhang et al. (2013): Evaluation of CFSv2 Predictions for the Stratospheric Circulation Anomalies (see the poster on Wednesday and Thursday).
• Diagnostic component: Statistical “instantaneous” relations between stratospheric and surface temperature anomalies (downscaling)
Status: This presentation (manuscript under preparation)
• Development of prototype forecast toolsStatus: waiting for availability of DAILY forecasts or
reforecasts with lead time > 2 weeks and new funding
• Prognostic component: Dynamical prediction for (extratropic) stratospheric anomalies using CFS.
Status: Zhang et al. (2013): Evaluation of CFSv2 Predictions for the Stratospheric Circulation Anomalies (see the poster on Wednesday and Thursday).
• Diagnostic component: Statistical “instantaneous” relations between stratospheric and surface temperature anomalies (downscaling)
Status: This presentation (manuscript under preparation)
• Development of prototype forecast toolsStatus: waiting for availability of DAILY forecasts or
reforecasts with lead time > 2 weeks and new funding 22
A hybrid forecasting strategy for intraseasonal cold season climate predictions (14 - 60? days)A hybrid forecasting strategy for intraseasonal cold season climate predictions (14 - 60? days)

Mean meridional mass circulation in winter hemisphere (Cai and Shin 2014)
3333

44
Vertical and meridional couplings by baroclinically amplifying (westward tilting)
waves (Johnson 1989)
Vertical and meridional couplings by baroclinically amplifying (westward tilting)
waves (Johnson 1989)
• A net poleward (adiabatic) transport of warm air mass aloft and a net equatorward (adiabatic) transport of cold air mass transport below.
• A net poleward (adiabatic) transport of warm air mass aloft and a net equatorward (adiabatic) transport of cold air mass transport below.
• Stronger poleward air mass transport in the warm air branch aloft is coupled with stronger air mass transport in the cold air branch near the surface and vice versa.
• Stronger poleward air mass transport in the warm air branch aloft is coupled with stronger air mass transport in the cold air branch near the surface and vice versa.
60N
25N
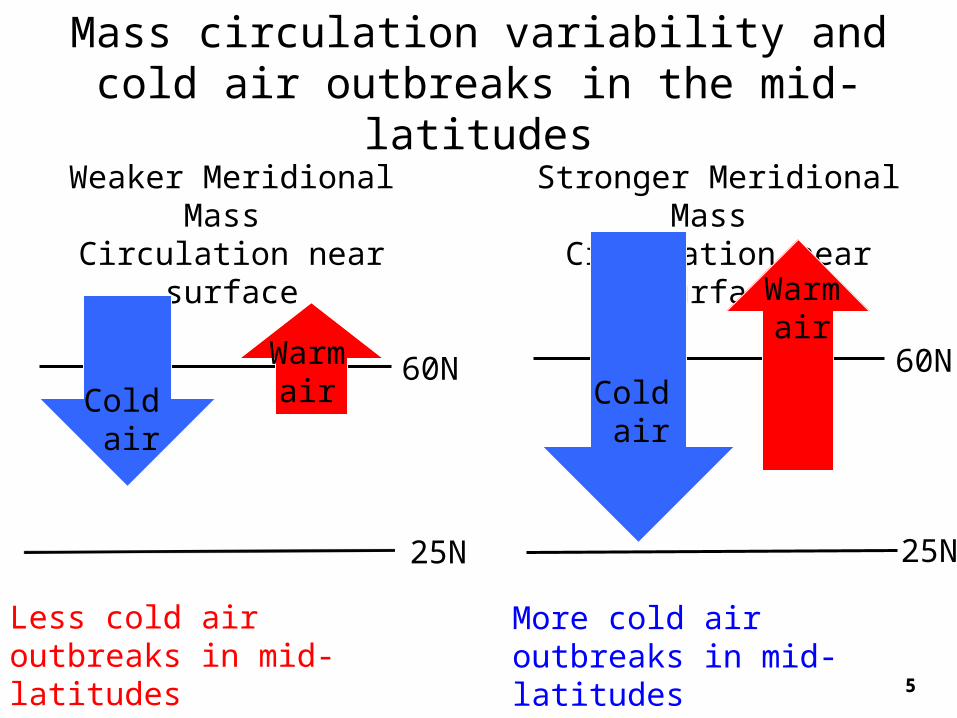
90NStronger Meridional Mass Circulation near surface
Mass circulation variability and cold air outbreaks in the mid-latitudes
Warmair
Cold air
60N
25N
90NWeaker Meridional Mass Circulation near surface
WarmairCold
air
Less cold air outbreaks in mid-latitudesColdness in high latitudes
More cold air outbreaks in mid-latitudesWarmness in high latitudes 55

6666
Indices of mass circulation crossing the polar circleIndices of mass circulation crossing the polar circle
The results with n = 0 are representative
• WB60N: the total air mass transported into the polar region
• CB60N: the total air mass out of the polar region
WB60N and CB60N are nearly perfectly positively correlated.
WB60N is representative mass circulation crossing 60N

The constant of 0.3085 corresponds to the fractional area of a given domain occupied by SATA exceeding/below 0.5LSD. 7777
Indices of coldness and warmnessIndices of coldness and warmness
The results with n = 0 are representative
CH(t) and CM(t): Percentage of area occupied by negative temperature anomalies below 0.5*standard_deviation (local) in high latitude zone (60 N poleward) and mid-latitudes (between 25 and 60N).
WH(t) and WM(t): Percentage of area occupied by positive temperature anomalies exceeding 0.5*standard_deviation (local) in high latitude zone (60 N poleward) and mid-latitudes (between 25 and 60N).

• ERA Interim Daily fields of T_surf, p_surf, 3D air temperature and winds in winters from 1979-2011 (33 winters): winter = Nov. 1 – Feb. 28 (120 days)
• Anomaly field = departure of the total field from the daily annual cycle.
• 6 WB60N threshold values: (1) WB60N’ < -1.0SD (weaker circulation), (2) WB60N’ < -0.5SD (weak circulation); (3) -0.5SD WB60N’ < 0 (Neutral-); (4) 0<WB60N’< 0.5SD (Neutral+); WB60N’> 0.5SD (strong); and WB60N’> 1.0SD (Stronger)
• Unless specified otherwise, all statistics of T_surf anomalies are obtained in the period of 1-10 days after WB50N reaches one of the threshold values.
• ERA Interim Daily fields of T_surf, p_surf, 3D air temperature and winds in winters from 1979-2011 (33 winters): winter = Nov. 1 – Feb. 28 (120 days)
• Anomaly field = departure of the total field from the daily annual cycle.
• 6 WB60N threshold values: (1) WB60N’ < -1.0SD (weaker circulation), (2) WB60N’ < -0.5SD (weak circulation); (3) -0.5SD WB60N’ < 0 (Neutral-); (4) 0<WB60N’< 0.5SD (Neutral+); WB60N’> 0.5SD (strong); and WB60N’> 1.0SD (Stronger)
• Unless specified otherwise, all statistics of T_surf anomalies are obtained in the period of 1-10 days after WB50N reaches one of the threshold values. 88
Data and Analysis ProceduresData and Analysis Procedures

9999
Lead
/Lag
Cor
rela
tions
bet
wee
n W
B60
N a
nd
war
mne
ss/c
oldn
ess
Indi
ces
Amp.
Masscirculation
High latitudes
Mid-latitudes
Coldness Warmness

1010
Shift of PDFs of temperature indices with WB60N Shift of PDFs of temperature indices with WB60N
Coldness
Warmness
Weaker Stronger Weaker Stronger
Weaker Stronger Weaker Stronger
Whigh Wmid-lat
Coldness
Warmness
Chigh Cmid-lat

Strong Circulation
Weak Circulation
Map
s of
Pro
babi
lity
of
T >
0.5
LS
D o
r T
< -
0.5L
SD
T > 0.5LSD T < -0.5LSD
T < -0.5LSDT > 0.5LSD
1111

Strong Circulation
Neutral-
Com
posi
te M
ean
Sur
face
Tem
pera
ture
Ano
mal
ies
Neutral+
Stronger Circulation
Weak Circulation
Weaker Circulation
1212

EOF113.1%
EO
F m
odes
of
Sur
face
Tem
pera
ture
Ano
mal
ies
EOF38.4%
EOF55.4%
EOF211.3%
EOF47.6%
EOF64.8%
Sum=50.3% 1313

Strong Circulation
Neutral-
Con
trib
utio
n to
the
mea
n co
mpo
site
pat
tern
Neutral+
Stronger Circulation
Weak Circulation
Weaker Circulation
1414

15151515
Com
posi
te M
eans
of
Tim
e S
erie
s of
EO
Fs
Amp.
Masscirculation

16161616
Con
trib
utio
n to
Var
ianc
e of
EO
Fs
Amp.
Masscirculation
EOF1
EOF5
EOF2
EOF6
EOF3 EOF4_______Strong
Circulation
_______Climatology
________Weak
Circulation

Survey of mass circulation crossing 60N in winter of 2013-14Survey of mass circulation crossing 60N in winter of 2013-14
Stratosphere
Warm Branch
Cold Branch
climatology
1SD
-1SD
12/9/13 1/1/14 1/18/14
1717

18181818
Com
posi
te M
eans
of
Tsu
rf d
ay 1
-7 a
fter
Amp.
Masscirculation
Mean Ts 12/10-12/16 Mean Ts 1/2-1/7
Mean Ts 1/19-1/25 Mean of the three cases

• Variability of mass flux warm air branch is synchronized with that of cold air branch.
• Lack of warm air into polar region is accompanied by weaker equatorward advancement of cold air near the surface. As a result, the cold air mass is largely imprisoned within polar circle, responsible for general warmness in mid-latitudes and below climatology temperature in high latitudes.
• Stronger warm air into polar stratosphere is accompanied by stronger equatorward advancement of cold air near the surface, resulting in massive cold air outbreaks in mid-latitudes and warmth in high latitudes.
• EOF1 and EOF4 of T_surf correspond to warm Arctic and cold over the two major continents after a stronger mass circulation (PDF shift in response to mass circulation).
• Positive phase of EOF2 represents warm Eurasian and cold N. America or vice versa. Amplitude of both positive and negative phases of EOF2 tends to increase after a stronger mass circulation (var. increase in response to mass circulation).
• Variability of mass flux warm air branch is synchronized with that of cold air branch.
• Lack of warm air into polar region is accompanied by weaker equatorward advancement of cold air near the surface. As a result, the cold air mass is largely imprisoned within polar circle, responsible for general warmness in mid-latitudes and below climatology temperature in high latitudes.
• Stronger warm air into polar stratosphere is accompanied by stronger equatorward advancement of cold air near the surface, resulting in massive cold air outbreaks in mid-latitudes and warmth in high latitudes.
• EOF1 and EOF4 of T_surf correspond to warm Arctic and cold over the two major continents after a stronger mass circulation (PDF shift in response to mass circulation).
• Positive phase of EOF2 represents warm Eurasian and cold N. America or vice versa. Amplitude of both positive and negative phases of EOF2 tends to increase after a stronger mass circulation (var. increase in response to mass circulation). 1919
SummarySummary