variability in the distribution of ozone over land and ... · variability in the distribution of...
TRANSCRIPT

Variability in the distribution of ozone over land and
marine regions in the Indian region
S. Lal1, S. Venkataramani1, S. Srivastava1, S. Gupta1 and M. Naja2
1 Physical Research Laboratory, Ahmedabad, India 2 Aryabhatta Research Institute of Observational Sciences, Nainital,
India
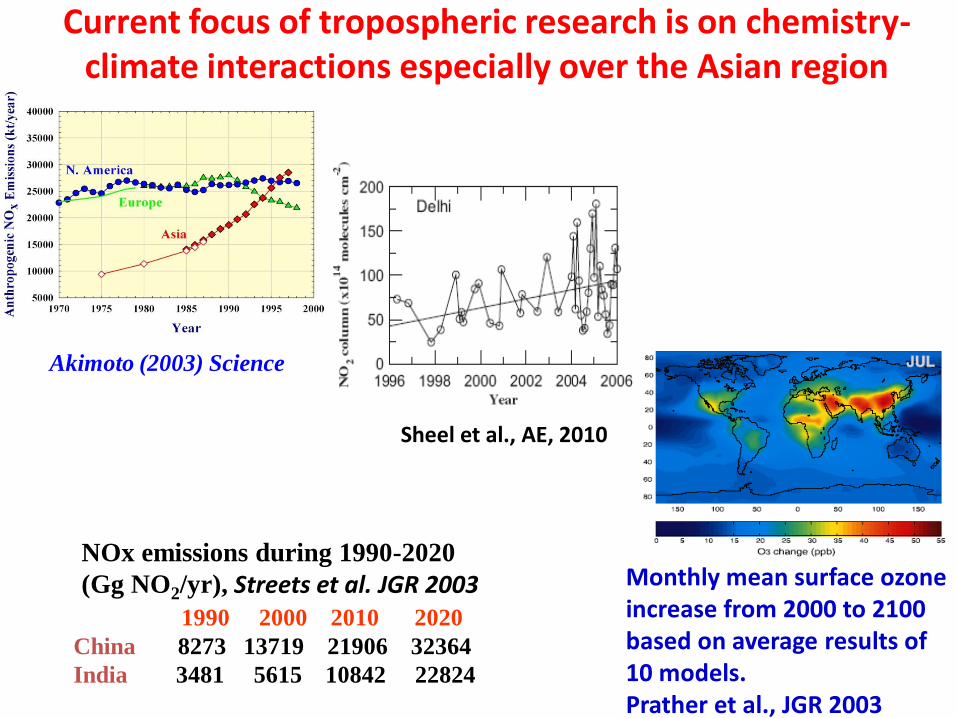
Current focus of tropospheric research is on chemistry-climate interactions especially over the Asian region
Monthly mean surface ozone increase from 2000 to 2100 based on average results of 10 models. Prather et al., JGR 2003
Akimoto (2003) Science
NOx emissions during 1990-2020
(Gg NO2/yr), Streets et al. JGR 2003
1990 2000 2010 2020
China 8273 13719 21906 32364
India 3481 5615 10842 22824
Sheel et al., AE, 2010
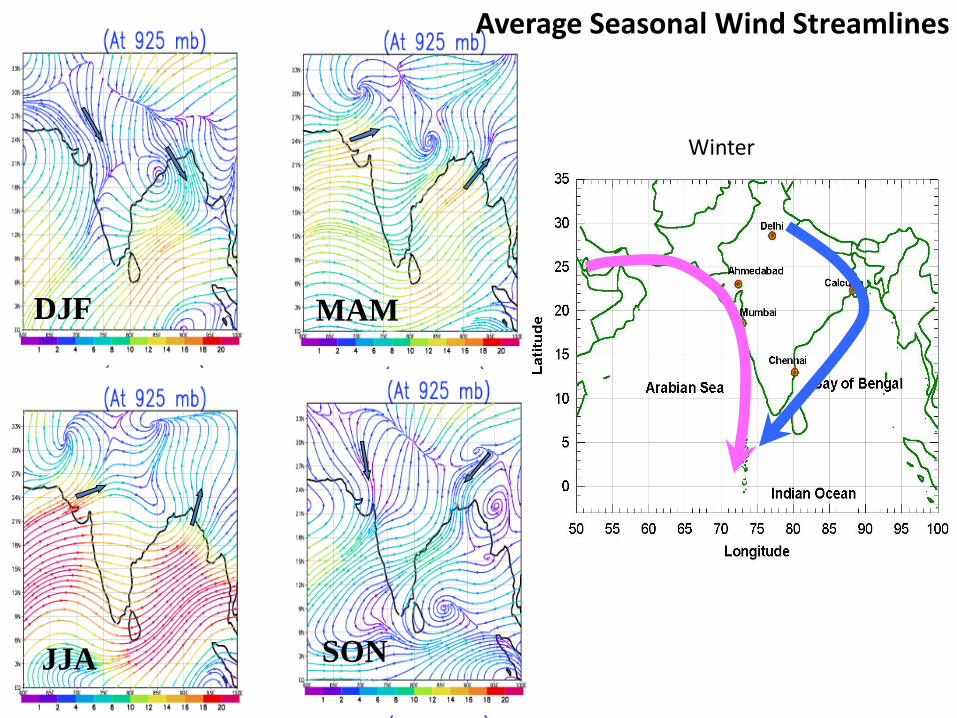
DJF MAM
JJA SON
Average Seasonal Wind Streamlines
Winter
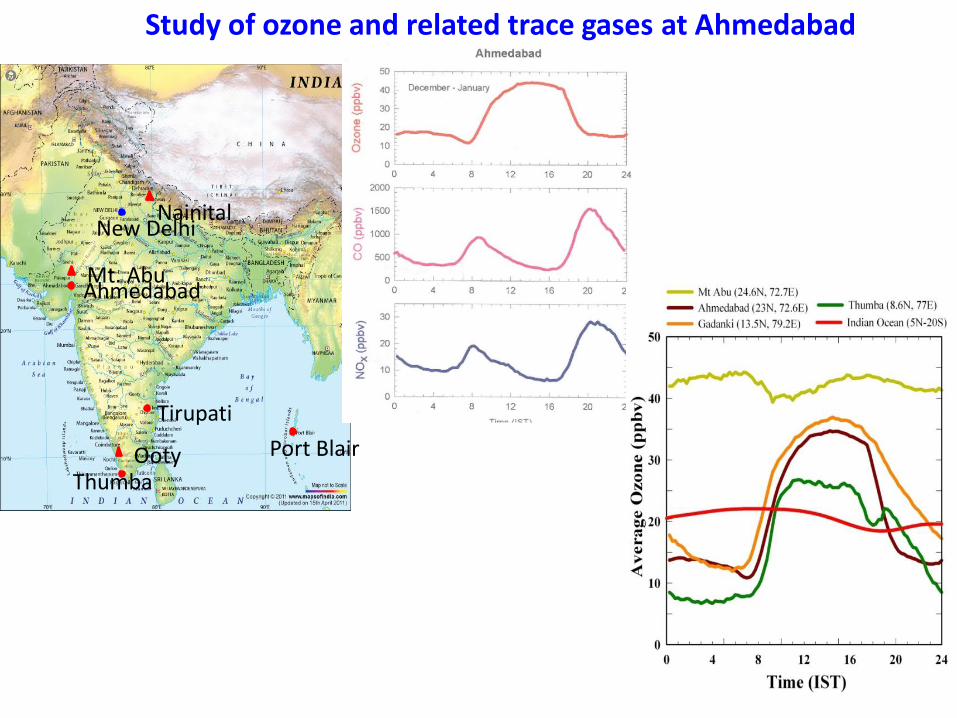
Surface ozone and related trace gases measurements at different sites in India
Time (IST)
Ahmedabad Mt. Abu
Nainital
Thumba
Port Blair
Tirupati
Ooty
New Delhi
Study of ozone and related trace gases at Ahmedabad
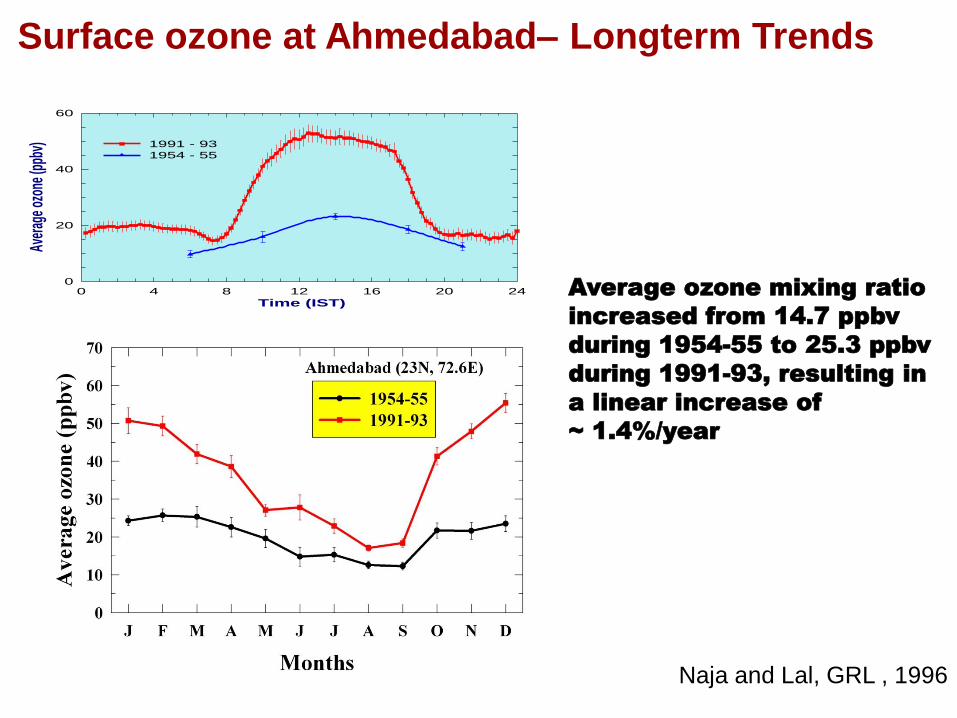
Surface ozone at Ahmedabad– Longterm Trends
Naja and Lal, GRL , 1996
Average ozone mixing ratio
increased from 14.7 ppbv
during 1954-55 to 25.3 ppbv
during 1991-93, resulting in
a linear increase of
~ 1.4%/year
1400 hrs
Time (IST)0 4 8 12 16 20 24
Aver
age
ozon
e (p
pbv)
0
20
40
60
1991 - 93
1954 - 55
1400 hrs
Month
0 1 2 3 4 5 6 7 8 9 10 11 12
Mon
thly
Ave
rage
ozo
ne (p
pbv)
0
20
40
60
1954 - 55
1991 - 93

Mt Abu Observatory in the early 1990’s
Diurnal variation of ozone at Mt. Abu (24.6N, 72.7E, 1680m amsl)
Mt Abu (1993-2000)
O
3 (
pp
bv
)
-4
-2
0
2
4
Time (LST)0 6 12 18 24
O
3 (
pp
bv
)
-4
-2
0
2
4
[a]
[b]
Winter (DJF)
Autumn (SON)
Mauna Loa
Spring (MAM)Summer (J_A)Mauna Loa
Autumn and Winter : Winds from north Spring and Summer : Winds from south-west and south
Naja et al., AE 2003

Regional and Local effects
Months
J F M A M J J A S O N D
Av
g O
zon
e (p
pb
v)
0
20
40
60
80
100
Day time avg (12-14 hrs) at Ahmedabad (1991-95)
Monthly avg at Mt Abu (1993-97)
Night time avg (01-03 hrs) at Ahmedabad (1991-95)Best fit line for day time avg (12-14 hrs) at Ahmedabad
~ 5-10 ppbv Local (Amd) Contribution
~ 12-15 ppbv Regional Contribution

Ozone at Mt. Abu (24.6N, 72.7E) and Nainital (29.4N,79.4E)
Kumar et al., JGR, 2010
Variations and levels of ozone and related trace gases are different over different parts of India suggesting diverse regional emission sources
Model derived contributions (in ppbv) for Nainital .
0
20
40
60
80
100
Av
era
ge O
zo
ne (
pp
bv
)
0
20
40
60
80
100
Nainital - 2007
Nainital - 2006
Nainital - 2008
Monhtly Average (Mt Abu)
Hourly Average (NTL - 2007)
Hourly Average (NTL - 2006)
Hourly Average (NTL - 2008)
Jan Feb Mar Apr May Jun Jul Aug Sep Oct Nov Dec0
5
10
15
20Startospheric Ozone
European Emissions
South Asia Emissions
Maximum ozone : Mt. Abu - Autumn/Winter Nainital - Spring/Summer
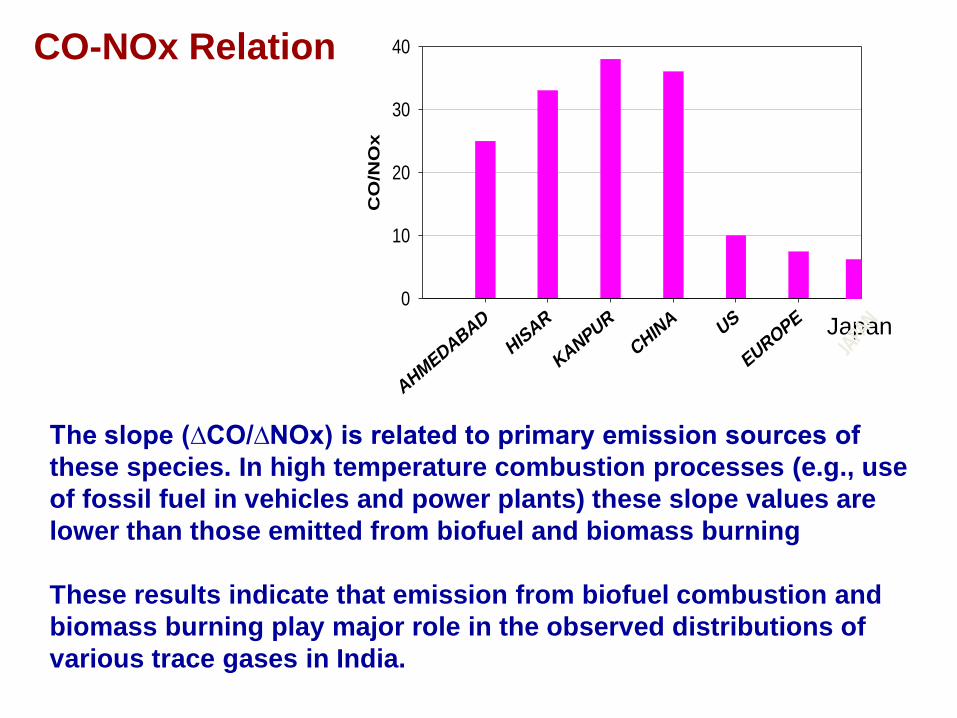
The slope (∆CO/∆NOx) is related to primary emission sources of
these species. In high temperature combustion processes (e.g., use
of fossil fuel in vehicles and power plants) these slope values are
lower than those emitted from biofuel and biomass burning
These results indicate that emission from biofuel combustion and
biomass burning play major role in the observed distributions of
various trace gases in India.
CO-NOx Relation
AHMEDABAD
HISAR
KANPUR
CHINA US
EUROPE
CO
/NO
x
0
10
20
30
40
Japan
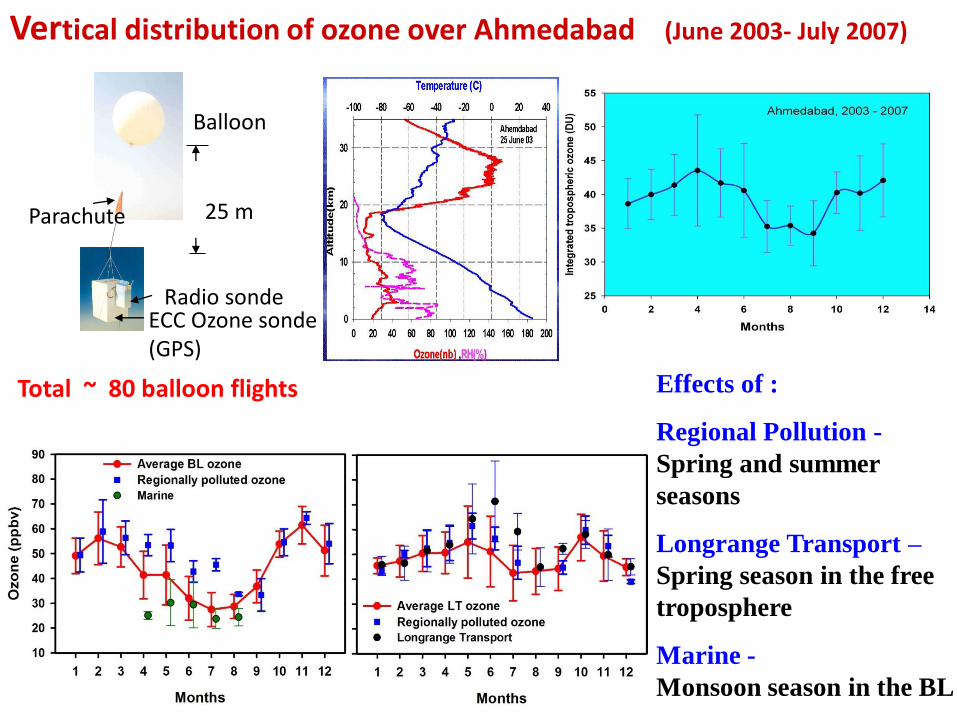
ECC Ozone sonde (GPS)
25 m
Balloon
Radio sonde
Parachute
Vertical distribution of ozone over Ahmedabad (June 2003- July 2007)
Total ~ 80 balloon flights Effects of :
Regional Pollution -
Spring and summer
seasons
Longrange Transport –
Spring season in the free
troposphere
Marine -
Monsoon season in the BL

Longitude (oE)
55 60 65 70 75 80 85 90 95
La
titu
de
(oN
)
0
5
10
15
20
25
30
19 M
20 M
24 M
26 M28 M
22 M
30 M1 A2 A
4 A
6 A
8 A10 A
12 A19 A21 A
23 A 25 A
27 A
28 A
29 A
30 A
3 My
4 My 5 May
7 My
9 My
Trivandrum
Goa
Chennai
Bhubneswer
Kochi
INDIA
Bay of Bengal
Arabian Sea
Study of ozone and meteorological parameters over Bay of Bengal (BoB) and Arabian Sea (AS)
Integrated Campaign for Aerosols, gases and Radiation Budget (ICARB)
Bay of Bengal (18 March to 13 April,06)
Arabian Sea (18 April to 11 May,06)
29 Ozone and radio sondes

Intrusion of land plume over North Bay of Bengal (N-BoB) and North Arabian Sea (N-AS)- ICARB 2006
Transport of ozone rich layer (60-90 ppbv)
over N-BoB attributed to advection of air
from Indo-Gangetic Plain.
Potential Source Contribution
Function (PSCF) analysis
NAS – SAS
N-BoB S-BoB
N-AS S-AS
NBoB - SBoB
Srivastava et al., JGR (in press)
Nainital
Kanpur Agra
Shillong
Kolkata
Nagpur Bhubneshwar
Vishakhapatnam
Hyderabad
Gadanki
Thumba
Ahmedabad
Mt. Abu
Port Blair
Thalassery Ooty
Anantpur
Kullu
Mt Abu Observatory in the early 1990’s
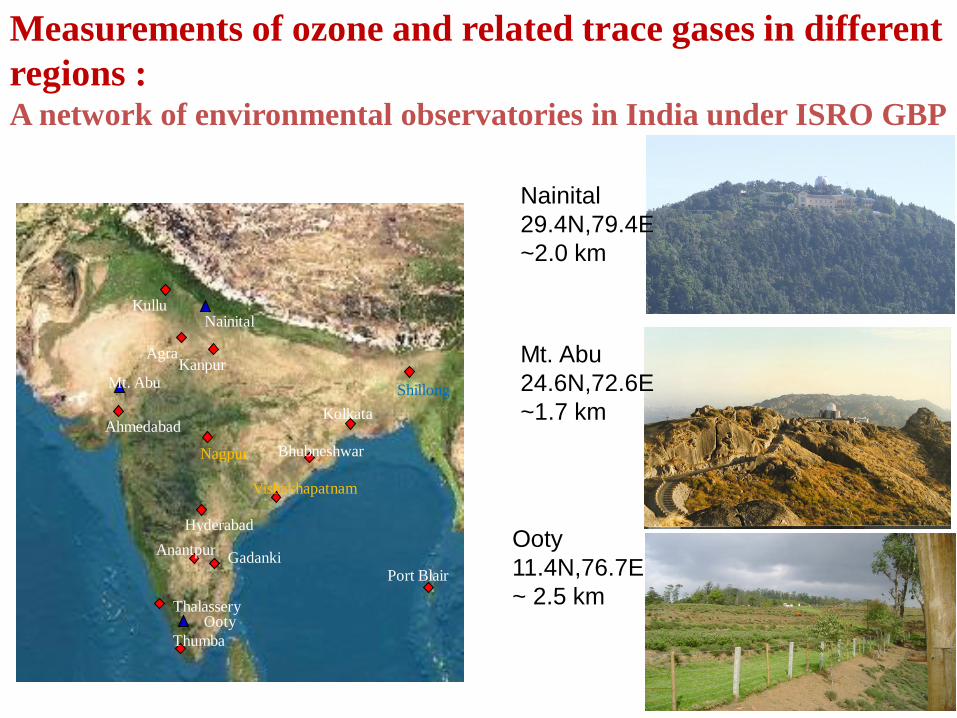
Measurements of ozone and related trace gases in different
regions : A network of environmental observatories in India under ISRO GBP
Mt. Abu
24.6N,72.6E
~1.7 km
Nainital
29.4N,79.4E
~2.0 km
Ooty
11.4N,76.7E
~ 2.5 km
Summary :
• Tropical Asian region - a natural photochemical laboratory.
• Chemical changes are occurring due to rapid industrialization and economic growth.
• Emission characteristics and transport pathways differ from region to region and from season to season.
• Surrounding marine regions affected by transport for the continental polluted air.
• There is a need for understanding types of emission sources, their budgets and chemical and transport processes for predicting future changes in this region.

Thanks for your attention