valuation of ipos using a stochastic frontier approach: a ...efmaefm.org/0efmameetings/efma annual...
TRANSCRIPT
1
Valuation of IPOs Using a Stochastic Frontier
Approach: A Revisit
Yuqin Wang Institute of Advanced Research
Shanghai University of Finance and Economics and
Key Laboratory of Mathematical Economics (SUFE) Ministry of Education
Shanghai, China 200433 Phone: (86)156-1871-0416
Email: [email protected]
Subhash C. Sharma Department of Economics
Southern Illinois University Carbondale, IL 62901 Phone: 618-453-5082
Email: [email protected]
Andrew C. Szakmary Department of Finance
Robins School of Business University of Richmond Richmond, VA 23173 Phone: 804-289-8251
Email: [email protected]
An earlier version of this paper was presented at the 2014 Deakin University 1st Conference on Recent Developments in Financial Econometrics and Applications. We thank conference participants for their useful comments and suggestions. Jay Ritter and Don Patton generously provided data for this paper.
2
Valuation of IPOs Using a Stochastic Frontier Approach: A Revisit
Abstract
We examine the determinants of market value and underpricing for 1221 IPOs using a stochastic
frontier model applied to the previously unexamined 1999-2010 period. We find that the book
value of assets, the percentage of shares retained by the original owners of the firm, the commission
rate and the reputational rankings of the underwriters are the most important determinants of firm
value and underpricing. We estimate that the mean ex-ante underpricing is 39.7% which, while
seemingly high, is consistent with unusually large first day returns in our sample period and our
focus on emerging growth IPOs. However, we do not find a positive relation between our model-
based measure of ex-ante underpricing and first day aftermarket returns at the firm level.
JEL Classifications: G24, G32, C49
Keywords: IPO Underpricing; Market Value; Stochastic Frontier Model
3
Valuation of IPOs Using A Stochastic Frontier Approach: A Revisit
1. Introduction
There is a voluminous literature studying the initial underpricing and subsequent
performance of initial public offerings (IPOs). Issues related to this phenomenon that have
received particular attention include the valuation of IPOs and how various factors affect the
price performance of IPOs. The reasons IPOs have received extensive examination are
straightforward. First, firms that want to finance through the stock market need guidance in
setting a reasonable price for their IPO. Second, investors (including both individual and
institutional investors) must make purchase decisions based on the available information with
respect to the issuing firms and/or the whole market. Finally, analysts need theoretical support to
write recommendation reports.
Numerous empirical regularities have been documented relative to IPOs. Virtually all
comprehensive studies, beginning with Ibbotson (1975), have shown that IPOs appear
underpriced in the sense that they experience large run-ups in price on average on the first day or
first month of trading. Lowry, Officer and Schwert (2010) and others have shown that the
variance of the first-month price run-up in the cross section of IPOs is extremely large. Both the
volume and the underpricing of IPOs have been shown to vary over time (see, for example,
Ibbotson and Jaffe 1975, Ibbotson, Sindelar and Ritter 1988), and the magnitude of the first
public trading day price run-up is positively related to pre-issue price increases as measured by
the difference between the final offering price and the midpoint of the anticipated issue price
range in the preliminary prospectus filed with the Securities and Exchange Commission (Hanley
1993, Loughran and Ritter 2002, Lowry and Schwert 2004). Finally, numerous studies show that
the long-run performance of IPOs is unappealing in general and is inversely related to the short
4
run price run-up or to various measures of fair value, particularly during “hot market” periods;
see for example Ritter (1991), Ritter and Welch (2002), Purnanandam and Swaminathan (2004).
Many different explanations of the observed IPO empirical regularities have been proposed
in the literature. As Hunt-McCool, Koh and Francis (1996) discuss, the key question as it pertains
to our study is whether the observed short-run price run-up is due to deliberate underpricing of
IPOs. One possible reason for deliberate underpricing is that it indirectly compensates the
underwriter for the large risks associated with a fixed-price offering when the issuing firm is
inherently difficult to value (see, for example, Rock 1986, Benveniste and Spindt 1989, Lowry,
Officer and Schwert 2010). Other explanations focusing on deliberate underpricing include lack
of concern about underpricing by issuing firms due to prospect theory (Loughran and Ritter 2002),
due to selling only a small part of the firm at the IPO (Habib and Ljungqvist 2001) or due to
deficiencies in corporate governance and/or managerial compensation structure in the issuing firm
(Chahine and Goergen 2013, 2014). However, alternate explanations of the first-day price run-up
that focus on behavioral issues and do not involve deliberate underpricing have received increasing
attention in the literature. Aggarwal and Rivoli (1990) and Shiller (1990) argue that the first day
price run-up may be caused by fads or speculative bubbles in the IPO market. Ritter (1991), who
documents that IPOs consistently underperform the market in the long run, notes that it may be
that the first aftermarket price is too high rather than the issuing price being too low. More recent
studies that provide evidence consistent with this conjecture include Cornelli, Goldreich and
Ljungqvist (2006) who note that in the European data high grey market prices (which proxy for
over optimism by small, retail investors) can explain both the initial price run-up and the long-
term underperformance, and Da, Engleberg and Gao (2011), who show that a high Google Search
5
Volume Index specific to an issuing firm (a proxy for small investor attention) strongly contributes
to short-term price run-ups and long-term underperformance in the firm’s IPO.
As noted above, the short-term aftermarket performance of an IPO is not necessarily a
correct measure of (deliberate) underpricing. In order to properly examine underpricing one needs
to compare the offering prices with the intrinsic values of the shares of the issuing firms. Kim and
Ritter (1999) summarize that there are three valuation methods that could be used: the discounted
cash flow approach, the asset-based approach, and the comparable firms approach. The discounted
cash flow approach is the best way to determine the value of a firm since it fully considers the
firm’s earning potential and growth opportunities; however, it is hard to estimate the future cash
flows, determine an appropriate discount rate and value growth options in practice. The asset-
based approach proxies a firm’s value by estimating the underlying value of the issuing firm’s
assets. However, this approach is not applicable in most IPOs unless there is a significant
proportion of the assets which can be liquidated quickly at well-determined market prices.
Consequently, the comparable firms approach, which is usually implemented by capitalizing the
earnings per share of the issuing firm at the average price-to-earnings (P/E) ratio of publicly-traded
comparable firms, is the most widely used since accounting information for these firms is generally
available. However, Kim and Ritter (1999) show that the comparable firms approach can result in
large valuation errors because P/E and other ratios relating accounting numbers and market-
determined prices often display great variation among firms in the same industry. Thus, we note
that while each of these possible methods for determining the intrinsic values of IPOs has positive
features, their limitations are substantial. In addition, these methods share a point in common: all
of them usually employ aftermarket information in some fashion to evaluate the IPOs. As
demonstrated by our previous discussion regarding the use of stock return data for the issuing firm,
6
it is difficult to determine if the underpricing of new issues is deliberate or if the underpricing is
due to aftermarket characteristics such as fads or underwriter price support. Thus, in this study, we
employ an alternative method, the stochastic frontier approach, to evaluate IPOs by using
information only from the premarket period.1
Hunt-McCool et al. (1996) and Koop and Li (2001) also employ the stochastic frontier
model to evaluate IPOs and examine the underpricing in IPOs. In particular, one of the most
significant advantages of this model is that the estimation and measurement can be conducted with
premarket information alone. Hunt-McCool et al. (1996) mix the pricing factors from firm specific
characteristics and the factors resulting in underpricing to estimate firms’ frontiers and compute
the gap between real value and the frontier. They conclude that most abnormalities in aftermarket
returns cannot be explained by the factors leading to premarket underpricing. The underpricing in
IPOs is sensitive to issuing period (hot and non-hot periods). However, with the mixture of the
firm-specific pricing factors and underpricing factors, it is hard to figure out the exact relationship
between deliberate underpricing and underpricing factors. To avoid this shortcoming, Koop and
Li (2001) categorize firm-specific pricing factors and underpricing factors in order to estimate the
magnitude of underpricing in IPOs and determine how underpricing factors associate with
underpricing simultaneously. But the data they employ contain both IPO and Seasoned Equity
Offering (SEO) firms. The reason they mix IPO and SEO data is that they believe SEO firms are
expected to be efficiently priced such that they can be used as a more relevant benchmark.
However, they do not provide evidence to support that SEO firms are evaluated without bias, and
there is no theoretical justification for comparing IPO firms and SEO firms directly given that
1 Following Hunt-McCool et al (1996), we do examine the firm-level relations between underpricing measured using the frontier approach and subsequent first day aftermarket returns, but the underpricing estimates themselves are estimated solely using pre-market data.
7
IPOs are much more difficult to value and therefore pose much greater risks for underwriters.
Hence, we will only employ IPO firms in this study and extend the sample period to recent years.
In addition to possible defects in their data, another weakness of the model employed by Koop and
Li (2001) is the narrow focus on asymmetric information as the underlying reason for the
underpricing of IPOs, while ignoring non-rational and agency conflict explanations which have
played major roles in more recent studies (see, for example, Ritter and Welch, 2002, Loughran and
Ritter, 2004, Filatotchev and Bishop, 2002, Lee and Wahal, 2004, Cornelli at al. 2006, Da et al.
2011, Chahine and Goergen 2013, 2014).
Following Koop and Li (2001) we use the market value (MV) of a firm as the dependent
variable and develop a stochastic market value frontier (similar to the stochastic production frontier)
of a firm. This stochastic market value frontier defines the maximum market value attainable by
a firm for a given set of observable firm characteristics. However, at the time of initial public
offering (IPO) the actual market capitalization is below its market value frontier. This shortfall in
the actual market value of a firm from its maximum possible attainable value is due to the
underpricing of the IPO. In our market value frontier, the conditional mean of the inefficiency
term could be viewed as the average loss in market value of a firm. Following Jondrow et al.
(1982), we compute the conditional mean of the one-side error term of the stochastic frontier model
as the point estimate of the firm-specific underpricing. Thus, the magnitude of underpricing can
be explicitly computed using only firm-specific premarket characteristics instead of aftermarket
information and/or comparable information. Next, the determinants of underpricing are also
investigated here as is done in Koop and Li (2001), and we add an additional variable (venture
capital involvement) that was not considered in their model. Finally, unlike Koop and Li (2001),
8
we investigate the relations between firm level underpricing estimated by our model and the
subsequent first day aftermarket returns.
This study estimates the magnitudes of the underpricing of IPOs of 1,221 firms during the
period 1999-2010. To our knowledge, this sample period lies entirely outside those used in
previous studies that have employed any variation of the stochastic frontier approach in the context
of examining IPOs: the sample period in Hunt-McCool et al (1996) was 1975-1984, and Koop and
Li’s (2001) sample ran from 1985-1998. Moreover, as explained in greater detail below, the IPO
database we use in this study contains only de-novo (i.e. brand new) firms going public for the
first time; it excludes spinoffs from, and reorganizations of, established publicly-traded firms. In
this respect our sample may significantly differ from those used in previous studies.
The rest of the paper is organized as follows. The methodology is explained in detail in
section 2. Sections 3 and 4 are devoted to the specific model and the data. Our findings are
presented in section 5 and section 6 concludes the study.
2. Methodology
Similar to a production frontier, the market value frontier describes the relationship
between firm characteristics and the maximum attainable market value. The word “frontier,”
emphasizes the idea of maximality. Let be the market value of a firm, the offer price of the
IPO and the total number of outstanding shares after the offering; then . Since
is fixed at the time of offering, MV depends on . If the IPO is underpriced, will not attain
its frontier and will fall short of its maximum. Let ∗ be the maximum attainable market value of
the ith firm at the time of IPO if all characteristics of the firm are accurately and/or efficiently
accounted for in the offer price. The maximum market value, ∗ is defined as the predicted market
value frontier and is expressed as
9
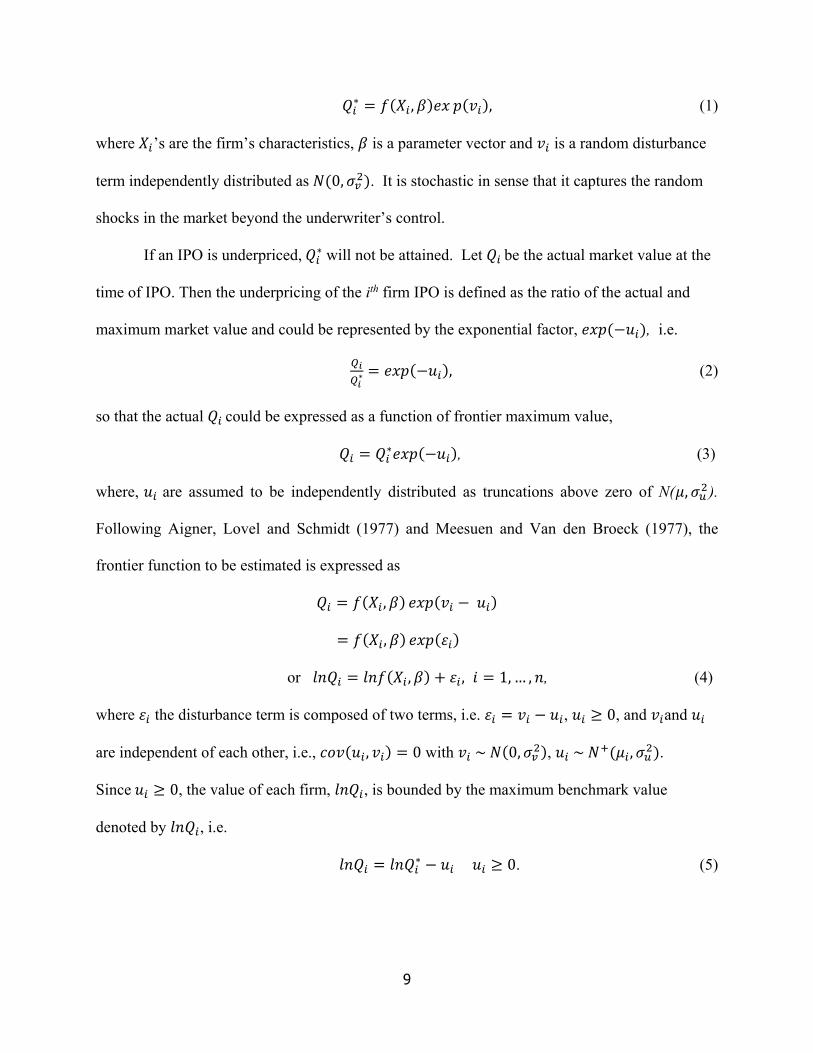
∗ , , (1)
where ’s are the firm’s characteristics, is a parameter vector and is a random disturbance
term independently distributed as 0, . It is stochastic in sense that it captures the random
shocks in the market beyond the underwriter’s control.
If an IPO is underpriced, ∗will not be attained. Let be the actual market value at the
time of IPO. Then the underpricing of the ith firm IPO is defined as the ratio of the actual and
maximum market value and could be represented by the exponential factor, , i.e.
∗ , (2)
so that the actual could be expressed as a function of frontier maximum value,
∗ , (3)
where, are assumed to be independently distributed as truncations above zero of N( , ).
Following Aigner, Lovel and Schmidt (1977) and Meesuen and Van den Broeck (1977), the
frontier function to be estimated is expressed as
,
,
or , , 1, … , , (4)
where the disturbance term is composed of two terms, i.e. , 0, and and
are independent of each other, i.e., , 0 with ~ 0, , ~ , .
Since 0, the value of each firm, , is bounded by the maximum benchmark value
denoted by , i.e.
∗ 0. (5)
10
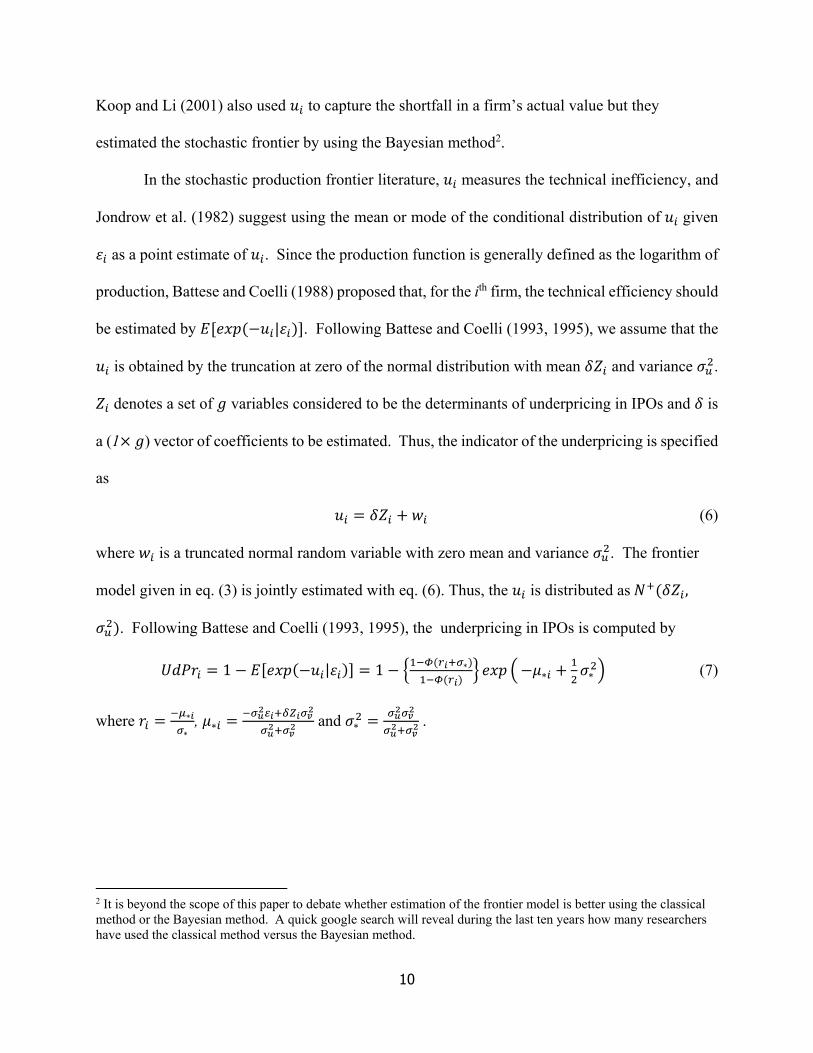
Koop and Li (2001) also used to capture the shortfall in a firm’s actual value but they
estimated the stochastic frontier by using the Bayesian method2.
In the stochastic production frontier literature, measures the technical inefficiency, and
Jondrow et al. (1982) suggest using the mean or mode of the conditional distribution of given
as a point estimate of . Since the production function is generally defined as the logarithm of
production, Battese and Coelli (1988) proposed that, for the ith firm, the technical efficiency should
be estimated by | . Following Battese and Coelli (1993, 1995), we assume that the
is obtained by the truncation at zero of the normal distribution with mean and variance .
denotes a set of variables considered to be the determinants of underpricing in IPOs and is
a (1 ) vector of coefficients to be estimated. Thus, the indicator of the underpricing is specified
as
(6)
where is a truncated normal random variable with zero mean and variance . The frontier
model given in eq. (3) is jointly estimated with eq. (6). Thus, the is distributed as ,
. Following Battese and Coelli (1993, 1995), the underpricing in IPOs is computed by
1 | 1 ∗ ∗ ∗ (7)
where ∗
∗, ∗ and ∗ .
2 It is beyond the scope of this paper to debate whether estimation of the frontier model is better using the classical method or the Bayesian method. A quick google search will reveal during the last ten years how many researchers have used the classical method versus the Bayesian method.
11
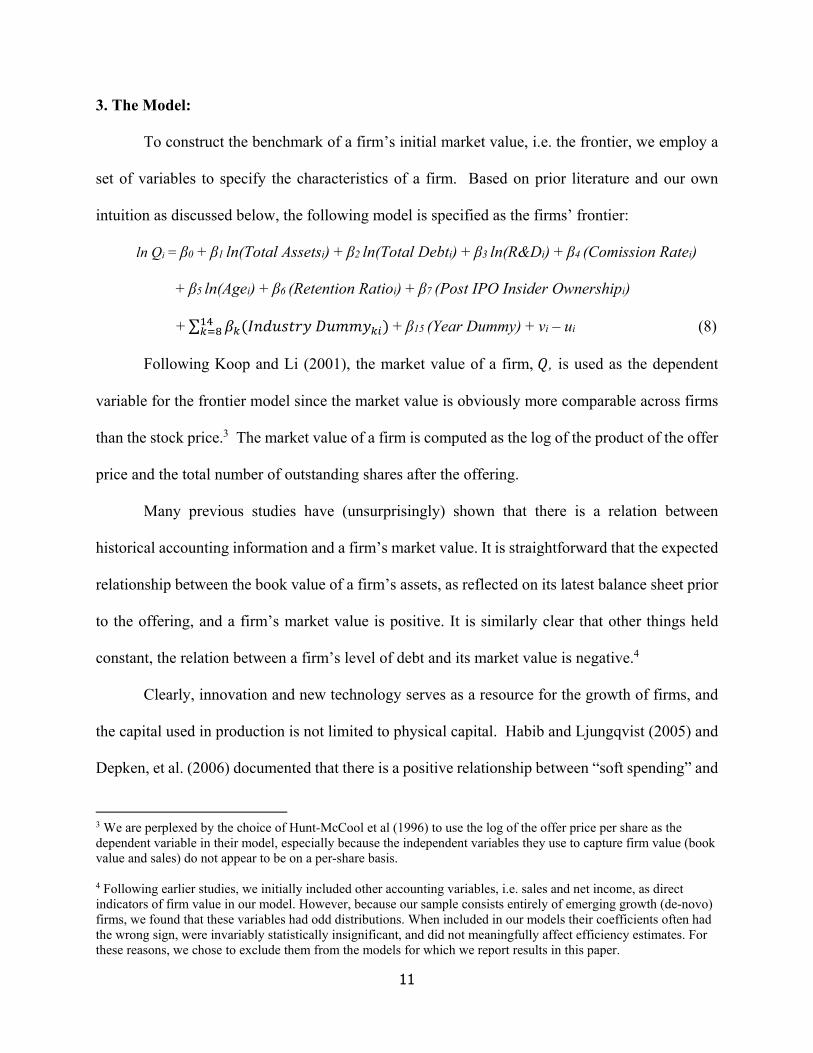
3. The Model:
To construct the benchmark of a firm’s initial market value, i.e. the frontier, we employ a
set of variables to specify the characteristics of a firm. Based on prior literature and our own
intuition as discussed below, the following model is specified as the firms’ frontier:
ln Qi = β0 + β1 ln(Total Assetsi) + β2 ln(Total Debti) + β3 ln(R&Di) + β4 (Comission Ratei)
+ β5 ln(Agei) + β6 (Retention Ratioi) + β7 (Post IPO Insider Ownershipi)
+∑ + β15 (Year Dummy) + vi – ui (8)
Following Koop and Li (2001), the market value of a firm, , is used as the dependent
variable for the frontier model since the market value is obviously more comparable across firms
than the stock price.3 The market value of a firm is computed as the log of the product of the offer
price and the total number of outstanding shares after the offering.
Many previous studies have (unsurprisingly) shown that there is a relation between
historical accounting information and a firm’s market value. It is straightforward that the expected
relationship between the book value of a firm’s assets, as reflected on its latest balance sheet prior
to the offering, and a firm’s market value is positive. It is similarly clear that other things held
constant, the relation between a firm’s level of debt and its market value is negative.4
Clearly, innovation and new technology serves as a resource for the growth of firms, and
the capital used in production is not limited to physical capital. Habib and Ljungqvist (2005) and
Depken, et al. (2006) documented that there is a positive relationship between “soft spending” and
3 We are perplexed by the choice of Hunt-McCool et al (1996) to use the log of the offer price per share as the dependent variable in their model, especially because the independent variables they use to capture firm value (book value and sales) do not appear to be on a per-share basis. 4 Following earlier studies, we initially included other accounting variables, i.e. sales and net income, as direct indicators of firm value in our model. However, because our sample consists entirely of emerging growth (de-novo) firms, we found that these variables had odd distributions. When included in our models their coefficients often had the wrong sign, were invariably statistically insignificant, and did not meaningfully affect efficiency estimates. For these reasons, we chose to exclude them from the models for which we report results in this paper.

12
firm value. In this study, “soft spending” is measured by the log of R&D (research and
development expenses) in the fiscal year prior to the offering, and we expect “soft spending” to be
positively related with firm value.
Valuation risk associated with an offering should, logically, negatively affect the offering
price for an IPO and, by extension, the market value based on the offering price. Similar to Hunt-
McCool et al (1996), we hypothesize that one indicator of valuation risk is the commission rate
paid by the issuing firm to the underwriter(s). Hughes (1986) argues that underwriter compensation
is related to the costs of investigating firm characteristics, implying that the commission rate will
be higher for firms about which there is less public information that are, in turn, more difficult to
value. Thus we expect a negative relation between commission rate and firm value.
The retention ratio in our model represents the percentage of the total shares in the company
that will collectively be retained by the previous owners of the firm, i.e. it is formally defined as
(1 – shares offered in IPO / total number of outstanding shares after the offering). Following Hunt-
McCool et al (1996), we hypothesize that the retention ratio proxies for insider information
possessed by owners of the privately-held firm: that previous owners with positive information
will retain a larger percentage of the shares than those with negative information. Thus we expect
a positive relation between the retention ratio and firm value.
Hunt-McCool et al (1996) used firm age in their model, and found it to have a weak positive
relation with the offer price. Because this data is easy for us to obtain, we also include it in our
model. However, we are not certain, a-priori, what the directional relation should be theoretically
between firm age and total market value. On the one hand, an older firm that has survived for a
long time might be less risky and easier to value, implying a positive relationship with firm value.
Another interpretation, though, could be that a firm that has existed for a long time without going
13
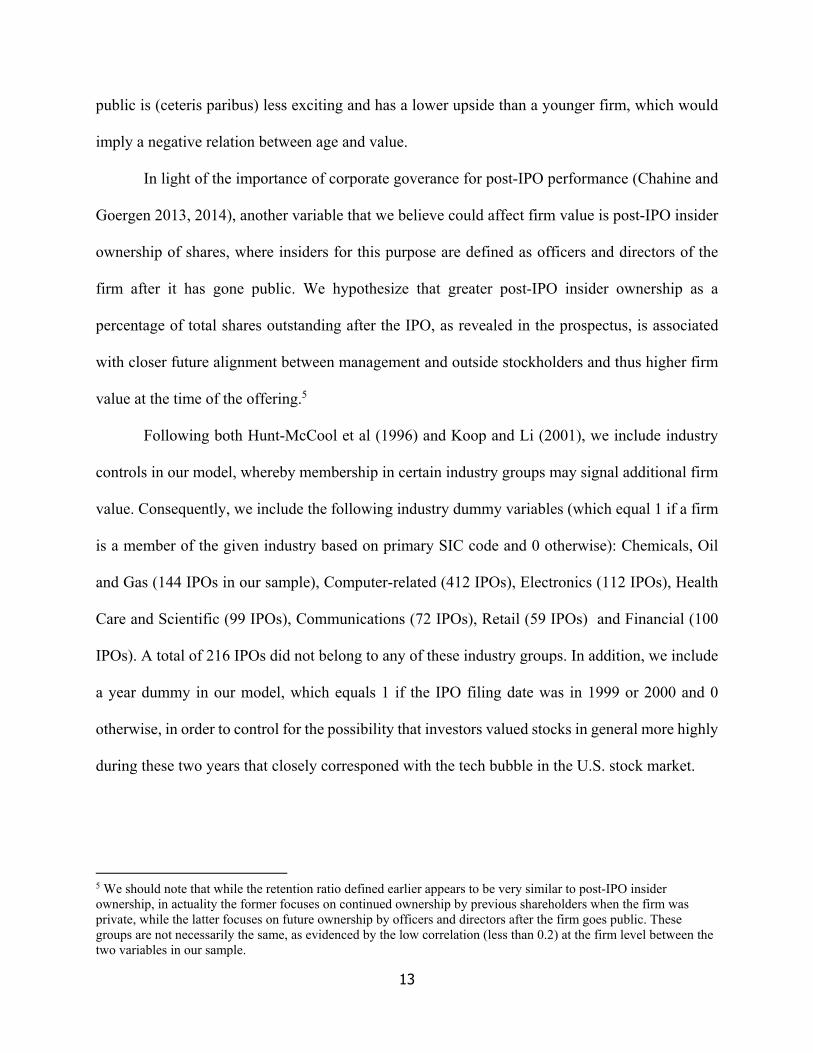
public is (ceteris paribus) less exciting and has a lower upside than a younger firm, which would
imply a negative relation between age and value.
In light of the importance of corporate goverance for post-IPO performance (Chahine and
Goergen 2013, 2014), another variable that we believe could affect firm value is post-IPO insider
ownership of shares, where insiders for this purpose are defined as officers and directors of the
firm after it has gone public. We hypothesize that greater post-IPO insider ownership as a
percentage of total shares outstanding after the IPO, as revealed in the prospectus, is associated
with closer future alignment between management and outside stockholders and thus higher firm
value at the time of the offering.5
Following both Hunt-McCool et al (1996) and Koop and Li (2001), we include industry
controls in our model, whereby membership in certain industry groups may signal additional firm
value. Consequently, we include the following industry dummy variables (which equal 1 if a firm
is a member of the given industry based on primary SIC code and 0 otherwise): Chemicals, Oil
and Gas (144 IPOs in our sample), Computer-related (412 IPOs), Electronics (112 IPOs), Health
Care and Scientific (99 IPOs), Communications (72 IPOs), Retail (59 IPOs) and Financial (100
IPOs). A total of 216 IPOs did not belong to any of these industry groups. In addition, we include
a year dummy in our model, which equals 1 if the IPO filing date was in 1999 or 2000 and 0
otherwise, in order to control for the possibility that investors valued stocks in general more highly
during these two years that closely corresponed with the tech bubble in the U.S. stock market.
5 We should note that while the retention ratio defined earlier appears to be very similar to post-IPO insider ownership, in actuality the former focuses on continued ownership by previous shareholders when the firm was private, while the latter focuses on future ownership by officers and directors after the firm goes public. These groups are not necessarily the same, as evidenced by the low correlation (less than 0.2) at the firm level between the two variables in our sample.
14
By using the shortfall from the frontier, i.e., the difference between the market value of a
firm and its predicted optimal market value, the factors associated with the underpricing are
determined. Our model for investigating determinants of the underpricing of IPOs is:
(9)
The economic intuition and predicted signs of determinants are discussed next. In early
literature, researchers argue that mispricing is mainly due to the fundamental risk of issuing firms
(Ibbostson, 1975) and the problem of information asymmetry (Benveniste and Wilhelm, 1990,
Chemmaur, 1993, Welch, 1989 & 1992, and Habib and Ljungqvist, 2001), and predict that
underpricing is positively related to uncertainty due to the degree of firms’ fundamental risk and/or
asymmetric information. Both Carter and Manaster (1990) and Carter, Dark, and Singh (1998)
provide evidence that IPOs managed by more reputable underwriters are associated with less
underpricing. Since Carter and Manaster (1990) argue that the prestige of underwriters selected
by issuing firms can reveal their riskiness to the market, i.e., the higher the prestige of underwriters
they choose, the lower the probability they will fail, and the less likely they are to be undervalued
at the time of offering. In this study, the prestige of underwriters is represented by a ranking,
scaled from 0 to 9. In particular, Carter and Manaster (1990) and Carter et al. (1998) proposed the
particular methodology of ranking underwriters. Loughran and Ritter (2004) updated the rankings
for 1992-2003 using their methodology and Jay R. Ritter maintains an updated post-2003 database
of these rankings6.
As for the remaining underpricing variables, following Koop and Li (2001) we include
an NBER Up dummy variable which equals 1 if the issue date of the IPO is outside the range of
dates in which the U.S. economy is classified as being in a recession by the National Bureau of
6 http://bear.warrington.ufl.edu/ritter/ipodata.htm
15
Economic Research (NBER) and 0 if the issue date is during a recession. Chloe et al. (1993) argue
that adverse selection issues are mitigated when more promising conditions for new investment
exist; consequently we expect less underpricing when the economy is in an upswing and hence a
negative coefficient on the NBER Up dummy. As suggested by Ritter (1984), a HOT index is also
included to control for the hot market effect. Following Banerjee et al. (2011), the HOT index is
computed as the ratio of the number of IPOs in a specific year over the total number of IPOs during
the sample period. As argued by Ritter (1984), Ljungqvist et al. (2006) and Banerjee et al. (2011),
the expected sign of the HOT index is positive – that is, we expect greater underpricing in hot issue
periods. Finally, we include a Venture Capital dummy variable which equals 1 if our reading of
the prosepctus indicates any backing by a known venture capital firm and 0 otherwise. A-priori,
we expect venture capital investors to maximize their returns and hold out for a higher IPO offer
price; consequently we expect less underpricing with venture capital involvement and a negative
coefficient on the Venture Capital dummy.
4. Data
The primary IPO data over the 1999 to 2010 period is collected from the Firm Database of
Emerging Growth Initial Public Offerings (IPOs) from 1990 through 2010 which are provided by
Martin Kenney and Donald Patton, 2013. Emerging Growth in this database refers to the firms that
are newly established or not based on older firms by being a spinoff or subsidiary operation.
Particularly, the emerging growth status was established by checking the prospectus, particularly
in the prospectus summary where the firm describes its activities, history, and business. There are
1369 Emerging Growth IPOs in the US from 1999 to 2010. Besides general company information,
this dataset contains the basic issuing information for each IPO, such as shares offered, total shares
outstanding after the offering, initial offer price and underwriter discount, such that the initial
16
market value of issuing firms, the age of issuing firms and underwriters compensation and
commission rates can be computed accordingly. Other financial data of issuing firms, including
total assets, total long-term debt and R&D expenditure in the fiscal year prior to the IPOs, is
collected from the Compustat database. In addition, insider ownership before and after the offering
and underwriter names are manually collected from firms' prospectuses, which are found on the
SEC's EDGAR database. The rankings of underwriters are determined according to IPO
Underwriter Reputation Rankings (1980-2014) collected from Jay R. Ritter's database.
Similar to previous literature (e.g., Loughran and Ritter, 2004), the following criteria are
imposed to obtain the final sample. First, the initial offer price should exceed $5, which leads to
the exclusion of 2 firms from the database. Second, 5 firms are excluded since the underwriter
ranking is zero or unavailable. Third, because of missing insider ownership information, 12 firms
are excluded. Finally, accounting data should be available for the issuing firms in the year prior to
the offering. In particular, accounting information for 129 firms was wholly or partially
unavailable in the Compustat database. This lack of availability of either total assets, total debt or
R&D expense in the fiscal year prior to the IPO further reduces the number of IPO firms in our
study to 1221, around 10.8% attrition from the original sample size.
< INSERT TABLE 1 HERE >
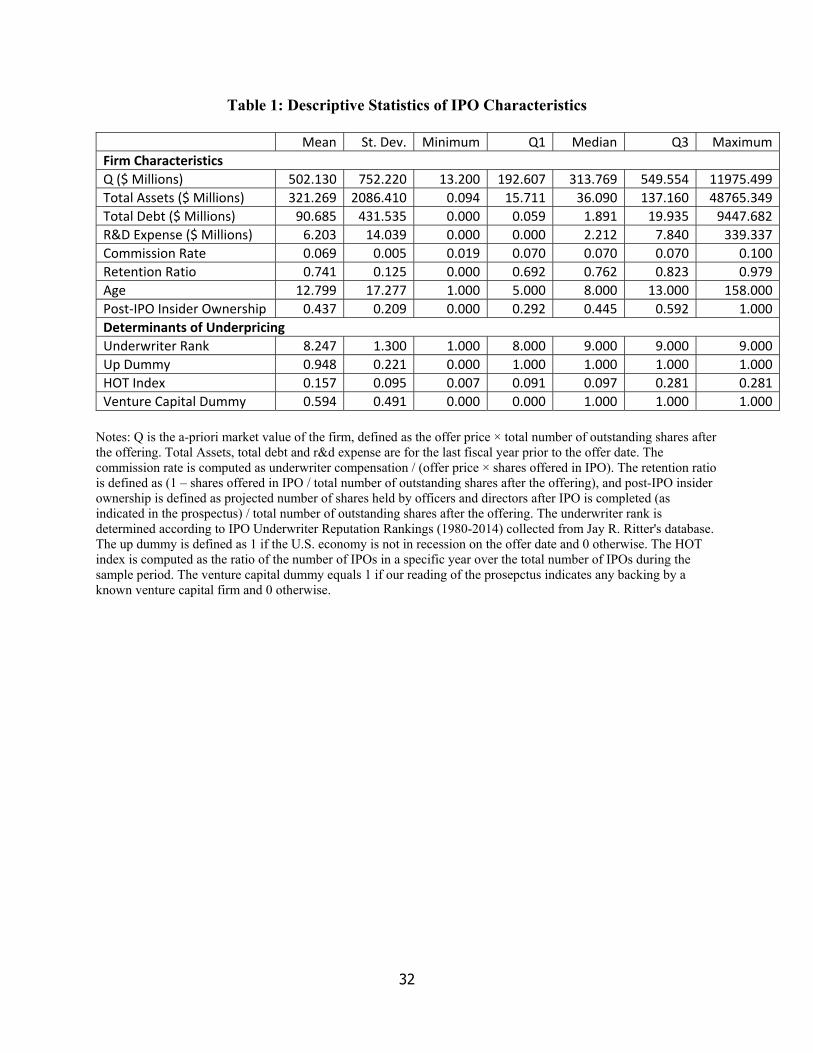
Table 1 contains the descriptive statistics of the variables used in estimation. In our model,
the dependent variable of the frontier model is the total market value of firms’ common equity, ,
which is computed as the product of the initial offer price and a firm’s total outstanding shares
after the offering. As shown in Table 1, the market value of firms’ common equity is right-
skewed, and the mean and median are $502 million and $314 million respectively. Similar to ,
firms’ other characteristics are also right-skewed. In particular, the median and 3rd quartile of
17
firms’ total assets in the fiscal year prior to offering are, $36 million and $137 million, respectively,
whereas the mean is $321 million. Clearly, the mean is driven by the largest firms.
Our proxy of “soft expenditure”, research and development expense (R&D Expense) has a
mean of around $6 million in the fiscal year prior to the offering, but nearly half of the sample
firms have no expenditure on R&D. Total debt in the fiscal year prior to the initial public offering
for the sample firms ranges from $0 million to $9,448 million. In particular, the mean and median
of the total debt are $91 million and $2 million respectively. To a lesser extent, firm age is also
right-skewed, with a mean and median of 12.8 years and 8 years, respectively. However, the
remaining firm characteristic variables, i.e. the commission rate, retention ratio and post-IPO
insider ownership, exhibit little evidence of skewness given that the means and medians of these
variables are all close to each other.
The lower part of Table 1 reports the descriptive statistics of the determinants of the
underpricing in IPOs. Specifically, underwriters’ reputation is represented by a ranking which is
on a 1 to 9 scale. In this study, if some sample firms have multiple underwriters or lead
underwriters, their rank is determined by the rank of the book-runner or the highest-ranking joint
book-runner. Accordingly, an average firm has an underwriter ranking of 8.25, i.e. a typical firm
employs at least one underwriter ranking 8 or 9 at the offering. The mean of the Up Dummy
indicates that 94.8% of IPOs took place when the U.S. economy was not in recession according to
the NBER. Similarly, the mean for the Venture Capital Dummy indicates that 59.4% of the IPOs
in our sample had some venture capital backing. Finally and not unexpectedly (given how the Hot
Index is constructed), the descriptive statistics for this variable are consistent with the notion that
a disproportionate number of IPOs in our sample occur in years in which the Hot Index is high.
Further information on this relation is provided in Table 4.
18
5. Empirical Analysis
The frontier model specified in equations (8) and (9) is estimated by using the FRONTIER
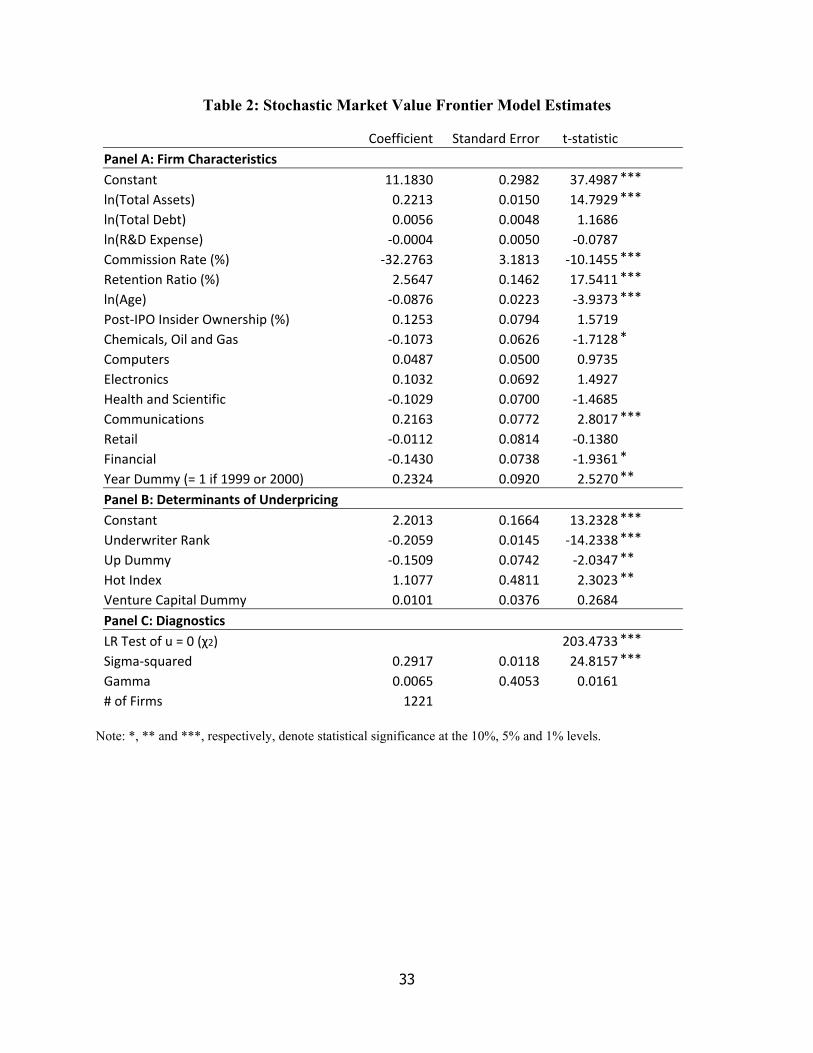
Version 4.1 software7. Table 2 reports the estimates for the whole sample consisting of 1,221 IPOs
ranging from 1999 to 2010. Specifically, Panel A presents the estimates for the market value
frontier given in equation (8); Panel B presents the estimates of coefficients corresponding to the
determinants of underpricing given in equation (9) and Panel C presents diagnostic statistics for
the model. In Panel C, the likelihood ratio statistic rejects the null hypothesis that 08, i.e.,
the one-sided error term is statistically different from zero. Hence, there exists underpricing in our
sample firms during 1999-2010.
< INSERT TABLE 2 HERE >
From Panel A, we note that the coefficient estimate for the log of total assets is positive
and highly significant, which is consistent with our expectation that a firm’s market value is
positively related to the book value of its assets. However, contrary to our expectations neither the
log of total debt, nor the log of R&D expense is found to be significantly related to market value
in our model. In accordance with expectations, there is a strong and highly statistically significant
inverse relation between the commission rate paid to the underwiter(s) and market value. Because
the commission rate may proxy for valuation risk, this finding is consistent with the idea that firms
with greater valuation risk have lower offering prices, other things equal.
7 The software was downloaded from Center for Efficiency and Productivity Analysis, i.e. http://www.uq.edu.au/economics/cepa/software.php.
8 In this case, the LR test statistic has a mixed chi-square distribution with the number of degrees of freedom equal to the number of restrictions on the parameters used in the estimation of underpricing determinants. Hence, for the sample in this study, the number of degrees of freedom of the LR test is 6, since the restrictions are u= = =…= 0.
19
Another variable that is found to strongly impact the market value of the firm is the
retention ratio, essentially defined as the proportion of shares kept by the original owners of the
firm immediately after the firm goes public. Indeed, based on the t-statistic, this is the single most
important firm charactersitic in the entire model and indicates that the signal sent by former
shareholders that they are willing to retain a larger proportion of the shares after the firm goes
public exerts a strong positive influence on the offer price (and by extension, the market value
based on the offer price). In contrast, the proportion of the shares (post-IPO) that will be held by
officers and directors, based on information revealed in the prospectus, while as expected
positively associated with market value, is not quite statistically significant. Panel A in Table 2
also reveals a negative association between firm age and market value, indicating that the longer
the time that has elapsed between a firm’s founding and its going public, the lower its market
value. The only interpretation we can offer is that the negative signal offered by advanced age (the
firm is unexciting and has less upside potential) outweighs the positive signal (the firm is stable
and has lower risk). The coefficients on the industry dummies in Panel A indicate that membership
in the communications industry was associated with significantly higher market value during our
sample period, while financial firms and those in the chemical industry or the oil and gas industry
had lower market values, ceteris paribus. Finally, the positive and significant coefficient on the
year dummy indicates that investors were willing to pay higher prices for IPOs during the latter
stages of the tech bubble that characterizes the first two years of our sample.
Panel B of Table 2 reveals that, as expected, the coefficient on underwriter rank is negative
and highly significant, showing that higher underwriter reputation results in less underpricing in
IPOs. Similarly in accordance with expectations, the negative coefficient on the Up Dummy
indicates that IPOs that occur when the U.S. economy is not in recession are associated with less
20
underpricing. However, contrary to expectations, the positive and significant coefficient on the
Hot Index indicates that underpricing appears to actually be greater (ceteris paribus) in hot new
issue markets, and we find no statistically significant relation between venture capital backing and
underpricing.
To shed further light on whether coefficient estimates are stable over time, we next divide
our sample of 1,221 IPOs into three subsamples based on offer date, and estimate separate market
value frontier models for each of the subsamples. The three subsamples we chose are the tech
bubble period of 1999-2000, the post-tech bubble, pre-financial crisis period (January 2001 to June
2008) and the financial crisis period and its immediate aftermath (July 2008 to December 2010).
< INSERT TABLE 3 HERE >
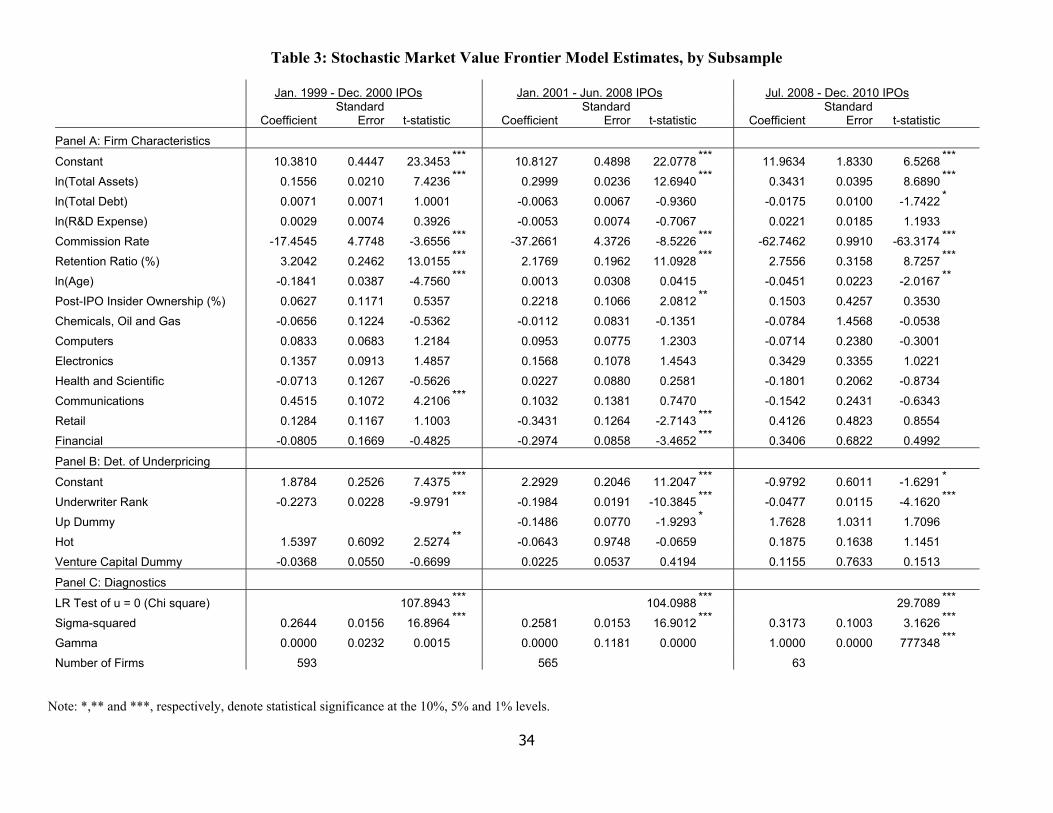
The subperiod model results are reported in Table 3. As in Table 2, coefficient estimates
on firm characteristics are reported in panel A, coefficients on underpricing determinants in panel
B, and model diagnostics in panel C. For obvious reasons, the year dummy used previously is
omitted in the subperiod models, and the Up Dummy must be omitted for the January 1999 –
December 2000 subperiod because the U.S. economy was not in a recession at any point during
these years. While the likelihood ratio tests for all three subperiods reject the null hypothesis,
indicating that there is statistically significant underpricing in all of them, we nevertheless urge
caution in interpreting the results from the final July 2008 – December 2010 subperiod given that
there were only 63 IPOs during this period. In comparing the first two subperiods, the following
differences stand out. First, while both total assets and the commission rate exert strong influences
on firm value in both periods with the expected signs, in both cases the influence appears stronger
in the January 2001 – June 2008 period, and post-IPO insider ownership is significant as well
whereas in the previous tech bubble period it is not. In contrast, the negative influence of firm age
21
on market value appears to be largely confined to the 1999-2000 tech bubble period, and firms in
the communication industry (which are most closely associated with the internet) enjoy a valuation
bonus in 1999-2000 that largely vanishes in later periods. Finally, among the underpricing
determinants, the hot index (counterintuitively) is significantly positive during 1999-2000 but not
in later periods. Putting it all together, our interpretation of the subperiod results in Table 3 is that
fundamental factors that theory says should matter in the valuation of IPOs – such as the book
value of assets, valuation risk and corporate governance – exert a greater influence on the market
value of firms going public in the January 2001 to June 2008 period than during the 1999-2000
tech bubble. We note, however, that some theoretically important characteristics and determinants
such as the retention ratio and underwriter rank exert equally strong influences in both periods.
5.1 Underpricing Estimates
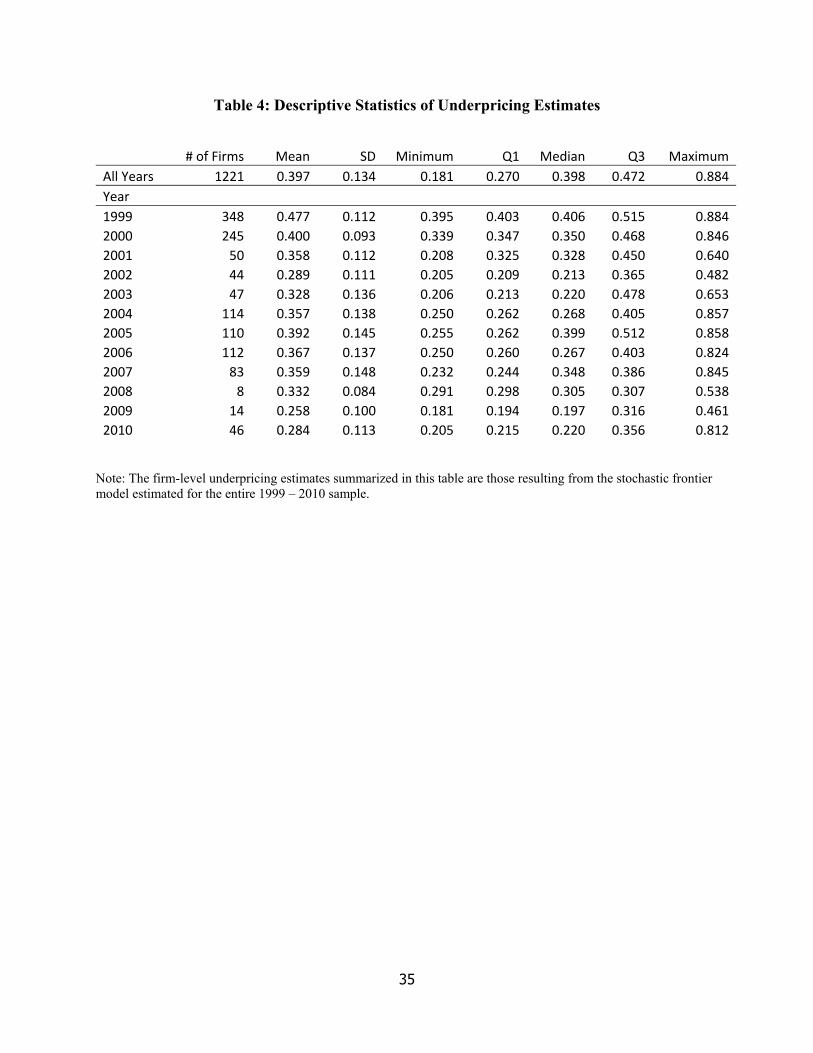
The underpricing of the ith firm given in equation (7) is computed for all firms in our
sample. Descriptive statistics for the underpricing estimates for the whole sample and for each year
are reported in Table 4. The means are the simple averages.
< INSERT TABLE 4 HERE >
From Table 4, we note that our findings indicate the market values of firms are underpriced
by a huge amount: the offer price falls 39.7% short of its optimal value on average, and the range
of the underpricing is from 18.1% to 88.4% of the optimal value, indicating that even in the best
cases there is subtantial underpricing based on ex-ante data. Further, we note that, on average, the
IPOs in 1999 exhibited the most underpricing while IPOs in 2009 demonstrated the least
underpricing, i.e. 47.7% and 25.8% of their optimal values respectively.
The mean underpricing that we find is much greater than has been reported in previous
studies using the stochastic frontier approach; Hunt-McCool et al. (1996) report average
22
underpricing of about 8-9%, while Koop and Li (2001) report that IPO firms in their sample are
25-30% underpriced on average. We believe there are several factors that explain this large
discrepancy in results. First, the sample periods of these studies are completely different (i.e. they
do not overlap), and other measures of underpricing based on first day returns also show greater
underpricing during our sample period. Ritter (2014) provides both the number of IPOs, and
average underpricing based on first day aftermarket returns, in each year between 1980 and 2013.
Using mean equally-weighted underpricing each year, and weighting each year by issue volume,
we calculate average aftermarket underpricing of 12.8% over the 1985-1998 period (the sample
period used by Koop and Li, 2001) versus 35.8% during our 1999-2010 sample period – most of
this difference is driven by hugely elevated first-day returns, relative to historical norms, in 1999
and 2000, which is roughly consistent with our finding in Table 4 that underpricing is highest, on
average, during those years. As noted previously, another reason we would expect to find greater
underpricing in our study is that we focus exclusively on emerging growth, de-novo IPOs (which
are likely to be more difficult to value and exhibit greater underpricing); the two earlier studies
included spinoffs and reorganizations of existing firms. As we will explain in more detail in the
next section, this difference in the composition of our sample can account for a further 5.5%
difference in first-day aftermarket returns. Finally, there are subtle but possibly crucial
methodological differences that may also contribute to our finding of greater underpricing. Hunt-
McCool et al. (1996) use the offer price per share as the dependent variable, even though
accounting-based independent variables in their model appear to be specified in an aggregated
(rather than on a per share) basis; in our opinion, this choice may render their conclusions suspect.
While Koop and Li (2001), similar to our study, do use Q (the product of the the offer price and
the total number of shares outstanding after the IPO) as their dependent variable, one of their
23
independent variables is the total fees paid by the issuing firm to the underwriters. Because the
total fees paid will be primarily determined by the size of the offering, which in turn is closely
related to the dependent variable Q, we believe the primary direction of causation in Koop and
Li’s model runs from the market value Q to fees paid, raising substantial statistical bias issues.9
We get around this problem by using the commission rate, in place of total fees, to proxy for the
valuation risk of the firm, and thus believe that inferences from our model are more reliable.
5.2 Relations between Ex-Ante Underpricing and First Day Returns
Subsequent to our estimation of the efficient frontier model solely using ex-ante data, we
obtained aftermarket stock price data for each IPO in our sample (we were unable to obtain this
data for 2 firms). The aftermarket stock price data is from CRSP. We calculate a first day return
as: (close price / offer price) -1. The first day return is a commonly used traditional measure of
ex-post underpricing.
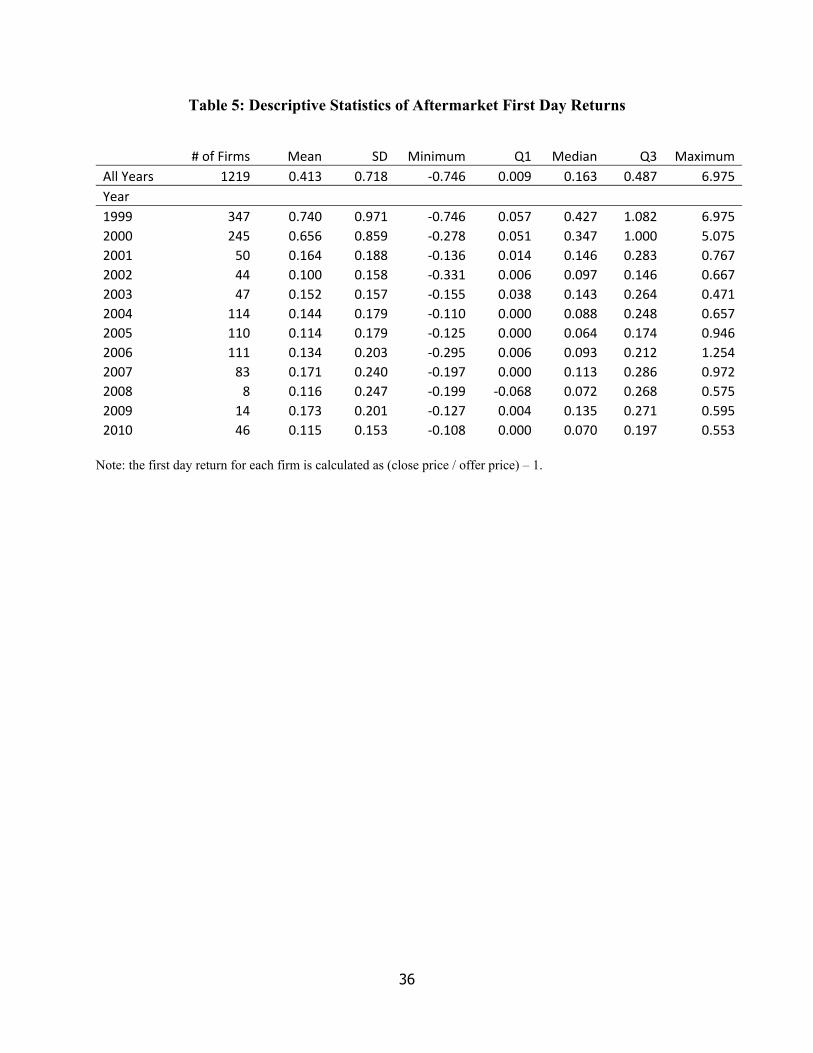
< INSERT TABLE 5 HERE >
Descriptive statistics for the aftermarket first day returns for our entire sample and by year
are provided in Table 5. We note that the mean first day return for all years is 41.3%, which is
close to the 39.7% mean ex-ante underpricing generated by our stochastic frontier model.
However, the distributions of estimated ex-ante underpricing and the ex-post returns are very
different. We note that the standard deviation of the first day returns is considerably larger, both
for the entire sample combined and for each individual year: there are numerous instances of
negative first day returns, and also many instances of extremely high first day returns, particularly
in 1999 and 2000. Another noteworthy aspect of the results arises from comparing our overall
41.3% mean first day return to the 35.8% mean first day return over the years 1999-2010
9 It is noteworthy that the t-statistic on the fees coefficient reported by Koop and Li (2001, Table 5) appears to be around 75.
24
(weighting each year by issue volume) in Ritter’s (2014) broader IPO database. Since the main
difference in the composition of the samples is that we exclude spinoffs and reorganizations, the
implication is that our focus on de-novo IPOs likely results in mean first day returns that are 5.5%
higher.
We next examine the statistical relations at the firm level between the ex-post first day
returns and the estimates of ex-ante underpricing provided by our model. If the traditional
interpretation that the positive first day returns in IPOs are due to deliberate underpricing is correct,
then we would expect a significant positive relation at the firm level between the model-based
estimate of the underpricing and the first day return. Hunt-McCool et al. (1996, Table 4), for their
1975-1984 sample, do find a significant postive relation between ex-ante underpricing and first
day return; however, they also report a very low R2 from their regression, and when they segregate
their sample into hot and nonhot issue periods they find that the significant positive relation exists
only during the hot periods.
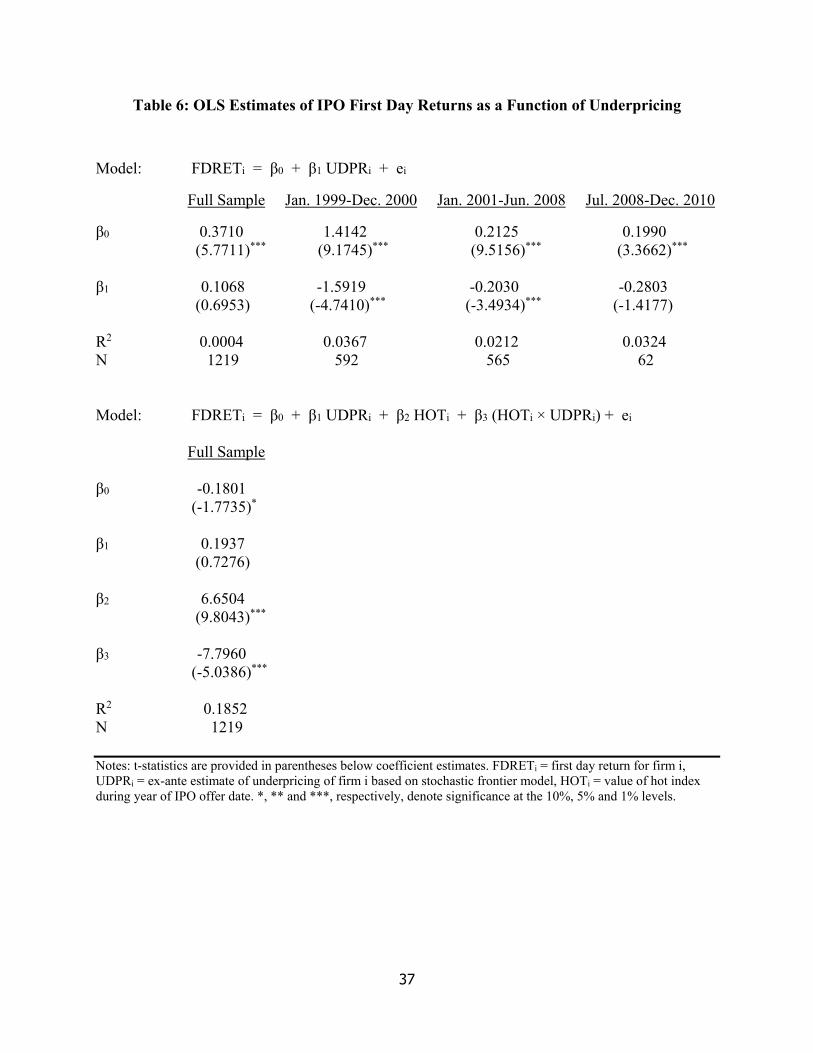
< INSERT TABLE 6 HERE >
We provide estimates of the following OLS regression models in Table 6:
FDRETi = β0 + β1 UDPRi + ei (10)
FDRETi = β0 + β1 UDPRi + β2 HOTi + β3 (HOTi × UDPRi) + ei (11)
Where FDRETi is the first day return for firm i, UDPRi is the ex-ante estimate of underpricing of
firm i based on our stochastic frontier model and HOTi is the value of the hot index during the
year of the IPO’s offer date. We estimate model 10 for our entire sample and for each of three
subsamples depending on offer date: January 1999 – December 2000, January 2001 – June 2008
and July 2008 – December 2010. Model 11 is motivated by Hunt-McCool et al’s (1996) finding

25
that the relation between first day returns and ex-ante undepricing differs based on the hotness of
the market for new issues.
The model 10 results do show a positive coefficient on UDPRi for the full sample, but
this relation is not statistically significant. Moreover, this result appears somewhat confounding
because when we estimate model 10 for the three subsamples, the coefficient on UDPRi becomes
negative and highly significant for the first two subsamples (IPOs issued Jan. 1999 – Dec. 2000
and Jan. 2001 – Jun. 2008), and remains negative (albeit insignificant) in the third. Taken
together, the model 10 results indicate that a variable that is strongly asociated with both the first
day returns and ex-ante underpricing – and varies by subperiod – is missing from the model.
Therefore, in light of the previosuly mentioned findings of Hunt-McCool et al. (1996, Table 4),
we also provide results for Model 11 for the full sample. Model 11 includes the hot index value
related to the issue year of each IPO and an interaction effect between the hot index and the firm-
level underpricing. These results show a marginally significant negative constant term, a positive
but insignificant coefficient on UDPRi, a hugely significant positive coefficient on HOTi, and a
hugely significant negative coefficient on HOTi × UDPRi, the interaction effect. We interpret
these results as follows: first day returns tend to be close to zero (or even negative on average)
and there is no relation between first day return and ex-ante underpricing during the coolest
periods (hot index close to zero). However, as the market for new issues heats up, average first
day returns markedly increase, but they increase more for firms that show less ex-ante
underpricing. In this respect our findings are the polar opposite of Hunt-McCool et al. (1996),
because the negative coefficient on the interaction effect implies a negative relation between ex-
ante underpricing and subsequent first day returns during hot new issue periods. We also note
26
that the regression results for model 11 are consistent with our finding in Table 2 that there is
more ex-ante underpricing as the hot index increases.
6. Conclusion
Following two earlier studies but using a different, non-overlapping sample period, this
study estimates the magnitude of the underpricing in IPOs for 1,221 firms during the 1999-2010
period by constructing a market value stochastic frontier model. In particular, the value of a firm’s
underpricing is estimated by the mean of the inefficiency term, the one-sided error term,
conditional on the entire error. The advantage of using the stochastic frontier approach to measure
underpricing, in place of the traditional approach of focusing on first day aftermarket returns, is
twofold. First, it is not clear, based on the extant literature, to what degree the first day returns on
IPOs reflect deliberate underpricing as opposed to market inefficiencies. Second, the frontier
approach may provide evidence regarding the extent to which measures related to the theoretically
important concept of valuation risk influence underpricing.
Our stochastic market value frontier model estimates, for both our entire sample and for
subsamples based on offer date, indicate that the most important positive ex-ante determinants of
a firm’s market value are the book value of its assets and the retention ratio. The latter is simply
the portion of shares retained by the original owners immediately after the IPO is completed; a
higher retention ratio apparently sends a strong signal to the market that the existing owners of the
privately-held firm are optimistic regarding the firm’s future prospects. We find that the most
important negative determinant of market value is the commission rate paid to the underwriters.
This finding is intriguing because the commission rate likely proxies for valuation risk, implying
that firms with greater valuation risk have lower market values. In addition to estimating the market
value frontier, we also investigate the determinants of underpricing in IPOs. Confirming previous
27
studies, we show that the most important determinant is underwriter rank: the higher the
underwriter rank, the lower the underpricing. Because firms with greater information asymmetry
and greater valuation risk are likely to attract lower-ranked underwriters, these results are
consistent with theoretical models hypothesizing that greater valuation risk is likely associated
with greater deliberate underpricing.
We observe that the offering price of a new issue of an average firm with an initial public
offering in the U.S. between 1999 and 2010 falls 39.7% short from its optimal value. While this
estimate of ex-ante underpricing greatly exceeds those from two previous studies using a
methodology similar to ours, it is consistent with much greater first day aftermarket returns during
our sample period and also with the composition of our sample, which (unlike in the case of the
two earlier studies) excludes spinoffs and reorganizations of existing publicly-traded firms. We
show, however, that while the mean of the model-based, ex-ante underpricing in our sample is
close to the mean of the first day aftermarket returns (41.3% for the firms in our sample), there is
not a statistically significant positive relation at the firm level between the ex-ante underpricing
and the first day return. If anything, taking into account the interaction between the hotness of the
market for new issues and the model-based underpricing estimates, we find a negative association
at the firm level between underpricing and subsequent first day returns in hot markets. Our
interpretation of these results is that while there likely is (as theory predicts) deliberate
underpricing in IPOs, first day aftermarket returns at the firm level are not explained by this
underpricing and are, instead, likely due to market inefficiencies.
28
References
Aggarwal, R., and Rivoli, P., 1990. Fads in the Initial Public Offering Market? Financial Management Journal, 19, 45–57.
Aigner, D. Knox-Lovell, C.A. and Schmidt, P., 1977. Formulation and Estimation of Stochastic Frontier Production Function Models. Journal of Econometrics, 6, 21-37. Banerjee, Suman, Lili Dai and Keshab Shrestha, 2011. Cross-country IPOs: What explains
differences in underpricing? Journal of Corporate Finance, 17, 1289-1305. Battese, G. E. and Coelli, T. J., 1988. Prediction of Firm Level Technical Efficiencies with A
Generalized Frontier Production Function and Panel Data. Journal of Econometrics, 38, 387-399.
Battese, G. E., and Coelli, T. J., 1993. A Stochastic Frontier Production Function Incorporating A Model for Technical Inefficiency Effects. Working Papers in Econometrics and Applied Statistics 69, Department of Economics, University of New England, Armidale.
Battese, G. E. and Coelli, T. J., 1995. A Model for Technical Inefficiency Effects in A Stochastic
Frontier Production for Panel Data. Empirical Economics, 20, 325-332. Benveniste, L. M. and Spindt, P. A., 1989. How Investment Bankers Determine the Offer Price and Allocation of New Issues, Journal of Financial Economics 24, 343–362. Benveniste, L. M. and Wilhelm, W. J., 1990. A Comparative Analysis of IPO Proceeds under
Alternative Regulatory Environment. Journal of Financial Economics, 28, 173-208.
Bera, A. K. and Sharma, S. C., 1999. Estimating Production Uncertainty in Stochastic Frontier Production Function Models. Journal of Productivity Analysis, 12, 187-210.
Cagle, J. and Porter G. E., 1996. IPO Underpricing in Regulated Industries. Journal of Economics and Finace, 20, 27-37. Carter, B. R. and Dark, F. H. and Singh, A. K., 1998. Underwriter Reputation, Initial Returns, and the Long-Run Performance of IPO Stocks. The Journal of Finance, 53, 285-311.
Carter, R. and Manaster, S., 1990. Initial Public Offerings and Underwriter Requtation.
The Journal of Finance, 45, 1045-1067.
Chahine, S. and Goergen, M., 2013. The Effects of Management-Board Ties on IPO Performance. Journal of Corporate Finance, 21, 153-179.
Chahine, S. and Goergen, M., 2014. Top Management Ties with Board Members: How they Affect Pay–Performance Sensitivity and IPO Performance.Journal of Corporate Finance, 27, 99- 115.
29
Chemmanur, T. J., 1993. The Pricing of Initial Public Offers: A Dynamic Model with Information Production. The Journal of Finance, 48, 285-304. Choe, H., Masulis, R.W., Nanda, V., 1993. Common stock o_erings across the business cycle:
Theory and evidence. Journal of Empirical Finance 1, 3-31.
Cornelli, F., Goldreich, D. and Ljungqvist, A., 2006. Investor Sentiment and pre-IPO Markets, Journal of Finance, 61, 1187–1216. Da, Z., Engelberg, J. and Gao, P., 2011. In Search of Attention. Journal of Finance, 66, 1461- 1499. Depken, C. A., Nguyen, G. X. and Sarkar, S. K., 2006. Agency Costs, Executive Compensation,
Bonding and Monitoring: A Stochastic Frontier Approach. Paper presented at Annual Meeting of American Economic Association, Boston, MA. Filatotchev, I. and Bishop, K., 2002. Board Composition, Share Ownership, and ‘Underpricing’ of U.K. IPO Firms. Strategic Management Journal, 23, 941-955. Habib, M. A. and Ljungqvist, A., 2001. Underpricing and Entrepreneurial Wealth Losses in IPOs: Theory and Evidence. Review of Financial Studies, 14, 433-458. Habib, M. A. and Ljungqvist, A., 2005. Firm Value and Managerial Incentives: A Stochastic Frontier Approach. Journal of Business, 78, 2053-2093.
Hanley, K. W., 1993. The Underpricing of Initial Public Offerings and the Partial Adjustment Phenomenon, Journal of Financial Economics 34, 213–250. Hughes, P. J., 1986. Signaling by Direct Disclosure under Asymmetric Information.
Journal of Accounting and Economics, 8, 119–142. Hughes, P. J. and Thakor, A. V., 1992. Litigation Risk, Intermediation, and the Underpricing of Initial Public Offerings. The Review of Financial Studies, 5, 709-742. Hunt-McCool, J., Koh, S. C. and Francis, B. B., 1996. Testing for Deliberate Underpricing in the IPO Premarket: A Stochastic Frontier Approach. The Review of Financial Studies, 9, 1251-1269.
Ibbotson, R. G., 1975. Price Performance of Common Stock New Issues. Journal of Financial Economics, 2, 235-272.
Ibbotson, R. G. and Jaffe, J. J., 1975. “Hot Issue” Market. The Journal of Finance, 30, 1027-1042.
Ibbotson, R. G., Sindelar, J. and Ritter, J. R., 1988. Initial Public Offerings. Journal of Applied Corporate Finance, 1, 37-45.
30
Jondrow, J., Lovell, C. K., Materov, I. S. and Schmidt, P., 1982. On the Estimation of Technical Inefficiency in the Stochastic Frontier Production Function Model. Journal of Econometrics, 19, 233-238.
Kim, M. and Ritter, J. R., 1999. Valuing IPOs. Journal of Financial Economics, 53, 409-437.
Koop, G. and Li, K., 2001. The valuation of IPO and SEO Firms. Journal of Empirical Finance, 8, 375-401.
Lee, P. M. and Wahal, S., 2004. Grandstanding, Certification and the Underpricing of Venture Capital Backed IPOs. Journal of Financial Economics, 73, 375-407. Ljungqvist, A., Nanda, V. and Singh, R. 2006. Hot Markets, Investor Sentiment, and IPO
Pricing. Journal of Business, 79, 1667-1702. Loughran, T. and Ritter, J.R., 2002. Why don’t Issuers Get Upset About Leaving Money on the Table in IPOs, Review of Financial Studies 15, 413–433. Loughran, T. and Ritter, J. R., 2004. Why Has IPO Underpricing Changed Over Time?
Financial Management, 33, 5-37. Lowry, M., Officer, M. S. and Schwert, G. W., 2010. The Variability of IPO Initial Returns.
Journal of Finance, 65, 425-465.
Lowry, M. and Schwert, G. W., 2004. Is the IPO Pricing Process Efficient? Journal of Financial Economics 71, 3–26.
Meeusen, W. and van Den Broeck, J., 1977. Efficiency Estimation from Cobb-Douglas Production Functions with Composed Error. International Economic Review 18, 435-444. Purnanandam, A. K. and Swaminathan, B., 2004. Are IPOs really underpriced?
Review of Financial Studies 17, 811–848. Ritter, J. R., 1984. The “Hot Issue” Market of 1980. Journal of Business, 57, 215-240. Ritter, J. R., 1991. The Long-run Performance of Initial Public Offerings. The Journal of Finance, 46, 3-27. Ritter, J.R. 2014. Mean First Day Returns and Money Left on the Table, 1980-2013. Last
updated March 25, 2014. https://site.warrington.ufl.edu/ritter/files/2015/04/Mean-First-day-Returns-and-Money-Left-on-the-Table-1980-2013-2014-03-25.pdf
Ritter, J. R. and Welch, I., 2002. A Review of IPO Activity, Pricing, and Allocations. The Journal of Finance, 57, 1795-1828.
Rock, K., 1986. Why New Issues are Underpriced. Journal of Financial Economics 15, 187–212.

31
Shiller, R., 1990. Speculative Prices and Popular Models. Journal of Economic Perspectives, 4, 55–65.
Welch, I., 1989. Seasoned Offerings, Imitation Costs, and the Underpricing of Initial Public Offerings. The Journal of Finance, 44, 421-450.
Welch, I., 1992. Sequential Sales, Learning, and Cascades. The Journal of Finance, 47, 695-732.
32
Table 1: Descriptive Statistics of IPO Characteristics Mean St. Dev. Minimum Q1 Median Q3 Maximum
Firm Characteristics
Q ($ Millions) 502.130 752.220 13.200 192.607 313.769 549.554 11975.499
Total Assets ($ Millions) 321.269 2086.410 0.094 15.711 36.090 137.160 48765.349
Total Debt ($ Millions) 90.685 431.535 0.000 0.059 1.891 19.935 9447.682
R&D Expense ($ Millions) 6.203 14.039 0.000 0.000 2.212 7.840 339.337
Commission Rate 0.069 0.005 0.019 0.070 0.070 0.070 0.100
Retention Ratio 0.741 0.125 0.000 0.692 0.762 0.823 0.979
Age 12.799 17.277 1.000 5.000 8.000 13.000 158.000
Post‐IPO Insider Ownership 0.437 0.209 0.000 0.292 0.445 0.592 1.000
Determinants of Underpricing
Underwriter Rank 8.247 1.300 1.000 8.000 9.000 9.000 9.000
Up Dummy 0.948 0.221 0.000 1.000 1.000 1.000 1.000
HOT Index 0.157 0.095 0.007 0.091 0.097 0.281 0.281
Venture Capital Dummy 0.594 0.491 0.000 0.000 1.000 1.000 1.000
Notes: Q is the a-priori market value of the firm, defined as the offer price × total number of outstanding shares after the offering. Total Assets, total debt and r&d expense are for the last fiscal year prior to the offer date. The commission rate is computed as underwriter compensation / (offer price × shares offered in IPO). The retention ratio is defined as (1 – shares offered in IPO / total number of outstanding shares after the offering), and post-IPO insider ownership is defined as projected number of shares held by officers and directors after IPO is completed (as indicated in the prospectus) / total number of outstanding shares after the offering. The underwriter rank is determined according to IPO Underwriter Reputation Rankings (1980-2014) collected from Jay R. Ritter's database. The up dummy is defined as 1 if the U.S. economy is not in recession on the offer date and 0 otherwise. The HOT index is computed as the ratio of the number of IPOs in a specific year over the total number of IPOs during the sample period. The venture capital dummy equals 1 if our reading of the prosepctus indicates any backing by a known venture capital firm and 0 otherwise.
33
Table 2: Stochastic Market Value Frontier Model Estimates
Coefficient Standard Error t‐statistic
Panel A: Firm Characteristics
Constant 11.1830 0.2982 37.4987 ***
ln(Total Assets) 0.2213 0.0150 14.7929 ***
ln(Total Debt) 0.0056 0.0048 1.1686
ln(R&D Expense) ‐0.0004 0.0050 ‐0.0787
Commission Rate (%) ‐32.2763 3.1813 ‐10.1455 ***
Retention Ratio (%) 2.5647 0.1462 17.5411 ***
ln(Age) ‐0.0876 0.0223 ‐3.9373 ***
Post‐IPO Insider Ownership (%) 0.1253 0.0794 1.5719
Chemicals, Oil and Gas ‐0.1073 0.0626 ‐1.7128 *
Computers 0.0487 0.0500 0.9735
Electronics 0.1032 0.0692 1.4927
Health and Scientific ‐0.1029 0.0700 ‐1.4685
Communications 0.2163 0.0772 2.8017 ***
Retail ‐0.0112 0.0814 ‐0.1380
Financial ‐0.1430 0.0738 ‐1.9361 *
Year Dummy (= 1 if 1999 or 2000) 0.2324 0.0920 2.5270 **
Panel B: Determinants of Underpricing
Constant 2.2013 0.1664 13.2328 ***
Underwriter Rank ‐0.2059 0.0145 ‐14.2338 ***
Up Dummy ‐0.1509 0.0742 ‐2.0347 **
Hot Index 1.1077 0.4811 2.3023 **
Venture Capital Dummy 0.0101 0.0376 0.2684
Panel C: Diagnostics
LR Test of u = 0 (χ2) 203.4733 ***
Sigma‐squared 0.2917 0.0118 24.8157 ***
Gamma 0.0065 0.4053 0.0161
# of Firms 1221 Note: *, ** and ***, respectively, denote statistical significance at the 10%, 5% and 1% levels.
34
Table 3: Stochastic Market Value Frontier Model Estimates, by Subsample
Jan. 1999 - Dec. 2000 IPOs Jan. 2001 - Jun. 2008 IPOs Jul. 2008 - Dec. 2010 IPOs
Coefficient Standard
Error t-statistic CoefficientStandard
Error t-statistic CoefficientStandard
Error t-statistic
Panel A: Firm Characteristics
Constant 10.3810 0.4447 23.3453 *** 10.8127 0.4898 22.0778 *** 11.9634 1.8330 6.5268 ***
ln(Total Assets) 0.1556 0.0210 7.4236 *** 0.2999 0.0236 12.6940 *** 0.3431 0.0395 8.6890 ***
ln(Total Debt) 0.0071 0.0071 1.0001 -0.0063 0.0067 -0.9360 -0.0175 0.0100 -1.7422 *
ln(R&D Expense) 0.0029 0.0074 0.3926 -0.0053 0.0074 -0.7067 0.0221 0.0185 1.1933 Commission Rate -17.4545 4.7748 -3.6556 *** -37.2661 4.3726 -8.5226 *** -62.7462 0.9910 -63.3174 ***
Retention Ratio (%) 3.2042 0.2462 13.0155 *** 2.1769 0.1962 11.0928 *** 2.7556 0.3158 8.7257 ***
ln(Age) -0.1841 0.0387 -4.7560 *** 0.0013 0.0308 0.0415 -0.0451 0.0223 -2.0167 **
Post-IPO Insider Ownership (%) 0.0627 0.1171 0.5357 0.2218 0.1066 2.0812 ** 0.1503 0.4257 0.3530 Chemicals, Oil and Gas -0.0656 0.1224 -0.5362 -0.0112 0.0831 -0.1351 -0.0784 1.4568 -0.0538 Computers 0.0833 0.0683 1.2184 0.0953 0.0775 1.2303 -0.0714 0.2380 -0.3001 Electronics 0.1357 0.0913 1.4857 0.1568 0.1078 1.4543 0.3429 0.3355 1.0221 Health and Scientific -0.0713 0.1267 -0.5626 0.0227 0.0880 0.2581 -0.1801 0.2062 -0.8734 Communications 0.4515 0.1072 4.2106 *** 0.1032 0.1381 0.7470 -0.1542 0.2431 -0.6343 Retail 0.1284 0.1167 1.1003 -0.3431 0.1264 -2.7143 *** 0.4126 0.4823 0.8554 Financial -0.0805 0.1669 -0.4825 -0.2974 0.0858 -3.4652 *** 0.3406 0.6822 0.4992
Panel B: Det. of Underpricing
Constant 1.8784 0.2526 7.4375 *** 2.2929 0.2046 11.2047 *** -0.9792 0.6011 -1.6291 *
Underwriter Rank -0.2273 0.0228 -9.9791 *** -0.1984 0.0191 -10.3845 *** -0.0477 0.0115 -4.1620 ***
Up Dummy -0.1486 0.0770 -1.9293 * 1.7628 1.0311 1.7096 Hot 1.5397 0.6092 2.5274 ** -0.0643 0.9748 -0.0659 0.1875 0.1638 1.1451 Venture Capital Dummy -0.0368 0.0550 -0.6699 0.0225 0.0537 0.4194 0.1155 0.7633 0.1513
Panel C: Diagnostics
LR Test of u = 0 (Chi square) 107.8943 *** 104.0988 *** 29.7089 ***
Sigma-squared 0.2644 0.0156 16.8964 *** 0.2581 0.0153 16.9012 *** 0.3173 0.1003 3.1626 ***
Gamma 0.0000 0.0232 0.0015 0.0000 0.1181 0.0000 1.0000 0.0000 777348 ***
Number of Firms 593 565 63
Note: *,** and ***, respectively, denote statistical significance at the 10%, 5% and 1% levels.
35
Table 4: Descriptive Statistics of Underpricing Estimates
# of Firms Mean SD Minimum Q1 Median Q3 Maximum
All Years 1221 0.397 0.134 0.181 0.270 0.398 0.472 0.884
Year
1999 348 0.477 0.112 0.395 0.403 0.406 0.515 0.884
2000 245 0.400 0.093 0.339 0.347 0.350 0.468 0.846
2001 50 0.358 0.112 0.208 0.325 0.328 0.450 0.640
2002 44 0.289 0.111 0.205 0.209 0.213 0.365 0.482
2003 47 0.328 0.136 0.206 0.213 0.220 0.478 0.653
2004 114 0.357 0.138 0.250 0.262 0.268 0.405 0.857
2005 110 0.392 0.145 0.255 0.262 0.399 0.512 0.858
2006 112 0.367 0.137 0.250 0.260 0.267 0.403 0.824
2007 83 0.359 0.148 0.232 0.244 0.348 0.386 0.845
2008 8 0.332 0.084 0.291 0.298 0.305 0.307 0.538
2009 14 0.258 0.100 0.181 0.194 0.197 0.316 0.461
2010 46 0.284 0.113 0.205 0.215 0.220 0.356 0.812
Note: The firm-level underpricing estimates summarized in this table are those resulting from the stochastic frontier model estimated for the entire 1999 – 2010 sample.
36
Table 5: Descriptive Statistics of Aftermarket First Day Returns
# of Firms Mean SD Minimum Q1 Median Q3 Maximum
All Years 1219 0.413 0.718 ‐0.746 0.009 0.163 0.487 6.975
Year
1999 347 0.740 0.971 ‐0.746 0.057 0.427 1.082 6.975
2000 245 0.656 0.859 ‐0.278 0.051 0.347 1.000 5.075
2001 50 0.164 0.188 ‐0.136 0.014 0.146 0.283 0.767
2002 44 0.100 0.158 ‐0.331 0.006 0.097 0.146 0.667
2003 47 0.152 0.157 ‐0.155 0.038 0.143 0.264 0.471
2004 114 0.144 0.179 ‐0.110 0.000 0.088 0.248 0.657
2005 110 0.114 0.179 ‐0.125 0.000 0.064 0.174 0.946
2006 111 0.134 0.203 ‐0.295 0.006 0.093 0.212 1.254
2007 83 0.171 0.240 ‐0.197 0.000 0.113 0.286 0.972
2008 8 0.116 0.247 ‐0.199 ‐0.068 0.072 0.268 0.575
2009 14 0.173 0.201 ‐0.127 0.004 0.135 0.271 0.595
2010 46 0.115 0.153 ‐0.108 0.000 0.070 0.197 0.553
Note: the first day return for each firm is calculated as (close price / offer price) – 1.
37
Table 6: OLS Estimates of IPO First Day Returns as a Function of Underpricing
Model: FDRETi = β0 + β1 UDPRi + ei
Full Sample Jan. 1999-Dec. 2000 Jan. 2001-Jun. 2008 Jul. 2008-Dec. 2010
β0 0.3710 1.4142 0.2125 0.1990 (5.7711)*** (9.1745)*** (9.5156)*** (3.3662)***
β1 0.1068 -1.5919 -0.2030 -0.2803 (0.6953) (-4.7410)*** (-3.4934)*** (-1.4177) R2 0.0004 0.0367 0.0212 0.0324 N 1219 592 565 62 Model: FDRETi = β0 + β1 UDPRi + β2 HOTi + β3 (HOTi × UDPRi) + ei Full Sample β0 -0.1801 (-1.7735)*
β1 0.1937 (0.7276) β2 6.6504 (9.8043)*** β3 -7.7960 (-5.0386)***
R2 0.1852 N 1219 Notes: t-statistics are provided in parentheses below coefficient estimates. FDRETi = first day return for firm i, UDPRi = ex-ante estimate of underpricing of firm i based on stochastic frontier model, HOTi = value of hot index during year of IPO offer date. *, ** and ***, respectively, denote significance at the 10%, 5% and 1% levels.