“oxford handbook on ipos” - university of colorado...
TRANSCRIPT

IPO Valuation: The International Evidence
for “Oxford Handbook on IPOs”
Abstract: In this chapter, we study the valuation of 6,199 IPOs during 1998-2015 for the
following countries: Australia, Canada, China, Germany, India, Japan, U.K., and U.S. Net
income is positively related to IPO valuation in each of the eight countries. The economic impact
of net income is largest for Chinese IPOs and smallest for Australian IPOs. Book value is
positively and significantly related to IPO valuation in only Canada, Germany, India, and U.S.
Capital expenditure is significantly and positively related to IPO valuation in only Canada,
Germany, India, U.K., and U.S. We find a positive and statistically significant relation between
insider retention and IPO valuation only in China, Germany, U.K., and U.S.; positive but
marginally significant relationship for India and Japan. Underwriter reputation has a positive and
statistically significant relationship for IPOs only in China, Germany, India, U.K., and U.S. Net
income is positively and statistically significantly related to IPO valuation during the years 1998-
2015, and this relationship has strengthened over time. Capital expenditure is positively and
significantly related to IPO value during 1998-2015, and this relation appears to be stable over
time.
Sanjai Bhagat
Jun Lu
Srinivasan Rangan
April 2017

1
1. Introduction
IPOs, initial public offerings, are an economically significant contributor to the
amount of capital raised by firms around the world. Over US$ 4.1 trillion was raised by
over 36,000 firms that completed an IPO between 1998 and 2015 (Source: Thomson SDC
Global New Issues database). Further, IPO firms are also considered the drivers of
innovation and employment in the economy, and hence their success is critical to
economic growth.
Beginning with Loughran, Ritter, and Rydqvist (1994), several studies have
documented cross-country differences in the initial public offering (IPO) process and
how these differences influence the decision to go public and subsequent pricing
(Henderson, Jegadeesh, Weisbach (2006); Kim and Weisbach (2008); Caglio, Hanley,
Westburg (2010)). While a few studies have focused on the underpricing (change in price
on the first day of trading) of IPOs around the world, no previous study has examined
cross-country differences in determinants of the level of the IPO value.1
Valuation of IPOs occupies an important place in finance, perhaps because an
IPO provides public capital market participants their first opportunity to value a set of
corporate assets and growth opportunities. Valuation of IPOs is also quite relevant from
an economic efficiency perspective: the IPO is the first opportunity that managers of such
(usually young) companies get to observe price signals from the public capital markets.
Such signals can either affirm or repudiate management’s beliefs regarding the firm’s
1 A few papers have examined the determinants of IPO prices in the U.S. They are Klein (1990), Kim and Ritter
(2003), and Aggarwal, Bhagat, and Rangan (2009).

2
future growth opportunities, which have obvious implications for real economic activity – for
example, employment and corporate investment.
The finance literature has several hundred papers on IPO underpricing which is
the difference between the market price at the end of the offer day and the offer price.
However, there is little in the literature on the offer price itself. It is the offer price which
is of greater interest to investors, issuing companies, regulators, and investment bankers; since
investors are more interested in IPO valuation which is the offer price times the number of share
outstanding. In light of this it is especially surprising that the finance literature has devoted so
much intellectual effort to understanding IPO underpricing but so little to understanding the
more primitive economic variable: the offer price or the value of the IPO.
In this chapter, we study the valuation of 6,199 IPOs during 1998-2015 for the following
countries: Australia, Canada, China, Germany, India, Japan, U.K., and U.S. We construct a
model to value IPOs. Conceptually, the value of an asset is the sum of the present value of its
expected future cash flows. Estimating the expected future cash flow of most any company is
non-trivial; this task is even more challenging for IPO firms given that, in general, less is known
about their past performance and there is greater uncertainty about their future prospects. Instead
of directly estimating future cash flows and the cost of capital to discount these cash flows, we
construct proxies for the cash flows and discount rates; these proxies involve financial and non-
financial variables. We discuss these proxies below.
In a seminal article, Ohlson (1995) develops a model that expresses the market value of
equity as a linear function of earnings, book value of equity, and other information.
Subsequently, a sizable body of empirical research (see for example, Penman (1998) and Francis
and Schipper (1999)) has used this model to motivate empirical investigations of the value

3
relevance of earnings and book value of equity. Myers (1977) has suggested that the
market value of a firm is positively related to its growth opportunities. Growth
opportunities are especially critical for IPOs given that more, if not most, of an IPO’s
value is based on them. More recently, Abel and Eberly (2005) propose a valuation
model which explicitly incorporates the possibility that firms may upgrade to or adopt a
new technology. In their model, the value of the firm is comprised of three components:
the replacement cost of the firm’s physical capital, the net present value of the firm’s
expected future cash flows from assets in place, and the value of growth options
associated with future technological upgrades.
There is a substantive literature in financial accounting on the value relevance of
accounting variables in explaining cross-sectional variation in market value of stocks;
Kothari (2001), and Barth, Beaver and Landsman (2001) review this literature. Collins,
Maydew and Weiss (1997) document the increasing importance of net income in
explaining the cross-sectional variation in market value. Lev (1997) has argued that the
value-relevance of book value has declined over time, since intangible assets comprise a
larger fraction of the value of most firms today; this would be especially true for IPOs
whose value, as noted above, would be drawn from their growth opportunities (intangible
assets). Rhodes-Kropf, Robinson, and Viswanathan (2005) (RRV) draw on this literature
and propose a simple model that includes only book value and net income to explain the
cross-sectional variation in stock market values. We adopt and extend the RRV model in
our analysis.
The main variables that prior literature on accounting and finance has shown to
influence IPO prices in the U.S. are earnings, book value, expected growth, pre-IPO

4
insider ownership, underwriter reputation, and auditor reputation (Ohlson (1990); Aggarwal,
Bhagat, and Rangan (2009)). The accounting and finance literatures document that earnings
opacity influences a range of capital market outcomes (Bhattacharya, Daouk, and Welker (2003),
Gelos and Wei (2005), Jin and Myers (2006)). We expect that the impact of pre-IPO data on IPO
prices will be lower in countries where earnings are more opaque. Recently, several countries,
especially in the European Union have adopted International Financial Reporting Standards
(IFRS). An open question is whether the adoption of these standards has influenced the quality of
accounting data in these countries and if market participants perceive differences in quality.
In a series of influential papers, La Porta et al. (1997, 2002) analyze the role a country’s
legal system has in protecting investor rights. They argue that “diverse elements of countries’
financial systems as the breadth and depth of their capital markets, the pace of new security
issues, corporate ownership structures, dividend policies, and the efficiency of investment
allocation appear to be explained both conceptually and empirically by how well the laws in
these countries protect outside investors.” Further, they postulate that the commercial legal codes
of most countries are based on four legal traditions: the English common law, the French civil
law, the German civil law, and the Scandinavian law. They find that common law countries
provide the most protection to investors and that they have the deepest stock markets and most
dispersed corporate ownership structures. They also document that countries develop substitute
mechanisms for poor investor protection, such as mandatory dividends and greater ownership
concentration. Finally, they find that investor protection is positively correlated with valuation
across countries. To the extent that IPO valuations are correlated with valuations of financial
securities, in general, investor protection would be a determinant of IPO valuation.
5
In a recent paper, Cumming, et al (2016) document a positive correlation between
IPO valuations and backing of such IPOs by international venture capital syndicates.
Additionally, listing requirements across exchanges and countries have been found to be
correlated with IPO valuation; see Carpentier, et al (2012), and Johan (2010).
The remainder of the chapter is organized as follows. The next section describes our
sample and data and section 3 discusses descriptive statistics of several pre-IPO financial
and offering variables. Section 4 details our empirical results for the determinants of IPO
valuation across countries. The final section concludes with a summary.
2. Sample and Data
2.1. Sample
An initial sample of 21,577 observations for the years 1998-2015 is obtained from
the Thomson Reuters SDC Platinum New Issues database (SDC) for eight countries:
Australia, Canada, China, Germany, India, Japan, United Kingdom, and United States. In
Table 1, we report the type and number of IPOs that are excluded to arrive at our final
sample, by country and for all countries combined. Our filters are similar to those applied
in prior research on IPO pricing - we exclude financial firms, privatizations, unit offerings,
private placements, spinoffs, rights offerings, offerings by limited partnerships, offerings
that do not involve common shares (for example, loan stock), offerings that are not
underwritten, offerings by firms with missing CUSIPS and SEDOLs, and follow-on
offerings.2 These exclusions enable us to achieve a relatively homogenous sample of
underwritten offerings of common shares to new investors that result in a cash infusion to
2 When a firm conducted multiple offerings during the sample period, offerings subsequent to the first offering were
treated as follow-on offerings and eliminated.

6
the firm or its pre-IPO shareholders. The basic unit of observation on SDC is an offering tranche;
while some IPOs have a single tranche, others have more than one tranche. To achieve a sample
of unique IPOs (one observation per firm), we also eliminate 2,417 tranches that relate to
multiple-tranche IPOs.
[Insert Table 1 here]
For each of the remaining 10,534 IPOs (except for Chinese IPOs), we attempt to obtain
final IPO prospectuses from the following sites: www.sec.gov for U.S. firms, www.sedar.com
for Canadian firms, www.sebi.gov.in for Indian firms, and the Filings Library of the Thomson
One Banker database for Australian, German, Japanese, and U.K. firms. For Chinese firms, we
obtain pre-IPO data from the GTA database, and not from prospectuses. When reading
prospectuses, we discovered firms that would be eliminated based on the afore-mentioned filters.
Our final “filter-compliant” sample for which we have prospectuses consists of 6,199 IPOs.
China and U.S. have the highest number of IPOs among the eight countries and Canada and
Germany the lowest. Figure 1 presents a pie chart of the country-wise shares of the number of
completed IPOs.
[Insert Figure 1 here]
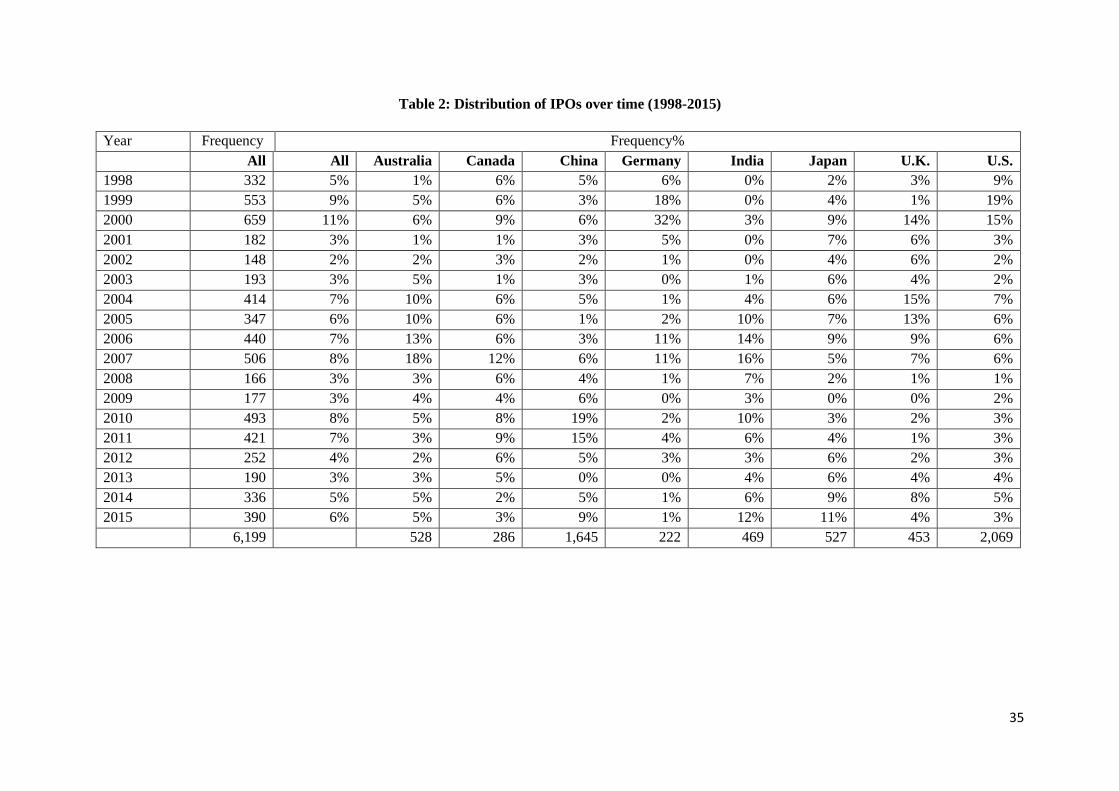
Table 2 presents the time-series of offering frequencies in percentages for the eight
countries. In general, IPO volumes display cyclicality with peak volumes varying across
countries. IPO frequencies rose during the years 1998-2000 before dropping in 2001 – the year
following the crash of the dotcom bubble. Subsequently, IPO markets around the world
recovered to grow in volume from 2002 to 2007. With the advent of the financial crisis in the
years 2008-2009, IPO volume fell for all countries. Thereafter, during the most recent period –
2010-2015, volumes returned to pre-crisis levels, but never exceeded levels attained between

7
2002-2007. The peak offering frequency year varies across countries and is as follows:
Australia – 2007, Canada – 2007, China – 2010, Germany – 2000, India – 2007, Japan –
2015, U.K. – 2004, and U.S. – 1999. Figure 2 plots the time series of offering frequency
for the eight countries combined.
[Insert Table 2 here]
[Insert Figure 2 here]
2.2. Data sources and definitions
SDC is our primary data source for the following thirteen offering-related variables:
offer price in local currency, offer date, offering proceeds in US dollars, primary shares
offered, secondary shares offered, total shares offered, shares outstanding after the
offering, shares outstanding before the offering, name of the auditor, names of the lead
underwriters, exchange, currency in which shares are offered, and four-digit SIC code.
When these variables are missing, we filled in their values from prospectuses. We verify
the accuracy of these SDC-sourced variables (except for SIC codes, offering proceeds, and
underwriter names) by comparing their values with those in prospectuses; whenever we
find a difference, we replace SDC data with values from the prospectuses. As stated earlier,
for Chinese firms, we rely on the GTA database rather than SDC for offering data.
We obtain founding years from IPO prospectuses, except for China and the U.S.
Founding years for Chinese firms are from the GTA database. For U.S. firms, we obtain
founding years from Professor Jay Ritter’s IPO database3; when founding years were not
3 https://site.warrington.ufl.edu/ritter/ipo-data/

8
available on that database, we obtain them from prospectuses. We define firm age as the
difference between the offering year based on the offer date and the founding year.
Besides age, we construct four measures that we expect to influence IPO
valuation: auditor reputation, underwriter reputation, industry PE ratio, and pre-IPO market
returns. Consistent with a large body of auditing literature, we measure auditor reputation as a 1-
0 dummy variable based on whether or not the firm’s financials were audited by a big-N auditor.
To measure underwriter reputation, we employ the method of Megginson and Weiss (1991). For
each underwriter j and for every year t, we define xjt as the three-year moving average (t-3, t-2, t-
1) of IPO proceeds. Then, for the set of underwriters I, for the year t, the Megginson-Weiss rank
for underwriter j is:
𝑈𝑊𝑅𝐴𝑁𝐾𝑗𝑡 = log (𝑥𝑗𝑡)
𝑀𝑎𝑥𝑗∈𝐼[log(𝑥𝑗𝑡)] (1)
This measure of underwriter reputation is market-share based and is a continuous variable on the
interval [0,1]. When an IPO has multiple lead underwriters, we divide IPO proceeds by the
number of underwriters.
To measure industry PE, for each IPO firm, we obtain the market capitalizations at the
end of the month before the offering date for all firms in that firm’s country that had the same 2-
digit SIC code (industry-peers). We chose two-digit SIC codes to minimize data loss because of
industries having too few firms. For these industry peers, we obtain the income before
extraordinary items for the most recent year relative to the month-end at which market
capitalization is measured. We compute industry medians of PE, market capitalization divided by
income before extraordinary items. Market capitalization and income before extraordinary items
are from CRSP and North America COMPUSTAT for U.S. firms, Global Compustat for firms
9
from Australia, Canada, China, Germany, Japan, and United Kingdom and from the
CMIE Prowess database for Indian firms.
To compute three-month market return before each firm’s offering date, we sum
daily market returns over 63 trading days ending on the day before the offering date.
Daily market returns are measured as the value-weighted market-wide return for U.S.
stocks from CRSP and as percent changes in daily market index values from CMIE
prowess for Indian firms and from Global Compustat for the other six countries
(Appendix A details the specific market indices used for the seven countries).
Turning to the financial statement variables, we manually collect the following
eight financial statement variables for years -1 to -3 relative to the offering date from
prospectuses, whenever available: sales, research and development costs (R&D), income
before extraordinary items, cash flows from operations, capital expenditures, long-term
debt, book value of equity, and total assets. All numbers were coded in millions of the
local currency. For the empirical work, we converted flow numbers such as sales into US
dollars by using the average of the daily exchange rates over the fiscal year. Stock
numbers such as total assets were converted into US dollars based on the exchange rate
on the last day of the fiscal year. When an exchange rate was unavailable on the last date,
we used the most recent exchange rate before the fiscal year end date. Daily exchange
rates are from www.federalreserve.gov.
All financial data items obtained are audited historical numbers.4 In general, all
flow numbers were measured over twelve months; however, to minimize data loss, when
a firm reported either 13 months or 11 months of data, we converted those numbers into
4 That is, we do not employ voluntarily disclosed non-GAAP numbers or unaudited pro forma numbers.

10
12 month values. If a firm reported flow numbers for more than 13 months or less than 11
months, we set those numbers to missing. Additionally, if a firm changed its fiscal year,
data for the year of the fiscal year change was set to missing. For stock numbers, we
collected the numbers reported on the fiscal year end date; if the only balance sheet numbers
available were reported on a date other than the fiscal year end date, we set those numbers to
missing. Detailed definitions of financial statement variables are provided in Appendix A.
3. Descriptive Statistics
Table 3 presents descriptive statistics for several offering variables. All variables, except
for the auditor reputation dummy variable, are winsorized at the 1% and 99% levels. Because
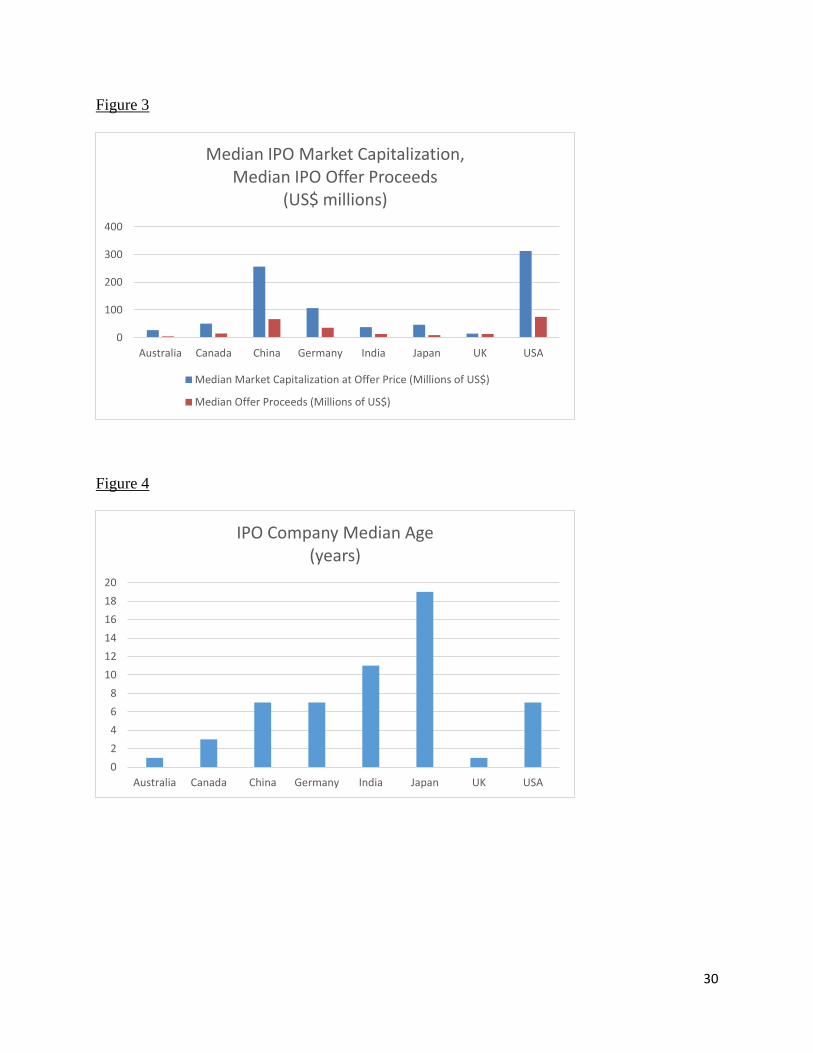
most of the variables are skewed, we discuss only median values. Our primary dependent
variable is post-IPO market capitalization measured as the product of offer price and shares
outstanding on completion of the offering (MCAP). To achieve comparability, MCAP is
expressed in US dollars using exchange rates on the offer date.5 U.S. IPOs record the highest
median MCAP ($312.8 Million), followed by China ($256.3 million), and then by Canada at a
distant third ($50.4 million). Median offering proceeds are largest for U.S. ($75.0 million), and
smallest for Australia ($4.8 million). Median offer prices range from $770 for Japan to $0.32 for
Australia.
Prior literature has documented that insider retention (percentage of offering retained by
insiders) is a significant determinant of IPO valuation. We compute insider retention by
subtracting secondary shares sold during the IPO from shares outstanding before the IPO and
5 SDC also provides offer prices in US dollars. However, because there were (a) several errors in SDC-based offer
dates and (b) relatively fewer errors in local currency offer prices that we correct, we compute dollar value market
capitalization using corrected offer prices and exchange rates on the corrected offer dates. Daily exchanges rates are
from www.federalreserve.gov.
11
dividing that difference by post-IPO shares outstanding. Table 3 indicates that median
post-IPO insider retention varies from 61% in Australia to 80% in Japan. We also report
data on the frequency of secondary offerings. Secondary offerings are very frequent in
Japan with 89% of Japanese IPOs having a secondary component. At the other extreme,
only 3% of Chinese IPOs have a secondary component.
A large body of evidence documents that IPOs are underpriced and that first day
prices are higher than offer prices, on average. Table 3 indicates that this is true of our
sample as well, with two additional insights. First, the mean percentage change in price
from offer to open is indeed positive for all eight countries, ranging from 1% for Japan to
182% for U.K. However, medians are negative for Australia (-18%), Germany (-6%) and
Japan (-8%). Second, the underpricing evidence is largely driven by the change from the
offer to the first day open. The magnitude of price changes from open to close on the first
day are relatively small. Mean open-to-close percent change ranges from -1% for
Australia and Canada to 4% for China and U.K.; medians range from -2% to 2%.
Table 3 also reports descriptive statistics for our three non-financial value drivers:
age, underwriter reputation and auditor reputation. IPO firms in Australia, Canada, and
U.K. are relatively young with a median age of one to three years. Japanese and Indian
IPOs have the highest median ages of 11 and 19 years, respectively. Chinese, German,
and U.S. firms have a median age of seven years. Median underwriter reputation values
are highest for Japan and U.S. (0.89, 0.81). For the other countries, median reputation
values range from 0.55 for Australia to 0.75 for China. The frequency with which IPO
firms employ Big-N auditors varies considerably across countries, ranging from a mere
3% in China to 85% in Japan and 87% in the U.S. Overall, it appears that U.S. and
12
Japanese firms prefer high reputation auditors and underwriters. Alternately stated, the audit
markets in U.S. and Japan are more oligopolistic than those of other countries.
Lastly, we report means and medians for pre-IPO industry PE ratios and 3-month market
returns. Median industry multiples, except for China, range from 10 to 25; these numbers are
comparable with the median PE ratio of 24 for the S&P 500 over our sample period, 1998-2015
(source: http://www.multpl.com/table). Median Chinese industry PEs are relatively high at 44.
Pre-IPO market returns are in general positive, median returns ranging from 1.6% to 4.7%.
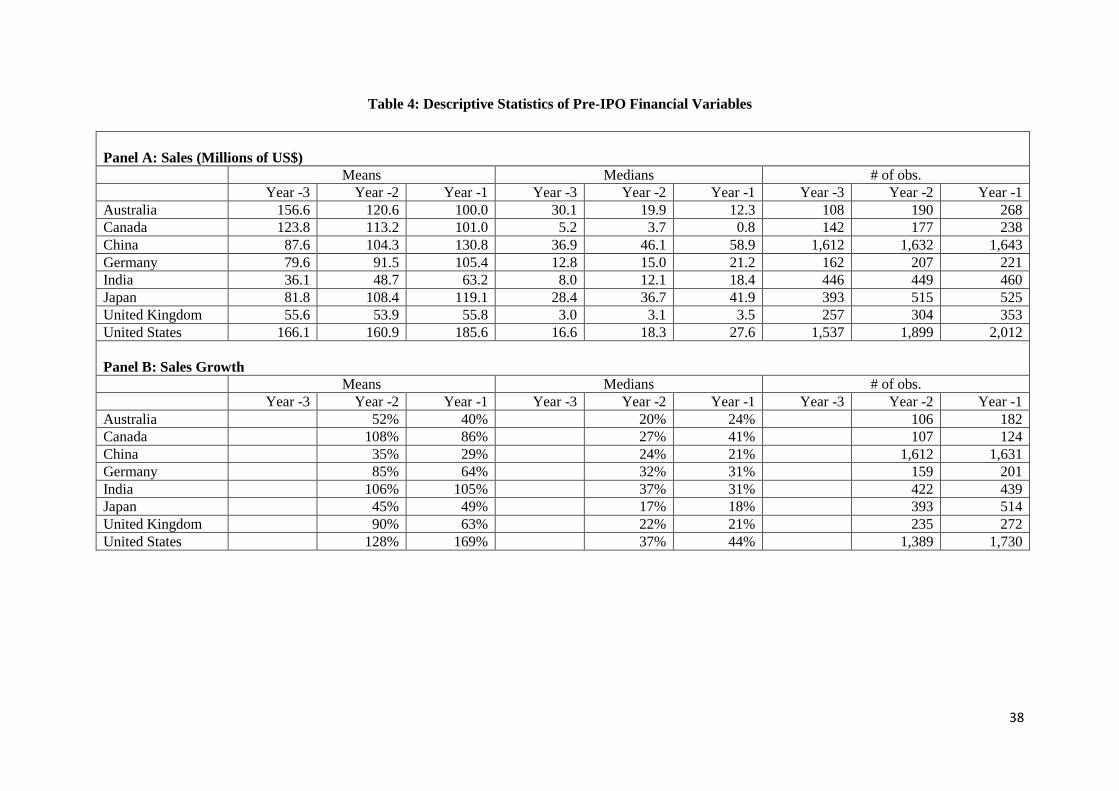
Table 4 reports, via a series of panels, the mean and median values of several financial
indicators over years -3 to -1. Again, all variables are winsorized at the 1% and 99% levels.
Panel A reports that median sales increases monotonically for six of the eight countries;
Australian and Canadian IPOs record average declining sales. The surprising decline for these
two countries can be explained by the fact that their sample sizes increases from year -3 to -1 and
the firms that enter the sample for the first time in year -1 tend to have low sales.6 Panel B
presents sales growth rates in year -2 and -1. Median sales growth rates in year -2 range from
17% for Japanese firms to 37% for U.S. firms. In year -1, growth rates decline for China,
Germany, India, and U.K., but rise for the remaining countries.
[Insert Table 4 here]
Panels C and D in Table 4 provide information on pre-IPO trends in Return on Assets
(ROA) and loss frequency. Return on Assets is defined as income before extraordinary items
divided by ending total assets. While the median Australian, Canadian, and U.S. firm is in the
red or fails to achieve profitability for all three pre-IPO years, the median firms in the other five
6 Australian and Canadian IPO market is dominated by mining firms that tend to have no operations and hence no
revenues before the IPO.
13
countries generate positive ROA in all three years. Further, median ROA trends upward
in India and Japan. In data in Panel D, suggest that pre-IPO loss frequencies in the three
Asian countries – China, India, and Japan, are relatively low, ranging from 0% to 6%. In
contrast, close to two-thirds of the U.S. and Canadian firms are unable to turn a profit in
year -1.
To gain further understanding of the profit differentials across countries, we
present in Panels E and F, a decomposition of ROA into operating cash flows scaled by
total assets and its complement, accruals scaled by total assets (accruals = income before
extraordinary items – operating cash flows). The poor profitability of U.S. and Canadian
firms holds up even with operating cash flows – median numbers are negative for all
three years. The median IPO firm in the remaining six countries are generating positive
operating cash flows in all three years; however, only Japanese firms report a strictly
monotonic trend.
Because accruals tend to be dominated by a large negative accrual – depreciation,
we expect average pre-IPO accruals to be negative. Surprisingly, median accruals
divided by assets are positive for all three years for China and India, ranging from1% to
3%. The unusual nature of these positive accruals becomes more stark, when contrasted
with the median accruals divided by assets for all U.S. firms on COMPUSTAT for our
sample period. This number is -6%. While a portion of the positive accruals can be
attributed to high sales growth rates, the possibility that Chinese and Indian firms are
managing their pre-IPO accruals upward remains. For the other six countries, median
accruals scaled by assets are in general negative, as expected, and do not display any
particular trend.

14
We also examine the investing patterns of IPO firms before they conduct their offerings.
Panel G and H report averages for R&D deflated by assets, when R&D is non-zero, and capital
expenditures deflated by assets. U.S. and Canadian firms are the most R&D intensive with R&D
rates ranging from 26% to 29% – this partly explains the poor profitability of IPOs in these two
countries. India and Japanese IPOs fall on the low end of the R&D investing spectrum with
R&D rates of only 1% to 2% of assets in the year before the IPO. With respect to median capital
expenditure spending rates, Panel H indicates that IPO firms in all eight countries display an
increasing trend over years -3 to -1.
Panel I and J report data on two balance sheet characteristics – book value of equity (in
millions of $) and long-term debt to assets ratio. Except for U.S. firms that have a small negative
median book value, IPO firms in general report a positive book value of equity. In terms of
leverage, Indian firms have the highest levels, 24% in the year before the offering. The median
German and Japanese firm funds about 10% to 11% of their assets with long-term debt. Pre-IPO
leverage is relatively low for other countries.
Figures 3 through 9 illustrate some of the key descriptive statistics.
[Insert Figures 3 through 9 here]
4. IPO Valuation
4.1. Cross-country differences in relation of financial variables to IPO valuation
Our research objective is to examine the relation between IPO market valuations and
financial variables and document the existence and magnitude of cross-country differences in the
same. To do so, we estimate a simple and parsimonious valuation model estimated for U.S.
mergers by Rhodes-Kropf, Robinson, and Viswanathan (2005, RRV hereafter). The model,

15
which is an adaptation of the seminal work of Ohlson (1990), is specified for each
country j as follows:
𝐿𝑂𝐺𝑀𝐶𝐴𝑃𝑗 = 0𝑗 + 1𝑗𝐵𝑉𝑗 + 2𝑗𝐿𝑂𝐺𝐴𝐵𝑆𝑁𝐼𝑗 + 3𝑗𝐿𝑂𝑆𝑆𝐷𝑈𝑀 ∗ 𝐿𝑂𝐺𝐴𝐵𝑆𝑁𝐼𝑗 + 2𝑗𝐿𝐸𝑉𝑗 + 𝑗 (2)
where LOGMCAP is the log of market value of equity on the offer date, BV is the book value of
common equity at the end of the year before the offering (year -1), LOGABSNI is the log of the
absolute value of income before extraordinary items in year -1, LOSSDUM is a dummy variable
that equals one when income before extraordinary items in year -1 is negative and 0 otherwise,
and LEV is the ratio of long-term debt to total assets as the end of year -1.
We employ log values for market capitalization and absolute value of income
before extraordinary items in light of the significant skewness in these variables. By
interacting LOSSDUM and LOGABSNI, we allow for the valuation of income to differ
based on its sign. We expect the coefficients of BV and ABSNI, 1 and 2, to be
positive. Because loss firms tend to have income that is less persistent, we expect 3 to be
negative. RRV interpret leverage as a proxy for cost of capital and expect that higher
leverage will be associated with lower market values. Alternately, leverage can also be
viewed a source of monitoring that could benefit shareholders (Jensen (1989)). Under
this interpretation, the sign of the coefficient on leverage would be positive.
We first estimate Eq. (2) for each country j, individually. Then, we estimate a
global valuation model that combines data for all eight countries and allows us to test for
differences in coefficients of value-drivers across countries. All variables, except dummy
variables, are winsorized at the 1% and 99% levels. Standard errors are adjusted for
heteroscedasticity and clustering across firms within each year. For the country-level

16
models, financial variables are in local currencies; for the global valuation model, financial data
are expressed in US$.
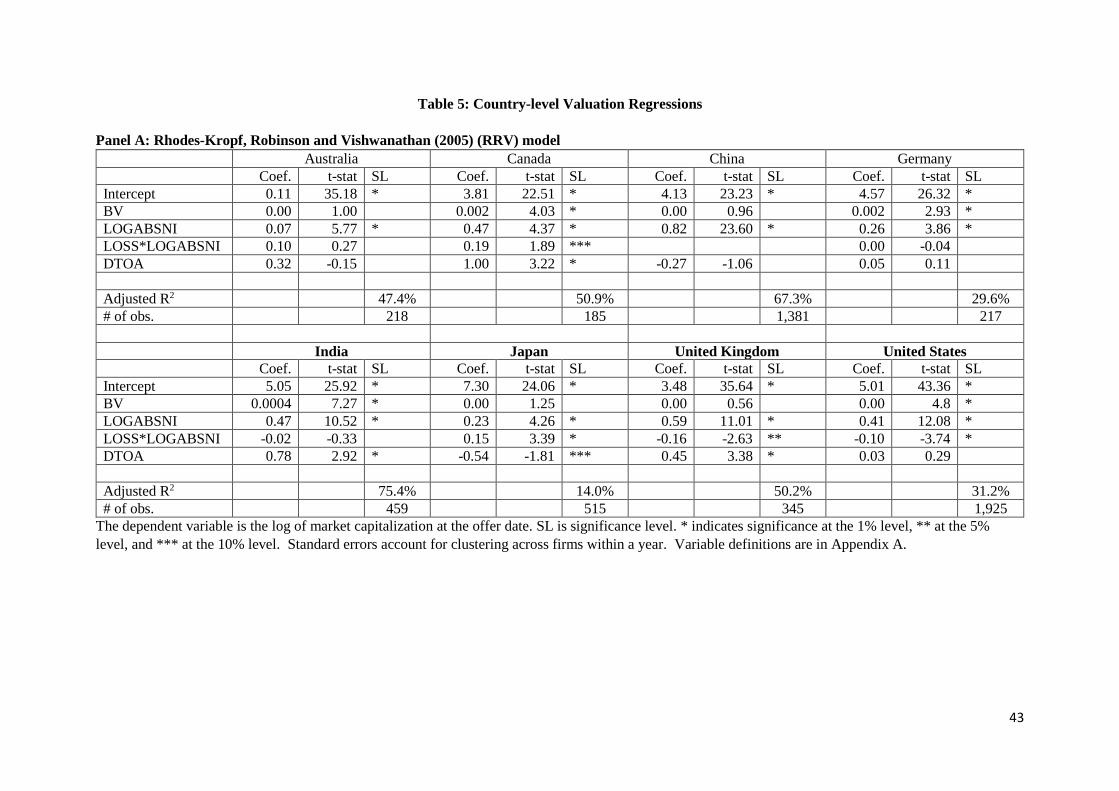
Table 5, Panel A, presents the results for the RRV valuation model for IPOs in the eight
countries. As expected, income before extraordinary items (LOGABSNI) is positively related to
IPO valuation in each of the eight countries. The economic impact of net income is largest for
Chinese IPOs and smallest for Australian IPOs. Specifically, a one percent increase in net
income in China is associated with a 0.82% increase in IPO valuation. A one percent increase in
net income in Australia is associated with a mere 0.07% increase in IPO valuation. In contrast to
income, book value of equity which reflects assets in place is valued significantly in only four
countries: Canada, Germany, India, and U.S. We do not observe a significant relation between
book value and IPO valuation for Australia, China, Japan, and U.K.
The interaction between the LOSS dummy and ABSNI measures the differential
valuation of loss firms and profitable firms. For IPOs in the U.S., the valuation effect of income
when it is negative is lower than when it is positive; the magnitude of this differential is,
however, economically small with a coefficient of -0.10 on the interaction. We find that LOSS
times ABSNI and IPO value are negatively related for U.K. IPOs as well. However, Canadian
and Japanese IPOs that have incurred a loss in earnings are associated with a higher valuation.
We do not observe a statistically significant loss-versus-profit valuation differentials for
Australia, Germany, and India. Because all Chinese firms report positive pre-IPO profits, the
loss-profit interaction is not relevant for them.
The results in Panel A of Table 5 indicate that leverage’s effect on market capitalization
varies across countries. The effect is positive and statistically significant in Canada, India, and
U.K., consistent with the idea that debt provides monitoring benefits to shareholders. However, it
17
is negative and significant in Japan, suggesting that Japanese investors interpret it as a
proxy for cost of capital. Leverage is not significantly related to market values in
Australia, China, Germany, and the U.S.
Table 5, Panel B, highlights the results for the RRV valuation model augmented
with investment, growth, and non-financial variables for the IPOs in the eight different
countries. The magnitudes and significance of the coefficients of the RRV model for
China and Germany are similar to those reported in Panel A. While ABSNI loses
statistical significance in Canada and Japan, BV becomes statistically and significantly
related to market values in Australia and Japan. Further, BV is no longer significantly
related to value for Canadian firms. In terms of the differential valuation of loss firms,
the results change for U.K. firms alone; LOSS*ABSNI remains negatively related to
market values, but is no longer statistically significant. Lastly, leverage is no longer
significantly related to market value for Canadian and Indian firms; interestingly,
leverage is valued positively by U.S. investors under the augmented RRV model.
IPOs are usually associated with growth companies. Most of the value of a growth
company is in their growth opportunities, and less in assets in place. We consider four
proxies for growth opportunities: capital expenditures (CAPEX), R&D expenditures
(RD), sales growth rate (SGRO), and industry price to earnings ratio (INDPE). Panel B,
Table 5 indicates that capital expenditures are significantly and positively related to IPO
valuation in Canada, Germany, India, U.K., and U.S. A one percent increase in capital
expenditure is associated with a 0.25% increase in valuation in Canada, but only 0.11%
increase in valuation in India (estimates for Germany, U.K., and U.S. are between the
above estimates). There is no significant relation between capital expenditure and IPO
18
valuation in China and Japan; the relation in Australia is positive but only marginally significant.
In general, we do not find a statistically significant relation between IPO valuation and
either R&D expenditures or sales growth. The exceptions are Germany for R&D and U.S. for
sales growth.7 We find a positive and significant relation between industry price to earnings
ratios and IPO values for Japan, a marginally significant and positive relation for Germany and
India, and no significant relationship for Australia, Canada, China, U.K., and U.S. Overall,
capital expenditures appear to be the most important driver of value from our four indicators of
growth opportunities.
4.2. Cross-country differences in relation of non-financial variables to IPO valuation
In addition to being high growth firms, IPO firms are perceived as facing considerable
uncertainty about future cash flows. Given the importance of future cash flows to IPO valuation,
knowledgeable insiders may choose to communicate their information about future cash flows
via costly and credible signals. We consider three such credible signals: ownership in the IPO
firm retained by key insiders during the IPO (RETENTION), choice of underwriter (UNDREP),
and choice of public accounting auditor (BIGN_AUD). Further, because younger firms are
likely to have more uncertain cash flows, we include the age of the firm as a fourth measure of
uncertainty.
We find a positive and statistically significant relation between insider retention and IPO
valuation in China, Germany, U.K., and U.S.; positive but marginally significant relationship for
India and Japan; and no significant relationship for Australia and Canada. Underwriter reputation
has a positive and statistically significant relationship for IPOs in China, Germany, India, U.K.,
7 Unfortunately, the GTA database from which we obtain financial data for Chinese firms does not report R&D
spending.

19
and U.S.; marginally positive relationship for Canada and Japan, and no significant
relationship for Australia. Auditor reputation is positively and statistically significantly
related to market values in U.K.; marginally positive for Canada, Germany, Japan, and
U.S.; and not significant related for Australia, China, and India. Age influences valuation
only in India and China and that too in opposite ways. In India, as expected, older firms
garner higher valuations; but in China younger firms are valued relatively higher.
In Table 6, we report the results of a global valuation model that combines data for
all eight countries. We include all variables from the augmented RRV model except R&D
and INDPE; we exclude these two variables to minimize sample size reduction because of
missing data. To formally test for differences across countries in mean valuations as well
as in the coefficients of the augmented RRV model, we include country dummies for seven
countries and the interactions between these dummy variables and the variables in the
augmented RRV model. In terms of estimation method, we report results based on OLS as
well as quantile regression. The latter is robust to the effect of outliers in the data;
therefore, in our discussion, we emphasize results that are consistent across the two
estimation methods.
Because we choose U.S. as the base country, the coefficients on the main
independent variables measure the effect of these variables on market values for U.S.
firms. The interaction term coefficients measure the country-level differences in valuation
effects relative to U.S. firms. Our first key finding is that, for U.S. firms, the effect of most
of the independent variables are significant and in the expected direction. Absolute value
of net income and book value of equity, are positively related to market capitalization and
loss firms’ net income are valued less. Leverage is valued positively consistent with a

20
monitoring effect. Among the growth variables, capital expenditures alone are valued positively
and significantly under both estimation methods. Market valuations are increasing in our three
non-financial signals – insider retention, underwriter reputation, and auditor reputation.
Our second finding relates to the country level dummies. Among the seven countries, the
dummy on China alone is negative and significant at the 1% level – after controlling for firm
characteristics, Chinese firms alone are valued less than U.S. firms. The cause for this difference
is an interesting subject for future research.
Our third set of findings relate to the relative differences in the effect of various value-
drivers between U.S. and the other seven countries. We summarize these findings:
1. The absolute value of net income of IPO firms in Australia, China, India, and U.K. is
valued more than that of U.S. firms. Negative values of income are valued more for
Canadian IPOs.
2. The book value of equity of German and Japanese firms are valued more, whereas the
book value of Chinese firms is valued less, relative to that of U.S. firms
The cross-country differences in the valuation could be attributed to the differences in
financial reporting standards. For example, the accounting and finance literatures document that
earnings opacity and financial reporting standards influences a range of capital market outcomes
(Bhattacharya, Daouk, and Welker (2003), Gelos and Wei (2005), Jin and Myers (2006)).
Difference in investor sophistication across countries could also drive these differences. For
example, while U.S. IPOs are largely bought by institutional investors, in India, retail investors
have significant participation. More research that disentangles these alternate explanations is
needed.

21
Turning to the other value drivers, the results in Table 6 indicate that non-U.S.
investors value some of the other value drivers differently. Leverage of Japanese firms is
valued less compared to that of U.S. firms, capital expenditures of Chinese firms are
valued less, and sales growth of Japanese firms is valued more. The value effects of
insider retention and underwriter reputation differ for multiple countries compare to U.S.
Auditor reputation is more significantly related to value for Canadian firms. Lastly, Age is
less important as a value driver for Chinese and Japanese firms.
4.3. Intertemporal differences in relation of financial and non-financial variables to IPO
valuation
Table 7 highlights the intertemporal differences in impact of financial and non-
financial variables on IPO valuation. Book value is not consistently related to IPO
valuation during 1998-2015. Net income is positively and statistically significantly related
to IPO valuation, and this relationship has strengthened during the years 1998-2015. For
example, a 1% increase in net income in 1998 is associated with a 0.15% increase in IPO
value, whereas a 1% increase in net income is associated with a 0.53% increase in IPO
value in 2015. Capital expenditure is positively and significantly related to IPO value, and
this relation appears to be stable over time; for example, a 1% increase in capital
expenditure in 2015 is associated with a 0.12% increase in IPO value. The relationship
between insider retention and IPO value is positive and statistically significant during
1998-2002; this relation is still positive, though statistically less significant, during 2013-
2015. Underwriter reputation is positively and significantly related to IPO value in most
years with no clear time trend. The relation between Big-N public accounting firm and IPO

22
is mostly (though, not always) positive; this relation is positive and statistically significant for
the most recent sub-period, 2013-2015.
5. Summary and conclusions
Valuation of initial public offerings, IPOs, occupies an important place in finance, perhaps
because an IPO provides public capital market participants their first opportunity to value a set of
corporate assets and growth opportunities. Valuation of IPOs is also quite relevant from an
economic efficiency perspective: the IPO is the first opportunity that managers of such (usually
young) companies get to observe price signals from the public capital markets. Such signals can
either affirm or repudiate management’s beliefs regarding the firm’s future growth opportunities,
which have obvious implications for real economic activity – for example, employment and
corporate investment.
In this chapter, we study the valuation of 6,199 IPOs during 1998-2015 for the following
countries: Australia, Canada, China, Germany, India, Japan, U.K., and U.S. Net income is
positively related to IPO valuation in each of the eight countries. The economic impact of net
income is largest for Chinese IPOs and smallest for Australian IPOs. Book value is positively
and significantly related to IPO valuation in only Canada, Germany, India, and U.S. Capital
expenditure is significantly and positively related to IPO valuation in only Canada, Germany,
India, U.K., and U.S. We find a positive and statistically significant relation between insider
retention and IPO valuation only in China, Germany, U.K., and U.S.; positive but marginally
significant relationship for India and Japan. Underwriter reputation has a positive and
statistically significant relationship for IPOs only in China, Germany, India, U.K., and U.S. Net
income is positively and statistically significantly related to IPO valuation during the years 1998-
2015, and this relationship has strengthened over time. Capital expenditure is positively and

23
significantly related to IPO value during 1998-2015, and this relation appears to be stable
over time.

24
Appendix A: Variable definitions
Variable Definition
LOGMCAP Log of the product of shares outstanding after the IPO and offer price
BV Shareholder’s equity excluding minority interest / non-controlling
interest and redeemable common stock.
LOGABSNI Log of absolute value of profit. Profit excludes extraordinary items
(also labelled as exceptional items or as abnormal items),
discontinued operations, and the effect of changes in accounting
methods. Minority interest / Non-controlling interest is excluded.
LOSS Dummy Variable that Equals 1 if a firm reported a loss in year -1,
and 0 otherwise
DTOA Ratio of long-term debt to total assets. Long-term Debt is the sum of
all interest-bearing debt that was reported in the non-current
liabilities section of the balance sheet: notes, debt, borrowings,
capital lease obligations. Because we are interested in the role of debt
as a source of monitoring, we exclude loans from related parties.
LOG_RD Log of research and development costs. Research & Development
(R&D) costs are obtained from the Income Statement or by searching
prospectuses for the following key words: “research,” “R&D,” and
“Product development.” Where a firm indicated that they had
incurred R&D costs but did not disclose the amount, we chose to set
R&D to equal zero. If R&D is equal to zero, we reset it to equal to
one-half of the smallest R&D value during 1998-2015, for the
country to which the firm belonged. This adjustment allows us to
apply the log transformation.
LOG_CAPEX Log of capital expenditures, where capital expenditures is the sum of
payments for property, plant, and equipment, acquisitions, and
investments in subsidiaries, joint ventures, and associates.
LOG_SGRO Change in sales in year -1 relative to year -2 divided by sales in year -
2. Sales included revenues from all operating sources; we exclude
financial and other non-operating income. For bio-technology firms,
we include government grant income.
IND_PE The median Industry PE. To measure industry PE, for each IPO firm,
we obtain the market capitalizations at the end of the month before
the offering date for all firms in that firm’s country that had the same
2-digit SIC code (industry-peers). We chose two-digit SIC codes to
minimize data loss because of industries having too few firms. For
these industry peers, we obtain the income before extraordinary items
in the most recent year relative to the month-end at which market
capitalization is measured. We compute industry median price-to-
earnings (market capitalization divided by income before
extraordinary items). Market capitalization and income before
extraordinary items are from CRSP and North America
COMPUSTAT for U.S. firms, Global Compustat for firms from

25
Australia, Canada, China, Germany, Japan, and United Kingdom and
from the CMIE Prowess database for Indian firms.
RETENTION Shares outstanding before the offering minus secondary shares sold
during the offering, divided by shares outstanding before the offering
AGE Difference between offering year based on offer date and the
founding year
UNDREP To measure underwriter reputation, we employ the method of
Megginson and Weiss (1991). For each underwriter j and for every
year t, we define xjt as the three-year moving average (t-3, t-2, t-1) of
IPO proceeds. Then, for the set of underwriters I, for the year t, the
Megginson-Weiss rank for underwriter j is:
log (𝑥𝑗𝑡)
𝑀𝑎𝑥𝑗∈𝐼[log(𝑥𝑗𝑡)]
BIGN_AUD Dummy Variable that equals 1 if the firm’s auditors is one of Big-N
auditors, zero otherwise.
AUS Dummy variable that equals 1 for Australian IPO, zero otherwise
CAN Dummy variable that equals 1 for Canadian IPO, zero otherwise
CHN Dummy variable that equals 1 for Chinese IPO, zero otherwise
GER Dummy variable that equals 1 for German IPO, zero otherwise
IND Dummy variable that equals 1 for Indian IPO, zero otherwise
JAP Dummy variable that equals 1 for Japanese IPO, zero otherwise
U.K. Dummy variable that equals 1 for U.K. IPO, zero otherwise
Market Return We obtain market-wide returns for the eight countries measured as
the sum of 63 daily eturns ending on the date before the offer date.
For U.S. firms, we use the value-weighted market return from CRSP.
For the other seven countries, daily market returns are computed as
percentage changes in country level indices. The indices we used to
compute market returns are:
Australia S&P ASX 200
Canada S&P/TSX Composite
China Shanghai A Index
Germany DAX 30
India BSE Sensex
Japan Nikkei 225
U.K. FTSE 100

26
References
Aggarwal, R., S. Bhagat, and S. Rangan. 2009. The Impact of Fundamentals on IPO Valuation.
Financial Management 38, 253-284.
Barth, M.E., Beaver, W.H., Landsman, W.R., 2001. The relevance of the value-relevance
literature for financial accounting standard setting: another view. Journal of Accounting and
Economics 31, 77–104.
Bhattacharya, U., H. Daouk, and M. Welker, 2003. The world price of earnings opacity.
Accounting Review 78, 641–678.
Caglio, C., K. Hanley, and J. Westburg. 2010. Going Public Abroad. Working Paper, Securities
Exchange Commission.
Carpentier, C., D. Cumming, and J. Suret. 2012. The value of capital market regulation: IPOs
versus reverse mergers. Journal of Empirical Legal Studies 9, 56-91.
Collins, D.W., Maydew, E.L., Weiss, I.S., 1997. Changes in the value-relevance of earnings and
book values over the past 40 years. Journal of Accounting and Economics 24, 39–67.
Cumming, D., A. Knill, and K. Syvrud. 2016. Do international investors enhance private firm
value? Evidence from venture capital. Journal of International Business Studies 47, 347-373.
Gelos, R., and S. Wei. 2005. Transparency and international portfolio holdings. Journal of
Finance 60, 2987–3020.
Henderson, B., N. Jegadeesh, and M. Weisbach. 2006. World markets for raising new capital.
Journal of Financial Economics 82, 63–101.
Johan, S.A. 2010. Listing standards as a signal of IPO preparedness and quality. International
Review of Law and Economics 30, 128-144.
27
Jensen, M., 1989. Eclipse of the public corporation, Harvard Business Review September /
October, 61-74.
Jin, L., and S. Myers. 2006. R2 around the world: new theory and new tests. Journal of Financial
Economics 79, 257–292.
Kim, W., and M. Weisbach. 2008. Motivations for public equity offers: An international
perspective. Journal of Financial Economics 87, 281–307.
Kim, M., and J. Ritter. 1999. Valuing IPOs. Journal of Financial Economics 53, 409-437.
Klein. A. 1996. Can Investors Use the Prospectus to Price Initial Public Offerings? The Journal of
Financial Statement Analysis 2, 23-40.
Kothari, S., 2001. Capital markets research in accounting. Journal of Accounting and Economics
31, 105–231.
La Porta, R., F. Lopez-de-Silanes, A. Shleifer, and R. Vishny. 1997. Legal determinants of
external finance. Journal of Finance 52, 1131–1150.
La Porta, R., F. Lopez-de-Silanes, A. Shleifer, and R. Vishny. 2002. Investor protection and
corporate valuation. Journal of Finance 57, 1147–1170.
Loughran, T., J. Ritter, K. Rydqvist. 1994. Initial public offerings: international insights. Pacific-
Basin Finance Journal 2, 165–199.
Megginson, W., and K. Weiss, 1991. Venture capitalist certification in initial public offerings,
Journal of Finance 46, 879–903.
Ohlson J. 1990. A Synthesis of Security Valuation Theory and the Role of Dividends, Cash
Flows, and Earnings. Contemporary Accounting Research 6, 648-676.
Rhodes-Kropf, M., D. T. Robinson, S. Viswanthan. 2005. Valuation waves and merger activity:
The empirical evidence, Journal of Financial Economics 77, 561-603.

28

29
Figure 1
Figure 2
Australia8%
Canada5%
China27%
Germany4%India
8%
Japan8%
UK7%
USA33%
Distribution of 6,199 IPOs in Countries during 1998-2015
Australia Canada China Germany India Japan UK USA
0
100
200
300
400
500
600
700
1998 1999 2000 2001 2002 2003 2004 2005 2006 2007 2008 2009 2010 2011 2012 2013 2014 2015
Aggregate Number of IPOs for Australia, Canada, China, Germany, India, Japan, UK, and USA
30
Figure 3
Figure 4
0
100
200
300
400
Australia Canada China Germany India Japan UK USA
Median IPO Market Capitalization, Median IPO Offer Proceeds
(US$ millions)
Median Market Capitalization at Offer Price (Millions of US$)
Median Offer Proceeds (Millions of US$)
0
2
4
6
8
10
12
14
16
18
20
Australia Canada China Germany India Japan UK USA
IPO Company Median Age(years)

31
Figure 5
Figure 6
0
10
20
30
40
50
60
70
Australia Canada China Germany India Japan UK USA
Median Sales of IPO Companiesduring the past 12 months
(US$ millions)
0%
5%
10%
15%
20%
25%
30%
35%
40%
45%
50%
Australia Canada China Germany India Japan UK USA
Median Sales Growth of IPO Companiesduring the past 12 months

32
Figure 7
Figure 8
0.00%
10.00%
20.00%
30.00%
40.00%
50.00%
60.00%
70.00%
Australia Canada China Germany India Japan UK USA
% of IPOs with an Earnings Loss during the past 12 months
0%
5%
10%
15%
20%
25%
30%
Australia Canada China Germany India Japan UK USA
Median R&D/Assetsduring the past 12 months
(when R&D is non-zero)

33
Figure 9
0%
2%
4%
6%
8%
10%
12%
Australia Canada China Germany India Japan UK USA
Median Capital Expenditure / Assetsduring the past 12 months

34
Table 1: Sample Selection Screens for International IPOs, 1998-2015
All Australia Canada China Germany India Japan U.K. U.S.
Start: 21,527 2,205 4,061 4,677 955 958 2,193 1,890 4,588
(-) Financial Firms 5,757 402 2,546 327 116 126 362 574 1,304
(-) Privatizations 30 6 3 15 0 0 2 3 1
(-) Offerings of units (shares + warrants) 703 93 462 2 0 0 0 10 136
(-) Private placements 73 12 3 8 20 2 4 21 3
(-) Spinoffs 1,470 149 24 452 63 15 300 100 367
(-) Rights offerings 19 14 0 0 2 0 0 0 3
(-) Limited partnerships 69 1 11 1 0 0 0 3 53
(-) Loan stock, options, or flow through shares 31 1 30 0 0 0 0 0 0
(-) Not Underwritten 4 0 0 0 0 4 0 0 0
(-) Missing SEDOL and CUSIP 395 65 10 88 63 0 20 149 0
(-) Follow-on offerings 29 3 5 9 3 1 2 3 3
(-) Multiple Tranches of same IPO 2,417 120 24 1,278 261 125 126 86 397 10,534 1,342 943 2,497 427 686 1,377 941 2,321
(-) Missing Prospectus or IPOs not qualifying
per screens
4,335 814 657 852 205 217 850 488 252
Final Sample: 6,199 528 286 1,645 222 469 527 453 2,069
35
Table 2: Distribution of IPOs over time (1998-2015)
Year Frequency Frequency%
All All Australia Canada China Germany India Japan U.K. U.S.
1998 332 5% 1% 6% 5% 6% 0% 2% 3% 9%
1999 553 9% 5% 6% 3% 18% 0% 4% 1% 19%
2000 659 11% 6% 9% 6% 32% 3% 9% 14% 15%
2001 182 3% 1% 1% 3% 5% 0% 7% 6% 3%
2002 148 2% 2% 3% 2% 1% 0% 4% 6% 2%
2003 193 3% 5% 1% 3% 0% 1% 6% 4% 2%
2004 414 7% 10% 6% 5% 1% 4% 6% 15% 7%
2005 347 6% 10% 6% 1% 2% 10% 7% 13% 6%
2006 440 7% 13% 6% 3% 11% 14% 9% 9% 6%
2007 506 8% 18% 12% 6% 11% 16% 5% 7% 6%
2008 166 3% 3% 6% 4% 1% 7% 2% 1% 1%
2009 177 3% 4% 4% 6% 0% 3% 0% 0% 2%
2010 493 8% 5% 8% 19% 2% 10% 3% 2% 3%
2011 421 7% 3% 9% 15% 4% 6% 4% 1% 3%
2012 252 4% 2% 6% 5% 3% 3% 6% 2% 3%
2013 190 3% 3% 5% 0% 0% 4% 6% 4% 4%
2014 336 5% 5% 2% 5% 1% 6% 9% 8% 5%
2015 390 6% 5% 3% 9% 1% 12% 11% 4% 3%
6,199 528 286 1,645 222 469 527 453 2,069

36
Table 3: Offering Descriptive Statistics
Australia Canada China Germany India Japan United
Kingdom
United States
Market Cap. at Offer
Price (Millions of US$)
Mean 118.2 192.6 430.0 208.1 205.1 111.4 65.7 561.9
Median 27.2 50.4 256.3 106.5 38.0 46.7 14.6 312.8
# of obs. 528 286 1,645 222 469 527 453 2,069
Offer Proceeds
(Millions of US$)
Mean 29.1 52.0 99.7 71.1 37.8 22.8 52.4 119.1
Median 4.8 14.8 66.9 35.6 13.0 9.1 13.2 75.0
# of obs. 528 286 1,645 222 469 527 453 2,069
Offer Price (US$)
Mean 0.80 4.62 2.65 19.55 3.13 770.04 0.73 13.50
Median 0.32 1.96 2.07 15.98 1.83 19.96 0.49 13.00
# of obs. 528 286 1,645 222 469 527 453 2,069
Insider Retention
Mean 61% 66% 73% 67% 69% 79% 63% 73%
Median 61% 71% 75% 71% 72% 80% 66% 75%
# of obs. 528 286 1,639 222 469 527 453 2,069
Secondary Offerings
Frequency 12% 12% 3% 65% 17% 89% 34% 29%
# of obs. 528 286 1,645 222 469 527 453 2,069
First day Close (US$)
Mean 2.26 5.76 3.95 29.20 3.94 449.97 2.41 20.03
Median 0.30 2.52 3.27 12.28 2.18 19.36 1.13 15.50
# of obs. 512 269 1,645 215 467 526 449 1,987
First Day Open (US$)
Mean 1.68 5.34 3.82 20.36 3.73 22.85 2.22 19.00
Median 0.30 2.19 3.15 12.15 2.14 15.35 1.05 15.25
# of obs. 509 266 1,645 214 467 377 435 1,970

37
% Change from Offer
to First Day Open
Mean 7% 30% 68% 15% 18% 1% 182% 31%
Median -18% 6% 43% -6% 8% -8% 199% 11%
# of obs. 509 266 1,645 214 467 377 435 1,970
% Change from First
Day Open to Close
Mean -1% -1% 4% 1% 3% 0% 4% 3%
Median -2% 0% 2% 0% 0% 0% 1% 0%
# of obs. 509 265 1,645 214 467 377 435 1,970
Age
Mean 4.6 6.0 7.3 11.3 13.3 25.4 4.0 12.5
Median 1.0 3.0 7.0 7.0 11.0 19.0 1.0 7.0
# of obs. 500 286 1,645 222 469 523 453 2,069
Underwriter
Reputation
Mean 0.55 0.57 0.74 0.67 0.59 0.80 0.58 0.77
Median 0.59 0.60 0.75 0.68 0.55 0.89 0.58 0.81
# of obs. 528 286 1,645 222 469 527 453 2,069
Big N Auditor
Frequency (%) 32% 55% 3% 40% 15% 85% 42% 87%
# of obs. 528 286 1,645 222 469 257 453 2,067
Industry PE
Mean 18.0 47.7 33.4 13.0 21.6 22.3 24.7
Median 16.7 46.4 20.7 10.8 20.3 21.5 24.4
# of obs. 513 0 1,577 215 457 521 446 2,067
Pre-Offering 63 Day
Return
Mean 2.9% 2.8% 3.3% 2.5% 5.6% 3.4% 2.5% 3.8%
Median 2.1% 1.9% 3.0% 2.8% 4.7% 2.6% 1.6% 4.5%
# of obs. 528 286 1,645 222 469 527 453 2,069
Variable Definitions are in Appendix A.
38
Table 4: Descriptive Statistics of Pre-IPO Financial Variables
Panel A: Sales (Millions of US$)
Means Medians # of obs.
Year -3 Year -2 Year -1 Year -3 Year -2 Year -1 Year -3 Year -2 Year -1
Australia 156.6 120.6 100.0 30.1 19.9 12.3 108 190 268
Canada 123.8 113.2 101.0 5.2 3.7 0.8 142 177 238
China 87.6 104.3 130.8 36.9 46.1 58.9 1,612 1,632 1,643
Germany 79.6 91.5 105.4 12.8 15.0 21.2 162 207 221
India 36.1 48.7 63.2 8.0 12.1 18.4 446 449 460
Japan 81.8 108.4 119.1 28.4 36.7 41.9 393 515 525
United Kingdom 55.6 53.9 55.8 3.0 3.1 3.5 257 304 353
United States 166.1 160.9 185.6 16.6 18.3 27.6 1,537 1,899 2,012
Panel B: Sales Growth
Means Medians # of obs.
Year -3 Year -2 Year -1 Year -3 Year -2 Year -1 Year -3 Year -2 Year -1
Australia 52% 40% 20% 24% 106 182
Canada 108% 86% 27% 41% 107 124
China 35% 29% 24% 21% 1,612 1,631
Germany 85% 64% 32% 31% 159 201
India 106% 105% 37% 31% 422 439
Japan 45% 49% 17% 18% 393 514
United Kingdom 90% 63% 22% 21% 235 272
United States 128% 169% 37% 44% 1,389 1,730

39
Panel C: Return on Assets = Income before extraordinary items divided by total assets
Means Medians # of obs.
Year -3 Year -2 Year -1 Year -3 Year -2 Year -1 Year -3 Year -2 Year -1
Australia -10% -18% -31% -3% -4% 0% 4 29 221
Canada -60% -36% -24% -10% -3% -7% 52 174 234
China 14% 14% 14% 12% 13% 13% 1,599 1,619 1,642
Germany 11% -4% 0% 9% 3% 5% 27 206 219
India 6% 7% 8% 4% 5% 7% 441 449 459
Japan 6% 9% 10% 6% 7% 10% 397 517 524
United Kingdom -22% -29% -24% 2% 2% 1% 255 301 351
United States -47% -50% -44% -10% -15% -14% 1,324 1,865 2,008
Panel D: Loss Frequency
Means # of obs.
Year -3 Year -2 Year -1 Year -3 Year -2 Year -1
Australia 17.0% 31.5% 44.9% 100 181 264
Canada 59.2% 55.1% 65.7% 142 178 238
China 0.2% 0.0% 0.0% 1,612 1,620 1,643
Germany 27.2% 29.0% 26.7% 162 207 221
India 11.2% 7.6% 5.9% 446 449 459
Japan 10.1% 8.7% 6.1% 397 517 526
United Kingdom 44.2% 44.1% 45.6% 258 304 353
United States 65.1% 66.3% 65.4% 1,529 1,893 2,010

40
Panel E: Operating Cash Flows/Assets
Means Medians # of obs.
Year -3 Year -2 Year -1 Year -3 Year -2 Year -1 Year -3 Year -2 Year -1
Australia -10% -8% -6% 0% 0% 6% 4 27 148
Canada -32% -23% -18% -6% -2% -5% 50 171 232
China 11% 13% 12% 10% 11% 11% 1,174 1,235 1,409
Germany 10% 2% 2% 11% 8% 8% 26 190 208
India 4% 3% 3% 4% 3% 5% 398 415 428
Japan 6% 9% 9% 7% 8% 9% 26 416 465
United Kingdom -8% -14% -10% 6% 7% 7% 249 296 338
United States -30% -33% -24% -2% -5% -4% 1,270 1,847 1,999
Panel F: Accruals /Assets; Accruals = Income before extraordinary items minus Operating cash flows before discontinued operations
Means Medians # of obs.
Year -3 Year -2 Year -1 Year -3 Year -2 Year -1 Year -3 Year -2 Year -1
Australia -1% -8% -18% -2% -5% -5% 4 27 142
Canada -24% -13% -8% -7% -5% -5% 50 171 232
China 3% 2% 2% 3% 2% 2% 1,174 1,229 1,409
Germany 1% -7% -2% 0% -3% -2% 26 190 208
India 2% 3% 4% 1% 2% 2% 398 415 428
Japan 3% 0% 2% -1% 0% 1% 26 416 465
United Kingdom -14% -13% -14% -6% -7% -7% 249 296 338
United States -18% -17% -18% -8% -8% -10% 1,270 1,845 1,997

41
Panel G: Research & Development (R&D) /Assets (when R&D is non-zero)
Means Medians # of obs.
Year -3 Year -2 Year -1 Year -3 Year -2 Year -1 Year -3 Year -2 Year -1
Australia 9% 8% 34% 9% 7% 22% 2 7 24
Canada 41% 34% 22% 18% 20% 16% 22 68 77
China 0 0 0
Germany 27% 15% 15% 10% 0 45 50
India 26% 18% 14% 2% 1% 1% 19 26 28
Japan 10% 28% 1% 2% 0 119 198
United Kingdom 30% 27% 30% 14% 14% 12% 64 78 81
United States 49% 48% 41% 27% 29% 26% 806 1,171 1,248
Panel H: Capital Expenditures / Assets
Means Medians # of obs.
Year -3 Year -2 Year -1 Year -3 Year -2 Year -1 Year -3 Year -2 Year -1
Australia 6% 7% 11% 2% 3% 4% 50 89 135
Canada 6% 11% 21% 3% 5% 11% 133 172 231
China 6% 7% 9% 5% 6% 8% 1,173 1,224 1,368
Germany 6% 9% 13% 3% 5% 8% 136 190 208
India 6% 8% 12% 3% 5% 8% 402 416 429
Japan 2% 4% 6% 2% 2% 3% 3 411 481
United Kingdom 6% 7% 9% 3% 3% 4% 250 297 339
United States 7% 8% 12% 3% 4% 7% 1,453 1,853 1,968

42
Panel I: Book Value of Equity (Millions of US$)
Means Medians # of obs.
Year -3 Year -2 Year -1 Year -3 Year -2 Year -1 Year -3 Year -2 Year -1
Australia 138.1 62.6 31.7 8.2 2.7 1.6 6 31 371
Canada 1.2 10.4 21.5 0.2 0.8 0.7 53 199 282
China 35.3 46.9 61.2 18.6 26.1 34.6 1,364 1,380 1,393
Germany 46.8 18.2 21.2 15.3 2.5 5.0 27 207 220
India 13.6 18.2 25.3 2.7 4.0 6.2 443 452 465
Japan 5.9 17.0 18.4 2.2 3.1 4.0 412 518 524
United Kingdom 10.3 6.6 5.7 0.3 0.5 0.6 266 310 433
United States 26.2 20.9 19.7 0.1 -0.1 -0.1 1,416 1,936 2,059
Panel J: Long term Debt by Total Assets (%)
Means Medians # of obs.
Year -3 Year -2 Year -1 Year -3 Year -2 Year -1 Year -3 Year -2 Year -1
Australia 11% 13% 8% 0% 2% 0% 6 30 369
Canada 13% 13% 11% 0% 1% 0% 34 153 230
China 7% 7% 7% 2% 3% 3% 1,551 1,575 1,581
Germany 11% 17% 17% 0% 9% 10% 27 204 217
India 26% 26% 26% 23% 23% 24% 441 451 465
Japan 23% 19% 17% 25% 14% 11% 6 503 515
United Kingdom 24% 20% 20% 4% 5% 3% 255 304 429
United States 20% 21% 23% 4% 6% 7% 849 1,816 1,981
43
Table 5: Country-level Valuation Regressions
Panel A: Rhodes-Kropf, Robinson and Vishwanathan (2005) (RRV) model
Australia Canada China Germany
Coef. t-stat SL Coef. t-stat SL Coef. t-stat SL Coef. t-stat SL
Intercept 0.11 35.18 * 3.81 22.51 * 4.13 23.23 * 4.57 26.32 *
BV 0.00 1.00 0.002 4.03 * 0.00 0.96 0.002 2.93 *
LOGABSNI 0.07 5.77 * 0.47 4.37 * 0.82 23.60 * 0.26 3.86 *
LOSS*LOGABSNI 0.10 0.27 0.19 1.89 *** 0.00 -0.04
DTOA 0.32 -0.15 1.00 3.22 * -0.27 -1.06 0.05 0.11
Adjusted R2 47.4% 50.9% 67.3% 29.6%
# of obs. 218 185 1,381 217
India Japan United Kingdom United States
Coef. t-stat SL Coef. t-stat SL Coef. t-stat SL Coef. t-stat SL
Intercept 5.05 25.92 * 7.30 24.06 * 3.48 35.64 * 5.01 43.36 *
BV 0.0004 7.27 * 0.00 1.25 0.00 0.56 0.00 4.8 *
LOGABSNI 0.47 10.52 * 0.23 4.26 * 0.59 11.01 * 0.41 12.08 *
LOSS*LOGABSNI -0.02 -0.33 0.15 3.39 * -0.16 -2.63 ** -0.10 -3.74 *
DTOA 0.78 2.92 * -0.54 -1.81 *** 0.45 3.38 * 0.03 0.29
Adjusted R2 75.4% 14.0% 50.2% 31.2%
# of obs. 459 515 345 1,925
The dependent variable is the log of market capitalization at the offer date. SL is significance level. * indicates significance at the 1% level, ** at the 5%
level, and *** at the 10% level. Standard errors account for clustering across firms within a year. Variable definitions are in Appendix A.

44
Panel B: RRV Model, augmented with investment, growth, non-financial variables
Australia Canada China Germany
Coef. t-stat SL Coef. t-stat SL Coef. t-stat SL Coef. t-stat SL
Intercept 2.33 3.21 * 3.11 4.84 * 1.25 1.30 1.87 4.48 *
BV 0.001 5.39 * 0.00 0.39 0.00 -0.15 0.001 3.24 *
LOGABSNI 0.52 4.40 * -0.03 -0.27 0.71 22.59 * 0.27 6.38 *
LOSS*LOGABSNI -0.15 -1.19 0.20 1.84 *** -0.07 -1.25
DTOA -0.56 -1.71 0.31 0.71 0.11 0.71 0.25 1.08
LOG_CAPEX 0.15 2.40 ** 0.25 3.32 * 0.00 0.17 0.13 5.11 *
LOG_RD 0.01 0.27 0.00 0.06 0.04 1.83 ***
LOG_SGRO -0.18 -0.61 0.07 0.27 0.21 1.57 0.23 1.65
LOG_INDPE 0.28 0.85 0.11 0.58 0.15 2.45 **
RETENTION 0.45 0.60 0.08 0.14 3.32 5.11 * 1.39 5.45 *
UNDREP 0.47 0.96 1.49 2.36 ** 0.77 3.16 * 1.80 5.71 *
BIGN_AUD 0.37 1.04 0.56 1.88 *** -0.06 -0.90 0.15 1.96 ***
AGE 0.00 -1.15 0.01 0.76 -0.02 -1.75 *** 0.00 -1.31
Adjusted R2 69.2% 45.7% 73.1% 65.6%
# of obs. 65 74 1,309 179
The dependent variable is the log of market capitalization at the offer date. SL is significance level. * indicates significance at the 1% level, ** at the 5%
level, and *** at the 10% level. Standard errors account for heteroscedasticity and clustering across firms within a year. Variable definitions are in Appendix
A.

45
Panel B (Continued):
India Japan United Kingdom United States
Coef. t-stat SL Coef. t-stat SL Coef. t-stat SL Coef. t-stat SL
Intercept 2.95 8.89 * 2.55 3.64 * 1.45 2.54 ** 1.95 4.85 *
BV 0.0002 4.33 * 0.0001 2.52 ** 0.00 0.05 0.00 7.85 *
LOGABSNI 0.31 6.11 * 0.10 0.97 0.30 7.64 * 0.15 8.63 *
LOSS*LOGABSNI -0.01 -0.11 0.16 3.07 ** -0.12 -1.37 -0.06 -3.79 *
DTOA 0.13 0.50 -0.98 -2.55 ** 0.50 2.15 ** 0.25 4.83 *
LOG_CAPEX 0.11 3.97 * 0.08 1.73 0.20 6.37 * 0.12 7.86 *
LOG_RD -0.06 -1.52 0.03 0.93 0.03 1.21 0.00 0.25
LOG_SGRO -0.02 -0.29 0.10 0.76 0.01 0.06 0.03 1.80 ***
LOG_INDPE 0.16 2.30 ** 1.01 4.33 * 0.12 0.64 -0.04 -0.30
RETENTION 1.26 1.79 *** 1.81 2.72 ** 1.10 3.49 * 2.14 10.94 *
UNDREP 1.93 6.59 * 0.57 1.86 *** 1.75 9.68 * 2.24 12.28 *
BIGN_AUD 0.14 1.15 0.24 1.89 *** 0.44 5.23 * 0.21 2.70 **
AGE 0.01 3.60 * 0.00 -1.54 0.00 -0.08 0.00 0.69
Adjusted R2 81.8% 29.6% 68.4% 63.9%
# of obs. 340 228 249 1,600
The dependent variable is the log of market capitalization at the offer date. SL is significance level. * indicates significance at the 1% level, ** at the 5%
level, and *** at the 10% level. Standard errors account for heteroscedasticity and clustering across firms within a year. Variable definitions are in Appendix
A.

46
Table 6: Global Valuation Regressions for International IPOs, 1998-2015
OLS Quantile Regression
Variable Coef. t-stat SL Coef. t-stat SL
Intercept 1.86 8.06 * 1.77 12.97 *
BV 0.00 5.21 * 0.00 6.55 *
LOGABSNI 0.15 8.50 * 0.18 10.70 *
LOSS*LOGABSNI -0.07 -4.44 * -0.08 -4.71 *
DTOA 0.21 3.74 * 0.18 2.94 *
LOG_CAPEX 0.13 7.93 * 0.14 12.67 *
LOG_SGRO 0.03 1.80 *** 0.04 1.53
RETENTION 2.02 9.70 * 2.28 13.82 *
AGE 0.00 1.27
0.00 2.03 **
UNDREP 2.30 11.3 * 2.15 17.06 *
BIGN_AUD 0.22 2.59 ** 0.13 1.95 **
AUS 1.02 1.52
0.53 0.88
CAN 0.63 1.55
0.88 2.03 **
CHN -1.05 -2.42 * -1.16 -3.36 *
GER 0.01 0.01
0.45 1.17
IND -0.59 -1.15
-0.30 -0.92
JAP 0.18 0.21
0.78 1.39
UK -0.58 -1.92 * -0.51 -1.58
AUS*LOGABSNI 0.15 1.76 *** 0.14 1.83 ***
CAN*LOGABSNI -0.02 -0.17
-0.07 -1.02
CHN*LOGABSNI 0.54 16.68 * 0.53 11.59 *
GER*LOGABSNI 0.03 0.62
-0.05 -1.15
IND*LOGABSNI 0.25 5.29 * 0.25 6.86 *
JAP*LOGABSNI -0.12 -1.23
-0.07 -1.37
UK*LOGABSNI 0.17 3.48 * 0.19 4.19 *
AUS*BV 0.00 0.59
0.00 0.74
CAN*BV 0.00 1.75 *** 0.00 0.71
CHN*BV 0.00 -6.19 * 0.00 -3.64 *
GER*BV 0.00 3.33 * 0.00 2.91 *
IND*BV 0.00 2.26 ** 0.00 0.34
JAP*BV 0.00 4.77 * 0.00 5.77 *
UK*BV 0.00 -0.9
0.00 -1.04
AUS*LOSS*LOGABSNI 0.10 1.21
0.13 1.29
CAN*LOSS*LOGABSNI 0.22 2.27 ** 0.30 3.98 *
GER*LOSS*LOGABSNI 0.06 0.98
0.17 1.86 ***
IND*LOSS*LOGABSNI 0.10 1.44
0.11 1.41
JAP*LOSS*LOGABSNI 0.39 1.7
0.28 2.37 **
UK*LOSS*LOGABSNI -0.01 -0.21
0.03 0.49
AUS*DTOA -0.02 -0.04
0.34 0.77
CAN*DTOA 0.34 1.2
0.52 1.84 ***
CHN*DTOA -0.16 -0.89
-0.16 -0.62
GER*DTOA -0.02 -0.13
0.13 0.40

47
IND*DTOA 0.13 0.47
-0.06 -0.26
JAP*DTOA -0.97 -2.04 * -0.59 -1.68 ***
UK*DTOA 0.28 1.5
0.45 2.68 *
AUS*CAPEX 0.07 1.35
0.04 0.69
CAN*CAPEX 0.04 0.75
0.07 1.29
CHN*CAPEX -0.12 -5.81 * -0.12 -5.17 *
GER*CAPEX 0.02 0.99
-0.02 -0.61
IND*CAPEX -0.01 -0.42
-0.02 -0.76
JAP*CAPEX -0.05 -1.14
-0.08 -2.22 **
UK*CAPEX 0.06 1.36
0.03 0.97
AUS*SGRO -0.28 -1.59
-0.29 -1.34
CAN*SGRO 0.07 0.43
0.13 0.69
CHN*SGRO 0.15 0.95
0.17 1.62
GER*SGRO 0.17 1.53
0.15 1.14
IND*SGRO 0.01 0.08
0.01 0.14
JAP*SGRO 0.22 1.85 *** 0.28 1.88 ***
UK*SGRO -0.03 -0.26
-0.02 -0.20
AUS*RETENTION -1.31 -2.16 ** -1.19 -2.09 **
CAN*RETENTION -1.64 -3.10 * -1.58 -3.93 *
CHN*RETENTION 1.70 2.56 ** 1.58 3.28 *
GER*RETENTION -0.26 -0.76
-0.75 -1.68 ***
IND*RETENTION -0.88 -1.11
-1.06 -2.54 *
JAP*RETENTION -0.65 -0.71
-1.55 -2.58 *
UK*RETENTION -0.86 -2.98 * -1.28 -3.97 *
AUS*AGE 0.00 -1.03
-0.01 -1.03
CAN*AGE 0.00 -0.13
0.01 0.76
CHN*AGE -0.02 -1.73 *** -0.02 -5.14 *
GER*AGE -0.01 -1.97 *** -0.01 -1.44
IND*AGE 0.00 0.60
0.00 -1.12
JAP*AGE -0.01 -2.76 * -0.02 -4.84 *
UK*AGE 0.00 -0.07
0.01 0.79
AUS*UNDREP -1.33 -2.87 * -0.66 -1.20
CAN*UNDREP -0.81 -1.87 *** -1.60 -3.44 *
CHN*UNDREP -1.45 -4.23 * -1.26 -6.46 *
GER*UNDREP -0.22 -0.59
-0.38 -1.04
IND*UNDREP -0.38 -1.1
-0.37 -1.30
JAP*UNDREP -1.60 -4.22 * -1.71 -6.44 *
UK*UNDREP -0.52 -1.74 *** -0.26 -0.88
AUS*BIGN_AUD 0.10 0.34
0.13 0.56
CAN*BIGN_AUD 0.45 2.94 * 0.55 2.71 *
CHN*BIGN_AUD -0.28 -2.14 ** -0.22 -1.48
GER*BIGN_AUD -0.04 -0.43
-0.03 -0.22
IND*BIGN_AUD -0.01 -0.04
0.02 0.15
JAP*BIGN_AUD 0.01 0.09
0.08 0.51
UK*BIGN_AUD 0.30 2.76 * 0.18 1.38

48
Adjusted R2 / Pseudo R2 80.7% 56.4%
# of obs. 4,221 4,221
The dependent variable is the log of market capitalization at the offer date. SL is significance level. *
indicates significance at the 1% level, ** at the 5% level, and *** at the 10% level. Standard errors
account for clustering across firms within a year. Variable definitions are in Appendix A.

49
Table 7: Global Valuation Regressions Over Time for International IPOs, 1998-2015
Variable 1998 1999 2000 2001 2002 2003 2004 2005 2006 2007 2008 2009 2010 2011 2012 2013 2014 2015
BV Coef. 0.00 0.00 0.00 0.00 0.00 0.00 0.00 0.00 0.00 0.00 0.00 0.00 0.00 0.00 0.00 0.00 0.00 0.00
t-stat 9.19 1.80 0.87 -1.80 1.83 0.64 -0.48 1.20 0.07 -0.20 3.21 0.03 -2.39 -2.39 -3.38 -3.30 -2.26 -0.26
SL * *** *** *** * ** ** * * **
LOGABSNI Coef. 0.15 0.17 0.25 0.26 0.48 0.46 0.35 0.39 0.33 0.46 0.36 0.41 0.46 0.42 0.22 0.29 0.48 0.53
t-stat 3.62 3.69 4.70 3.70 4.13 6.94 6.10 7.40 6.88 7.92 4.45 2.64 5.48 4.37 1.90 4.80 8.96 6.92
SL * * * * * * * * * * * * * * *** * * *
LOSS*
LOGABSNI Coef. 0.01 -0.01 -0.04 -0.06 -0.17 0.06 -0.11 -0.01 -0.05 0.02 -0.06 -0.18 -0.31 -0.18 -0.01 -0.04 -0.18 -0.07
t-stat 0.28 -0.26 -0.74 -0.64 -2.21 0.94 -2.21 -0.30 -1.00 0.34 -0.61 -1.92 -3.24 -1.58 -0.06 -0.52 -2.28 -0.90
SL ** ** *** * **
DTOA Coef. 0.02 0.16 0.17 -0.48 0.53 -0.15 -0.04 0.21 -0.08 -0.24 -0.86 0.03 0.47 0.70 -0.56 0.69 0.03 0.41
t-stat 0.23 1.91 1.47 -1.51 1.08 -0.55 -0.18 1.06 -0.43 -1.30 -2.82 0.10 0.85 1.41 -1.19 2.29 0.14 0.99
SL *** * **
LOG_CAPEX Coef. 0.14 0.10 0.17 0.33 0.13 0.19 0.22 0.21 0.22 0.22 0.27 0.15 0.10 0.14 0.29 0.13 0.13 0.12
t-stat 6.32 5.12 6.30 5.56 1.79 4.75 7.42 6.06 6.87 6.12 5.74 2.54 2.40 3.06 6.22 2.93 3.17 3.59
SL * * * * *** * * * * * * ** ** * * * * *
LOG_SGRO Coef. 0.12 0.06 0.00 0.18 0.03 0.07 0.22 0.19 0.16 0.11 0.20 -0.13 0.08 0.23 -0.13 0.10 -0.04 -0.07
t-stat 2.13 1.36 0.05 1.12 0.12 0.60 2.34 1.89 1.59 1.19 1.81 -0.70 0.52 1.38 -0.74 0.87 -0.30 -0.44
SL ** ** *** ***

50
RETENTION Coef. 2.13 2.04 2.50 4.94 1.47 0.64 1.26 1.25 1.25 0.75 -0.09 2.35 2.13 3.19 1.30 1.33 1.45 1.58
t-stat 8.23 4.62 5.13 4.28 1.50 1.87 3.35 2.64 3.75 1.97 -0.15 5.93 2.38 5.59 1.00 1.97 2.15 1.95
SL * * * * *** * * * ** * ** * *** ** ***
AGE Coef. 0.01 0.00 0.00 0.02 -0.01 0.00 0.00 0.00 0.01 -0.01 -0.01 -0.01 -0.02 0.00 0.00 0.01 -0.01 -0.04
t-stat 1.70 -1.07 0.23 3.68 -0.96 0.53 1.33 1.59 1.99 -2.11 -1.57 -1.48 -2.57 -0.84 0.32 0.58 -1.40 -5.93
SL *** * ** ** ** *
UNDREP Coef. 2.18 1.74 1.64 0.52 1.27 1.77 1.47 1.25 1.64 1.03 1.41 1.64 1.86 1.45 1.98 2.16 2.08 1.58
t-stat 10.53 7.48 6.14 0.92 2.21 5.58 3.99 3.99 5.30 3.71 4.05 4.72 5.76 3.56 4.74 3.67 4.49 3.63
SL * * * ** * * * * * * * * * * * * *
BIGN_
AUD Coef. 0.13 0.67 0.35 0.13 0.71 0.38 0.59 0.58 0.42 0.32 0.12 0.10 0.16 -0.19 -0.06 0.86 0.56 0.38
t-stat 0.92 5.08 2.58 0.41 3.35 2.70 5.44 4.01 4.00 2.95 0.79 0.65 0.94 -0.94 -0.26 2.93 3.28 2.97
SL * * * * * * * * * * *
# of obs. 201 372 347 80 88 114 257 202 293 343 132 146 421 350 179 126 257 305
Adj. R2 (%) 67.7 61.3 68.1 80.6 81.2 87.4 76.5 80.9 74.1 70.5 78.8 70.2 61.3 61.9 63.1 67.5 64.7 75.7
The dependent variable is the log of market capitalization at the offer date. SL is significance level. * indicates significance at the 1% level, ** at the 5% level, and ***
at the 10% level. Standard errors account for clustering across firms within a year. Standard errors are adjusted for heteroscedasticity. Variable definitions are in
Appendix A.