valuation and initial return of initial public offerings ... annual meetings... · valuation and...
TRANSCRIPT
Valuation and Initial Return of Initial Public Offerings: Role of Discretionary Accounting Accruals
Abstract
This study examines the role of pre-IPO discretionary accruals in the valuation and first day initial returns of IPOs. We find that IPO offer price is unaffected whereas market closing price is positively associated with the levels of pre-IPO discretionary accruals for issuers with aggressively reported earnings. We also find that this relative over-valuation of managed earnings by the markets explains a portion of the initial return that is not explained by other known determinants. For issuers with conservatively reported pre-IPO earnings, there is no relation between discretionary accruals and the offer price or the market price, and the discretionary accruals do not explain any IPO initial return. Our subsequent analysis shows that stock retention appears to be a screen and a signal of entrepreneurs’ credibility to the markets. There seems to be a higher degree of earnings scrutiny by both the markets and the underwriters for IPOs with low entrepreneurial (insider) retention. However, markets tend to assign higher weight to reported earnings of issuers with higher insider retention, presumably because of perceived incentive alignment. Underwriters, with relatively lesser information asymmetry than the markets, tend to see through the distortions caused by earnings manipulations in the valuation of IPOs, regardless of the levels of issuers’ stock retention.
Keywords: IPO initial return; accruals; earnings management; insider retention. JEL classification: G14, K22, L51, M4

36
Table IV Initial Return and Discretionary Current Accruals
Shown here are the cross-sectional regression models for the returns to IPO investors in the U.S. based on SDC data from 1990 to 2004. The dependent variable is the percentage initial return. DCA refers to discretionary accruals in the year prior to IPO. POS_DCA (NEG_DCA) equals discretionary current accruals when DCA is positive (negative), and zero otherwise. RANK is the underwriter rank based on Carter, Dark, and Singh (1998) and updated in Loughran and Ritter (2004). BIG8 is the indicator variable for IPOs audited by the Big 8 public accounting firms. VC equals one if the IPO firm is ventured-backed, zero otherwise. LOGAST is the log of total assets. NYSE equals one if the IPO firm is listed on the New York Stock Exchange, and zero otherwise. NMS equals one if the IPO firm is listed on the Nasdaq National Market Stock Exchange, and zero otherwise. AMEX equals one if the IPO firm is listed on the American Stock Exchange, and zero otherwise. TECH equals one if the firm is in a high tech industry, and zero otherwise. CHANGEΡ is the price revision between the midpoint of the initial filing range and the final offer price. CHANGEP+ equals ΔΡ when price revision is positive, and zero otherwise. MKT is the average CRSP equal-weighted index return three weeks prior to issuance. MKT+ equals MKT when return is positive, and zero otherwise. Insider refers to insider retention and is defined as (shares outstanding after offering-total shares offered)/shares outstanding after offering. BV refers to book value of equity one year prior to offering. SALES and R&D are based on prior IPO year data. L(Variable) is defined as L(Variable)=log (1+Variable) when Variable is greater or equal to zero; L(Variable)=-log (1-Variable) when Variable is less than zero. MEANPS is the mean of price to sales per share ratio of the IPO firm industry. ***, **, and * denote significance at 1%, 5%, and 10% levels, respectively.
Model 1 Model 2 Model 3 Model 4 IR IR IR IR
INTERCEPT -3.1296 -8.1357 -5.2727 -10.3078 (-0.37) (-0.84) (-0.61) (-1.05) DCA 0.5748 0.5551 (0.70) (0.67) POS_DCA 3.3473 ** 3.1577 ** (2.16) (2.03) NEG_DCA -0.6802 -0.6187 (-0.67) (-0.61) RANK 0.3953 0.3969 0.5214 0.5196 (0.77) (0.78) (1.02) (1.01) BIG8 -0.1038 0.2783 -0.3411 0.1040 (-0.02) (0.05) (-0.07) (0.02) VC 1.1001 0.7568 1.1050 0.8463 (0.39) (0.25) (0.39) (0.28) LOGAST -1.4063 -0.3418 -1.3482 -0.5093 (-1.48) (-0.25) (-1.42) (-0.37) NYSE 5.4226 6.3577 5.9199 6.7064 (0.77) (0.90) (0.85) (0.95) NMS 7.8491 8.8076 8.2529 9.1696 (1.29) (1.44) (1.35) (1.50) AMEX -2.5381 -1.9183 -2.3165 -1.6209 (-0.27) (-0.20) (-0.25) (-0.17) TECH 1.9987 0.8083 1.6403 0.3586 (0.67) (0.25) (0.55) (0.11) CHANGEP 0.0970 0.1080 0.0876 0.0994 (0.91) (1.02) (0.83) (0.93)

37
CHANGEP+ 1.6001 *** 1.5738 *** 1.6023 *** 1.5744 *** (10.5) (10.23) (10.53) (10.25) MKT -9.6291 -8.9723 -8.0500 -7.4237 (-0.94) (-0.88) (-0.79) (-0.73) MKT+ 23.8549 23.1938 22.6467 22.0819 (1.56) (1.52) (1.48) (1.44) INSRET 13.1479 * 12.9687 *
(1.82) (1.79) L(BV) 0.2837 0.3040 (0.68) (0.73) L(SALES) -1.8647 -1.6195 (-1.53) (-1.32) L(R&D) 0.0400 0.2210 (0.03) (0.19) MEANPS -0.0223 ** -0.0218 ** (-2.06) (-2.01) Year Dummies Yes Yes Yes Yes No. of Obs. 952 952 952 952 Adjusted R2 0.4762 0.4791 0.4782 0.4807 ** *, **, and * denote significance at the 1%, 5%, and 10% levels, respectively.

38
Table V Discretional Current Accruals on Offer and Market Prices
Shown here are the cross-sectional regression models for IPO valuations from 1990 to 2004. Dependent variables are log of IPO offer prices (LogOffer) and log of first day closing prices (LogPrc), respectively. Pos_DCA (Neg_DCA) equals discretionary current accruals when DCA is positive (negative), and zero otherwise. BV refers to book value of equity one year prior to offering. Sales and R&D are based on prior IPO year data. L(Variable) is defined as L(Variable)=log (1+Variable) when Variable is greater or equal to zero; L(Variable)=-log (1-Variable) when Variable is less than zero. INSRET refers to insider retention, defined as (shares outstanding after offering-total shares offered)/shares outstanding after offering. MeanPS is the mean of price to sales per share ratio of the IPO firm industry. Rank is the underwriter rank based on Carter, Dark, and Singh (1998) and updated in Loughran and Ritter (2004). BIG8 is the indicator variable for IPOs audited by the Big 8 public accounting firms. VC equals one if the IPO firm is ventured-backed, zero otherwise. Logast is the log of total assets. NYSE equals one if the IPO firm is listed on the New York Stock Exchange, and zero otherwise. NMS equals one if the IPO firm is listed on the Nasdaq National Market Stock Exchange, and zero otherwise. AMEX equals one if the IPO firm is listed on the American Stock Exchange, and zero otherwise. Tech equals one if the firm is in a high tech industry, and zero otherwise. ChangeΡ is the price revision between the midpoint of the initial filing range and the final offer price. ChangeP+ equals ΔΡ when price revision is positive, and zero otherwise. MKT is the average CRSP equal-weighted index return three weeks prior to issuance. MKT+ equals MKT when return is positive, and zero otherwise. t-statistics are provided in parentheses for valuation models. ***, **, and * denote significance at 1%, 5%, and 10% levels, respectively. The difference model results, which are based on Seemingly Unrelated Regressions and F-statistics, are provided in parentheses in the difference column. ***, **, and * denote significance at the 1%, 5%, and 10% levels, respectively.
LOGOFFER LOGPRC Difference INTERCEPT 1.7298 1.6759 (27.44) (18.02) POS_DCA 0.0058 0.0281 * 0.0222 ** (0.58) (1.90) (3.95) NEG_DCA -0.0070 -0.0145 -0.0075
(-1.08) (-1.51) (1.05) L(BV) 0.0050 * 0.0052 0.0002 (1.86) (1.31) (0.00) L(SALES) 0.0193 ** 0.0271 ** 0.0077 (2.45) (2.32) (0.77) L(R&D) 0.0275 *** 0.0372 *** 0.0098 (3.6) (3.31) (1.32) MEANPS 0.1360 * 0.0031 -0.1329 * (1.95) (-0.03) (3.17) INSRET 0.0819 * 0.1181 * 0.0362 (1.76) (1.72) (0.48) RANK 0.0093 *** 0.0136 *** 0.0043 (2.82) (2.79) (1.33) BIG8 0.1557 *** 0.1522 *** -0.0035 (4.70) (3.11) (0.01) VC 0.0144 0.0302 0.0158 (0.73) (1.04) (0.52) LOGAST 0.0824 *** 0.0575 *** -0.0249 ** (9.34) (4.42) (6.39) NYSE 0.1895 *** 0.3172 *** 0.1277 ** (4.19) (4.75) (6.37) NMS 0.1374 *** 0.2826 *** 0.1452 *** (3.50) (4.88) (10.94) AMEX 0.0548 0.1089 0.0540

39
(0.91) (1.22) (0.64) TECH 0.0073 0.0004 -0.0069 (0.35) (0.01) (0.09) CHANGEP 0.0129 *** 0.0147 *** 0.0018 ** (18.83) (14.57) (5.71) CHANGEP+ -0.0078 *** -0.0008 0.0070 *** (-7.86) (-0.57) (39.46) MKT -0.0506 -0.0836 -0.0330 (-0.77) (-0.86) (0.20) MKT+ 0.0690 0.1771 0.1081 (0.70) (1.22) (0.97) Year Dummies Yes Yes No. of Obs. 952 952 Adjusted R2 0.6408 0.6207 ** *, **, and * denote significance at the 1%, 5%, and 10% levels, respectively.

40
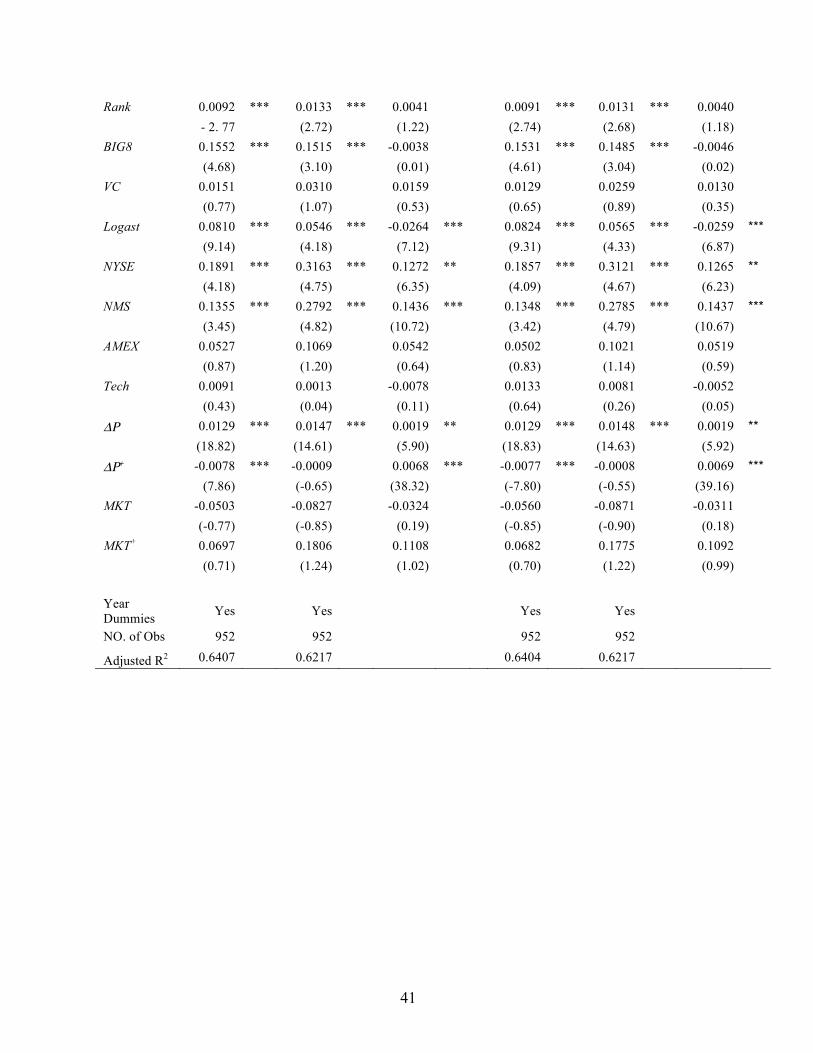
Table VI Insider Retention, Discretional Current Accruals, and IPO Prices
Results from the estimation of cross-sectional regression models with log of IPO offer prices and log of first day closing prices as dependent variables. Dependent variables are log of IPO offer prices (LogOffer) and log of first day closing prices (LogPrc), respectively. HR (LR) is an indicator variable for IPOs with insider retention greater (less) than the sample period median. BV refers to book value of equity one year prior to offering. Sales and R&D are based on prior IPO year data. L(Variable) is defined as L(Variable)=log (1+Variable) when Variable is greater or equal to zero; L(Variable)=-log (1-Variable) when Variable is less than zero. MeanPS is the mean of price to sales per share ratio of the IPO firm industry. Rank is the underwriter rank based on Carter, Dark, and Singh (1998) and updated in Loughran and Ritter (2004). BIG8 is the indicator variable for IPOs audited by the Big 8 public accounting firms. VC equals one if the IPO firm is ventured-backed, zero otherwise. Logast is the log of total assets. NYSE equals one if the IPO firm is listed on the New York Stock Exchange, and zero otherwise. NMS equals one if the IPO firm is listed on the Nasdaq National Market Stock Exchange, and zero otherwise. AMEX equals one if the IPO firm is listed on the American Stock Exchange, and zero otherwise. Tech equals one if the firm is in a high tech industry, and zero otherwise. ChangeΡ is the price revision between the midpoint of the initial filing range and the final offer price. ChangeP+ equals ΔΡ when price revision is positive, and zero otherwise. MKT is the average CRSP equal-weighted index return three weeks prior to issuance. MKT+ equals MKT when return is positive, and zero otherwise. t-statistics are provided in parentheses for valuation models. ***, **, and * denote significance at 1%, 5%, and 10% levels, respectively. The difference model results, which are based on Seemingly Unrelated Regressions and F-statistics, are provided in parentheses in the difference column. ***, **, and * denote significance at the 1%, 5%, and 10% levels, respectively. LOGOFFER LOGPRC Difference LOGOFFER LOGPRC Difference INTERCEPT 1.7751 *** 1.7394 *** 1.7917 *** 1.7719 *** (31.54) (20.98) (31.51) (21.15) Pos_DCA 0.0051 0.0265 * 0.0215 * (0.50) (1.80) (3.68) Neg_DCA -0.0064 -0.0131 -0.0067 (-0.98) (-1.36) (0.84) HR 0.0312 * 0.0615 ** 0.0302 (1.82) (2.43) (2.48) Pos*HR 0.0093 0.0402 ** 0.0309 ** (0.80) (2.36) (5.71) Pos*LR -0.0502 -0.0688 -0.0186 (-1.58) (-1.47) (0.27) Neg*HR -0.0094 -0.0271 ** -0.0178 * (-1.01) (-1.97) (2.90) Neg*LR -0.0156 -0.0041 0.0115 (-0.81) (-0.15) (0.29) L(BV) 0.0047 * 0.0046 -0.0001 0.0049 * 0.0051 0.0001 (1.74) (1.16) (0.00) (1.85) (1.29) (0.00) L(Sales) 0.0206 *** 0.0294 ** 0.0088 0.0197 ** 0.0283 ** 0.0086 (2.60) (2.52) (0.99) (2.50) (2.43) (0.94) L(R&D) 0.0268 *** 0.0351 *** 0.0083 0.0287 *** 0.0385 *** 0.0097 (3.48) (3.10) (0.94) (3.78) (3.43) (1.32) Mean P/S 0.0001 ** 0.0000 -0.0001 * 0.0001 ** 0.0000 -0.0001 (1.98) (0.01) (3.12) (2.04) (0.15) (2.67)
41
Rank 0.0092 *** 0.0133 *** 0.0041 0.0091 *** 0.0131 *** 0.0040 - 2. 77 (2.72) (1.22) (2.74) (2.68) (1.18) BIG8 0.1552 *** 0.1515 *** -0.0038 0.1531 *** 0.1485 *** -0.0046 (4.68) (3.10) (0.01) (4.61) (3.04) (0.02) VC 0.0151 0.0310 0.0159 0.0129 0.0259 0.0130 (0.77) (1.07) (0.53) (0.65) (0.89) (0.35) Logast 0.0810 *** 0.0546 *** -0.0264 *** 0.0824 *** 0.0565 *** -0.0259 *** (9.14) (4.18) (7.12) (9.31) (4.33) (6.87) NYSE 0.1891 *** 0.3163 *** 0.1272 ** 0.1857 *** 0.3121 *** 0.1265 ** (4.18) (4.75) (6.35) (4.09) (4.67) (6.23) NMS 0.1355 *** 0.2792 *** 0.1436 *** 0.1348 *** 0.2785 *** 0.1437 *** (3.45) (4.82) (10.72) (3.42) (4.79) (10.67) AMEX 0.0527 0.1069 0.0542 0.0502 0.1021 0.0519 (0.87) (1.20) (0.64) (0.83) (1.14) (0.59) Tech 0.0091 0.0013 -0.0078 0.0133 0.0081 -0.0052 (0.43) (0.04) (0.11) (0.64) (0.26) (0.05) ΔΡ 0.0129 *** 0.0147 *** 0.0019 ** 0.0129 *** 0.0148 *** 0.0019 **
(18.82) (14.61) (5.90) (18.83) (14.63) (5.92) ΔΡ+ -0.0078 *** -0.0009 0.0068 *** -0.0077 *** -0.0008 0.0069 ***
(7.86) (-0.65) (38.32) (-7.80) (-0.55) (39.16) MKT -0.0503 -0.0827 -0.0324 -0.0560 -0.0871 -0.0311 (-0.77) (-0.85) (0.19) (-0.85) (-0.90) (0.18) MKT+ 0.0697 0.1806 0.1108 0.0682 0.1775 0.1092 (0.71) (1.24) (1.02) (0.70) (1.22) (0.99) Year Dummies Yes Yes Yes Yes NO. of Obs 952 952 952 952 Adjusted R2 0.6407 0.6217 0.6404 0.6217

42
ENDNOTES 1 This amounts to $86.2 million (in 2003 dollars) left on the table that the issuers could have used. 2 In the context of British IPOs, Ball and Shivakumar (2008) argue and provide evidence of conservatively reported earnings prior to the IPOs. 3 Welch (1989) presents a signaling model in which the high-quality firms will underprice the initial public offering in order to obtain a higher price at the seasoned offering. A higher price at the seasoned offering eventually compensates for the underpricing in an IPO. 4 Rock (1986) presents a model in which informed investors only participate in IPO activities when new issues are underpriced. Underpriced issues are more likely to be oversubscribed and rationed. Thus, uninformed investors systematically receive more overpriced IPOs and earn below average returns. Therefore, new issues need to be underpriced to induce the participation from uninformed investors and avoid the “winner’s curse” problem. Benveniste and Spindt (1989) use the book-building process to illustrate partial price adjustment. They suggest that issuers underprice the issues to induce regular participants to reveal an indication of interest. This model predicts a partial adjustment of the offer price with respect to private information to compensate regulars for revealing positive information. Underwriters only partially incorporate positive information learned during the registration period into the final price. Benveniste and Spindt’s model provides an explanation for IPO underpricing and the allocation pattern to repeated IPO participants. 5 Though questions have been raised if the accruals anomaly is the same as some other well-documented anomalies in the finance literature (glamour versus value), there is evidence of accruals mispricing above and beyond other anomalies (Desai et al., 2004; Cheng and Thomas, 2006). 6 Hribar and Collins (2002) show that the balance sheet approach to the measurement of discretionary accruals results in upward biased discretionary accruals. One explanation for this bias is that firms use IPO proceeds to adjust their working capital quite frequently and that these adjustments can be quite drastic. Because Teoh, Welch, and Wong (1998) estimate accruals from changes in working capital accounts reported on the successive balance sheets, this can create a significant measurement problem that can bias towards finding a relation between discretionary accruals and future returns. 7 An IPO proceeds is another measure to control for size. Our results do not change with this alternate measure of size. 8 The Loughran and Ritter (2004) rankings range from 1.1 to 9.1. Underwriters that are not covered by Carter, Dark, and Singh or Ritter and Loughran are lesser known underwriters and are assigned a rank of zero. A further breakdown of accruals into current and non-current accruals shows that the largely negative accruals are driven by large depreciation and amortization expenses (part of non-current accruals). 9 We consider year dummies as well as three periods to control for differences across periods: 1990-1998, 1999-2000, and 2000-mid-2002. The results, not fully reported here, are qualitatively similar. 10 In a separate set of regressions we estimate valuation models based on overall firm values instead of per share price. Coefficients of POS_DCA on both offer value (offer price*shares outstanding) and market value (first day price*shares outstanding) are not significant. However, the difference model results, which are based on Seemingly Unrelated Regressions and F-statistic, suggest that market still assigns higher weights to discretionary current accruals than underwriters in the valuation of IPOs. Results are not reported here but available upon request.

32
Table I Sample Characteristics
The sample consists of 952 IPO firms going public during the period of 1990-‐‑2004 as listed in the Securities Data Company (SDC) database. IPOs that are ADRs, units, REITs, offer price less than $5, and closed-‐‑end funds are excluded. The distribution of the sample is reported by two-‐‑digit Standard Industry Classification (SIC) code.
SIC Distribution Industry Two-digit SIC Codes Freq. %
Oil and Gas 13, 29 18 1.89% Food Products 20 18 1.89% Paper and Paper Products 24-27 20 2.10% Chemical Products 28 86 9.03% Manufacturing 30-34 28 2.94% Computer Hardware & Software 35, 73 273 28.68% Electronic Equipment 36 81 8.51% Transportation 37, 39, 40-42, 44, 45 46 4.83% Scientific Instruments 38 85 8.93% Communications 48 41 4.31% Electric and Gas Services 49 7 0.74% Durable Goods 50 16 1.68% Retail 53, 54, 56, 57, 59 41 4.31% Eating and Drinking Establishments 58 17 1.79% Financial Services 61, 62, 64, 65 46 4.83% Entertainment Services 70, 78, 79 11 1.16% Health 80 17 1.79% All others 1, 14, 15, 16, 17, 22, 23, 46, 47, 51, 52 101 10.61% 55, 63, 67, 72, 82, 87, 99 Total 952 100.00%
33
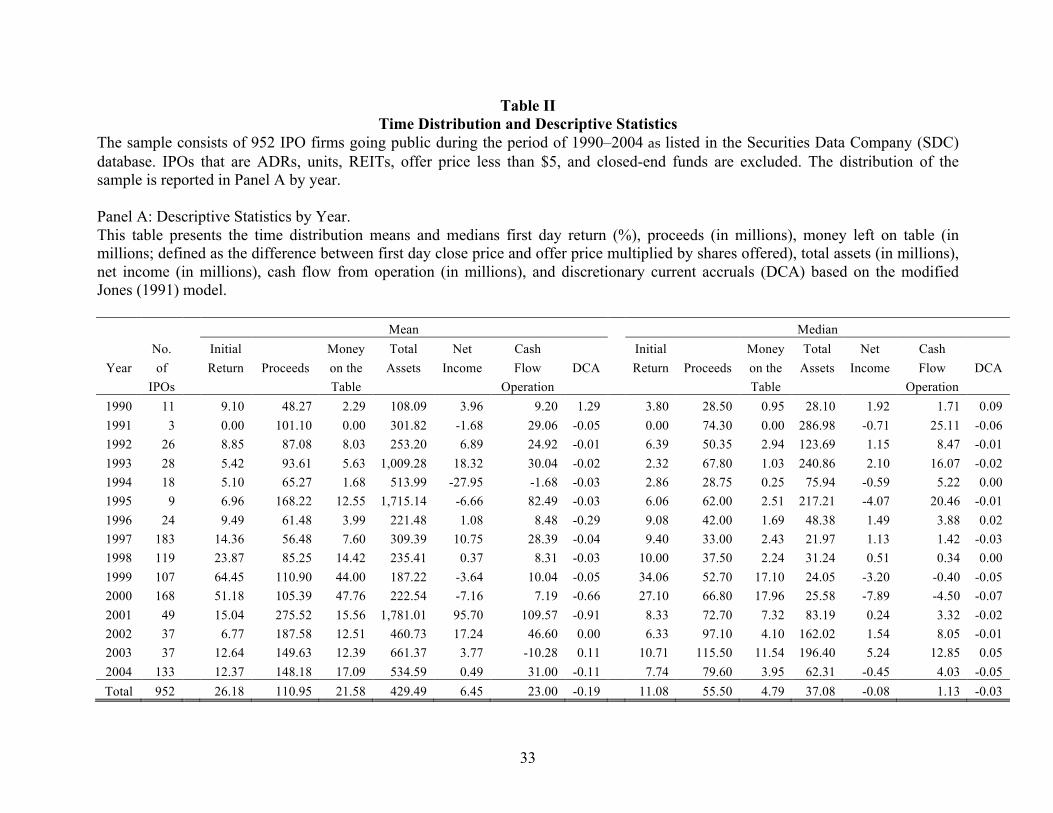
Table II Time Distribution and Descriptive Statistics
The sample consists of 952 IPO firms going public during the period of 1990–2004 as listed in the Securities Data Company (SDC) database. IPOs that are ADRs, units, REITs, offer price less than $5, and closed-end funds are excluded. The distribution of the sample is reported in Panel A by year. Panel A: Descriptive Statistics by Year. This table presents the time distribution means and medians first day return (%), proceeds (in millions), money left on table (in millions; defined as the difference between first day close price and offer price multiplied by shares offered), total assets (in millions), net income (in millions), cash flow from operation (in millions), and discretionary current accruals (DCA) based on the modified Jones (1991) model. Mean Median No. Initial Money Total Net Cash Initial Money Total Net Cash Year of Return Proceeds on the Assets Income Flow DCA Return Proceeds on the Assets Income Flow DCA
IPOs Table Operation Table Operation 1990 11 9.10 48.27 2.29 108.09 3.96 9.20 1.29 3.80 28.50 0.95 28.10 1.92 1.71 0.09 1991 3 0.00 101.10 0.00 301.82 -1.68 29.06 -0.05 0.00 74.30 0.00 286.98 -0.71 25.11 -0.06 1992 26 8.85 87.08 8.03 253.20 6.89 24.92 -0.01 6.39 50.35 2.94 123.69 1.15 8.47 -0.01 1993 28 5.42 93.61 5.63 1,009.28 18.32 30.04 -0.02 2.32 67.80 1.03 240.86 2.10 16.07 -0.02 1994 18 5.10 65.27 1.68 513.99 -27.95 -1.68 -0.03 2.86 28.75 0.25 75.94 -0.59 5.22 0.00 1995 9 6.96 168.22 12.55 1,715.14 -6.66 82.49 -0.03 6.06 62.00 2.51 217.21 -4.07 20.46 -0.01 1996 24 9.49 61.48 3.99 221.48 1.08 8.48 -0.29 9.08 42.00 1.69 48.38 1.49 3.88 0.02 1997 183 14.36 56.48 7.60 309.39 10.75 28.39 -0.04 9.40 33.00 2.43 21.97 1.13 1.42 -0.03 1998 119 23.87 85.25 14.42 235.41 0.37 8.31 -0.03 10.00 37.50 2.24 31.24 0.51 0.34 0.00 1999 107 64.45 110.90 44.00 187.22 -3.64 10.04 -0.05 34.06 52.70 17.10 24.05 -3.20 -0.40 -0.05 2000 168 51.18 105.39 47.76 222.54 -7.16 7.19 -0.66 27.10 66.80 17.96 25.58 -7.89 -4.50 -0.07 2001 49 15.04 275.52 15.56 1,781.01 95.70 109.57 -0.91 8.33 72.70 7.32 83.19 0.24 3.32 -0.02 2002 37 6.77 187.58 12.51 460.73 17.24 46.60 0.00 6.33 97.10 4.10 162.02 1.54 8.05 -0.01 2003 37 12.64 149.63 12.39 661.37 3.77 -10.28 0.11 10.71 115.50 11.54 196.40 5.24 12.85 0.05 2004 133 12.37 148.18 17.09 534.59 0.49 31.00 -0.11 7.74 79.60 3.95 62.31 -0.45 4.03 -0.05 Total 952 26.18 110.95 21.58 429.49 6.45 23.00 -0.19 11.08 55.50 4.79 37.08 -0.08 1.13 -0.03

34
Panel B: Descriptive Statistics on positive and negative DCA This table shows the distribution of discretionary current accruals (DCA). Pos. DCA refers to the number of IPOs with DCA greater than zero in the year prior to IPO; Neg. DCA refers to the number of IPOs with negative DCA in the year prior to IPO. % Positive and % Negative show the percentage distribution of DCA on IPO issuance for the year. The mean and median, based on whether DCA is positive or negative, are also presented in this panel.
Panel B: Descriptive Statistics on Positive and Negative DCA
Year of No. of IPO with % IPO Pos. DCA Pos. DCA IPO with % IPO Neg. DCA Neg. DCA the IPO IPOs Pos. DCA Pos. DCA Mean Median Neg. DCA Neg. DCA Mean Median
1990 11 6 54.55% 2.6867 0.5591 5 45.45% -0.3860 -0.1907 1991 3 0 0.00% 0.0000 0.0000 3 100.00% -0.0531 -0.0620 1992 26 10 38.46% 0.0608 0.0183 16 61.54% -0.0568 -0.0393 1993 28 9 32.14% 0.0365 0.0228 19 67.86% -0.0494 -0.0341 1994 18 9 50.00% 0.1240 0.0637 9 50.00% -0.1770 -0.0427 1995 9 2 22.22% 0.2641 0.2641 7 77.78% -0.1158 -0.0518 1996 24 13 54.17% 0.1101 0.0738 11 45.83% -0.7709 -0.0681 1997 183 75 40.98% 0.3037 0.1471 108 59.02% -0.2792 -0.1179 1998 119 59 49.58% 0.4538 0.1167 60 50.42% -0.5147 -0.1492 1999 107 46 42.99% 0.5515 0.1545 61 57.01% -0.5121 -0.1451 2000 168 57 33.93% 0.3102 0.1240 111 66.07% -1.1544 -0.6386 2001 49 21 42.86% 0.1797 0.0994 28 57.14% -1.7343 -0.1127 2002 37 17 45.95% 0.2177 0.0905 20 54.05% -0.1922 -0.1057 2003 37 27 72.97% 0.2070 0.0611 10 27.03% -0.1344 -0.0669 2004 133 51 38.35% 0.5302 0.1593 82 61.65% -0.5052 -0.2257 Total 952 402 42.23% 0.3802 0.1120 550 57.77% -0.6007 -0.1352

35
Table III
Correlation on Variables of Interest This table presents the Pearson product-moment (upper-right above diagonal) and Spearman rank (lower-left below diagonal) correlation coefficients on variables of interest. Diagonal shows variable mean and standard deviation. See detailed definition of each variable in Section 3.2.
IR LogO ffer
LogPrc DCA PO S_DCA NEG_DCA L(Income)
L(BV) L(Sales) L(RD) MeanPS Insider Rank Logast ChangeP ChangeP+ MKT MKT+26.18 0.25 0.69 -0.05 0.06 -0.10 -0.15 -0.11 -0.17 0.13 0.11 0.24 0.04 -0.14 0.58 0.66 0.11 0.1550.49 0.00 0.00 0.12 0.08 0.00 0.00 0.00 0.00 0.00 0.00 0.00 0.19 0.00 0.00 0.00 0.00 0.000.31 2.56 0.82 0.02 0.00 0.02 0.18 0.19 0.43 0.12 0.00 0.10 0.20 0.52 0.54 0.39 0.09 0.090.00 0.39 0.00 0.58 0.97 0.48 0.00 0.00 0.00 0.00 0.94 0.00 0.00 0.00 0.00 0.00 0.01 0.010.65 0.89 2.74 -0.02 0.03 -0.04 0.06 0.06 0.21 0.16 0.06 0.18 0.16 0.27 0.68 0.60 0.12 0.130.00 0.00 0.56 0.56 0.36 0.19 0.09 0.07 0.00 0.00 0.07 0.00 0.00 0.00 0.00 0.00 0.00 0.00-0.07 0.01 -0.03 -0.19 0.57 0.85 0.11 0.09 0.12 -0.07 -0.08 -0.09 0.11 0.12 -0.04 -0.07 -0.02 -0.020.03 0.87 0.29 1.50 0.00 0.00 0.00 0.01 0.00 0.02 0.02 0.01 0.00 0.00 0.18 0.04 0.61 0.45-0.02 -0.04 -0.04 0.90 0.16 0.06 0.01 0.00 -0.05 -0.05 -0.02 0.00 -0.03 -0.02 0.02 0.01 -0.09 -0.070.52 0.23 0.21 0.00 0.79 0.08 0.84 0.88 0.12 0.16 0.49 0.98 0.30 0.58 0.49 0.76 0.01 0.03-0.08 0.04 -0.02 0.96 0.85 -0.35 0.13 0.11 0.18 -0.06 -0.08 -0.10 0.16 0.15 -0.07 -0.09 0.03 0.010.01 0.24 0.63 0.00 0.00 1.23 0.00 0.00 0.00 0.06 0.02 0.00 0.00 0.00 0.04 0.01 0.29 0.67-0.07 0.16 0.08 0.22 0.14 0.24 -0.13 0.49 0.54 -0.23 -0.25 -0.14 0.02 0.35 -0.05 -0.14 0.00 -0.030.04 0.00 0.02 0.00 0.00 0.00 2.49 0.00 0.00 0.00 0.00 0.00 0.47 0.00 0.13 0.00 0.90 0.40-0.11 0.20 0.11 0.17 0.10 0.21 0.48 0.63 0.41 -0.12 -0.19 -0.09 0.03 0.39 -0.04 -0.10 0.05 0.040.00 0.00 0.00 0.00 0.00 0.00 0.00 3.35 0.00 0.00 0.00 0.00 0.32 0.00 0.20 0.00 0.14 0.22-0.11 0.42 0.26 0.18 0.05 0.24 0.54 0.43 3.81 -0.16 -0.30 -0.15 0.12 0.83 -0.02 -0.10 0.04 0.000.00 0.00 0.00 0.00 0.12 0.00 0.00 0.00 1.97 0.00 0.00 0.00 0.00 0.00 0.59 0.00 0.18 0.910.12 -0.03 0.05 -0.13 -0.07 -0.14 -0.33 -0.19 -0.33 1.02 0.19 0.28 0.01 -0.02 0.05 0.13 -0.13 -0.090.00 0.39 0.13 0.00 0.02 0.00 0.00 0.00 0.00 1.21 0.00 0.00 0.78 0.44 0.10 0.00 0.00 0.000.16 -0.05 0.05 -0.17 -0.05 -0.21 -0.42 -0.29 -0.53 0.43 58.91 0.14 0.02 -0.20 0.06 0.12 -0.04 -0.010.00 0.09 0.11 0.00 0.15 0.00 0.00 0.00 0.00 0.00 121.54 0.00 0.57 0.00 0.06 0.00 0.28 0.700.28 0.14 0.24 -0.10 -0.01 -0.11 -0.14 -0.03 -0.16 0.34 0.29 0.71 0.00 -0.09 0.15 0.22 -0.11 -0.080.00 0.00 0.00 0.00 0.80 0.00 0.00 0.31 0.00 0.00 0.00 0.19 0.91 0.00 0.00 0.00 0.00 0.010.04 0.19 0.17 -0.02 0.05 0.01 -0.07 0.01 0.07 0.07 0.04 0.14 7.80 0.18 0.08 0.05 -0.01 0.000.24 0.00 0.00 0.50 0.10 0.70 0.04 0.65 0.03 0.04 0.18 0.00 2.50 0.00 0.02 0.10 0.79 0.98-0.11 0.50 0.32 0.13 0.00 0.20 0.31 0.40 0.82 -0.21 -0.37 -0.05 0.17 3.99 -0.02 -0.08 0.02 -0.010.00 0.00 0.00 0.00 0.89 0.00 0.00 0.00 0.00 0.00 0.00 0.09 0.00 1.80 0.60 0.01 0.52 0.650.61 0.60 0.73 -0.04 0.00 -0.05 -0.02 -0.04 -0.01 0.04 0.10 0.19 0.05 -0.02 1.67 0.88 0.24 0.220.00 0.00 0.00 0.22 0.90 0.16 0.63 0.27 0.73 0.25 0.00 0.00 0.12 0.51 24.19 0.00 0.00 0.000.61 0.53 0.67 -0.07 -0.02 -0.07 -0.06 -0.07 -0.05 0.10 0.17 0.26 0.05 -0.04 0.92 9.39 0.19 0.190.00 0.00 0.00 0.03 0.54 0.02 0.05 0.04 0.14 0.00 0.00 0.00 0.14 0.21 0.00 16.95 0.00 0.000.17 0.12 0.15 0.01 -0.04 0.03 0.01 0.04 0.04 -0.14 -0.08 -0.10 -0.06 0.01 0.27 0.25 0.09 0.900.00 0.00 0.00 0.71 0.23 0.39 0.68 0.21 0.17 0.00 0.02 0.00 0.06 0.68 0.00 0.00 0.29 0.000.18 0.13 0.16 0.00 -0.04 0.02 0.00 0.04 0.03 -0.13 -0.05 -0.09 -0.05 0.01 0.27 0.25 0.98 0.170.00 0.00 0.00 0.88 0.18 0.50 0.96 0.21 0.39 0.00 0.10 0.00 0.16 0.82 0.00 0.00 0.00 0.19
Rank
Logast
ChangeP
ChangeP+
MKT
MKT+
L(Income)
L(BV)
L(Sales)
L(RD)
MeanPS
Insider
IR
LogO ffer
LogPrc
DCA
PO S_DCA
NEG_DCA

1
Valuation and Initial Return of Initial Public Offerings: Role of Discretionary Accounting Accruals
1 Introduction and Summary
The initial public offering (henceforth, IPO) is a unique event in the history of a
company because it is valued by two distinct sets of external investors for the first time
on this date. A well-documented and heavily researched phenomenon associated with the
valuation of IPOs is that the IPOs are underpriced with positive first day initial returns
(Ibbotson, 1975). Loughran and Ritter (2004) find that the average Initial Return, the
scaled difference in the first day closing price and the offer price, is non-negative for all
23 years examined and that the amount of underpricing is as high as 71.7% (in 1999).1
Because the closing price and the offer price are determined by the markets and the
underwriters on the issuing date, several studies have tried to identify potential sources
for this valuation discrepancy, such as partial adjustment of information learned during
the registration period (Lowry and Schwert, 2002), buying positive analyst coverage
(Cliff and Denis, 2004), ownership structure (Ljungqvist and Wilhelm, 2003; Hill, 2006),
and behavioral explanations such as investor sentiment (Ljungqvist, Nanda, and Singh,
2006) and prospect theory (Loughran and Ritter, 2002). Despite these explanations for
“money left on the table,” the large magnitude of the positive initial return remains a
conundrum in the literature (Ljungqvist, 2007).
This study identifies an additional source of this positive initial return, namely,
earnings management prior to the IPO. Though studies have examined the role of
earnings in IPO valuation (Purnanandam and Swaminathan, 2004; Aggarwal, Bhagat, and

2
Rangan, 2009), no prior study has examined the effect of pre-IPO earnings management
on the initial return and the valuation of IPOs by the underwriters or the markets. Recent
studies provide clear and convincing evidence that the earnings are managed upwards
prior to the IPO (Darrough and Rangan, 2005; Guo, Lev, and Shi, 2006; Zheng and
Stangeland, 2007)2. If the markets (underwriters) are “functionally fixated” on the
reported earnings and the earnings growth number, they can overpay (set a higher offer
price) for the IPO stock if the pre-IPO earnings are managed upwards through
discretionary current accruals (Sloan, 1996). Because the underwriters are privy to
additional private information on the underwriting firm and engage in due diligence on
behalf of investors, they face relatively lesser information asymmetry than the markets in
general. We would, therefore, expect the underwriters to be less influenced by earnings
and earnings management (through accruals) than the investors. The investors’ higher
reliance on reported earnings and the underwriters’ ability to better see through the
management of earnings could lead to this additional source of initial return of the IPOs.
We hypothesize that the larger the earnings management, the larger the extent of initial
return of an IPO. As such, we test if earnings management can explain part of this well-
documented IPO underpricing anomaly.
Because earnings management requires a motive, we examine entrepreneurs and
their stock retention at the time of the IPO. Entrepreneurs with low stock retention may
have a myopic perspective and those with higher stock retention may have a more
hyperopic (long-term) perspective and may be more conservative in reporting earnings
because of long-term reputation and wealth accumulation concerns. These entrepreneurs
may be more conservative or may be building accrual reserves prior to the IPO to provide

3
them with means to report higher or smoothed earnings in the future. The observed
overall negative discretionary accruals or earnings conservatism in prior studies may
simply be a reflection of a higher mix of entrepreneurs with hyperopic perspective and
higher stock retention. We expect that the impact of this differential incentive is reflected
in the weights assigned to discretionary accruals in the underwriter and the market
valuations of the IPO.
Our empirical findings show that firms with pre-IPO positive discretionary
accruals (aggressive reporters) tend to have higher initial returns, whereas no such
association exists for firms with negative discretionary accruals prior to the IPO. These
findings are consistent with underwriters and markets valuing discretionary accruals
differently for aggressive reporters. In our subsequent analysis, we develop the
underwriters’ and the markets’ IPO valuation model that incorporates the role of
discretionary current accruals. Our results show that in the valuation of firms that
manage earnings upwards, the underwriters do not assign any weight whereas the
markets assign a positive weight to discretionary current accruals. Using a seemingly
unrelated regressions approach, we test and find that the weight assigned to discretionary
accruals by the markets is significantly larger than the one assigned by the underwriters.
These findings are consistent with underwriters being able to see through the implication
of earnings management through discretionary accruals on current and future earnings,
but markets do not. For firms with negative pre-IPO discretionary accruals, we find no
relation between (a) discretionary accruals and initial returns, (b) discretionary accruals
and market valuation, and (c) discretionary accruals and underwriter valuation, as well as

4
(d) no significant difference in underwriter and market valuations of discretionary
accruals.
In our subsequent analysis, we identify entrepreneurial (insider) stock retention as
one potential source of IPO quality. We find that there is a negative correlation between
insider stock retention and discretionary accruals. The mean discretionary accruals are
significantly larger for firms with low insider retention. Both the markets and the
underwriters do not assign any weight to discretionary accruals of IPOs with low insider
retention. In issues where entrepreneurs retain a higher proportion of firm stock, markets
tend to assign higher credibility to the earnings. When insider retention is high, markets
view it as a credible signal and price the shares upward or downward according to the
direction of discretionary accruals. These findings suggest that there seems to be a higher
degree of earnings scrutiny by markets for IPOs that involve low insider retention.
Underwriters with lesser information asymmetry than the market participants tend to
either see through the distortions caused by earnings manipulations or assign higher
weights to other information in valuing the IPOs.
This study makes several contributions to the literature. It examines the role of
pre-IPO discretionary accruals in the valuation of IPOs – both by the underwriters and by
the markets. No prior study has examined earnings management prior to the IPO and its
effect on IPO valuation. Second, by documenting that the upwards management of
earnings through discretionary current accruals has no effect on the offer price but
positively affects the first day closing price, this study explains a portion of the positive
initial returns documented in the literature. For firms that are conservative in reporting
earnings prior to the IPO, we find no negative impact on their valuations by the

5
underwriters or the markets. Finally, this study shows that insider stock retention has a
role in the pricing of discretionary accruals. Markets tend to over-value or under-value
firms with managed earnings, but only when the insider stock retention is high.
2 Hypothesis Development
It has been well documented in finance literature that IPO shares are, on average,
underpriced relative to the first day closing price (Ibbotson, 1975). Most of the
underpricing theories are based on asymmetric information between investors and
issuers. These models either assume that the issuer is more informed than the investors
(Welch, 1989; Allen and Faulhauber, 1989; Booth and Smith, 1986) 3, or that some
investors are more informed than the issuers (Rock, 1986; Beatty and Ritter, 1986;
Benveniste and Spindt, 1989).4 Lowry and Schwert (2002) empirically test IPO initial
returns across firms and document that offer price is only partially adjusted with respect
to IPO underpricing. Loughran and Ritter (2004) examine reasons behind underpricing
changes over time and propose three non-mutually exclusive explanations: change in risk
composition, realignment of incentives, and changing issuer objective function.
Purnanandam and Swaminathan (2004) question if the IPOs are really
underpriced. Using the industry peer price multiples approach to valuation, they find that
both the offer price and the first day closing prices far exceed the implied prices, with the
markets assigning much higher multiples than the underwriter (offer price). These results
are inconsistent with underpricing predicted by most rational pricing models but are
consistent with the documented long-run underperformance of IPOs. They find that the
level of earnings, accruals, and earnings growth forecasts are positively associated with
the valuation of the IPO firm. However, they do not examine the role of discretionary

6
accruals, used for upward management of earnings, on the IPO offer or the closing prices.
One potential explanation for this observed initial overpricing could be that the markets
and underwriters interpret the same fundamental variables differently, especially those
that are prone to manipulation by the managers.
In the context of IPO valuation, several other studies examine the role of earnings
and other accounting information. Klein (1996) identifies pre-IPO earnings per share and
the pre-IPO book value per share as positively related to the prices of the 193 IPOs
examined. Hand (2003), Bartov, Mohanram, and Seethamraju (2002), and more recently
Aggarwal, Bhagat, and Rangan (2009) examine valuation of IPOs during the internet
bubble and identify additional accounting variables – namely, cash flows, sales, and
R&D – to be relevant to IPO valuation. The analysis of cash flow, accrual, and transitory
earning components is important from a financial statement analysis and valuation point
of view. The underlying reason for this separation is that these components of earnings
have differential long-term persistence and, hence, different impacts on forecasting future
earnings. As argued and documented by Sloan (1996), this lack of understanding in the
properties of the components of earnings can result in mispricing of a firm’s stock. Sloan
(1996) documents that a firm with high current accruals will exhibit lower earnings
persistence and these differences in persistence can be used to earn abnormal returns. A
subsequent extension of this line of research has concluded that abnormal accruals are
mispriced as well (Cheng and Thomas, 2006; Desai, Rajgopal, and Venkatachalam, 2004;
Xie, 2001)5.
If issuers use accruals and deferrals related to working capital accounts to inflate
earnings and both the underwriters and the markets fail to understand these

7
manipulations, we would expect their valuations to be higher for IPOs with higher
discretionary accruals. Higher valuations from both underwriters and the market may
contribute to a positive, neutral, or negative impact on IPO initial return. However, if
underwriters see through the management of earnings because of access to additional
information, we would expect the underwriter valuation to remain unaffected with respect
to levels of discretionary accruals. On the other hand, market participants may consist of
less sophisticated investors. Market investors may not be able to see through accounting
management and overpay for the shares. The different weights assigned between
underwriters and market investors could result in pricing discrepancy, further results in
positive initial returns of IPO shares.
Investors could also respond asymmetrically to positive or negative news
especially in IPO settings. Miller (1977) provides a divergence of opinion theory in IPO
which suggests that the opinion differences about a new issue are greatest when the stock
is first issued. Due to short-selling constraints of newly issued stocks, first trading price
could overweight optimistic opinions and underweight pessimistic valuations. Tie in with
Ashbaugh, LaFond, and Mayhew (2003) that shows that this separation of positive and
negative discretionary accruals better captures the potential asymmetric relation between
the variable of interest (in our case, initial return) and earnings management, we
hypothesize the following:
Hypothesis 1: IPO initial return is higher for firms with positive levels of discretionary current accruals. Hypothesis 2: Markets assign a higher weight to discretionary current accruals than the underwriter in the valuation of IPOs.

8
The issue of earnings management through accruals to achieve strategic outcomes
has been extensively examined in the accounting and finance literature. Most of these
studies try to identify a motive, such as meeting dividend thresholds (Daniel, Denis, and
Naveen, 2008) or achieving favorable valuations around important events such as
acquisitions (Bergstresser, Desai, and Rauh, 2006; Louis, 2004) and open-market
repurchases (Gong, Louis, and Sun, 2008) that earnings management helps achieve. In
the context of IPOs, Aharony, Lin, and Loeb (1993), using a small sample of 229 IPOs
from 1995-1997, find no earnings management prior to the issuance of IPOs. They find
very little evidence of earnings management for small firms or for large firms with
significant financial leverage. Friedlan (1994), using a sample of 211 IPOs from 1981-
1984, finds evidence of earnings manipulation prior to the issuance of IPOs.
Teoh, Welch, and Wong (1998) publish the first large sample study on the role of
discretionary current accruals in IPO underperformance. They show that IPO-year (not
the pre-IPO) abnormal accruals are manipulated and that higher levels of discretionary
accruals are systematically associated with lower levels of future abnormal returns. Ball
and Shivakumar (2008) and Armstrong, Foster, and Taylor (2008) have raised concerns
about the use of accruals as a means to earnings management in highly scrutinized
environments such as that of IPOs, and they show that the pre-IPO accruals are negative,
consistent with earnings conservatism. Armstrong, Foster, and Taylor (2008), using a
very simple valuation model, find that the IPO issue price is decreasing in accruals and
discretionary accruals, and so is the executive compensation. They conclude this finding
as a lack of motive for earnings management prior to the IPO.

9
Though earnings conservatism around highly scrutinized events such as IPOs is a
plausible argument, there is considerable evidence that litigation risk or public scrutiny
alone is not sufficient enough for firms to refrain from earnings management. Prior
studies have documented pervasive earnings management in similar high scrutiny
settings, such as seasoned equity offerings (Teoh, Welch, and Wong, 1998a; DuCharme,
Malatesta, and Sefcik, 2004), acquisitions (Bergstresser, Desai, and Rauh, 2006; Erickson
and Wang, 1999; Louis, 2004), and open-market repurchases (Gong, Louis, and Sun,
2008). These findings suggest that extant public scrutiny is not a sufficient deterrent to
earnings management through the flexibility permissible under GAAP. Further, the
finding of average/median accruals being negative prior to the IPOs is consistent with
earnings conservatism, but only on average. We argue that this evidence suggests that
there are more firms that are potentially conservative than aggressive in their financial
reporting practices prior to the IPO and that we need to examine them separately.
If insider stock retention is a measure of IPO quality, as argued in the prior
research (Leland and Pyle, 1977; Feltham, Hughes, and Simunic, 1991), then we can
expect conservative and aggressive reporting prior to the IPOs to be driven by the
entrepreneur’s perceived horizon. Entrepreneurs with long-term horizons may retain
higher proportions of firm stock and may be more conservative in reporting profits.
Entrepreneurs that use IPO as an exit strategy may have lower stock retention and may be
more aggressive in reporting profits. We condition entrepreneurs’ incentive for earnings
management on post-IPO stock retention to examine the impact of this earnings
management on firm valuation.

10
Zheng and Stangeland (2007) examine IPO underpricing and firm quality. They
find that IPO underpricing is positively related to post-IPO growth in sales and EBITDA,
but is not related to growth in earnings. This discrepancy could be explained by the
reversals of accruals in future years. The findings of Zheng and Stangeland (2007)
support the notion of earnings management prior to the IPO. Given the mixed literature
on earnings management prior to the IPO event, our paper is focused on underwriter and
market participants’ interpretations of firm information. We argue that underwriters are
considered insiders of the firm and know more about the company quality without being
manipulated by firm accounting reporting. However, market investors are outsiders of
the firm and rely interpretation of firm quality when a firm reveals positive signals to
general investors. Entrepreneurial retention in the event of IPO is viewed as a long term
commitment of entrepreneurs to promote the company further in the long run. Investors
take insider retention as a credible signal when reading a firm’s financial data. We
hypothesize the following:
Hypothesis 3.1: IPO underwriter valuation is unaffected by the level of discretionary accruals regardless of the levels of entrepreneurs’ stock retention. Hypothesis 3.2: IPO market valuation is associated with the level of discretionary accruals for firms with higher levels of entrepreneurs’ stock retention. 3 Sample Formation and Variable Definitions
3.1 Sample Formation
We identify our initial sample of issuing firms by selecting all firms that
completed an initial public offering between January 1990 and December 2004. Because
of concerns related to accruals measurement using the balance sheet approach and lack of
statements of cash flow data, all IPOs prior to 1990 are eliminated.6 Offering details are
11
obtained from the Thomson Financial SDC Platinum (SDC) database. Firm-specific
financial statement information is obtained from the active and research files of Industrial
COMPUSTAT. Market stock return information is obtained from the Center for
Research and Securities Prices (CRSP) database. To be included in our sample, each IPO
must satisfy the following sample selection criteria:
• The IPO is not a unit offering, closed-end fund, real estate investment trust
(REIT), American depository receipt (ADR), or penny stock (an IPO with offer
price below five dollars).
• The IPO has information on cash flows from operations (items #308 & #124), net
income (item #18), and total assets (item #6) – available in Compustat industrial
files for the current year and the prior two fiscal years (to enable computation of
discretionary current accruals in the year prior to the IPO year).
3.2 Variable Definitions
We identify known determinants of initial returns and IPO valuation, and
construct variables based on their definitions in prior studies. For instance, following
Lowry and Schwert (2002) and Cliff and Denis (2004), we construct price revision and
underwriter rank in our underpricing model. Lu, Kao, and Chen (2011) point out that
R&D expense and venture capitalist backing affect underpricing of high-tech firms in
Taiwan. Similarly, we construct fundamental accounting variables (sales, book values,
income, and R&D expenses) as transformed in Hand (2003) to specify the underwriter
and market valuation model. The following variables are used in our model
specifications:

12
1. IR: Initial return or underpricing, equals the percentage change in offer price at the
end of first trading day. Offer price is obtained from SDC, and the first trading day
closing price is obtained from CRSP.
2. RANK: Underwriter rank is based on Carter, Dark, and Singh (1998) and is updated
based on Loughran and Ritter (2004);
3. BIG8: Equals one if the issuing firm was audited by one of the big eight accounting
firms;
4. LOGAST: Log of the total assets of the firm at the end of the fiscal year prior to the
fiscal year of issuance (Compustat item #6);
5. VC: Equals one if the issuing firm is venture-backed, zero otherwise;
6. NYSE: Equals one if the IPO is listed on the New York Stock Exchange, zero
otherwise;
7. NMS: Equals one if the IPO is listed on the NASDAQ National Market System, zero
otherwise;
8. AMEX: Equals one if the IPO is listed on the American Stock Exchange, zero
otherwise;
9. TECH: Equals one if the IPO is in a high tech industry, zero otherwise;
10. CHANGEP: The percentage change between the middle of the original file price
range and the offer price;
11. CHANGEP+: Equals ChangeP when ChangeP is positive, zero otherwise;
12. MKT: The return to the CRSP equal-weighted portfolio NYSE-, AMEX-, and
NASDAQ-listed stocks for the 21 trading days prior to the offer date;
13. MKT+: Equals MKT when MKT is positive, zero otherwise;

13
14. Fundamental variables include firm-specific financial statement data. They include
(i) BV, book value of equity, (ii) SALES, sales revenue, and (iii) R&D, research and
development expenses. All variables are measured one year prior to the IPO year.
BV and the above variables that can take both positive and negative values, are
transformed using the functional form proposed by Hand (2003) and are used in prior
studies:
L(variable) = log (1+variable) when the variable is greater than or equal to zero;
L(variable) = –log (1–variable) when the variable is less than zero;
15. MEANPS: The mean of price to sales per share ratio of the IPO firm industry;
16. INSRET: Refers to insider retention, defined as (shares outstanding after offering-total
shares offered)/shares outstanding after offering based on Zheng and Stangeland
(2007);
17. HR (LR): An indicator variable for IPOs with entrepreneurial retention greater (less)
than our sample period median.
18. DCA: Estimated discretionary accruals using the modified Jones (1991) model.
Current accruals are computed as the difference between net income and cash flows
from operations, and are adjusted for size using the average of total assets. Expected
current accruals, also referred to as non-discretionary accruals, are estimated using
current year change in revenue and net property, plant, and equipment (scaled by total
assets). The weights assigned to these variables are derived from the regression of
current accruals on the change in revenue and net property, plant, and equipment
(with all variables scaled by total assets) in the estimation sample of industry peers in
the year preceding the IPO. Discretionary current accruals (DCA) are computed as

14
the difference between current accruals and non-discretionary current accruals. To
compute pre-IPO discretionary current accruals, we need two years of data prior to
the IPO year for estimation.
19. POS_DCA: POS_DCA equals DCA when DCA is positive; zero otherwise.
20. NEG_DCA: NEG_DCA equals DCA when DCA is negative; zero otherwise.
We create two variables, POS_DCA and NEG_DCA, based on the sign of the
discretionary current accruals. POS_DCA (NEG_DCA) equals DCA when DCA is
positive (negative) and zero otherwise. These variables allow for asymmetric
response to earnings management on IPO underpricing and valuation. In the context
of audit quality, Ashbaugh, LaFond, and Mayhew (2003) show that this separation of
positive and negative discretionary accruals better captures the potential asymmetric
relation between the variable of interest (in our case, underpricing) and earnings
management.
21. LOGOFFER: Log of IPO offer price.
22. LOGPRC: Log of IPO first day closing price.
3.3 Data Description
We construct samples based on availability of firm-specific financial data from
COMPUSTAT to estimate the reported and discretionary current accruals. Our initial
sample consists of 962 IPOs between January 1990 and December 2004 that meet the
stated sample selection criteria. As done in all prior studies, we trim the sample of
outliers to obtain more consistent and compelling evidence on the impact of accruals.
We remove the highest 1% influential outliers observations based on the approach of

15
Belsley, Kuh, and Welsch (1980) in our regression model, and present descriptive
statistics on the sample of 952 IPOs. Table I presents a breakdown of our sample by the
two-digit standard industry classification (SIC) codes with the most IPOs. The Computer
Hardware and Software industry (SIC codes 35 & 73) has the highest number of IPOs
(273), representing 28.68% of our IPO sample. Because of the extensive level of IPO
activity in the technology industry and its association with the IPO bubble years, we
identify and control for these 273 IPOs as technology IPOs in our subsequent analysis.
Eighteen industries with very low frequencies of IPOs are classified into the All Other
category, representing 10.61% of all IPOs. The remaining IPOs are assigned to the
remaining industries.
Table II presents the descriptive statistics on the key variables of interest by year.
The highest level of IPO activity is in the year 1997 (183 IPOs), whereas the lowest is in
1991 (three IPOs), consistent with the idea of hot-IPO markets. The average first day
returns are positive for all years, with the highest average first day initial returns
(64.45%) in the midst of the internet market bubble in 1999. The gross average proceeds
from IPOs are the highest in 2001 ($275.52 million) and the lowest in 1990 ($48.27
million). Average net income of the issuers ranges from a loss of $27.95 million in 1994
to profits of $95.7 million in 2001. Cash flows from operations range from an outflow of
$10.28 million in 2003 to an inflow of $109.57 million in 2001. From our descriptive
summary, IPOs that take place in down markets (mainly years 2001-2002) are for larger
firms (larger in total assets, on average) that are also more profitable (higher net income
cash flows from operations). IPOs issued in the boom period (mainly 1997-1999) seem
to have opposite firm characteristics.

16
The mean DCA pooled all years is -0.19. This is consistent with the findings of
prior studies (Ball and Shivakumar, 2008; Armstrong, Foster, and Taylor, 2008) that the
average discretionary current accruals (DCA), estimated using the modified Jones model,
are largely negative. A firm with negative (positive) DCA is more conservative
(aggressive) in using its discretionary current accruals to report lower (higher) earnings.
More often than not, IPO firms report negative average discretionary accruals. Panel B
of Table II presents the magnitude of the average DCA and the count of firms with
positive and negative DCA. Overall, slightly less than half the firms (42.23%) report
positive discretionary current accruals. However, the percentage of firms with positive
and negative DCA is non-stationary over time. In four out of 15 years, at least half or
more than half of the firms report positive average discretionary accruals. These
proportions indicate that positive earnings management is more pervasive than what the
overall averages would suggest. This non-stationary proportion of negative DCA firms
suggests that earnings manipulation prior to IPOs varies by period examined and that the
claim of no earnings management prior to the IPO needs a more careful examination.
Table III presents coefficients of correlation between the independent and the
dependent variables. The Pearson (Spearman) correlation coefficients and their
significance levels are presented above (below) the diagonal. The diagonal shows
variable mean and standard deviation. At a univariate level, initial return is positively
related to all the previously identified variables (offer price revision, underwriter ranking,
previous market returns) as well as to the fundamental accounting variables such as R&D
expenses. There is also a positive and weakly significant correlation between IR and
POS_DCA, and a negative and significant correlation between IR and NEG_DCA. These
17
findings suggest that both of the extreme ends of earnings management tend to receive
higher valuation by the markets. Also, the positive correlation between NEG_DCA and
INSRET is notable, consistent with higher quality earnings associated with high insider
retention. In the valuation context, there is no correlation of DCA, POS_DCA, and
NEG_DCA with both the LOGOFFER and LOGPRC, suggesting no association between
accruals and the pricing of the IPOs at the univariate level of analysis. Additional
controls are needed to fully understand the nature of the relation between these variables.
4 Empirical Results
A. Accruals Mispricing and Initial Return Tests
We test Hypothesis 1 on the relation between initial returns and discretionary
accruals by estimating the ordinary least square (OLS) regression model at the firm level
with initial returns as the dependent variable. Our model specification is as follows:
𝐼𝑅!,! = 𝛼 + 𝛽!𝐷𝐶𝐴!,!!! + 𝛽!𝑅𝐴𝑁𝐾!,! + 𝛽!𝐵𝐼𝐺8!,! + 𝛽!𝑉𝐶!,! + 𝛽!𝐿𝑂𝐺𝐴𝑆𝑇!,!!! +
𝛽!𝑁𝑌𝑆𝐸!,! + 𝛽!𝑁𝑀𝑆!,! + 𝛽!𝐴𝑀𝐸𝑋!,! + 𝛽!𝑇𝐸𝐶𝐻!,! + 𝛽!"𝐶ℎ𝑎𝑛𝑔𝑒𝑃!,!!! +
𝛽!!𝐶ℎ𝑎𝑛𝑔𝑒𝑃!,!!!! + 𝛽!"𝑀𝐾𝑇!,!!! + 𝛽!"𝑀𝐾𝑇!,!!!! + 𝛽!"𝐼𝑁𝑆𝑅𝐸𝑇!,! + 𝛽!"(𝐵𝑉)!,!!! +
𝛽!"𝐿(𝑆𝐴𝐿𝐸𝑆)!,!!! + 𝛽!"𝐿(𝑅&𝐷)!,!!! + 𝛽!"𝑀𝐸𝐴𝑁𝑃𝑆!,!!! + 𝑌𝑒𝑎𝑟 𝐷𝑢𝑚𝑚𝑖𝑒𝑠!,!+𝜀!,! (1)
The main variable of interest is DCA, the discretionary current accruals in the
fiscal year prior to the IPO fiscal year. Firms with DCA greater than zero (POS_DCA)
have accruals that exceed its “normal” levels, based on the industry benchmarks, by the
magnitude of the DCA. These firms can be viewed as aggressive in recognizing income.
Conversely, firms with negative DCA (NEG_DCA) are conservative in reporting their
earnings and have accruals below “normal” industry norms. LOGAST, natural log of the

18
firms’ total assets, provides a control for firm size7 and an inverse proxy of uncertainty
faced by investors (Habib and Ljungqvist, 1998; Lowry and Schwert, 2002). Lowry and
Schwert (2002) and Cliff and Denis (2004) suggest that listing exchange affects IPO
initial return. NYSE, NMS, and AMEX are dummy variables that control for this
documented exchange effect. TECH is a dummy variable that equals one when a firm is
involved in a high-tech industry, and zero otherwise. IPOs are assigned this classification
by the SDC Platinum Database, which is based on the SIC of the issuer (computer
equipment, electrical machinery, etc.). This separation is created because prior studies
have found significant differences in initial returns across firms that belong to technology
versus non-technology industries (Lowry and Schwert, 2002; Cliff and Denis, 2004). We
also include an insider retention percentage, as calculated in Zheng and Stangeland
(2007). Fan (2007) also proposes that earnings management and ownership retention
jointly affect the valuation of IPOs in the presence of information asymmetry.
Prior studies have also documented that the initial return varies by changes in
original file price and the offer price. Hanley (1993), Lowry and Schwert (2002), and
Cliff and Denis (2004) show that the higher the percentage change in file price, the higher
the initial return. In other words, these studies document that initial returns are
significantly larger for positive revisions. Therefore, we include two variables, ChangeP
and ChangeP+, to control for the price revision effect. Loughran and Ritter (2002) find
that price adjustment to publicly available information is also partial. Market activity
prior to the issuance of the IPO, a measure of public information, is captured by
computing the returns on CRSP equal-weighted portfolios of NYSE-, AMEX-, and
NASDAQ-listed stocks for the 21 trading days preceding the offer date. Again, to allow

19
for asymmetric effects on initial returns associated with negative and positive market
returns, both MKT and MKT+ are included in the regression specification.
Leland and Pyle (1977) show that firm valuation is positively related to the levels
of insider retention by the entrepreneur. An entrepreneur’s decision to forgo the benefits
of diversification with high stock retention comes from the signaling model that provides
superior insider information about expected future profits of the firm than what is
available to the average investor. Furthermore, higher stock retention aligns the
incentives of the principal (entrepreneur) and agent (investors), avoiding the moral hazard
problem. Other ways in which entrepreneurs can signal the quality of the IPO can
include selection of reputable auditors (Feltham, Hughes, and Simunic, 1991) and/or
underwriters. Xie, Lee, and Zhou (2009) argue that auditors and venture capitalists can
also play different roles in restraining earnings management in the IPO process. Auditors
check the accuracy of financial statement information, and venture capitalists play a
monitoring and advising role through the IPO. Underwriter reputation is a known factor
that affects initial returns (Carter, Dark, and Singh. 1998; Loughran and Ritter, 2004).
We control for IPO quality using variables used in the prior research–INSRET as a
measure of insider stock retention; BIG8, a dummy variable to separate IPOs audited by
the eight most reputed auditors; and VC, IPOs backed by the venture capitalists. We also
use underwriter reputation rank as developed in Carter, Dark, and Singh (1998) and later
updated in Loughran and Ritter (2004). This Rank variable takes a value of one for lesser
known investment banking firms and a value of nine for the best known names in the
underwriting business; others are ranked in between these two categories.8 Because
fundamental accounting variables can affect valuation and initial returns, we include sales

20
revenue (SALES), book value of equity (BV), and Research and Development Expenses
(R&D) in select specifications. We pool the data on all IPOs over the 15-year period in
estimating the model.9
Table IV presents results from the estimation of model (1). Columns one and
two, respectively, present results without and with the fundamental accounting variables
included in the specification. To capture the possibility of an asymmetric impact of
aggressive and conservative reporting on the initial return, we replace DCA with
POS_DCA and NEG_DCA in specification (1) and present the results without and with
the fundamental accounting variables in columns three and four, respectively. The
goodness of fit for all models is very similar (adjusted R2 around 48%) and so are the
magnitudes and significance of most of the variables. CHANGEP+ is significant at the
0.01 level for all four models, consistent with the findings of Cliff and Denis (2004) and
Lowry and Schwert (2002). In specifications with DCA, the coefficient is positive but
not significantly different from zero at conventional levels of significance (0.05 or better)
for both the specifications. These results suggest no association between initial return
and the levels of pre-IPO discretionary current accruals. When DCA is split by sign, the
coefficients for POS_DCA are 3.1577 and 3.3473, respectively, in specification with and
without the fundamental accounting variables. Both coefficients are positive and
significantly different from zero at conventional levels of significance (0.05 or better).
These results suggest that the firms that manage earnings upwards through accruals tend
to have higher initial returns. For these firms, a unit increase in the level of discretionary
accruals translates into a one basis point increase in return on assets above and beyond
the industry average through management of accruals. Thus, a one basis point

21
improvement in return on assets through accruals translates into a 3.2% to 3.3% increase
in initial returns. These results indicate significant payoffs from the management of
earnings. The coefficient for NEG_DCA is not significantly different from zero. These
results suggest that for conservative issuers, there is no significant difference in the
valuation of discretionary accruals. Either both the underwriters and markets do not
assign any weight to discretionary accruals or they both assign very similar weights. To
further understand earnings management prior to the IPOs as source of underpricing, we
develop a specification of the IPO valuation model for underwriters (hired by the issuer
to propose or validate firm value) and market participants (who participate in first day
trading). We estimate the following two equations:
𝐿𝑜𝑔𝑂𝑓𝑓𝑒𝑟!,! = 𝛼 + 𝛽!!𝑃𝑂𝑆_𝐷𝐶𝐴!,!!! + 𝛽!!𝑁𝐸𝐺_𝐷𝐶𝐴!,!!! + 𝛽!!(𝐵𝑉)!,!!! +
𝛽!!𝐿(𝑆𝑎𝑙𝑒𝑠)!,!!! + 𝛽!!𝐿(𝑅&𝐷)!,!!! + 𝛽!!𝑀𝑒𝑎𝑛 𝑃𝑆!,!!! + 𝛽!!𝐼𝑛𝑠𝑖𝑑𝑒𝑟!,!+𝛽!!𝑅𝑎𝑛𝑘!,! +
𝛽!!𝐵𝑖𝑔8!,! + 𝛽!"!𝑉𝐶!,! + 𝛽!!!𝐿𝑜𝑔𝑎𝑠𝑡!,!!! + 𝛽!"!𝑁𝑌𝑆𝐸!,! + 𝛽!"!𝑁𝑀𝑆!,! +
𝛽!"!𝐴𝑀𝐸𝑋!,! + 𝛽!"!𝑇𝐸𝐶𝐻!,! + 𝛽!"!𝐶ℎ𝑎𝑛𝑔𝑒𝑃!,!!! + 𝛽!"!𝐶ℎ𝑎𝑛𝑔𝑒𝑃!,!!!! +
𝛽!"!𝑀𝐾𝑇!,!!! + 𝛽!"!𝑀𝐾𝑇!,!!!! +𝑌𝑒𝑎𝑟 𝐷𝑢𝑚𝑚𝑖𝑒𝑠!,!+𝜀!",! (2.1)
𝐿𝑜𝑔𝑃𝑟𝑐!,! =
𝛼 + 𝛽!!𝑃𝑂𝑆_𝐷𝐶𝐴!,!!! + 𝛽!!𝑁𝐸𝐺_𝐷𝐶𝐴!,!!! + 𝛽!!(𝐵𝑉)!,!!! + 𝛽!!𝐿(𝑆𝑎𝑙𝑒𝑠)!,!!! +
𝛽!!𝐿(𝑅&𝐷)!,!!! + 𝛽!!𝑀𝑒𝑎𝑛 𝑃𝑆!,!!! + 𝛽!!𝐼𝑛𝑠𝑖𝑑𝑒𝑟!,!+𝛽!!𝑅𝑎𝑛𝑘!,! + 𝛽!!𝐵𝑖𝑔8!,! +
𝛽!"!𝑉𝐶!,! + 𝛽!!!𝐿𝑜𝑔𝑎𝑠𝑡!,!!! + 𝛽!"!𝑁𝑌𝑆𝐸!,! + 𝛽!"!𝑁𝑀𝑆!,! + 𝛽!"!𝐴𝑀𝐸𝑋!,! +
𝛽!"!𝑇𝐸𝐶𝐻!,! + 𝛽!"!𝐶ℎ𝑎𝑛𝑔𝑒𝑃!,!!! + 𝛽!"!𝐶ℎ𝑎𝑛𝑔𝑒𝑃!,!!!! + 𝛽!"!𝑀𝐾𝑇!,!!! +
𝛽!"!𝑀𝐾𝑇!,!!!! +𝑌𝑒𝑎𝑟 𝐷𝑢𝑚𝑚𝑖𝑒𝑠!,!+𝜀!",! (2.2)

22
Both equations (2.1) and (2.2) are specified using the same independent variables.
The Nx1 vector of random error terms is assumed to have a mean of zero, but different
variance, as follows:
𝜀!" ~𝑁(0,𝜎!!)
𝜀!" ~𝑁(0,𝜎!! )
Because both equations involve valuation of the same set of IPOs, the errors terms
in these two equations will be correlated across firms. These equations fit into the
seemingly unrelated regressions (SUR) framework proposed by Zellner (1962). When
estimated as stacked equations, the disturbances term will have the following variance-
covariance structure:
Ω = Σ ⨂ 𝐼!
Where Σ = 𝜎!! 𝐶𝑜𝑣 (𝜀!" , 𝜀!")𝐶𝑜𝑣 (𝜀!" , 𝜀!") 𝜎!!
,
where 𝐼! is an identity matrix of size N, and ⨂ is the Kronecker product.
This structure results in more efficient estimates of covariance across equations,
and enables us to test for the significance of differences in the magnitude of coefficients
across equations (Greene, 2008). We estimate equations 2.1 and 2.2 jointly, and the
estimation results appear in Table V. The results from the underwriter (market) valuation
model, with log of offer price (market price) as the dependent variable, appear in the first
(second) column. The coefficients of the fundamental variables, SALES and R&D, are
significant in both the underwriter and the market valuation models, consistent with the
finding of prior studies. Underwriter reputation proxy, RANK, and auditor reputation
indicator, BIG8, both positively affect the offer and market prices. The discretionary
accruals, regardless of the sign, have no effect on the underwriter offer price because the
23
coefficients for both POS_DCA and NEG_DCA are not significantly different from zero.
In the market valuation model, the coefficient of POS_DCA is positive and significant,
whereas the one for NEG_DCA is not at conventional levels of significance (0.05 or
better). In the tests of significance of difference in coefficients across equations, the
magnitude of POS_DCA is significantly larger in the market valuations. These results
suggest that underwriters see through the impact of aggressively reported earnings on
valuation, whereas markets fail to do so.10 The findings in Table V provide sufficient
evidence to reject the null Hypothesis 2 in favor of the alternate that the markets assign
higher weights to discretionary current accruals than underwriters in the valuation of
IPOs.
Our last table extends equation 2.1 & 2.2. to further examine the impact of
entrepreneurial retention and earnings management jointly on share valuation. Again,
these equations fit into the seemingly unrelated regressions (SUR) framework proposed
by Zellner (1962). We estimate two major models based on separate and joint impact of
insider retention and earnings management. We further test the difference between
coefficients from offer price to market price to interpret weights assigned by underwriters
and market on share valuation.
Insiders and outsiders of a firm are usually considered to be two parties with
asymmetric information. Insider retention ratio could be a signal on firm future prospects
and could further explain differences in share valuation. We separate firms with high
versus low insider stock retention on the basis of the median insider stock retention rate
amongst all IPOs in our sample. The results from this estimation of seemingly unrelated
regressions appear in Table VI. The insider dummy variable (HR) is significant in both

24
underwriter and market valuation models. Insider stock retention is viewed as a measure
of IPO quality and a proxy for the entrepreneurs’ horizon. These results suggest that
there is a positive relationship between level of insider retention and share values. Both
underwriters and market investors seem to take this signal into consideration when
pricing the stock. However, the difference between underwriters and market weights do
not appear to be significantly different from each other.
Our descriptive tests (not reported) indicate a significant negative correlation
between the insider retention and the DCA variables. IPOs with high insider retention
tend to have relatively more negative discretionary accruals. To isolate these effects, we
create interaction variables for the low and high retention IPOs and for Pos_DCA and
Neg_DCA. HR (LR) refers to an IPO with an insider retention rate greater (less) than the
sample period median. Pos*HR (Pos*LR) and Neg*HR (Neg*LR) are the interaction of
Pos_DCA and Neg_DCA with HR (LR), and they represent aggressive and conservative
IPOs that have high (low) insider retention. We include these four variables in our
valuation model along with all other variables previously found to be associated with
underpricing. Table VI, columns four and five, presents results from these estimations.
In column four, the coefficients for all four interaction variables are not significantly
different from zero, consistent with underwriters unaffected by the accruals. Only the
coefficients for associated with high retention dummy are significant in the market
valuation model (column five); the remaining two with low retention coefficients are not
statistically significant. The findings suggest that market participants take high insider
retention rate as a credible signal and price shares up or down according to the
discretionary accruals reported by the firm. Underwriters and market investors assign

25
different weights to pricing only in the case when retention rate is high. In the expanded
valuation model, the only other variables that seem to affect market and underwriter
valuation weights assigned are to price revisions, firm size and listing through NYSE and
NMS. All other valuation relevant variables receive weights that are not significantly
different across models. Our results suggest that underwriters see through earnings
management in general. However, market participants may not be able to see through
earnings management and take insider retention as a credible signal and price share
accordingly.
5 Conclusions
Prior studies have examined and found evidence of earnings management to
achieve certain strategic outcomes. However, in the context of IPOs, the evidence of
some recent studies has been mixed, leading to the conclusion that earnings management
does not exist prior to the IPO. We find that the result of negative mean pre-IPO
discretionary accruals is non-stationary when examined over time and that the proportion
of firms engaging in earnings management is not that small in any year. The mean
accruals are even positive in certain other years, with manipulation being quite
widespread in some years. Our examination of firms that manage earnings upwards
reveals that these firms receive a higher initial return on the day of the IPO. On average,
a one basis point improvement in ROA from upward manipulation of discretionary
accruals results in a 3.22% improvement in first day initial returns. This improvement is
substantial compared to the overall magnitude of initial returns.

26
Under no circumstances do underwriters assign any weight to discretionary
accruals in their valuation of the IPOs. This is consistent with underwriters being able to
see through earnings management and the impact of accruals on current and future
earnings. This differential valuation of discretional accruals could also be driven by the
difference in information asymmetry faced by the markets and underwriters.
Underwriters who are privy to additional information are better able to see through
earnings management or rely on other factors (or both) than the markets.
However, this earnings management through accruals is only helpful in achieving
favorable share valuations from the markets, and not at all the times. We find that when
using insider stock retention as a proxy for IPO quality, discretionary accruals are
negatively associated with insider stock retention. Discretionary accruals serve as an
additional proxy for the quality of the IPO. Our subsequent results show that markets
assign higher weights to discretionary accruals of aggressive earning-reporters only when
the insider stock is high. No weight is assigned to discretionary accruals when insider
stock retention is low. These results suggest that markets use IPO quality as a screen for
underwriters’ credibility in determining the role of earnings in valuation. Earnings are
taken more at face value when the market and entrepreneurs’ incentive are aligned with
high insider stock retention. When insider stock retention is low, earnings are more
carefully examined, presumably because of lack of trust, and no weight is assigned to
discretionary accruals by the markets. Under no circumstances do underwriters assign
any weight to discretionary accruals in their share valuation of the IPOs. This is
consistent with underwriters being able to see through earnings management and the
impact of accruals on current and future earnings. This differential valuation of

27
discretional accruals could also be driven by the difference in information asymmetry
faced by the markets and underwriters. Underwriters who are privy to additional
information are better able to see through earnings management or rely on other factors
(or both) than the markets.
28
REFERENCES
Aggarwal, Rajesh, Sanjai Bhagat, and Srinivasan Rangan, 2009. The impact of fundamentals on IPO valuation, Financial Management 38, 253-284.
Aharony, Joseph, Chan-Jane Lin, and Martin P. Loeb, Fall 1993. Initial public offerings,
accounting choices, and earnings management, Contemporary Accounting Research 10:1, 61-81.
Allen, Franklin and Gerald R. Faulhauber, 1989. Signaling by underpricing in the IPO
market, Journal of Financial Economics 23, 303-324. Armstrong, C., G. Foster, and D. J. Taylor, 2008. Earnings management around initial
public offerings: A re-examination, Working Paper, Stanford University. Ashbaugh, H., R. LaFond, and B. W. Mayhew, 2003. Do non-audit services compromise
auditor independence? Further evidence, The Accounting Review 78, 611-39. Ball, R. and L. Shivakumar, 2008. Earnings quality at initial public offerings, Journal of
Accounting and Economics 45, 324-349. Bartov, Eli, Partha Mohanram, and Chandrakanth Seethamraju, 2002. Valuation of
internet stocks – an IPO perspective, Journal of Accounting Research 40, 321-346. Beatty, Randolph and Jay Ritter, 1986. Investment banking, reputation, and the
underpricing of initial public offerings, Journal of Financial Economics 15, 213-232. Belsley, D. A., Kuh, E., and Welsch, R. E., 1980. Regression Diagnostics: Identifying
Influential Data and Sources of Collinearity. New York: Wiley. Benveniste, Lawrence M. and Paul A. Spindt, 1989. How investment banks determine the
offer price and allocation of new issues, Journal of Financial Economics 24, 343-362. Bergstresser, Daniel B., Mihir A. Desai, and Joshua Rauh, 2006. Earnings manipulation,
pension assumptions, and managerial investment decisions, Quarterly Journal of Economics 121, 1, 157-195.
Booth, James R. and Richard L. Smith, 1986. Capital raising, underwriting and the
certification hypothesis, Journal of Financial Economics 15, 213-361. Carter, Richard B., Frederick H. Dark, and Ajai K. Singh, 1998. Underwriter reputation,
initial returns, and the long-run performance of IPO stocks, Journal of Finance 53, 285-311.
Cheng, Agnes C.S. and Wayne B. Thomas, 2006. Evidence of the abnormal accrual
anomaly incremental to operating cash flow, The Accounting Review 81, 1151-1127.

29
Cliff, Michael T. and David J. Denis, 2004. Do initial public offering firms purchase analyst coverage with underpricing? Journal of Finance 59, 2871-2901.
Daniel, N. D., D. J. Denis, and L. Naveen, 2008. Do firms manage earnings to meet
dividend thresholds? Journal of Accounting and Economics 45, 2-26. Darrough, Masako and Srinivasan Rangan, 2005. Do insiders manipulate earnings when
they sell their shares in an Initial Public Offering? Journal of Accounting Research 43 (1).
Desai, H., S. Rajgopal, and M. Venkatachalam, 2004. Value-glamour and accruals
mispricing: One anomaly or two? The Accounting Review 79, 355-385. DuCharme, L. L., P. H. Malatesta, and S. E. Sefcik, 2004. Earnings management, stock
issues and shareholder lawsuits, Journal of Financial Economics 71, 27-49. Erickson, M. and W. Wang, 1999. Earnings management by acquiring firms in stock for
stock mergers, Journal of Accounting and Economics 27, 149-176. Fan, Qintao, 2007, Earnings management and ownership retention for initial public
offering firms: Theory and evidence, Accounting Review 82, 27-64. Feltham, G., J. Hughes, and D. Simunic, 1991. Empirical assessment of the impact of
auditor quality on the valuation of new issues, Journal of Accounting and Economics 14, 375-399.
Friedlan, John M., 1994. Accounting choices of issuers of Initial Public Offerings.
Contemporary Accounting Research 11:1, 1-31. Gong, G., H. Louis, and A. X. Sun, 2008. Earnings management and firm performance
following open-market repurchases, Journal of Finance 63, 947-1020. Greene, William, Prentice Hall, Econometric Analysis 6th edition, 2008. Guo, Rejin, Baruch Lev, and Charles Shi, 2006. Explaining the short- and long-term IPO
anomalies in the US by R&D, Journal of Business Finance and Accounting 33, 550-579.
Habib, M. A. and Alexander Ljungqvist, 1998. Underpricing and IPO proceeds,
Economics Letters. Hand, J. R. M., 2003. Profits, losses and non-linear pricing of internet stocks in J. R. M.
Hand and B. Lev, Eds., Intangible Assets: Values, Measures and Risks, New York, NY: Oxford University Press.

30
Hanley, Kathleen Weiss, 1993. The underpricing of initial public offering and the partial adjustment phenomenon, Journal of Financial Economics 34, 231-250.
Hill, Paul, Mar. 2006. Ownership structure and IPO underpricing, Journal of Finance &
Accounting 33 (1) & (2), 102-126. Hribar, Paul and Daniel W. Collins, 2002. Errors in estimating accruals: Implications for
empirical research, Journal of Accounting Research 40 (1). Ibbotson, Roger G., 1975. Price performance of common stock new issues, Journal of
Financial Economics 2, 235-272. Jones, Jennifer, 1991. Earnings management during import relief investigations, Journal
of Accounting Research 29, 193-228. Klein, A., 1996. Can investors use the prospectus to price initial public offerings? The
Journal of Financial Statement Analysis 2, 23-40. Leland, H. and D. Pyle, 1977. Information asymmetries, financial structure and financial
intermediation, Journal of Finance 32, 371-387. Ljungqvist, Alexander, Vikram Nanda, and Rajdeep Singh, 2006. Hot market, investor
sentiment, and IPO pricing, Journal of Business 79, 1667-1702. Ljungqvist, Alexander and William J. Wilhelm, 2003. IPO pricing in the dot-com bubble,
Journal of Finance 58, 723-752.
Ljungqvist, A., 2007. “IPO underpricing,” in: B.E. Eckbo (ed.), Handbook of Corporate Finance, North-Holland.
Loughran, Timothy and Jay R. Ritter, 2002. Why don’t issuers get upset about leaving
money on the table in IPOs? Review of Financial Studies Special 15, 413-443. Loughran, Timothy and Jay R. Ritter, 2004. Why has IPO underpricing changed over
time? Financial Management 33, 5-37. Louis, H., 2004. Earnings management and the market performance of acquiring firms,
Journal of Financial Economics 74, 121-148. Lowry, Michelle and William Schwert, 2002. IPO market cycles: Bubbles or sequential
learning? Journal of Finance 57, 1171-1200. Lu, Cheng Shou, Lanfeng Kao, and Anlin Chen, 2011, The effects of R&D, venture capital, and technology on the underpricing of IPOs in Taiwan, Review of Quantitative Finance and Accounting, published online October 18 Miller, E.M. (1977), “Risk, Uncertainty, and Divergence of Opinion,” Journal of

31
Finance, 32, 1151-1168. Purnanandam, Amiyatosh K. and Bhaskaran Swaminathan, 2004. Are IPOs really
underpriced? The Review of Financial Studies 17 (3), 811-848. Rock, Kevin, 1986. Why are new issues underpriced? Journal of Financial Economics
15, 187-212. Sloan, Richard G., 1996. Do stock prices fully reflect information in accruals and cash
flows about future earnings? The Accounting Review 71, 3, 289-315. Teoh, Siew Hong, Ivo Welch, and T.J. Wong, 1998. Earnings management and the long-
run market performance of Initial Public Offerings, Journal of Finance 53 (6), 1935-1974.
Teoh, Siew Hong, Ivo Welch, and T.J. Wong, 1998a. Earnings management and the
underperformance of seasoned equity offerings, Journal of Financial Economics 50, 63-99.
Welch, Ivo, 1989. Seasoned offerings, imitation costs, and the underpricing of Initial
Public Offerings, Journal of Finance 44, 421-450. Xie, H., 2001. The mispricing of abnormal accruals, The Accounting Review 76, 357-373. Xie, Yan, Heiwai Lee, and Jian Zhou, 2009. Roles of underwriters in constraining
earnings management in initial public offerings, Working Paper . Zellner, Arnold, 1962. An efficient method of estimating seemingly unrelated regressions
and tests for aggregation bias, Journal of American Statistical Association 57, 348-368.
Zheng, Steven and David Stangeland, 2007. IPO underpricing, firm quality, and analyst
forecasts, Financial Management 36, 1-20.