the underpricing of initial public offerings: further
TRANSCRIPT
MontréalSeptembre 2001
Série ScientifiqueScientific Series
2001s-50
The Underpricing ofInitial Public Offerings:
Further Canadian Evidence
Maher Kooli, Jean-Marc Suret
CIRANO
Le CIRANO est un organisme sans but lucratif constitué en vertu de la Loi des compagnies du Québec. Lefinancement de son infrastructure et de ses activités de recherche provient des cotisations de ses organisations-membres, d’une subvention d’infrastructure du ministère de la Recherche, de la Science et de la Technologie, demême que des subventions et mandats obtenus par ses équipes de recherche.
CIRANO is a private non-profit organization incorporated under the Québec Companies Act. Its infrastructure andresearch activities are funded through fees paid by member organizations, an infrastructure grant from theMinistère de la Recherche, de la Science et de la Technologie, and grants and research mandates obtained by itsresearch teams.
Les organisations-partenaires / The Partner Organizations
•École des Hautes Études Commerciales•École Polytechnique•Université Concordia•Université de Montréal•Université du Québec à Montréal•Université Laval•Université McGill•Ministère des Finances du Québec•MRST•Alcan inc.•AXA Canada•Banque du Canada•Banque Laurentienne du Canada•Banque Nationale du Canada•Banque Royale du Canada•Bell Québec•Bombardier•Bourse de Montréal•Développement des ressources humaines Canada (DRHC)•Fédération des caisses Desjardins du Québec•Hydro-Québec•Industrie Canada•Pratt & Whitney Canada Inc.•Raymond Chabot Grant Thornton•Ville de Montréal
© 2001 Maher Kooli et Jean-Marc Suret. Tous droits réservés. All rights reserved.Reproduction partielle permise avec citation du document source, incluant la notice ©.Short sections may be quoted without explicit permission, if full credit, including © notice, is given to the source.
ISSN 1198-8177
Ce document est publié dans l’intention de rendre accessibles les résultats préliminairesde la recherche effectuée au CIRANO, afin de susciter des échanges et des suggestions.Les idées et les opinions émises sont sous l’unique responsabilité des auteurs, et nereprésentent pas nécessairement les positions du CIRANO ou de ses partenaires.This paper presents preliminary research carried out at CIRANO and aims atencouraging discussion and comment. The observations and viewpoints expressed are thesole responsibility of the authors. They do not necessarily represent positions of CIRANOor its partners.
The Underpricing of Initial Public Offerings:Further Canadian Evidence*
Maher Kooli†, Jean-Marc Suret‡
Résumé / Abstract
La présente étude propose une analyse en profondeur du comportementdes émissions initiales canadiennes de 1991 à 1998, en incluant les titres émisdans le cadre des programmes de Capital Pool. Les résultats montrent que la sousévaluation initiale persiste au Canada, en moyenne. Toutefois, le degrés de sous-évaluation est fortement lié au type d’émission : les émissions d’unités et cellesqui se font dans le cadre des programmes de Capital Pool sont davantage sousévaluées que les émissions d’actions ordinaires hors Capital pool. Les émissionsde taille moyenne et de grande taille semblent correctement évalués au Canada,contrairement à ce que l’on observe sur la plupart des marchés et notamment auxÉtats-Unis. La sous-évaluation initiale concerne donc essentiellement lesémissions de 20 millions de $ et moins, qui représentent toutefois 76,3 p. cent desémissions analysées. La sous-évaluation initiale reste donc un problème majeurpour les petites et moyennes entreprises canadiennes. Parmi les autres explicationspossibles à la sous-évaluation initiale, seule la période d’émission semble jouer unrôle significatif, en plus de la taille et de l’appartenance ou non au programme desCapital Pool.
Evidence of underpricing of initial public offerings (IPOs) has spawned aconsiderable theoretical literature attempting to explain the apparentcontradiction to market efficiency. This article reassesses that evidence byexamining not just common shares Canadian IPOs, but also unit and Junior stockIPOs from the period 1991-1998. Our study shows that Canadian IPOs as majorIPOs in the world are underpriced. However, the degree of underpricing dependson the type of the issue. Unit IPOs and Junior Capital Pool (JCP) IPOs are moreunderpriced than common shares IPOs. Our results also suggest that the IPOmarket in Canada is «good» only for large offerings. We have entertained anumber of possible explanations for the high initial return of Canadian issuingfirms. We find that the underpricing is significantly related to the size and theperiod of the issue and to whether the IPO is a JCP or not. On the other hand, theprestige of the underwriter is positively related to the underpricing but thisrelationship is not significant.
Mots Clés : Émissions initiales, sous évaluation, Canada
Keywords: Initial public offerings, underpricing, hot market * Corresponding Author: Jean-Marc Suret, CIRANO, 2020 University Street, 25th floor, Montréal, Qc, CanadaH3A 2A5 Tel.: (514) 985-4000 Fax: (514) 985-4039 email: [email protected]† CIRANO‡ Université Laval and CIRANO
1
Introduction
The existence of the underpricing phenomenon in initial public offerings (IPOs) is welldocumented by the finance literature, and seems to be a common characteristics in most ofinternational markets. Recently, with high-tech and Internet stock offerings making huge gains ontheir market debuts, investors, analysts and researchers have again focused their attention on theIPO market. Why are some IPOs more underpriced than others?
Several reasons have been advanced for the underpricing phenomenon with different theoriesfocusing on various aspects of the going public process. Furthermore, these explanations are notmutually exclusive. This research makes three contributions to the IPO literature. First, despitethe persistence of the phenomenon and its internationality, researchers are still looking for thereasons that fit with modern financial theories. Ritter (1998) argues that the underpricingphenomenon has persisted for decades with no signs of its imminent demise. Second of all, onlyfew studies have analyzed the Climate of IPOs in Canada and they were for the 1980s period. Itwould be interesting to reexamine the underpricing phenomenon during the 1990s. The newissues market in Canada has changed considerably in the last decade. There are many more IPOsbeing issued now. The type and the quality of companies going public have also changed overtime. Brean (1997) points out that “Overpriced IPOs represent excessive rewards to venturecapital, an allocative inefficiency in financial markets. On these matters, the evidence in Canadais slim but suggestive”. Jog (1997) has analyzed the underpricing phenomenon of the CanadianStock Market between 1984 and 1994 and pointed out that Canadian capital markets are doing agood job in allocating risk capital to entrepreneurs and those Canadian entrepreneurs and policymakers need not to be too concerned about underpricing in Canada. Nevertheless, the reasons forthe declining average underpricing observed by the author are unclear. He also adopted a limitedsample of IPOs listed only on the Toronto Stock Exchange. To assess the Canadian climate forIPOs, information on the four Canadian stock markets is needed. Differences in both theregulatory aspects of the various exchanges and the firms going public may affect the IPOprocess. Third, the Canadian environment is motivating because a large number of the quotedcompanies are relatively small. Furthermore, the institutional characteristics of the Canadianmarket allow for an independent test of the most well-known issues in the US literature.Therefore, the aim of our research is to widen the sample size, to update the previous results andpoint out the role of the underpricing determinants. In a new approach, we consider not only theeffects of several factors, namely the gross proceed of the issue, the role of underwriter, theindustry and the market climate, but we also examine the short term behaviour of three differenttypes of unseasoned issues: common stock issues, units issues and junior stock issues.
Using a wide sample of 971 Canadian IPOs from the period 1991-1998, we find that the averageinitial return for common shares IPOs (excluding junior stocks) was 20,57% (22,57% with amarket adjusted measure). However, the degree of underpricing depends on the type of the issue.Unit IPOs and Junior Capital Pool (JCP) IPOs are more underpriced than common shares IPOs.Our univariate analysis suggests that the IPO market in Canada is « good » only for largeofferings. Also, we find that underpricing decreased with the size of the issue and the prestige ofthe underwriter and that mining, oil and gas, real estate and technology IPOs are more
2
underpriced than those from other sectors. Interestingly, we find that the Albertan and BritishColumbia IPOs are more underpriced than Ontarian IPOs. This result may be explained by theexperience of large firms who are listed on the Toronto Stock Exchange. We have entertained anumber of possible explanations for the high initial return of Canadian issuing firms. We find thatthe underpricing is significantly related to the size and the period of the issue and to whether theIPO is a JCP or not. On the other hand, the prestige of the underwriter is positively related to theunderpricing but this relationship is not significant.
The remainder of this paper is organized as follows. Section 1 reviews some of the internationalliterature on IPO’s underpricing and underlines some of the reasons for this phenomenon. Wealso discuss the methodological dimension of measuring the degree of underpricing. Section 2contains a discussion of the data and the methodology used in the empirical investigation.Evidence on underpricing is presented in the section 3. We also present the cross-sectionalpatterns and the results of the multiple regression tests. Section 4 summarizes the findings andprovides concluding remarks.
1. The evidence of underpricing
Many past studies have indicated that the IPO of common stock have been often notablyundervalued in the primary market, with some movement towards a security’s intrinsic valueobserved in secondary trading. This short-run phenomenon has been experienced in everycountry with a stock market, although the degree of underpricing varies from country to country(see table 1). The next section resumes some of the empirical studies that document largeabnormal returns on the first day of trading and give us a theoretical backdrop for the empiricalresults.
1.1 Prior research
In the U.S. early studies that document huge underpricing for IPO include Ibbotson and Jaffe(1975), Ritter (1984 and 1991) and Loughran, Ritter and Rydqvist (1994). Ibbotson and Jaffe(1975) examined the existence of « hot issue » markets and found that a time series of IPOreturns exhibited serial dependence and that « hot issue » markets persist over time. Ritter (1984)suggested that the phenomena of « hot issue » markets is restricted to natural resource securitiesand that over the 15 months beginning January 1980, U.S. IPO securities experienced a gain of48,8% on the first day of trading. The study of Loughran, Ritter and Rydqvist (1994) confirmedthis IPO underpricing phenomenon in 25 countries, with higher IPO underpricing in developingthan in developed markets. For example, the level of underpricing in the US was 15,3% (for10,626 IPOs during 1960-92), in France was 4,2% (for 187 IPOs during 1983-92) and inMalaysia was 80,3% (for 132 IPOs during 1980-91). Lowry and Schwert (2000) find that thenumber of IPOs and the average initial returns are highly autocorrelated and that both priceupdate and the initial return are predictable based on publicly available information. Huang andLevich (1998) also find that initial returns for non OECD countries average 65,9% versus 11,1%initial returns in OECD countries. They suggest that these differences are highly significant and
3
provide strong evidence favouring the asymmetric information theory. Su and Fleisher (1999)analyse Chinese IPOs during the period of 1985-1987 and find that the level of underpricing forA-shares is 948,6%. Arosio, Giudici et Paleari (2000a) analyse a survey of Internet stock IPOs,listed on the Euro’s secondary Stock Exchanges1 and find an initial average return equal to76,43%. They document that this huge underpricing is strongly related to the informationgathered during book-building activity in the pre-selling period, which drives the revision of theprospectus price range and signals the IPO quality to uninformed investors. Chowdhry andSherman (1996) document that the average first-day return varies systematically with themechanism used to price and distribute IPOs. Ritter (2001) points out that fixed price offeringsare more underpriced than offerings built by the book. Ljungqvist, Jenkinson and Wilhelm (2000)analyse 2105 IPOs in 61 non-US markets during the period 1992-1999 and document that thedirect costs of book-building are twice as large as direct costs for fixed-price offers, but the book-building leads to substantially less underpricing. On the other hand, Derrien and Womack (2000)analyse the French IPOs market during the period 1992-1998 and find that auctions IPOs are lessunderpriced (9,7%) than book-building IPOs (16,9%). For Taiwan, Liaw, Liu and Wei (2000)find that the degree of underpricing for price-fixed IPOs is 34,6% and 7,8% for auctions IPOs.Kutsuna and Smith (2000) also point out that in Japan, auctions IPOs are less underpriced(11,50%) than book-building IPOs (70,81%).
Canadian studies of IPOs that report underpricing include Jog and Riding (1987), Suret, Cormierand Lemay (1990), Jog and Srivastava (1994) and Jog (1997). Jog and Riding (1987) reportedthat short-term returns following the IPO averaged 11,5% between 1971 and 1983. Suret,Cormier et Lemay (1990) reported average initial returns of 12% for 86 Toronto Stock ExchangeIPOs, over the period 1979 to 1985, and no underpricing for 63 IPOs issued under the QuebecStock Saving Plan (QSSP). Jog and Srivastava (1994) extended the empirical analysis of Jog etRiding (1987) and reported average initial returns of 5,67% between 1984 and 1992. Jog (1997)again extended the analysis of Jog and Srivastava (1994), considering all the Canadian IPOsmade from 1993 to 1994 and reported average initial returns of 7,89%. Jog (1997) point out thatthe degree of underpricing in Canada was much lower in the 1980s and the early 1990s than hadbeen reported for previous periods. Finally, Jog and Srivastava (1994) and Jog (1997) concludethat Canadian capital markets are doing a good job in allocating risk capital to entrepreneurs, andthere is no reason to be concerned about the pricing mechanism for Canadian IPOs. However,this evidence is restricted to firms which qualified for listing on the Toronto Stock Exchange(TSE). Although the TSE is Canada’s largest exchange, it is dangerous to assume that the resultsdrawn from it necessarily apply to the other public equity markets. Differences in the listingrequirements and other regulatory aspects of the various exchanges may affect the IPO process.For example, over the period 1983 to 1988, Falk and Thornton (1992) reported average adjustedinitial returns of 19% for TSE IPOs, 25% for Montreal Exchange (ME) IPOs and 307% for
1 Arosio, Guidici et Paleari (2000a) consider in their study the pan-European second markets (EASDAQ and EURO-NM). EASDAQ is a Belgian stock market founded in 1996 by US and European financial intermediates. Euro-NM isa network of regulated national markets made up by the German Neur Markt, the Dutch Euro-NM Amsterdam, theBelgian Euro-NM Belgium and the Italian Nuovo Mercato.
4
Alberta Stock Exchange (ASE) IPOs. Their sample of ASE securities included both regularlylisted ASE and JCP securities.
Several explanations are possible for these cross-country differences. Institutional differencesprobably play an important role, as underwriters follow different price setting and allocationstrategies across country (auctions IPO, direct public offerings, book-building offerings, etc…).
1.2 Underpricing and ex ante uncertainty
In this section, we will take a conceptual look at the sources of underpricing, so as to define thetheoretical backdrop for the empirical results. Several hypothesis2 have been proposed that focuson one or more players in the IPO process (the current owner of the firm, the underwriter and thepotential new shareholders). Generally, these theoretical explanations are not mutually exclusive.Ritter (1998) points out that all the explanations for the underpricing phenomenon can becriticized on the grounds of either the extreme assumptions that are made or the unnecessarilyconvoluted stories involved. On the other hand, most of the explanations have some element oftruth to them and agree on the fact that the degree of underpricing should be increasing in the exante uncertainty of the issue (Beatty and Ritter, 1985), where ex ante uncertainty is defined as theuncertainty about the offering’s value once it starts trading. This suggests that there should be arelationship between the degree of underpricing and the gross proceed of the firm or of the issue,the choice of the underwriter and the market climate.
1.2.1 Size and Underpricing
A substantial body of literature examines the effect of size on the initial return of IPOs. Onbalance, the empirical evidence suggests that smaller IPO is more risky than a larger IPO, ceterisparibus. Therefore, smaller IPO is more underpriced than larger IPO. This result was confirmedby Ritter (1987), Chalk and Peavy (1990), Jog and Riding (1987), Suret, Cormier and Lemay(1990) and Clarkson and Merkley (1994). Carter and Manaster (1990) document that, inmaximizing the value of their information acquisition, the informed investors (the institutions)will take into account not only the degree of uncertainty in a given issue but also its size. Thebigger the IPO, the greater the potential gains from acquiring information about the issue.
1.2.2 Role of underwriter and underpricing
Underwriters provide a wider range of services, they act as intermediaries between the firm andinvestors in marketing and distributing the shares, in timing the IPO and in fixing the price andthe volume of the offer.
2 Among these hypothesis, we note the winner’s curse hypothesis, the market feedback hypothesis, the bandwagonhypothesis, the investment banker’s monopsony power hypothesis (Chalk and Peavy 1987 and Ritter 1984, thelawsuit hypothesis, the signalling hypothesis (Allen and Faulhaber, 1988 and Welch, 1989), and the ownershipdispersion hypothesis. See Ritter (1998) for a review of these explanations.
5
Rock (1986) developped a model, in which there are two classes of investors : informed investorsand uninformed investors. The informed investors are able to determine the investment quality ofa particular IPO and will attempt to purchase a large amount of the underpriced IPOs and a lesseramount of the overpriced IPOs. The uninformed investors are unable to differentiate between thetypes of IPOs and will wind up purchasing a higher percentage of the overpriced IPOs and alower percentage of the underpriced IPOs. Therefore, uninformed investors face a winner’s curse:the probability of being allocated shares of overpriced new issues is greater than underpricedissues. To keep uninformed investors participating in the IPO market, underwriter underprices toensure them a non-negative rate of return and to cover their losses on the overpriced IPOs. Beattyand Ritter (1986) suggest that underwriters will enforce the IPO underpricing to maintain theirreputation. Though, a systematically too high or too low underpricing would subsequently befollowed by a loss in their market share. The underwriter would thus be seen to underprice astrong issue as much as it can get away with without losing reputation. Titman and Trueman(1986), Carter and Manaster (1990), Maksimovic and Unal (1993) and Carter, Dark and Singh(1998) find that high reputation underwriters underprice less than non prestigious underwriters.This is because high reputation underwriter issue firms with lower ex ante uncertainty. On theother hand, Ljunqgvist (1999) analyse US IPOs during the 1990s and find that more prestigiousunderwriters are associated with higher underpricing. He postulates that this result may beexplained by a possible conflict of interest between venture backers and entrepreneurs. Beatty etWelch (1996) suggest that there should be a positive relationship between the underpricing andthe underwriter reputation. In Canada, Clarkson and Merkley (1994) confirm the certification roleof the underwriter. Suret, Cormier and Lemay (1990) analyse 63 IPOs issued under the QuebecStock Savings Plan (QSSP) and find a negative but not significant relationship between the levelof underpricing and the underwriter reputation. They suggest that the high participation of lowreputation underwriters may explain their result.
1.2.3 Market climate and underpricing
Many researchers have found that issuers or underwriters are able to successfully time theirofferings when the market is optimistic about IPOs in general and when the demand for IPOs ishigh, in order to achieve a smooth distribution of shares and raise a large amount of capital.Derrien and Womack (2000) suggest that the current market climate plays an important role indetermining an IPO’s underpricing. Indeed, in euphoric or hot markets, investors may be overlyoptimistic about a firm’s prospects, causing the aftermarket equilibrium price to be greater than innormal conditions. Furthermore, market climate not only affects the number of successfulofferings but also the amount and the variability of IPO’s underpricing. For example, when themarket is “hot”, the level of underpricing may double or even triplicate. On the other hand, if themarket is “cold”, the level of underpricing would be much lower. Loughran and Ritter (2001)point out that underpricing is a form of indirect compensation to underwriters to gain favourableallocations on hot issues. How, Izan and Monroe (1995) analyse the Australian IPO market andconfirm that the level of underpricing is high during hot periods and low during cold periods.Helwege and Liang (1996) find that 575 firms went public in the hot issue year of 1993, whereas
6
in the cold issue year of 1988 the number of firms was only the quarter of 1983. Furthermore, thelevel of underpricing averaged 14,6% in 1983 and 6,6% in 1988. Ljungqvist (1997) reports that apositive macroeconomic climate raises the average amount of underpricing. Hoffmann-Burchardi(2001) find that the IPO market is subject to dramatic swing. He suggests that the IPO price ofone firm serves as feed-back mechanism to other IPOs since it can reveal information about acertain common value factor about the prospects for a specific industry and therefore change thevalue of other firms. The revelation of this common value factor may explain the clusteringphenomena like hot issue markets. Lowry and Schwert (2000) find that initial returns aresignificantly negatively correlated with past IPO volume and significantly positively correlatedwith future IPO volume. They point out that if high average initial returns indicate that thesentiment is especially high or market conditions are better than expected, then more companiesare likely to subsequently go public. As more firms go public, the uncertainty surrounding thetrue value of these firms decreases, thus causing average initial returns to decrease.
These relationships between underpricing and the size of the issue, the underwriter reputation andthe market climate allow us to suggest the following hypothesis, which are tested at the end of thesection 3.
Hypothesis H1: Ex-ante uncertainty hypothesis: a negative relationship existsbetween the level of underpricing and the ex-ante uncertainty measured by the size ofthe issue.
Hypothesis H2: Underwriter reputation hypothesis: a negative relationship existsbetween the level of underpricing and the reputation of the underwriter.
Hypothesis H3: Market climate hypothesis: IPOs issued during an upswing in thestock market experienced a higher underpricing than IPOs issued during a fallingmarket.
We test these hypothesis in section 3. In the next section, we discuss the problems inherent to themeasure of IPO’s underpricing.
1.2.4 Methodological dimension
In reviewing the international evidence, we conclude that two factors could be an importantdeterminants of IPO underpricing, namely constraints on price setting and allocations of newshares, and differences in litigation environment. However, as documented by Lee, Taylor andWalter (1996), institutional characteristics peculiar to a domestic environment and IPO’smechanism for pricing cannot fully explain an anomaly which has proven pervasive throughoutthe world. Therefore, the purpose of this section is to examine whether the international resultswere sensitive to the methodology considered to measure the degree of underpricing.
The pricing of IPOs is difficult partly because there is no observable market price prior to theoffering and partly because many of the firms going public have little or no operational history.To measure the level of underpricing, previous studies use the conventional method where theinitial return available to the subscribers is given by
7
Initial returni = Pe
)PePm( −(1)
where Pm = First day price and Pe = Offer price.
Nonetheless, the return measured by equation (1) would be valid in a market, where there is notime gap between the application closing date and the first day of trading3 and no rationing takesplace. If during this period, a major change occur in market conditions, we should adjust formarket return in the raw return estimated by equation (1).
Initial returni =e
em
P)P - P( -
0
01
M)M (M −
(2)
where Pm = First day price; Pe = Offer price; M1 = Market index on the first day of trading;M0 = Market index on the application closing day. This measure supposes that the market beta ofthe stock is 1.
The third approach used by researchers to measure the underpricing’s level is to adjust for thesystematic risk of the firm. The initial return available to the subscribers would be given by
Initial returni = e
em
P)P - P( - βi
0
01
M)M (M −
(3)
where Pm = First day price; Pe = Offer price; M1 = Market index on the first day of trading;M0 = Market index on the application closing day and βi = Systematic risk of the firm i.
This measure is however subject at least to one potential bias. Indeed, as stock is infrequentlytraded in the aftermarket periods, the OLS beta estimates are asymptotically biased downwardand tend to overestimate the excess returns (Scholes et Williams, 1977 et Dimson, 1978). Toovercome this problem, we suggest the Scholes-Williams technique, which requires three betaestimates “from the previous (β-1), current (β0) and subsequent (β+1) periods” of a market modeland the autocorrelation coefficient (ρ1) of the market index. The beta adjusted for infrequenttrading is
β = )21(
)(
1
101
ρβββ
+++ +−
(4)
where β-1= m
titm
ianceRRRariance
var);(cov 1,, − (5)
where Rm = market return on the tth trading day ; Ri = return on new issue i. 4.
3 In the US and Canada, the time gap is quite short (about at most one week). In Malaysia, the time gap is muchlonger, an average of five weeks, and in some cases it may even reach two months (Pauydal, Saadouni et Briston,1998). Mok et Hui analyse Chinese IPOs and find that one day increase in the time gap between offering and listingrises the level of underpricing by a factor of 0,69%.4 The difficulty of measuring the beta for IPOs may explain the reluctance of using the equation (13) to measure thedegree of underpricing.
8
Ritter (1991) uses the benchmark-adjusted return as an alternative measure of IPO underpricing,defines as
ARit = Rit – Rmt (6)
where Rit and Rmt are respectively, the return for firm i and the return on the benchmark m on thetth trading day. The average benchmark-adjusted return on a portfolio of n stocks for event montht is the equally-weighted arithmetic average of the benchmark-adjusted returns:
ARt = 1/nt
∑
=
nt
iitAR
1
(7)
Empirical results of various studies presented in table 2 indicate that the adjusted market measureis the most used to calculate the underpricing’s level. Affleck-Graves, Hedge and Miller (1996)measure the level of underpricing for US IPOs during the period 1975-1985, using the nonadjusted and the market adjusted measures and find that there is no significant difference betweenthe mean of the underpricing calculated by the two approaches. This is generally the case whenthe time gap between the offering and the listing is short. Indeed, Mok and Hui (1998) analyseChinese IPOs and find that taking account of the overall market effect would yield substantialdifference in the results if the time gap is large. For example, the non adjusted IPO underpricingfor A-shares is 362,3%, much higher than the adjusted IPO underpricing for the same shares(which is 289,2%). The time gap for A-shares is 307 days. For B-shares new issues, where thetime gap is only 20 days, the non adjusted IPO underpricing is 24,9% and the adjusted IPOunderpricing is 26,2%.
In this paper, to examine whether our results are sensitive to the dimension methodology, we usethe non adjusted and the adjusted measures for the underpricing’s level. This will also help us incomparing our results with previous studies.
2. Data and methodology
Canadian stock markets includes four markets and the OTC (the-over-the-counter) market.Among four markets, the Toronto Stock Exchange (TSE) is Canada's premier market for seniorequities, accounting for approximately 95% of all equity trading in Canada.
Procedures for issuing unseasoned equity in Canadian markets are similar to those for the USmarkets. In most cases, an issuer and underwriter determine the offering price to investors beforethe offering date, and the new shares are distributed at that price on the offering day. If theunderwriter receives orders that exceed the number of shares to be distributed, rationing willoccur. That is, the underwriter allocates the shares among investors, based on his discretion. Thefirst aftermarket price is then established at the point where the supply and demand for the newissues are balanced.
One of the particular characteristics of Canadian market IPOs is the existence of the JuniorCapital Pool program which was initiated in November 1986. This program is introduced inAlberta and is similar to the blind pool programs that were implemented in the 1980s in the U.S.
9
to assist start-up firms raising equity. Unfortunately, the experience of U.S. investors with blindpools has been poor (see Stern and Bornstein, 1986). In Canada, Robinson (1997) shows that theJCP program has been successful in helping entrepreneurs use the public equity markets to raisethe initial capital for their business. The program reduces the regulatory cost, yet it is stillmonitored and regulated at a high level.
To set up a JCP firm, a group of inside investors raises seed capital by issuing themselves sharesin exchange for cash. The amount of seed capital required is $100,000. The firm raises additionalequity capital through a JCP IPO to outside shareholders with a minimum share value of at least$0,10. From the start, the JCP program was transitory. JCP firms had a limit of 18 months inwhich to complete their major transaction or they were delisted by the Alberta Stock Exchange(ASE). This major transaction – an asset acquisition- will change the company from a JCP firmto a regularly listed ASE firm. It is possible that this 18-month period may force some outsideshareholders to make suboptimal investment decisions near the end of the period if they areconcerned being delisted. The ASE has combat this potential problem by allowing JCP firms tobecame reinstated if they complete a major transaction after the 18-month period. In its earlyyears, the JCP program has started with the listing of oil and gas firms. Over time, it hasdiversified its listings to include the manufacturing, services and high-technology sectors. Frominterviews with JCP principals and underwriters, Hopkins and Robinson (1994) concluded thatthe JCP program is a viable program for financing small Canadian firms.
Our original sample numbered 1373 IPOs5 listed in the Toronto Stock Exchange, Montreal StockExchange, Vancouver Stock Exchange and Alberta Stock Exchange. The primary source of datais the “Record of New Issues: Annual Report by the Financial Post Datagroup” which reportsoffering dated, offering prices, issue size and the name of the underwriter. Out of these originalsample, 402 IPOs had to be dropped for three reasons: First, Datastream used to obtain the pricesat the end of the first day of trading and the last day of the period does not cover the over thecounter (CDN) listed companies. Second, return data, proceed of offering or price issue were notavailable. Third, 22 IPOs were listed on the US market. This resulted in a final sample of 971IPOs between January 1991 and December 1998. Our sample is composed as follows:
Common shares IPOs 878 (of which 433 JCP IPOs)
Unit IPOs 93
We use a large sample of Canadian IPOs including JCP and unit offerings. We hope that thisapproach will shed some light on the underpricing phenomenon. Unit offerings are included as animportant source of financing for many small firms6. Although, they have received little attentionin the finance literature. Lee, Lee and Taylor (2000, p. 3) point out that « Yet, althoughpractioner explanations for unit IPOs may seem unsatisfactory, there is relatively little analyticalor empirical evidence on their use». How and Howe (2001) also document that evidence on units
5 Closed-end funds and real estate investment trusts companies are excluded from our sample.6 How et Howe (2001) find that among a sample of 394 Australian IPOs, occurred during the period 1979-1990, 134IPOs are unit offerings (which represent 34% of the sample). Schultz (1993) also find that among a sample of 797US IPOs, occurred during the period 1986-1988, 167 IPOs are unit offerings (which represent 21% of the sample).
10
IPOs is needed. As far as we know, prior Canadian empirical research is limited to commonshares IPOs.
Table 3 presents the distribution of the sample by year, both in terms of the number of offers andthe gross proceeds. Inspection of table 3 shows that the 655 of the 971 sample offers (67,45%)occurred over 1993, 1994, 1996 and 1997. 61,32% ($10243,7 millions of the $16703,9 millionstotal) of the aggregate gross proceeds in the sample was raised in these four years alone and therest (38,67% or $6460,2 millions of the $16703,9 millions total) was raised by the 316 IPOsoccurred over 1991, 1992, 1995 and 1998. This result is consistent with the notion of hot issuesmarket (Ritter, 1991). Following this, we consider the years 1993, 1994, 1996 and 1997 as hotperiod and 1991, 1992, 1995, 1998 as cold period. Table 3 also suggests that the size of unit IPOsis smaller than common shares IPOs. This was also the case in the US (Schultz, 1993) andAustralia (Lee et col., 2000). Schultz (1993) points out that firms making unit offerings aretypically smaller, younger and riskier than firms that go public via a share IPO.
*** Table 3 ***
Table 4 presents the distribution of the sample by province, both in terms of the number of offersand the gross proceeds. Inspection of table 3 shows that the sample is diversified across fourprovinces: The largest amount of gross proceeds is from Ontario ( $8864,18 millions for 190IPOs of 971 total IPOs, 5,3%), followed by Quebec ($2281,5 millions for 52 IPOs of 971 totalIPOs, 10,78%), Alberta ($2028,61 millions for 547 IPOs of 971 total IPOs, 56,33%) and BritishColumbia ($1218,24 millions for 144 IPOs of 971 total IPOs, 14,83%). It appears from table 4that the Ontario IPO-market is the largest one.
*** Table 4 ***
Table 5 presents the distribution of the sample by industry7, both in terms of the number of offersand the gross proceeds. Inspection of table 5 shows that the sample also covers differentindustries. Production IPOs represent 84 IPOs of 971 total IPOs and about 23,5% of theaggregate gross proceeds in the sample were raised by this industry. The gross proceeds forTechnology IPOs were $2899,45 millions of the $16703,9 millions total. Oil and gas and mining,both, represent 202 IPOs of 971 total IPOs (20,8% of the sample). About 20,4% ($3406,9millions of the $14657,9 millions total) of the aggregate gross proceeds in the sample were raisedby these industries.
*** Table 5 ***
We use two methods to measure the level of underpricing. The first measure is the conventionalone and is given by
UND(1)i = Pe
)PePm( −(10)
7 Our segmentation by industry is based on the classification of the System for Electronic Document Analysis andRetrieval (SEDAR) available at the following address: www.sedar.com.
11
where Pm = First day price and Pe = Offer price.
The second measure is given by
UND(2)i =e
em
P)P - P( -
0
01
M)M (M −
(11)
where Pm = First day price; Pe = Offer price; M1 = Market index on the first day of trading;
M0 = Market index on the application closing day. This measure supposes that the market beta ofthe stock is 1. We use the TSE 300 index as a market index.
3. Results
3.1 The underpricing phenomenon in Canada
*** Table 6***
Table 6 contains a descriptive statistics of the degree of underpricing for a sample of 971Canadian IPOs from the period 1991-1998. The average initial return (UND) for the commonshares IPOs (excluding JCP IPOs) was 20,57% with a t-value of 7,65. the adjusted measure was22,11% with a t-value of 7,84. In line with previous studies, we conclude that Canadian IPOs areunderpriced as most IPOs in the world8. Our results are however inconsistent with those of Jog(1997), who analyse a sample of 254 IPOs from the period 1984-1992 and find a degree ofunderpricing of 7,89%. This difference may be explained by the fact that Jog consider onlyToronto Stock Exchange Listed IPOs. Differences in both the regulatory aspects of the variousCanadian exchanges and the firms going public may affect the IPO process and the degree ofunderpricing as well. For example, firm size may be smaller for some exchanges. So too may bethe involvement of institutional investors and the market climate. The study of these effects ispresented in the next section.
Table 6 also reveals that JCP IPOs are more underpriced than non JCP IPOs. The average initialreturn was huge (135,41% with UND(1) and 140,88% with UND(2)). The t-value on thedifference in average initial return between JCP and non JCP IPOs is significant at 1% level9.The high level of underpricing for JCP IPOs may be explained by the characteristics of thesecurities, e.g., risk and return and their low issue prices, which are usually set between 10 and 20cents. Robinson (1997) analyse JCP IPOs and find a non adjusted average initial return of 248%for the period between 1987 and 1988 and a non adjusted average initial return of 68% for theperiod between 1988 and 1992. He concludes that the dramatic reduction in the underpricingdegree may be explained by the fact that Canadian investors became accustomed to thecharacteristics of the JCP program. However, our results suggest that, the investor’s attitude had
8 Guidici et Paleari (1999) find an average underpricing of 23,87% for Italian IPOs, Derrien et Womack (2000) findan average underpricing of 13,23% for French IPOs, Paudyal, Saadouni et Briston (1998) find an averageunderpricing of 61,8% for Malaysian IPOs and Ritter (1998) find an average of 15,8% for US IPOs.9 We also carried out two non parametric tests ( the Kruskal-Wallis and the Mann-Whitney). The results suggest theaverage initial return offered by the JCP IPOs is significantly higher than that available from non JCP IPOs.
12
not changed and the reduction in underpricing observed by Robinson is principally related to themarket climate during the period of analysis. It is important to note that 1991 and 1992 were coldperiods in the Canadian markets.
Continuing, Table 6 also reveals that units IPOs are more underpriced than common shares(excluding JCP) IPOs. The average initial return was 40,59% with UND(1) and 41,50% withUND(2). The t-value on the difference in average initial return between units and non units IPOsis significant at a 1% level10. Our results are consistent with those of Schultz (1993) and How andHowe (2001). For a sample of 797 United States IPOs from 1986 through 1988, Schultz (1993)documents that 167 firms making unit offerings are typically smaller, younger and riskier thanthose making common shares offerings. For a sample of 394 Australian IPOs from 1979 through1990, How and Howe (2001) find a degree of underpricing of 68,57% for units IPOs and of40,64% for common shares IPOs. The high percentage of underpricing for units IPOs and JCPIPOs may be, in part, explained by the small size of the offerings. We test this relation in the nextsection.
Table 6 also reveals that the distribution of the degree of underpricing is not stationary. In 1991,common shares IPOs (excluding JCP) were slightly overpriced (UND(1)= –4,85% and UND=-5,26%). In 1992, the degree of underpricing increased but this was due the high underpricing oftwo following firm’s IPOs: Primo Gold Limited (UND(1)=300%) and Quest Technologies Inc.(UND(1)=350%). If we eliminate these two IPOs11, the degree of underpricing for 1992 would be6,22% (with UND(1)). In 1993 and 1994, the average initial return increased while in 1995, itdecreased. In 1996, the underpricing’s level increased by 107,31% according to 1995’s averageinitial return. In 1997, the degree of underpricing reach a maximum of 39,30% with UND(1)(45,13% with UND(2)). It is important to note that 1997 was a hot issue period with a maximumof $3328,5 millions12 collected through IPOs. In 1998, the number of IPOs and the degree ofunderpricing were decreased13. Our results suggest that 1993, 1994, 1996 and 1997 may beconsidered as hot periods, while 1991, 1992, 1995 and 1998 may be considered as cold periods.Ibbotson and Jaffe (1975) also show that hot period is usually characterized by high volume ofissues and a high average initial return and then followed by a decrease in the level ofunderpricing. The same pattern is observed for units IPOs and JCP IPOs. Stoughton, Wong and
10 We also carried out two non parametric tests ( the Kruskal-Wallis and the Mann-Whitney). The results suggest theaverage initial return offered by the units IPOs is significantly higher than that available from non unit IPOs.11 We could use a value weighted average initial for the degree of underpricing. However, as mentioned in severalstudies, the underpricing phenomenon is particular present in small offerings. The value weighting schema decreaseconsiderably the degree of underpricing especially for IPOs with gross proceeds under one million dollars, whichrepresent 68% of the Canadian IPOs. For example, we find a degree of underpricing for the whole sample (commonchares, units and JCP IPOs) of 6,7% on value weighted basis, while it is 73,64% on equally weighted basis.12 Lowry and Schwert (2000) document that the findings that more companies want to go public when IPOs arebeing underpriced by the greatest amount is puzzling. 13 In 1998, the gross proceed of Canadian IPOs also decreased. This may be explained by the fact that as the numberof going public firms increase in hot period (1997), more information would be available on IPO market and theasymmetric information would decrease. Hence, the initial return of the subsequent year (1998) would decrease.
13
Zechner (2000) suggest that the clustering of IPOs is explained by the revelation of a commonvalue factor of one firm which serves as a feed-back mechanism to other IPOs14.
According to the results of underpricing, we conclude that Canadian capital markets are not doinga good job in allocating capital to entrepreneurs. IPOs are underpriced as well as almost IPOs indifferent countries. An IPO is new, unseasoned and relatively unknown equity issue. As a result,the general uncertainty of future profitability and the asymmetry of information between issuerand investor are much greater than for conventional issues by listed firms. Moreover, theunderpricing is an indirect cost supported by issuers. So a high level of underpricing may limittheir access to capital markets. Meanwhile, the degree of underpricing seems related to the typeof the issue (units or JCP) as well as to the size, the period and the sector of the issue.
3.2- Cross-sectional patterns
We now turn to the cross-sectional analysis of the short-run behaviour of the IPO’s. The purposeof this section is to shed some light on the determinants of underpricing. We also examine therelationships between underpricing and the size of the issue, the role of the underwriter and themarket climate. A multivariate analysis is reported after the univariate tests.
*** Table 7***
Size : the size of the issue has a well-documented relationship with underpricing (Ritter, 1987,Chalk and Peavy, 1990, Jog and Riding, 1987, Suret, Cormier and Lemay, 1990 and Clarksonand Merkley, 1994). Table 7 presents underpricing results for the sample partitioned on the basisof the size of the issue. Our results in table 7 suggest that small IPOs (gross proceeds less than amillion dollars) are more underpriced (for example, UND(1) = 119,07% and UND(2) = 124,11%)than large IPOs. Moreover, IPOs with gross proceed more than 20 millions dollars are lightlyoverpriced (UND(1) = -1,36% and UND(2) = -0.78%). However, among the 540 small commonshares IPOs, 433 are JCP IPOs which have huge initial returns (UND (1): 135,41% et UND (2) :140,88%). The difference on average initial return between the two subgroups is significant at1%. This confirms the existing evidence, which indicates a high ex-ante uncertainty associatedwith small offerings. The underpricing would be essentially a small issue’s phenomenon. Thisexplain why our results differ from those of previous Canadian Studies (Clarkson and Merkley15
(1994) and Jog (1997)). Indeed, in our sample we include all IPOs listed on the four Canadianstock exchanges, which wasn’t the case for Clarkson and Merkley and Jog. If we consider onlyIPOs with gross proceeds between $10 millions and $20 millions, we find a non adjusted averageinitial return of 3,6% (and an adjusted average initial return of 4,28%).
14 Lowry (2000) shows that the observed fluctuation in IPOs volume are related to three factors: changes in privatefirms’agregate demand for capital, changes in the adverse selection costs of issuing equity and variation in investorsentiment.15 The average gross proceeds in our sample is $14,65 millions, and it was $30,33 millions in the sample of Clarksonet Merkley (1994).
14
Industry: when the sample is segmented by industry16, we notice that the underpricing ofCanadian IPO’s varies widely in different industries. For example, mining, real estate, oil and gasand technology IPO’s are more underpriced than production and film production IPOs.(respectively, 35,71%, 16,9%, 29,04% and 19,77% versus 11,11% and 4,05%). These resultsconfirm the findings of Ritter (1991). A plausible explanation for the technology IPOs is given byHand (2000). He suggests that since Technology IPO’s are generally smaller than the “oldeconomy” IPOs, the supply of shares is very low if compared to the demand, and this may causehigh initial returns. Wen (1999) document that investors are willing to buy, in general, “neweconomy” stocks in order to diversify their portfolios and reduce systematic risk. Arosio, Guidiciand Paleari (2000b) point out that huge initial returns of high-tech IPOs are basically explainedby three factors : investor’s euphoria for the new economy, the quality of the private informationand publicly available information from the prospectus.
Continuing, we find that communications and media and merchandising IPO’s are overpriced(UND(1) is respectively -4,66% and –1,9%) and financial services IPOs lightly underpriced(UND(1) : 1,31%). The average size of these issues were respectively $73,78 millions, $31,79millions and $32,78 millions. The same patterns are observed for units IPO and for our entiresample.
Province : when the sample is segmented by province, we notice that Albertan and BritishColumbian common shares IPOs excluding JCP are more underpriced than Ontarian IPOs(respectively, 26,41% and 35,95% versus 11,20%). This may be explained by the size of theAlbertan and British Columbian offerings, which averaged $15,08 and $8,46 millionsrespectively. The average size of Ontarian IPOs was $46,65 millions. The differences in thelisting requirements and other regulatory aspects which are more severe for Ontarian IPOs mayaffect the degree of underpricing. The majority of Albertan and British Columbian IPOs are fromoil and gas and mining industries which are more underpriced than those from other sectors.
On the other hand, the degree of underpricing of Quebecois IPOs are less underpriced thanOntarian IPOs. This result confirms the finding of Suret, Cormier and Lemay (1990). Theseauthors notice that the degree of underpricing for 86 Quebecois IPOs issued under the QSSPprogram average -0.32% and the Ontarian IPOs averaged 12,66%, during the period between1979 and 1985. The size of the issue may again explain this difference. The gross proceeds ofQuebecois IPOs in our sample is $2281,5 million.
Underwriter reputation : the value of the underwriter’s reputation depends not only on itsactivity in the IPO market, but on the entire array of activities with which it is involved.Therefore, we use the value of IPOs raised by each underwriter as a leader and a syndicatemember to proxy for it’s reputation. The “Financial Post” gives us the ranking for the top 25underwriters, according to this measure. Then, we divide our sample into two groups forprestigious and less prestigious underwriters. Underwriters who figured in the ranking of the“Financial Post” are classified as prestigious. The average underpricing for the sample partitioned
16 Our segmentation by industry is based on the classification of the System for Electronic Document Analysis andRetrieval (SEDAR) available at the following address: www.sedar.com.
15
on the basis of underwriter reputation, are presented in table 7. For common shares IPOsexcluding JCP, we find that the degree of underpricing was 31,13% (UND(2) : 33,16%) when theIPO is raised by a non prestigious underwriter and 9,37% (UND(2) : 10,39%) when a prestigiousunderwriter helps the company to go public. The difference between the two groups is significantat 1% level. These results can be interpreted as follows. The reputation of the underwriterresolves some of the uncertainty about the quality of the IPO. The more the underwriter’sprestige, the less risky the IPO is, and the lower the required initial return. Prestigiousunderwriters avoid the smaller firms for several reasons. First, they are concerned about thereputation of their firms being affected if they begin to participate in the underwriting of smallerfirms. Second, the underwriting commission is typically a function of the issue size.
The same pattern was observed for JCP-IPOs and unit IPOs. Continuing, we also find that thedifference between the two groups for JCP-IPOs is smaller but significant at 1% level. This resultmay be explained by the fact that JCP-IPOs are generally raised by less prestigious underwriters.Indeed, in Alberta, a number of regional brokerage firms have taken advantage of the JCPprogram to carve out a profitable underwriting and trading niche. MacIntosh (1994) point out that“national investment dealers have shown little interest in serving the IPO market for offerings ofless than $25 million”.
Market climate : average underpricing for the sample partitioned on the basis of marketclimate17, are presented in table 7. For common shares IPOs excluding JCP, we find that thedegree of underpricing was 22,03% when the IPO market was “hot” and 16,77% when the IPO-market was “cold”. The difference in average initial returns between hot issues and cold issues isnot significant at conventional level. The same pattern is found, for units-IPOs and JCP-IPOs.The degree of underpricing when the IPO market was “hot” average 48,02% and 142,7%,respectively. While, The degree of underpricing when the IPO market was “cold” average22,49% and 122,84%, respectively. As confirmed by previous studies, the market climate maylead the decision to go public for many issues. Investors, on the other hand, are willing tocompensate underwriters indirectly in order to gain favourable allocations on hot deals, by payingabove the offer price. Loughran and Ritter (2001) document that issuers care about the change intheir wealth, rather then the level of wealth and they don’t bargain hard for an offer price increasewhen the market goes up. However, Loughran and Ritter’s application of prospect theory can notexplain why issuers choose underwriters with a history of severe underpricing. The relationshipbetween the degree of underpricing and hot issues market is still a puzzle.
It seems difficult to separate the four effects analysed in this section: the size, the choice of theunderwriter and the industry are related, the industry segmentation is not the same for all theprovinces and the market climate may vary across sectors. It seems important then to conduct amultivariate analysis..
17 Taking into account the results of the previous section, we consider 1993, 1994, 1996 and 1997 as hot periods and1991, 1992, 1995 and 1998 as cold periods.
16
3.3 Multivariate analysis
Results of the multivariate regression model presented in table 8 generally serve to narrow andrefine the basic conclusions drawn from the univariate tests reported in table 7. The regressionmodel has the following form18:
UNDi = α0 + α1O&Gi + α2MININGi + α3Ti + α4JCPi + α5Log(Proceeds)i+ α6MCi +α7PUi + εi
(13)
where UNDi is the degree of underpricing of the stock i, O&G takes a value of 1 for oil and gasissues and zero otherwise, MINING takes a value of 1 for mining issues and zero otherwise, Ttakes a value of 1 for technology issues and zero otherwise, JCP takes a value of 1 for juniorcapital pool issues and zero otherwise, MC is the market climate variable which takes a value of1 for hot period and zero for cold period, PU takes a value of 1 for a participation of a prestigiousunderwriter in the IPO and 0 otherwise and Log denotes the natural logarithm. The proceed of theissue is used as a proxy for ex-ante uncertainty.
First, the JCP variable is treated as a dummy variable. However, a detection of a significant effectwould not allow us to conclude definitely, as we don’t know if the difference is due to theconstant or to the independent variables. An effect on the constant would mean that JCP has aneffect on the average underpricing, while an effect on the coefficients would suggest that theindependent variables affect the dependant variable differently as the IPO is JCP or not. Second,we use Johnston’s (1986) structural adjustment methods to analyse the behaviour of the JCPvariable.
Thus, we use the three following models :
Model 1
UNDi = α0 + α1O&Gi + α2MININGi + α3Ti + α4Log(proceeds)i+ α5MCi +α6PUi + εi (14)
Model 2
UNDi = α0 +α1O&Gi +α2MININGi +α3Ti + α4Log(proceeds)i +α5MCi +α6PUi +α7JCPi + εi (15)
Model 3
UNDi = α0 + α1O&Gi + α2MININGi +α3Ti + α4Log(proceeds)i +α5MCi + α6PUi + α7JCPi +α8JCP×O&Gi+ α9JCP×MININGi +α10JCP×Ti +α11JCP×Log(proceeds)i+α12JCP×MCi
+α13JCP×PUi + εi (16)
For each model, we isolate the squared sum of the residuals (SSR). Then, we test the threefollowing hypotheses :
The equality of the constants hypothesis (model 1 is confronted to model 2) :
F = 1)-k -(n /SCR
SCR - SCR 2
21 ∼ F (1, n – k –1)
18 We run the same regression including a dummy variable for unit IPOs. This doesn’t change significantly theresults presented hereafter.
17
The equality of the coefficients hypothesis (model 2 is confronted to model 3) :
F = 2k) -(n /SCR
1)-(k / SCR - SCR 3
32 ∼ F (k-1, n – 2k)
The equality of the regression’s line hypothesis (model 1 is confronted to model 3) :
F = 2k) -(n /SCRk / SCR - SCR
3
31 ∼ F (k, n – 2k)
*** Table 8***
We estimate the equation (13) for all Canadian IPOs using the ordinary least squares method. Theresults are presented in table 8 and are corrected for heteroscedasticity using the adjustmentprocedure of White (1980). The results indicate that the seven explanatory variables identifiedearlier taken together explain 16,74% of the variation in the initial return of Canadian IPOs(UND(1) and 15,51% of the variation in UND(2).
At first glance, it becomes evident that there is a high statistically significant negativerelationship between the underpricing and the proceeds. This result is consistent with the findingsof previous studies and confirms the fact that the greater is the ex-ante uncertainty about a valueof an issue, the greater is the expected underpricing (Beatty and Ritter, 1986)19.
Another variable playing a significant role in explaining the initial excess return of CanadianIPOs is the market climate. Consistent with Ritter (1998), Derrien and Womack (2000) andArosio, Guidici and Paleari (2000b), this variable has a significant positive impact on the degreeof underpricing. As discussed earlier, this could be due to the fact that in hot markets, investorsmay be overly optimistic about a firm’s prospects, causing the aftermarket equilibrium price to begreater than in normal conditions. Hence, the degree of underpricing would be high during theseperiods.
The fourth variable included in the model is the reputation of the underwriters. The empiricalliterature, as discussed earlier, suggests that this variable should be inversely related to theunderpricing level. We find that this relation is negative but not significant. The low participationof prestigious underwriters may explain this result. Obviously, Canadian large underwriting firmsavoid smaller firms because they are concerned about their reputation being affected if they beginto participate in the underwriting of smaller firms20. For example, the average proceeds forcommon shares IPOs (excluding JCP) underwritten by prestigious underwriters was $52,48millions while it was $14,5 millions for IPOs underwritten by low prestigious underwriters.
The coefficients of the mines, technology and oil and gas sectors are positive but not significant.Technology IPOs is treacherous to evaluate which may explain the high level of underpricing.Ritter (1991) also confirms that mines and oil and gas IPOs are more underpriced than those fromother sectors.
19 Also, Katz and Owen (1987) point out that «Thus, as information sets diverge, we would expect increasedunderpricing».20 This situation create a gap in the availability of public equity of less than $1 million for Ontarian small firms,which can not be listed on the Toronto Stock Exchange.
18
The coefficient of the JCP variable is significant and positive at 1% level. As expected, commonshares IPOs are less underpriced than JCP IPOs. Then, this result remain unchanged aftercontrolling for the size, the role of the underwriter, the three sectors considered and the marketclimate.
The squared sum of the residuals for the three models are respectively 1657.10, 1608.16 and1597.27 (when UND (1) is a dependent variable)21. We reject the equality of the constants andthe equality of the regression’s line hypotheses at 1% level (F1,963 = 29,29; F7,957 = 5,12).However, we can not reject the equality of the coefficients hypothesis at 1% level (F6,957 =1,087). Thus, the impact of the coefficients of the independent variables on the degree ofunderpricing is the same whether the IPO is a JCP or not. On the other hand, the significant effecton the constant allow us to confirm that JCP affect the degree of underpricing.
One possible explanation for the huge underpricing of JCP IPOs is that these issues are typicallyrisky. Furthermore, as discussed earlier, the JCP program was transitory and a JCP firm had alimit of 18 months in which to complete a major transaction or it was delisted. So, this time limitincrease the risk of the JCP IPO.
The results of the multivariate analysis served to reinforce but narrow the basic conclusionsdrawn from the univariate analysis. We find that ex-ante uncertainty and market climate areimportant determinants to explain the underpricing phenomenon in Canada. The results of thestructural adjustment tests show that junior stocks IPOs are more underpriced than non juniorstocks IPOs.
4 Conclusions
This study has examined the relation between the degree of underpricing, for a wide sample of971 Canadian IPOs, and ex ante uncertainty, from the period 1991-1998. The average initialreturn for common shares IPOs (excluding JCP) was 20,57% (22,57% with a market adjustedmeasure). Thus, there appears to be no major difference between the degree of underpricing ofCanadian IPOs and previous international evidence but our results are different to those ofprevious Canadian studies. However, the degree of underpricing depends on the type of the issue.Unit IPOs and JCP IPOs are more underpriced than common shares IPOs.
Results of our univariate analysis, for the most part, are consistent with previous empiricalresearch based on US IPO data. Specifically, we find that underpricing decreased with the size ofthe issue and the prestige of the underwriter. We also find that mining, oil and gas, real estate andtechnology IPOs are more underpriced than those from other sector. Interestingly, we find thatAlbertan and British Columbia IPOs are more underpriced than Ontarian IPOs. This result maybe explained by the experience of large firms who are listed on the Toronto Stock Exchange.
We have entertained a number of possible explanations for the high initial return of Canadianissuing firms. We find that underpricing is significantly related to the size and the period of the
21 The results of the structural adjustment test remain unchanged with UND(2) as a dependant variable.

19
issue and to whether the IPO is a JCP or not. On the other hand, the prestige of the underwriter ispositively related to the underpricing but this relationship is not significant.
One important aspect of a firm’s decision to go public is that of receiving a proper price for itscommon shares. If IPOs are significantly underpriced, many eligible firms would becomereluctant to choose an IPO as a means of raising equity capital. Our study shows that the IPOmarket in Canada is « good » only for large offerings.
20
References
Affleck-Graves, J., Hegde, S., Miller, R., « Conditional price trends in the aftermarket for initialpublic offerings », Financial Management 25, p. 25-40, 1996.
Aggarwal, R., « Stabilization activities by underwriters after initial public offerings », Journal ofFinance 55, p. 1075-1103, 2000.
Aggarwal, R., Leal, R., Hernandez, F., « The aftermarket performance of initial public offeringsin Latin America », Financial Management 22, p. 42-53, 1993
Aggarwal, R., Rivoli, P., « Fads in the initial public offering market ? », Financial Management19, p. 45-57, 1990.
Allen, F., Faulhaber, G.R., « Signalling by underpricing in the IPO market», Journal of financialEconomics 23, p. 303-323, 1989.
Arosio, R., Guidici, G., Paleari, S., « Why do (or did ?) internet-stock IPOs leave so much“money on the table” ? », SSRN working paper (a), 2000.
Arosio, R., Guidici, G., Paleari, S., « What drives the initial market performance of Italian IPOs ?An empirical investigation on underpricing and price support », SSRN working paper (b),2000.
Aussenegg, Wolfgang, « Short and long-run performance of Initial Public Offerings in theAustrian Stock Market », Vienna University of Technology working paper, 1997.
Barber, B., Lyon, J., « Detecting abnormal operating performance : The empirical power andspecification of test statistics », Journal of Finance 41, p. 359-399, 1996.
Barber, B., Lyon, J., « Detecting long-run abnormal stock returns: the empirical power andspecification of test statistics », Journal of Financial Economics 43, p. 341-372, 1997.
Barber, B., Lyon, J., «How can long-run abnormal stock returns be both positively and negativelybiased? », SSRN working paper, 1998,
Baron, D., « A model of the demand for investment banking advising and distribution servicesfor new issues », Journal of Finance 37, p. 955-976, 1982.
Barry, C., Jennings, R., « The opening price performance of initial public offerings of commonstock », Financial Management 22, 54-63, 1993.
Barry, C., Muscarella, C., Peavy, J., Vetsuypens, M., « The role of venture capital in the creationof a public company », Journal of Financial Economics 27, p. 447¯ 471, 1990.
Beatty, R., Ritter, J., « Investment banking, reputation and the underpricing of initial publicofferings », Journal of Financial Economics 15, p. 213-232, 1986.
Beatty, R., Welch, I., « Issuer expenses and legal liability in initial public offerings », Journal o fLaw and Economics 39, p. 545-602, 1996.
Bommel, V., Vermaelen, T., « Market feedback during initial public offering: Do managers listen? », INSEAD working paper, 2000.
21
Brav, A., Gompers, P., « Myth or reality? The long-run underperformance of initial publicofferings: Evidence from venture and non venture capital-backed companies », Journal ofFinance 52, p. 1791-1821, 1997.
Brean, D., « The climate for initial public offerings in Canada », Financing Growth in Canadaed. P. Halpern, University of Calgary press, p. 706-708, 1997.
Buser, S., Chan, K., « NASDAQ/NMS Qualification stand, Ohio registration experience and theprice performance of initial public offerings », Ohio Department of Commerce andnational Association of Securities Dealers Inc, Columbus, 1987.
Cai, M., Shi, S., « Publicity and the clustering of IPO underpricing», working paper Queen’sUniversity, 1999.
Carter, R., Dark, F., Singh, A., « Underwriter reputation, initial returns, and the long-runperformance of IPO stocks », Journal of Finance 53-1, p. 285-311, 1998.
Carter, R., Manaster, S., « Initial public offerings and underwriter Reputation», Journal ofFinance 45, p. 1045-1068, 1990.
Chalk, A., Peavy, J., « Initial public offerings: Daily returns, offering types and the price effect»,Financial Analyst Journal 43-5, p. 65-69, 1987.
Chalk, A., Peavy, J., « Understanding the pricing of initial public offerings », Research inFinance 8, p. 203-240, 1990.
Chan, A., Pan. K., « An answer to the long-run performance puzzle of IPOs in Taiwan: Anapplication of the Fama-French model », National Sun Yat-Sen University working paper,1998.
Clarkson, P., Merkley, J., « Ex ante uncertainty and the underpricing of initial public offering :Further Canadian evidence », Canadian Journal of Administrative Sciences 11, p. 54-67,1994.
Chowdhry, B., Sherman, A., « The winner’s curse and international methods of allocating initialpublic offerings », Pacific-Basin Finance Journal 4, p. 15-30, 1996.
Derrien, F., Womack, K., « Auctions vs book-building and the control of underpricing in hotmarkets », Dartmouth working paper, 2000.
De Bondt, W., Thaler, R., « Does the stock market overreact? », Journal of Finance 40, p. 793-808, 1985.
Dewenter, K., Malatesta, P., « Public offerings of state-owned and privately-owned enterprises:An international comparison», Journal of Finance, Vol. III, No. 4, p. 1659-1679, 1997.
Dimson, E., « Risk measurement when shares are subject to infrequent trading », Journal ofFinancial Economics 7, p. 197-226, 1979.
Eijgenhuijsen, H., Buijs, A., « Initial public offerings in the Netherlands 1982-1991 », Universityof Amsterdam working paper, 1993.
22
Falk, H., Thornton, D., « The Canadian market for initial public offerings: Evidence from theToronto, Montreal and Alberta stock exchanges », Unpublished working paper, 1992.
Fama, E., « Market efficiency, long-term returns, and behavioral finance » Journal of FinancialEconomics 49, p. 283-306, 1998.
Field, L., « Is institutional investment in initial public offerings related to long-run performanceof these firms? », Pennsylvania State University working paper, 1995.
Firth, M., « An analysis of the stock market performance of new issues in New Zealand»,Pacific-Basin Finance Journal 5, p. 63-85, 1997.
Friedlan J., Maynes, E., Verma, S., « The Long Run Performance of Canadian Initial PublicOfferings », Schulisch School of Business, York University working paper, 1994.
Giudici, G, Paleari, S., « Underpricing, price stabilization and long run performance in initialpublic offerings: as study on the Italian stock market between 1985 and 1998 », SSRNworking paper, 1999.
Habib, M., Ljungqvist, A., « Underpricing and entrepreneurial losses in IPOs : Theory andevidence », SSRN working paper, 1999.
Hand, J., « Profits, losses and the non-linear pricing of internet stocks », SSRN working paper,2000.
Hebner, K., Hiraki, T., « Japanese initial public offerings », Restructuring Japan’s FinancialMarkets, edition Walter. I et Hiraki. T Homewood, IL: Business One/Irwin.1993.
Helwege, J., Liang, N., « Initial public offerings in hot and cold markets », Federal Reserve Bankof New York, 1996.
Holhausen, R., Larcker, D., « The financial performance of reverse leveraged buyouts », Journalof Financial Economics 42, p. 293-332, 1996.
How, J., Izan, H., Monroe, G., « Differential information and the underpricing of initial publicofferings: Australian evidence», Accounting and Finance vol. 35 (1), p. 87 –106, 1995.
How, J., Howe, J., « Warrants in initial public offerings: Empirical evidence », The Journal ofBusiness vol 74 (3), forthcoming 2001.
Hoffmann-Burchardi, U., « Clustering of initial public offerings, information revelation andunderpricing », European Economic Review 45, p. 353-383, 2001.
Huang, Q., Levich, R., « Underpricing of new equity offerings by privatized firms: Aninternational test», SSRN working paper, 1998.
Ibbotson, R., « Price performance of common stock new issues », Journal of FinancialEconomics 2, p. 235-272, 1975.
Ibbotson, R., Jaffe, J., « Hot issue markets», Journal of Finance, Vol XXX (4), p. 1027-1042,1975.
23
Ibbotson, R., Sindelar, J., Ritter, J. « The market's problems with the pricing of initial publicofferings », Journal of Applied Corporate Finance 7, 66-74, 1994.
Jog, V., Srivastava, A., « Underpricing in Canadian IPOs 1971-1992-- An update », FINECO 4,No. 1, p. 81-87, 1994.
Jog, V., « The climate for Canadian initial public offerings », Financing Growth in Canada, ed.P. Halpern, University of Calgary press, p. 357-401, 1997.
Jog, V., McConnomy, B., «Voluntary disclosure of management earnings forecasts in IPOs andthe impact on underpricing and post - issue return performance», SSRN working paper,1999.
Jog, V., Riding, A., « Underpricing in Canadian IPOs », Financial Analysts Journal, p. 45-55,1987.
Johnston, J., Méthodes économétriques (third edition), Paris :Economica, 1985.
Katz, G., Owen, J., « Initial public offering: an equilibrium model of price determination»,Journal of Economics, Auditing & Finance, p. 266-284, 1987.
Katsuna, K., Smith, R., « How IPO pricing method affects underpricing and issue cost: Evidenceon Japan’s change from auction method pricing to book-building », SSRN working paper,2000.
Keloharju, M., « The winner's curse, legal liability, and the long-run price performance of initialpublic offerings in the Finland », Journal of Financial Economics 34, p. 251-277, 1993.
Kim, J., Krinsky, I., Lee, J., « The aftermarket performance of initial public offerings in Korea»,Pacific-Basin Finance Journal 3, p. 429-448, 1995.
Kim, M., Ritter, J., « Valuing IPOs », Journal of Financial Economics 53:3, p. 409-437 1999.
Kothari, S., Warner, J., « Measuring long-horizon security price performance », Journal ofFinancial Economics 43, p. 301-339, 1997.
Krigman, L., Shaw, W., Womack, K., « The persistence of IPO mispricing and the predictivepower of flipping », Dartmouth College working paper, 1997.
Lee, J., Henderson, G., « The hot issue market phenomenon and business conditions », Universityof Cincinnati working paper, 1999.
Lee, P., Taylor, S., Walter, T., « Australian IPO pricing in the short and long run », Journal ofBanking & Finance 20, p. 1189-1210, 1996.
Lee, M., Lee, P., Taylor, S., « Unit initial public offerings: Staged equity or signallingmechanism ? », SSRN working paper, 2000.
Liaw, G., Liu, Y., Wei. K., « On the demand elasticity of initial public offerings: An analysis ofdiscriminatory auctions», Hong Kong University of Science and Technology workingpaper, 2000.
24
Lerner, J., « Venture capitalists and the decision to go public », Journal of Financial Economics35, p. 293-316, 1994.
Levis, M., « The long-run performance of initial public offerings: The UK experience 1980-1988 », Financial Management 22, 28-41,1993.
Ljungqvist, A., « IPO underpricing, wealth losses and the curious role of venture capitalists in thecreation of public companies », SSRN working paper, 1999.
Ljungqvist, A., « Pricing initial public offerings : Further evidence from Germany », EuropeanEconomic Review 41, p. 1309-1320, 1997.
Ljungqvist, A, Jenkinson, T., Wilhelm, W., « Global integration in primary equity markets: Therole of U.S. banks and U.S. investors » NYU working paper, 2000.
Loughran, T., Ritter, J., « The new issues puzzle », Journal of Finance 50, p. 23-51, 1995.
Loughran, T., Ritter, J., « Uniformly least powerful tests of market efficiency », Unpublishedmanuscript, University of Florida, 1998.
Loughran, T., Ritter, J., « Why don’t issuers get upset about leaving money on the table in IPOs ?», Review of Financial Studies, forthcoming 2001.
Loughran, T., Ritter, J., Rydqvist, K., « Initial public offerings: International insights », Pacific-Basin Finance Journal 2, p. 165-199, 1994.
Lowry, M., « Determinants of IPO volume », Pen State University working paper, 2000.
Lowry, M., Schwert, G., « IPO market cycles: an explanatory investigation », SSRN workingpaper, 2000.
Lowry, M., Schwert, G., « Biases in the IPO pricing process », NBER working paper, 2001.
Lyon, J., Barber, B., Tsai, C., « Improved methods for tests of long-run abnormal stock returns »,Journal of Finance 54, p. 165-201, 1999.
MacIntosh, J., « Legal and institutional barriers to financing innovative enterprise in Canada»,Queen’s University working paper, 1994.
MacIntosh, J., « Les sorties du marché du capital de risque au Canada et aux États-Unis »,Industrie Canada working paper, University of Galgary press, 1997.
Maksimovic, V., Unal, H., « Issue size choice and underpricing in thrift mutual-to-stockconversions », Journal of Finance 48, p. 1659-1692, 1993.
Mathias, P., « Police, regulators, losing the fight as stock fraud runs rampant », The FinancialPost, p. 10-11, 1994.
McGuinness, P., « An examination of the underpricing of initial public offerings in Hong Kong», Journal of Business Finance and Accounting 19, p. 165-186, 1992.
Michaely, R., Shaw, W., « The pricing of initial public offerings: Tests of adverse selection andsignalling theories », The Review of Financial Studies 7, p. 279-319, 1994.
25
Mikkelson, W., Partch, M., Shah, K., « Ownership and operating performance of companies thatgo public », Journal of Financial Economics 44, p. 281-307, 1997.
Mok, H., Hui, Y., « Underpricing and aftermarket performance of IPOs in Shanghai, China »,Pacific-Basin Finance Journal 6, p. 453-474, 1998.
Pagano, M, Panetta, F., Zingales, L., « The stock as a source of capital : Some lessons from initialofferings in Italy », European Economic Review 40, p. 1057-1069, 1996.
Pagano, M., Panetta, F., Zingales, L., « Why do companies go public ? An empirical analysis »,Journal of Finance 53-1, p. 27-64, 1998.
Paudyal. K., Saadouni, B., Briston, R., « Privatisation initial public offerings in Malaysia: Initialpremium and long-term performance», Pacific-Basin Finance Journal 6, p. 427-451,1998.
Rajan, R., Servaes, H., « Analyst following of initial public offerings », Journal of Finance 52, p.507-529, 1997.
Reese, W., « IPO underpricing, trading volume, and investor interest», SSRN working paper, août1998.
Ritter, J., « Initial public offerings», Contemporary Finance Digest, Vol. 2, No. 1, p. 5-30, 1998.
Ritter, J., « The hot issue market of 1980 », Journal of Business 32, p. 215-240, 1984.
Ritter, J., « The long-run performance of initial public offerings », Journal of Finance 46, p. 3-27, 1991.
Ritter, J., « The long-run performance of initial public offerings », Journal of Finance 46, p. 3-27, 1991.
Ritter, J., « The costs of going public », Journal of Financial Economics 19, p. 269-281, 1987.
Ritter, J., « Investment Banking and Securities Issuance », chapitre 9 du North-HollandHandbook of the Economics of Finance, ed. George Constantinides, Milton Harris etRené Stulz, (à paraître 2002), version 7 mars 2001.
Robinson, M., « Mobiliser des capitaux d’investissement pour les petites et moyennes entreprisessur les marchés boursiers au Canada », Financing Growth in Canada, ed. P. Halpern,University of Calgary press, p. 659-709, 1997.
Rock, K., « Why new issues are underpriced », Journal of Financial Economics 15, p. 187-212,1986.
Rydqvist, K., Häogholm, K., « Going public in the 1980s: evidence from Sweden », EuropeanFinancial Management 1, p. 287-315, 1995.
Sherman, A., « Global trends in IPO methods: Book-building vs. auctions», Notre DameUniversity working paper, 2001.
Schultz, P., « Unit initial public offerings-A form of staged financing », Journal of FinancialEconomics 15, p. 187-212, 1993.
26
Shiller, R., « Do stock prices move too much to be justified by subsequent changes in dividend?»,American Economics Review, p. 421-436, 1981.
Stoughton, N., Wong, K., Zechner, J., « IPO and product quality », Journal of Business 74, no 3,2001.
Su, D., Fleisher, B., « An empirical investigation of underpricing in Chinese IPOs », Pacific-Basin Finance Journal 7, p. 173-202, 1999.
Suret, J., Cormier, E., Lemay, B., « Le RÉAQ et la sous-évaluation initiale du prix des titres»,Canadian Journal of Administrative Sciences 7, No. 3, p. 47-56, 1990.
Teoh, S., Welch, I., Wong, T., « Earnings management and the post-issue underperformance inseasoned equity offerings », Journal of Financial Economics 50, p. 63-99, 1998.
Teoh, S., Welch, I., Wong, T., « Earnings management and the long-run market performance ofinitial public offerings », Journal of Finance 53, p. 1935-1974, 1998.
Tinic, S., « Anatomy of initial public offering of common stock », Journal of Finance 43, p. 789-822, 1988.
Titman, S., Trueman, B., « Information quality and the valuation of new issues », Journal ofAccounting and Economics 8, p. 159-172, 1986.
Welch, I., « Seasoned offerings, imitation costs and the underpricing of initial public offerings »,Journal of Finance 44, p. 421-449, 1989.
Wen, K., « Residual risk, investor heterogeneity, and participation restriction: Explaining long-run underperformance of initial public offerings », SSRN working paper, 1999.
White, H., « A Heteroscedasticity-Consistent Covariance Matrix Estimator and a Direct Test forHeteroscedasticity », Econometrica, 48, p. 817-838, 1980.
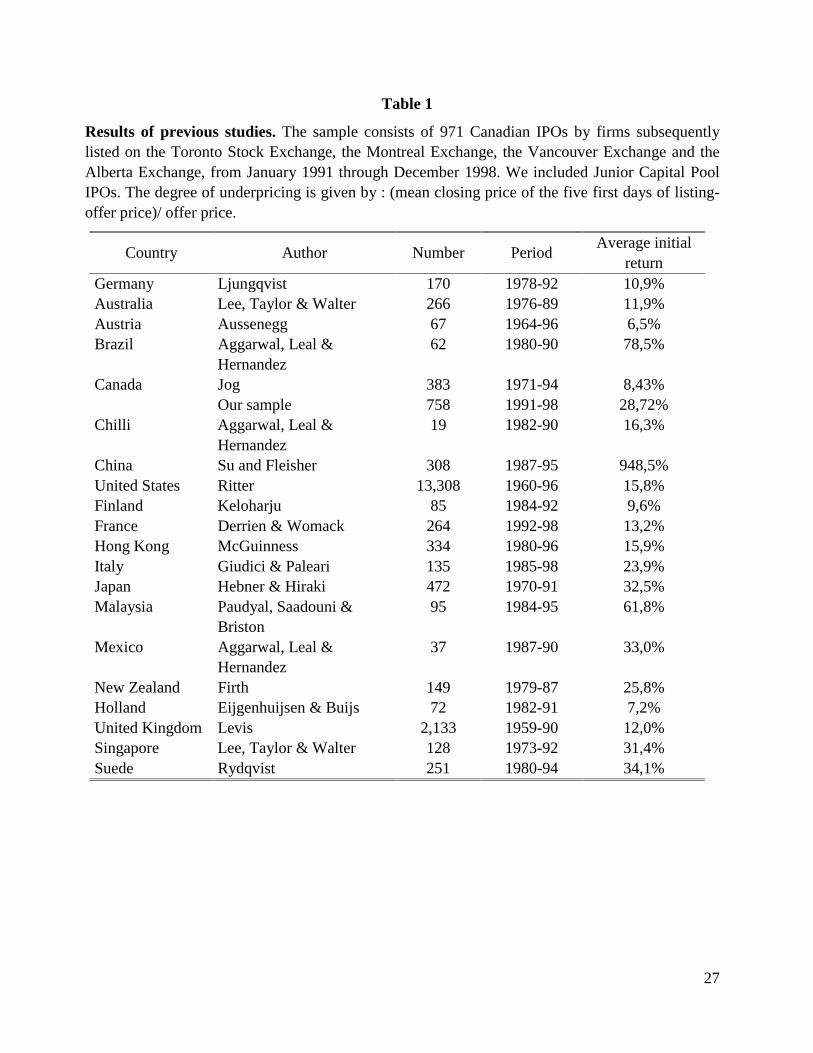
27
Table 1
Results of previous studies. The sample consists of 971 Canadian IPOs by firms subsequentlylisted on the Toronto Stock Exchange, the Montreal Exchange, the Vancouver Exchange and theAlberta Exchange, from January 1991 through December 1998. We included Junior Capital PoolIPOs. The degree of underpricing is given by : (mean closing price of the five first days of listing-offer price)/ offer price.
Country Author Number PeriodAverage initial
returnGermany Ljungqvist 170 1978-92 10,9%Australia Lee, Taylor & Walter 266 1976-89 11,9%Austria Aussenegg 67 1964-96 6,5%Brazil Aggarwal, Leal &
Hernandez62 1980-90 78,5%
Canada JogOur sample
383758
1971-941991-98
8,43%28,72%
Chilli Aggarwal, Leal &Hernandez
19 1982-90 16,3%
China Su and Fleisher 308 1987-95 948,5%United States Ritter 13,308 1960-96 15,8%Finland Keloharju 85 1984-92 9,6%France Derrien & Womack 264 1992-98 13,2%Hong Kong McGuinness 334 1980-96 15,9%Italy Giudici & Paleari 135 1985-98 23,9%Japan Hebner & Hiraki 472 1970-91 32,5%Malaysia Paudyal, Saadouni &
Briston95 1984-95 61,8%
Mexico Aggarwal, Leal &Hernandez
37 1987-90 33,0%
New Zealand Firth 149 1979-87 25,8%Holland Eijgenhuijsen & Buijs 72 1982-91 7,2%United Kingdom Levis 2,133 1959-90 12,0%Singapore Lee, Taylor & Walter 128 1973-92 31,4%Suede Rydqvist 251 1980-94 34,1%
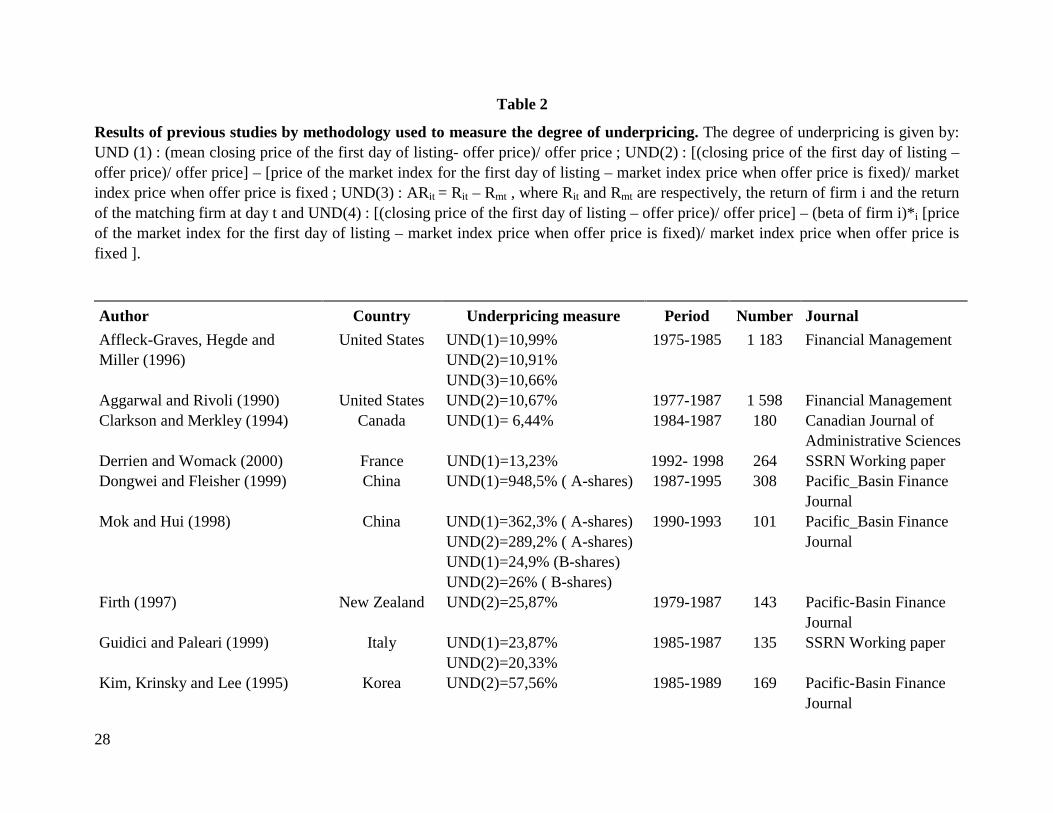
28
Table 2
Results of previous studies by methodology used to measure the degree of underpricing. The degree of underpricing is given by:UND (1) : (mean closing price of the first day of listing- offer price)/ offer price ; UND(2) : [(closing price of the first day of listing –offer price)/ offer price] – [price of the market index for the first day of listing – market index price when offer price is fixed)/ marketindex price when offer price is fixed ; UND(3) : ARit = Rit – Rmt , where Rit and Rmt are respectively, the return of firm i and the returnof the matching firm at day t and UND(4) : [(closing price of the first day of listing – offer price)/ offer price] – (beta of firm i)*i [priceof the market index for the first day of listing – market index price when offer price is fixed)/ market index price when offer price isfixed ].
Author Country Underpricing measure Period Number Journal
Affleck-Graves, Hegde andMiller (1996)
United States UND(1)=10,99%UND(2)=10,91%UND(3)=10,66%
1975-1985 1 183 Financial Management
Aggarwal and Rivoli (1990) United States UND(2)=10,67% 1977-1987 1 598 Financial ManagementClarkson and Merkley (1994) Canada UND(1)= 6,44% 1984-1987 180 Canadian Journal of
Administrative SciencesDerrien and Womack (2000) France UND(1)=13,23% 1992- 1998 264 SSRN Working paperDongwei and Fleisher (1999) China UND(1)=948,5% ( A-shares) 1987-1995 308 Pacific_Basin Finance
JournalMok and Hui (1998) China UND(1)=362,3% ( A-shares)
UND(2)=289,2% ( A-shares)UND(1)=24,9% (B-shares)UND(2)=26% ( B-shares)
1990-1993 101 Pacific_Basin FinanceJournal
Firth (1997) New Zealand UND(2)=25,87% 1979-1987 143 Pacific-Basin FinanceJournal
Guidici and Paleari (1999) Italy UND(1)=23,87%UND(2)=20,33%
1985-1987 135 SSRN Working paper
Kim, Krinsky and Lee (1995) Korea UND(2)=57,56% 1985-1989 169 Pacific-Basin FinanceJournal
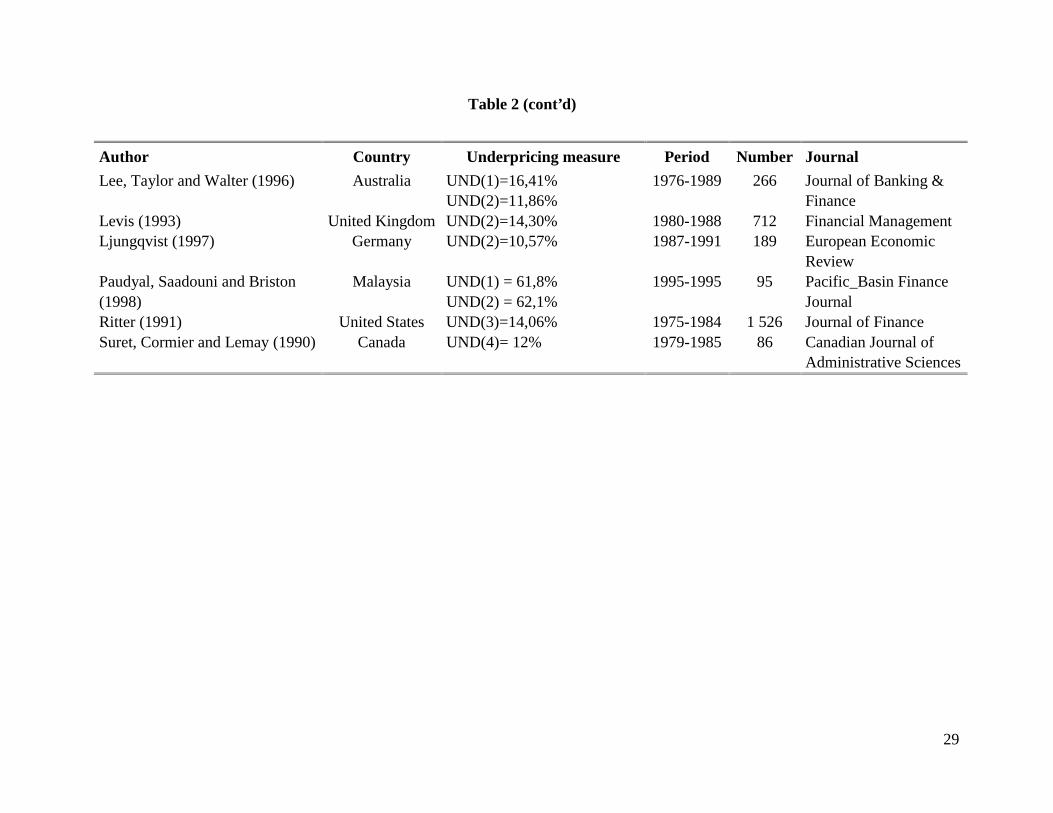
29
Table 2 (cont’d)
Author Country Underpricing measure Period Number Journal
Lee, Taylor and Walter (1996) Australia UND(1)=16,41%UND(2)=11,86%
1976-1989 266 Journal of Banking &Finance
Levis (1993) United Kingdom UND(2)=14,30% 1980-1988 712 Financial ManagementLjungqvist (1997) Germany UND(2)=10,57% 1987-1991 189 European Economic
ReviewPaudyal, Saadouni and Briston(1998)
Malaysia UND(1) = 61,8%UND(2) = 62,1%
1995-1995 95 Pacific_Basin FinanceJournal
Ritter (1991) United States UND(3)=14,06% 1975-1984 1 526 Journal of FinanceSuret, Cormier and Lemay (1990) Canada UND(4)= 12% 1979-1985 86 Canadian Journal of
Administrative Sciences
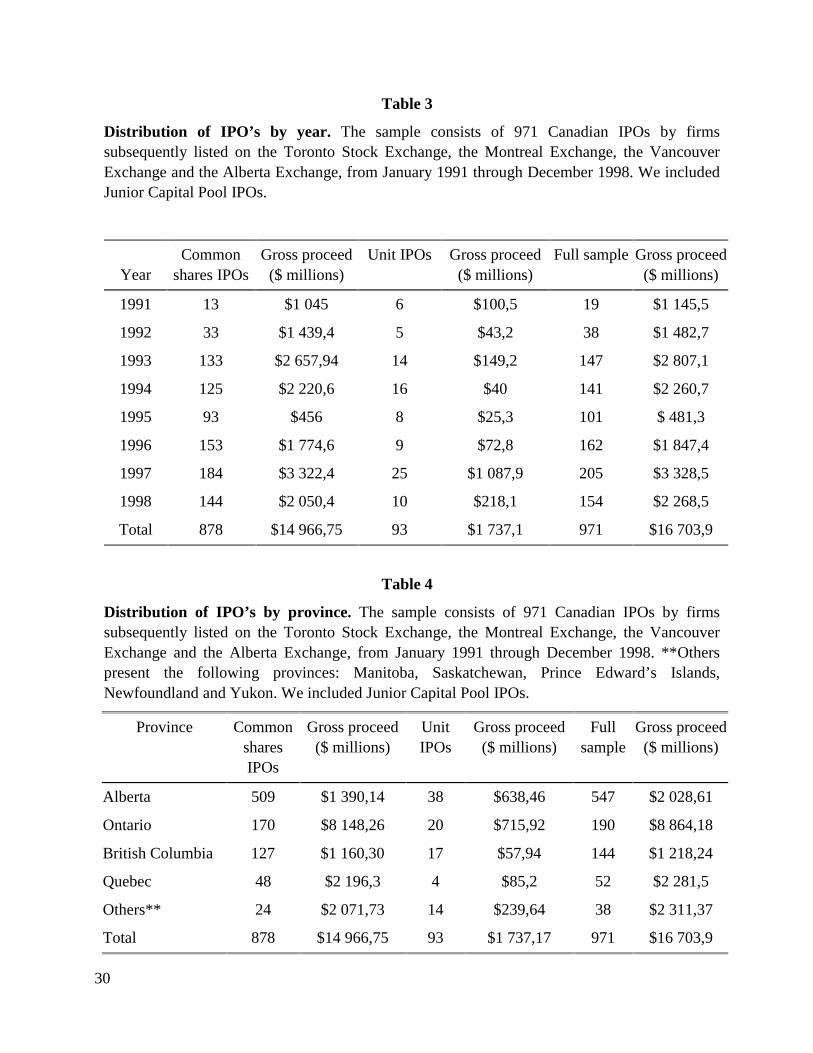
30
Table 3
Distribution of IPO’s by year. The sample consists of 971 Canadian IPOs by firmssubsequently listed on the Toronto Stock Exchange, the Montreal Exchange, the VancouverExchange and the Alberta Exchange, from January 1991 through December 1998. We includedJunior Capital Pool IPOs.
YearCommon
shares IPOsGross proceed
($ millions)Unit IPOs Gross proceed
($ millions)Full sample Gross proceed
($ millions)
1991 13 $1 045 6 $100,5 19 $1 145,5
1992 33 $1 439,4 5 $43,2 38 $1 482,7
1993 133 $2 657,94 14 $149,2 147 $2 807,1
1994 125 $2 220,6 16 $40 141 $2 260,7
1995 93 $456 8 $25,3 101 $ 481,3
1996 153 $1 774,6 9 $72,8 162 $1 847,4
1997 184 $3 322,4 25 $1 087,9 205 $3 328,5
1998 144 $2 050,4 10 $218,1 154 $2 268,5
Total 878 $14 966,75 93 $1 737,1 971 $16 703,9
Table 4
Distribution of IPO’s by province. The sample consists of 971 Canadian IPOs by firmssubsequently listed on the Toronto Stock Exchange, the Montreal Exchange, the VancouverExchange and the Alberta Exchange, from January 1991 through December 1998. **Otherspresent the following provinces: Manitoba, Saskatchewan, Prince Edward’s Islands,Newfoundland and Yukon. We included Junior Capital Pool IPOs.
Province CommonsharesIPOs
Gross proceed($ millions)
UnitIPOs
Gross proceed($ millions)
Fullsample
Gross proceed($ millions)
Alberta 509 $1 390,14 38 $638,46 547 $2 028,61
Ontario 170 $8 148,26 20 $715,92 190 $8 864,18
British Columbia 127 $1 160,30 17 $57,94 144 $1 218,24
Quebec 48 $2 196,3 4 $85,2 52 $2 281,5
Others** 24 $2 071,73 14 $239,64 38 $2 311,37
Total 878 $14 966,75 93 $1 737,17 971 $16 703,9
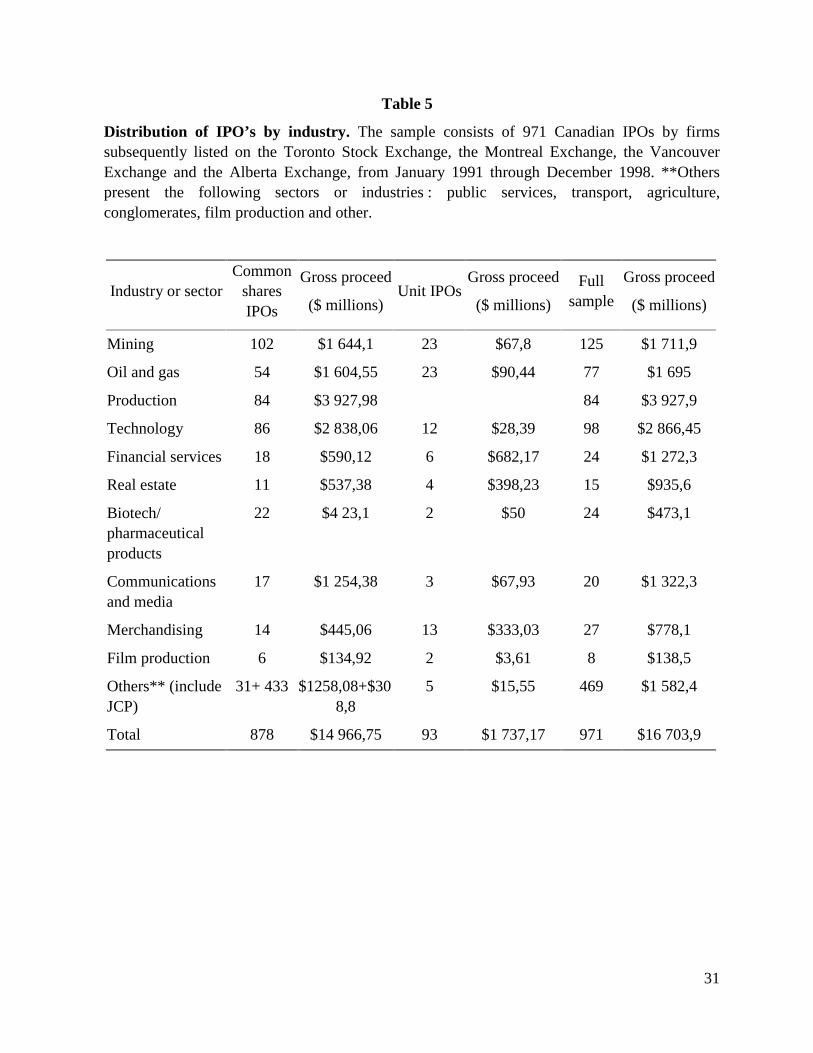
31
Table 5
Distribution of IPO’s by industry. The sample consists of 971 Canadian IPOs by firmssubsequently listed on the Toronto Stock Exchange, the Montreal Exchange, the VancouverExchange and the Alberta Exchange, from January 1991 through December 1998. **Otherspresent the following sectors or industries : public services, transport, agriculture,conglomerates, film production and other.
Industry or sectorCommon
sharesIPOs
Gross proceed
($ millions)Unit IPOs
Gross proceed
($ millions)
Fullsample
Gross proceed
($ millions)
Mining 102 $1 644,1 23 $67,8 125 $1 711,9
Oil and gas 54 $1 604,55 23 $90,44 77 $1 695
Production 84 $3 927,98 84 $3 927,9
Technology 86 $2 838,06 12 $28,39 98 $2 866,45
Financial services 18 $590,12 6 $682,17 24 $1 272,3
Real estate 11 $537,38 4 $398,23 15 $935,6
Biotech/pharmaceuticalproducts
22 $4 23,1 2 $50 24 $473,1
Communicationsand media
17 $1 254,38 3 $67,93 20 $1 322,3
Merchandising 14 $445,06 13 $333,03 27 $778,1
Film production 6 $134,92 2 $3,61 8 $138,5
Others** (includeJCP)
31+ 433 $1258,08+$308,8
5 $15,55 469 $1 582,4
Total 878 $14 966,75 93 $1 737,17 971 $16 703,9
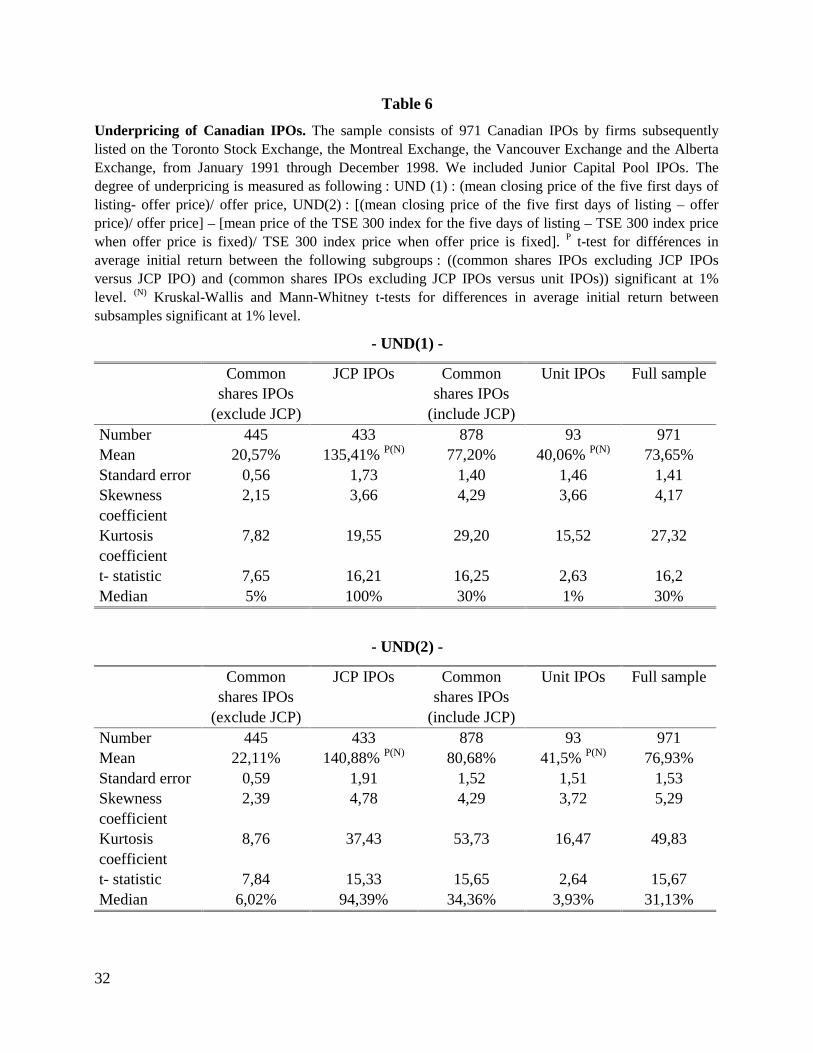
32
Table 6
Underpricing of Canadian IPOs. The sample consists of 971 Canadian IPOs by firms subsequentlylisted on the Toronto Stock Exchange, the Montreal Exchange, the Vancouver Exchange and the AlbertaExchange, from January 1991 through December 1998. We included Junior Capital Pool IPOs. Thedegree of underpricing is measured as following : UND (1) : (mean closing price of the five first days oflisting- offer price)/ offer price, UND(2) : [(mean closing price of the five first days of listing – offerprice)/ offer price] – [mean price of the TSE 300 index for the five days of listing – TSE 300 index pricewhen offer price is fixed)/ TSE 300 index price when offer price is fixed]. P t-test for différences inaverage initial return between the following subgroups : ((common shares IPOs excluding JCP IPOsversus JCP IPO) and (common shares IPOs excluding JCP IPOs versus unit IPOs)) significant at 1%level. (N) Kruskal-Wallis and Mann-Whitney t-tests for differences in average initial return betweensubsamples significant at 1% level.
- UND(1) -
Commonshares IPOs
(exclude JCP)
JCP IPOs Commonshares IPOs
(include JCP)
Unit IPOs Full sample
Number 445 433 878 93 971Mean 20,57% 135,41% P(N) 77,20% 40,06% P(N) 73,65%Standard error 0,56 1,73 1,40 1,46 1,41Skewnesscoefficient
2,15 3,66 4,29 3,66 4,17
Kurtosiscoefficient
7,82 19,55 29,20 15,52 27,32
t- statistic 7,65 16,21 16,25 2,63 16,2Median 5% 100% 30% 1% 30%
- UND(2) -
Commonshares IPOs
(exclude JCP)
JCP IPOs Commonshares IPOs
(include JCP)
Unit IPOs Full sample
Number 445 433 878 93 971Mean 22,11% 140,88% P(N) 80,68% 41,5% P(N) 76,93%Standard error 0,59 1,91 1,52 1,51 1,53Skewnesscoefficient
2,39 4,78 4,29 3,72 5,29
Kurtosiscoefficient
8,76 37,43 53,73 16,47 49,83
t- statistic 7,84 15,33 15,65 2,64 15,67Median 6,02% 94,39% 34,36% 3,93% 31,13%
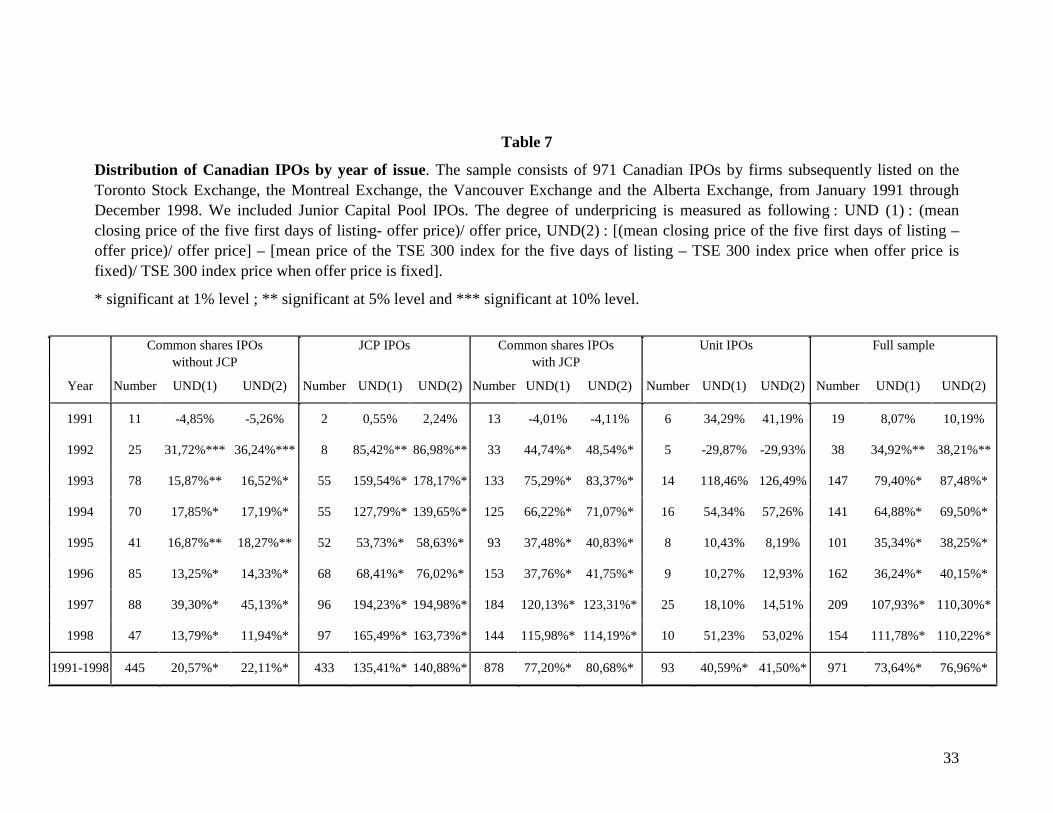
33
Table 7
Distribution of Canadian IPOs by year of issue. The sample consists of 971 Canadian IPOs by firms subsequently listed on theToronto Stock Exchange, the Montreal Exchange, the Vancouver Exchange and the Alberta Exchange, from January 1991 throughDecember 1998. We included Junior Capital Pool IPOs. The degree of underpricing is measured as following : UND (1) : (meanclosing price of the five first days of listing- offer price)/ offer price, UND(2) : [(mean closing price of the five first days of listing –offer price)/ offer price] – [mean price of the TSE 300 index for the five days of listing – TSE 300 index price when offer price isfixed)/ TSE 300 index price when offer price is fixed].
* significant at 1% level ; ** significant at 5% level and *** significant at 10% level.
Common shares IPOswithout JCP
JCP IPOs Common shares IPOswith JCP
Unit IPOs Full sample
Year Number UND(1) UND(2) Number UND(1) UND(2) Number UND(1) UND(2) Number UND(1) UND(2) Number UND(1) UND(2)
1991 11 -4,85% -5,26% 2 0,55% 2,24% 13 -4,01% -4,11% 6 34,29% 41,19% 19 8,07% 10,19%
1992 25 31,72%*** 36,24%*** 8 85,42%** 86,98%** 33 44,74%* 48,54%* 5 -29,87% -29,93% 38 34,92%** 38,21%**
1993 78 15,87%** 16,52%* 55 159,54%* 178,17%* 133 75,29%* 83,37%* 14 118,46% 126,49% 147 79,40%* 87,48%*
1994 70 17,85%* 17,19%* 55 127,79%* 139,65%* 125 66,22%* 71,07%* 16 54,34% 57,26% 141 64,88%* 69,50%*
1995 41 16,87%** 18,27%** 52 53,73%* 58,63%* 93 37,48%* 40,83%* 8 10,43% 8,19% 101 35,34%* 38,25%*
1996 85 13,25%* 14,33%* 68 68,41%* 76,02%* 153 37,76%* 41,75%* 9 10,27% 12,93% 162 36,24%* 40,15%*
1997 88 39,30%* 45,13%* 96 194,23%* 194,98%* 184 120,13%* 123,31%* 25 18,10% 14,51% 209 107,93%* 110,30%*
1998 47 13,79%* 11,94%* 97 165,49%* 163,73%* 144 115,98%* 114,19%* 10 51,23% 53,02% 154 111,78%* 110,22%*
1991-1998 445 20,57%* 22,11%* 433 135,41%* 140,88%* 878 77,20%* 80,68%* 93 40,59%* 41,50%* 971 73,64%* 76,96%*
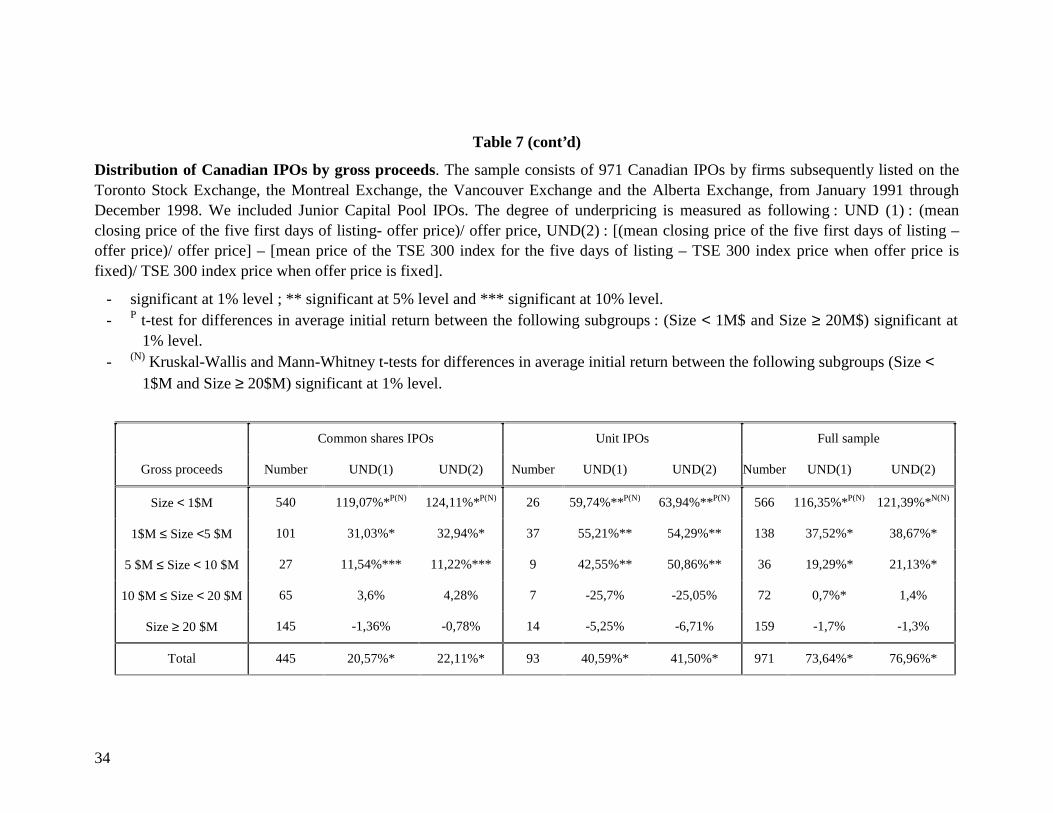
34
Table 7 (cont’d)
Distribution of Canadian IPOs by gross proceeds. The sample consists of 971 Canadian IPOs by firms subsequently listed on theToronto Stock Exchange, the Montreal Exchange, the Vancouver Exchange and the Alberta Exchange, from January 1991 throughDecember 1998. We included Junior Capital Pool IPOs. The degree of underpricing is measured as following : UND (1) : (meanclosing price of the five first days of listing- offer price)/ offer price, UND(2) : [(mean closing price of the five first days of listing –offer price)/ offer price] – [mean price of the TSE 300 index for the five days of listing – TSE 300 index price when offer price isfixed)/ TSE 300 index price when offer price is fixed].
- significant at 1% level ; ** significant at 5% level and *** significant at 10% level.- P t-test for differences in average initial return between the following subgroups : (Size < 1M$ and Size ≥ 20M$) significant at
1% level.- (N) Kruskal-Wallis and Mann-Whitney t-tests for differences in average initial return between the following subgroups (Size <
1$M and Size ≥ 20$M) significant at 1% level.
Common shares IPOs Unit IPOs Full sample
Gross proceeds Number UND(1) UND(2) Number UND(1) UND(2) Number UND(1) UND(2)
Size < 1$M 540 119,07%*P(N) 124,11%*P(N) 26 59,74%**P(N) 63,94%**P(N) 566 116,35%*P(N) 121,39%*N(N)
1$M ≤ Size <5 $M 101 31,03%* 32,94%* 37 55,21%** 54,29%** 138 37,52%* 38,67%*
5 $M ≤ Size < 10 $M 27 11,54%*** 11,22%*** 9 42,55%** 50,86%** 36 19,29%* 21,13%*
10 $M ≤ Size < 20 $M 65 3,6% 4,28% 7 -25,7% -25,05% 72 0,7%* 1,4%
Size ≥ 20 $M 145 -1,36% -0,78% 14 -5,25% -6,71% 159 -1,7% -1,3%
Total 445 20,57%* 22,11%* 93 40,59%* 41,50%* 971 73,64%* 76,96%*
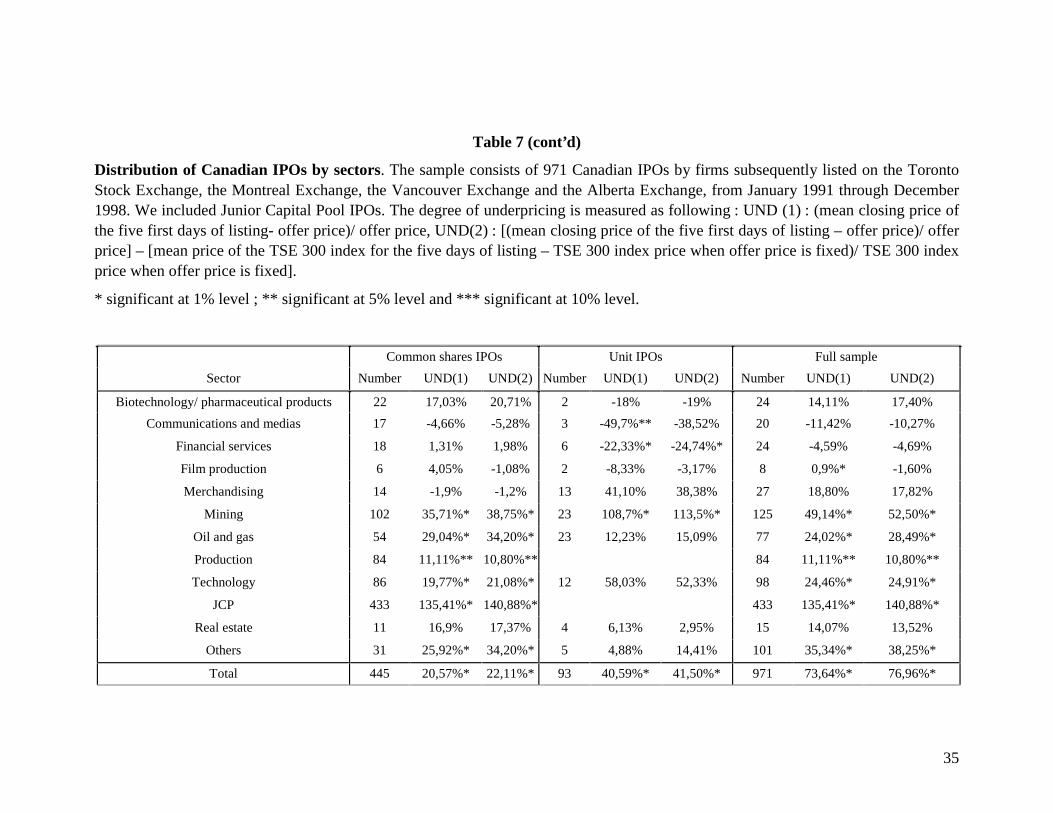
35
Table 7 (cont’d)
Distribution of Canadian IPOs by sectors. The sample consists of 971 Canadian IPOs by firms subsequently listed on the TorontoStock Exchange, the Montreal Exchange, the Vancouver Exchange and the Alberta Exchange, from January 1991 through December1998. We included Junior Capital Pool IPOs. The degree of underpricing is measured as following : UND (1) : (mean closing price ofthe five first days of listing- offer price)/ offer price, UND(2) : [(mean closing price of the five first days of listing – offer price)/ offerprice] – [mean price of the TSE 300 index for the five days of listing – TSE 300 index price when offer price is fixed)/ TSE 300 indexprice when offer price is fixed].
* significant at 1% level ; ** significant at 5% level and *** significant at 10% level.
Common shares IPOs Unit IPOs Full sample
Sector Number UND(1) UND(2) Number UND(1) UND(2) Number UND(1) UND(2)
Biotechnology/ pharmaceutical products 22 17,03% 20,71% 2 -18% -19% 24 14,11% 17,40%
Communications and medias 17 -4,66% -5,28% 3 -49,7%** -38,52% 20 -11,42% -10,27%
Financial services 18 1,31% 1,98% 6 -22,33%* -24,74%* 24 -4,59% -4,69%
Film production 6 4,05% -1,08% 2 -8,33% -3,17% 8 0,9%* -1,60%
Merchandising 14 -1,9% -1,2% 13 41,10% 38,38% 27 18,80% 17,82%
Mining 102 35,71%* 38,75%* 23 108,7%* 113,5%* 125 49,14%* 52,50%*
Oil and gas 54 29,04%* 34,20%* 23 12,23% 15,09% 77 24,02%* 28,49%*
Production 84 11,11%** 10,80%** 84 11,11%** 10,80%**
Technology 86 19,77%* 21,08%* 12 58,03% 52,33% 98 24,46%* 24,91%*
JCP 433 135,41%* 140,88%* 433 135,41%* 140,88%*
Real estate 11 16,9% 17,37% 4 6,13% 2,95% 15 14,07% 13,52%
Others 31 25,92%* 34,20%* 5 4,88% 14,41% 101 35,34%* 38,25%*
Total 445 20,57%* 22,11%* 93 40,59%* 41,50%* 971 73,64%* 76,96%*
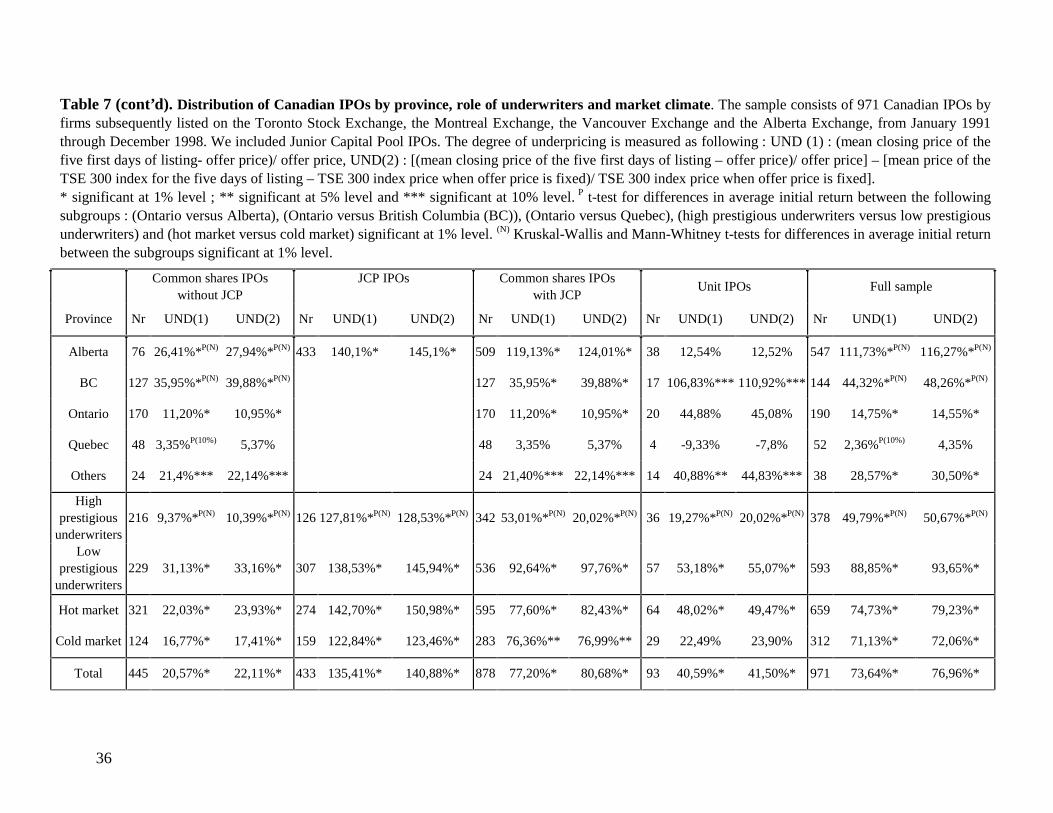
36
Table 7 (cont’d). Distribution of Canadian IPOs by province, role of underwriters and market climate. The sample consists of 971 Canadian IPOs byfirms subsequently listed on the Toronto Stock Exchange, the Montreal Exchange, the Vancouver Exchange and the Alberta Exchange, from January 1991through December 1998. We included Junior Capital Pool IPOs. The degree of underpricing is measured as following : UND (1) : (mean closing price of thefive first days of listing- offer price)/ offer price, UND(2) : [(mean closing price of the five first days of listing – offer price)/ offer price] – [mean price of theTSE 300 index for the five days of listing – TSE 300 index price when offer price is fixed)/ TSE 300 index price when offer price is fixed].* significant at 1% level ; ** significant at 5% level and *** significant at 10% level. P t-test for differences in average initial return between the followingsubgroups : (Ontario versus Alberta), (Ontario versus British Columbia (BC)), (Ontario versus Quebec), (high prestigious underwriters versus low prestigiousunderwriters) and (hot market versus cold market) significant at 1% level. (N) Kruskal-Wallis and Mann-Whitney t-tests for differences in average initial returnbetween the subgroups significant at 1% level.
Common shares IPOswithout JCP
JCP IPOs Common shares IPOswith JCP
Unit IPOs Full sample
Province Nr UND(1) UND(2) Nr UND(1) UND(2) Nr UND(1) UND(2) Nr UND(1) UND(2) Nr UND(1) UND(2)
Alberta 76 26,41%*P(N) 27,94%*P(N) 433 140,1%* 145,1%* 509 119,13%* 124,01%* 38 12,54% 12,52% 547 111,73%*P(N) 116,27%*P(N)
BC 127 35,95%*P(N) 39,88%*P(N) 127 35,95%* 39,88%* 17 106,83%*** 110,92%*** 144 44,32%*P(N) 48,26%*P(N)
Ontario 170 11,20%* 10,95%* 170 11,20%* 10,95%* 20 44,88% 45,08% 190 14,75%* 14,55%*
Quebec 48 3,35%P(10%) 5,37% 48 3,35% 5,37% 4 -9,33% -7,8% 52 2,36%P(10%) 4,35%
Others 24 21,4%*** 22,14%*** 24 21,40%*** 22,14%*** 14 40,88%** 44,83%*** 38 28,57%* 30,50%*
Highprestigious
underwriters216 9,37%*P(N) 10,39%*P(N) 126 127,81%*P(N) 128,53%*P(N) 342 53,01%*P(N) 20,02%*P(N) 36 19,27%*P(N) 20,02%*P(N) 378 49,79%*P(N) 50,67%*P(N)
Lowprestigious
underwriters229 31,13%* 33,16%* 307 138,53%* 145,94%* 536 92,64%* 97,76%* 57 53,18%* 55,07%* 593 88,85%* 93,65%*
Hot market 321 22,03%* 23,93%* 274 142,70%* 150,98%* 595 77,60%* 82,43%* 64 48,02%* 49,47%* 659 74,73%* 79,23%*
Cold market 124 16,77%* 17,41%* 159 122,84%* 123,46%* 283 76,36%** 76,99%** 29 22,49% 23,90% 312 71,13%* 72,06%*
Total 445 20,57%* 22,11%* 433 135,41%* 140,88%* 878 77,20%* 80,68%* 93 40,59%* 41,50%* 971 73,64%* 76,96%*
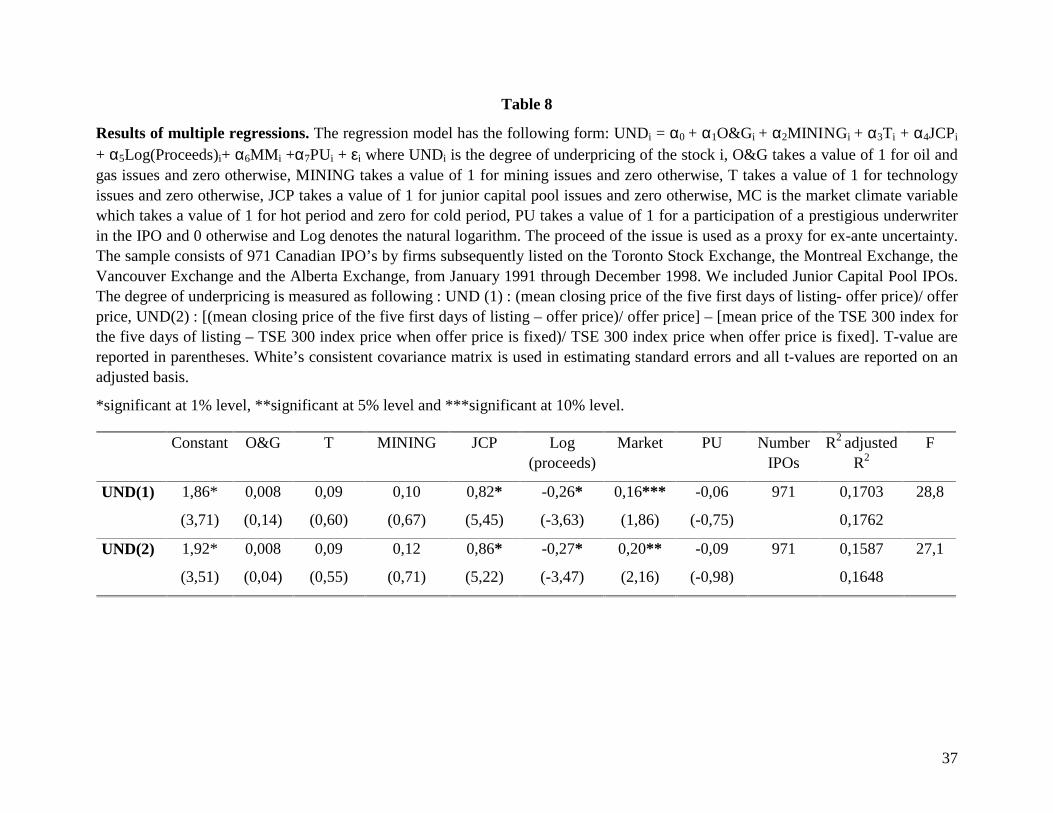
37
Table 8
Results of multiple regressions. The regression model has the following form: UNDi = α0 + α1O&Gi + α2MININGi + α3Ti + α4JCPi
+ α5Log(Proceeds)i+ α6MMi +α7PUi + εi where UNDi is the degree of underpricing of the stock i, O&G takes a value of 1 for oil andgas issues and zero otherwise, MINING takes a value of 1 for mining issues and zero otherwise, T takes a value of 1 for technologyissues and zero otherwise, JCP takes a value of 1 for junior capital pool issues and zero otherwise, MC is the market climate variablewhich takes a value of 1 for hot period and zero for cold period, PU takes a value of 1 for a participation of a prestigious underwriterin the IPO and 0 otherwise and Log denotes the natural logarithm. The proceed of the issue is used as a proxy for ex-ante uncertainty.The sample consists of 971 Canadian IPO’s by firms subsequently listed on the Toronto Stock Exchange, the Montreal Exchange, theVancouver Exchange and the Alberta Exchange, from January 1991 through December 1998. We included Junior Capital Pool IPOs.The degree of underpricing is measured as following : UND (1) : (mean closing price of the five first days of listing- offer price)/ offerprice, UND(2) : [(mean closing price of the five first days of listing – offer price)/ offer price] – [mean price of the TSE 300 index forthe five days of listing – TSE 300 index price when offer price is fixed)/ TSE 300 index price when offer price is fixed]. T-value arereported in parentheses. White’s consistent covariance matrix is used in estimating standard errors and all t-values are reported on anadjusted basis.
*significant at 1% level, **significant at 5% level and ***significant at 10% level.
Constant O&G T MINING JCP Log(proceeds)
Market PU NumberIPOs
R2 adjustedR2
F
UND(1) 1,86*
(3,71)
0,008
(0,14)
0,09
(0,60)
0,10
(0,67)
0,82*
(5,45)
-0,26*
(-3,63)
0,16***
(1,86)
-0,06
(-0,75)
971 0,1703
0,1762
28,8
UND(2) 1,92*
(3,51)
0,008
(0,04)
0,09
(0,55)
0,12
(0,71)
0,86*
(5,22)
-0,27*
(-3,47)
0,20**
(2,16)
-0,09
(-0,98)
971 0,1587
0,1648
27,1
Liste des publications au CIRANO*
Série Scientifique / Scientific Series (ISSN 1198-8177)
2001s-49 How Innovative Are Canadian Firms Compared to Some European Firms? AComparative Look at Innovation Surveys / Pierre Mohnen, Pierre Therrien
2001s-48 A Tale of Two Ports / Ngo Van Long et Kar-yiu Wong2001s-47 Wage Policy of Firms: An Empirical Investigation / Stéphanie Lluis2001s-46 Forecasting Some Low-Predictability Time Series Using Diffusion Indices / Marc
Brisson, Bryan Campbell et John W. Galbraith2001s-45 The Importance of the Loss Function in Option Pricing / Peter Christoffersen et
Kris Jacobs2001s-44 Let's Get "Real" about Using Economic Data / Peter Christoffersen, Eric Ghysels
et Norman R. Swanson2001s-43 Fragmentation, Outsourcing and the Service Sector / Ngo Van Long, Ray
Riezman et Antoine Soubeyran2001s-42 Nonlinear Features of Realized FX Volatility / John M. Maheu et Thomas H.
McCurdy2001s-41 Job Satisfaction and Quits: Theory and Evidence from the German
Socioeconomic Panel / Louis Lévy-Garboua, Claude Montmarquette et VéroniqueSimonnet
2001s-40 Logique et tests d'hypothèse : réflexions sur les problèmes mal posés enéconométrie / Jean-Marie Dufour
2001s-39 Managing IT Outsourcing Risk: Lessons Learned / Benoit A. Aubert, SuzanneRivard et Michel Patry
2001s-38 Organizational Design of R&D Activities / Stefan Ambec et Michel Poitevin2001s-37 Environmental Policy, Public Interest and Political Market / Georges A. Tanguay,
Paul Lanoie et Jérôme Moreau2001s-36 Wealth Distribution, Entrepreneurship and Intertemporal Trade / Sanjay Banerji et
Ngo Van Long2001s-35 Comparaison des politiques de rémunération en fonction des stratégies
organisationnelles / Michel Tremblay et Denis Chênevert2001s-34 Déterminants et efficacité des stratégies de rémunération : Une étude internationale
des entreprises à forte intensité technologique / Michel Tremblay, Denis Chênevertet Bruno Sire
2001s-33 La multiplicité des ancres de carrière chez les ingénieurs québécois: impacts surles cheminements et le succès de carrière / Yvon Martineau, Thierry Wils etMichel Tremblay
2001s-32 The Impact of Interface Quality on Trust in Web Retailers / Marie-Christine Roy,Olivier Dewit et Benoit A. Aubert
* Consultez la liste complète des publications du CIRANO et les publications elles-mêmes sur notre site Internet :
http://www.cirano.qc.ca/publication/documents.html