validation of a simple and robust liebermann–burchard...
TRANSCRIPT
Research ArticleValidation of a Simple and Robust Liebermann–Burchard Colorimetric Method for the Assay of Cholesterol in Selected Milk Products in Ghana
Joseph K. Adu ,1 Cedric D. K. Amengor ,2 Naomi Kabiri,3 Emmanuel Orman ,2 Stella Abla Gameli Patamia,1 and Bernice Korkor Okrah1
1 Department of Pharmaceutical Chemistry, Faculty of Pharmacy and Pharmaceutical Sciences, College of Health Sciences, Kwame Nkrumah University of Science and Technology (KNUST), Kumasi, Ghana
2Department of Pharmaceutical Chemistry, School of Pharmacy, University of Health and Allied Sciences (UHAS), Ho, Ghana3Department of Chemistry, College of Science, Kwame Nkrumah University of Science and Technology (KNUST), Kumasi, Ghana
Correspondence should be addressed to Joseph K. Adu; [email protected]
Received 3 June 2019; Accepted 12 August 2019; Published 13 October 2019
Academic Editor: Jaime Yanez
Copyright © 2019 Joseph K. Adu et al. is is an open access article distributed under the Creative Commons Attribution License, which permits unrestricted use, distribution, and reproduction in any medium, provided the original work is properly cited.
Cholesterol plays a key role in the synthesis of bile acids and steroid hormones in the human body. However, excessively high levels are usually implicated in cardiovascular diseases. For this reason, it is essential to monitor exposure to high levels of it in products meant for human consumption, and this calls for the need to develop analytical methods to detect them. e use of Liebermann–Burchard reaction in this study has been explored to develop a simple, reliable, and robust quantitative colorimetric method to assay cholesterol, and hence provide a good alternative to chromatographic methods. e developed method was validated and used to determine the contents of cholesterol in selected dairy products on the Kumasi Metropolis market. e method demonstrated a good linearity (�2 = 0.996) over concentration range of 0.01–0.08 mg/ml. It was also shown to be and robust. e limit of detection (LOD) and limit of quanti�cation (LOQ) were determined to be 0.00430 mg/ml and 0.01304 mg/ml, respectively. Ten selected brands of canned milk (B1–B5) and fresh yoghurt products (A1–A5) were then assayed using the developed method. e results showed that three products from each category had cholesterol contents above the allowable content of 5 mg/100 g in dairy products. e study thus has proposed a simple colorimetric method that can be adopted by dairy products manufacturing facilities to rapidly determine cholesterol contents during manufacturing in order to monitor the safe consumption of their products, and eliminate or minimize possible future health hazards.
1. Introduction
Phytosterols constitute an important class of natural prod-ucts that have been explored for their medicinal importance. Cholesterol, stigmasterol, and sitosterol are examples of phy-tosterols of which cholesterol is the most abundant in ani-mals. Cholesterol is mostly found in animal fat such as milk, eggs, and cheese whilst stigmasterol and sitosterol are ubiq-uitous in plants. Cholesterol, however, is a starting material for the biosynthesis of bile acids, steroid hormones, and Vitamin D, which are also precursors for vital biological functions [1–3]. Dairy product consumption has been a daily routine for most people in both developed and developing
nations usually as part of their diet. Milk consumption is associated with a reduced risk of noncommunicable diseases (NCDs) such as osteoporosis, colorectal cancer, and type 2 diabetes [4]. However, concern has been raised about possi-ble association between high diary consumption and cardi-ovascular related diseases because of their cholesterol contents [5–7].
Amidst fears of cholesterol being a silent killer and a back-bone for heart related diseases, there are high consumptions of milk and its products. e regulatory bodies together with the scienti�c community have, therefore, recommended the intake of lower fat dairy foods, to reduce the risks [8]. e intake of dairy products, thus, calls for close monitoring of
HindawiInternational Journal of Food ScienceVolume 2019, Article ID 9045938, 7 pageshttps://doi.org/10.1155/2019/9045938
International Journal of Food Science2
their cholesterol levels to safeguard the health of the consum-ers. It is important then to screen and regulate the cholesterol content of dairy products on the market.
For some time now, a nonenzymatic HPLC method has been the routine and widely used analytical method for cho-lesterol detection and quanti�cation in milk products [9]. Gas chromatographic methods as well have found use in its assay [1, 10, 11]. Preferably, using relatively simple, inexpensive, and readily available analytical methods will help achieve the same objective, especially in the developing countries; for the rou-tine quality assessments of dairy products.
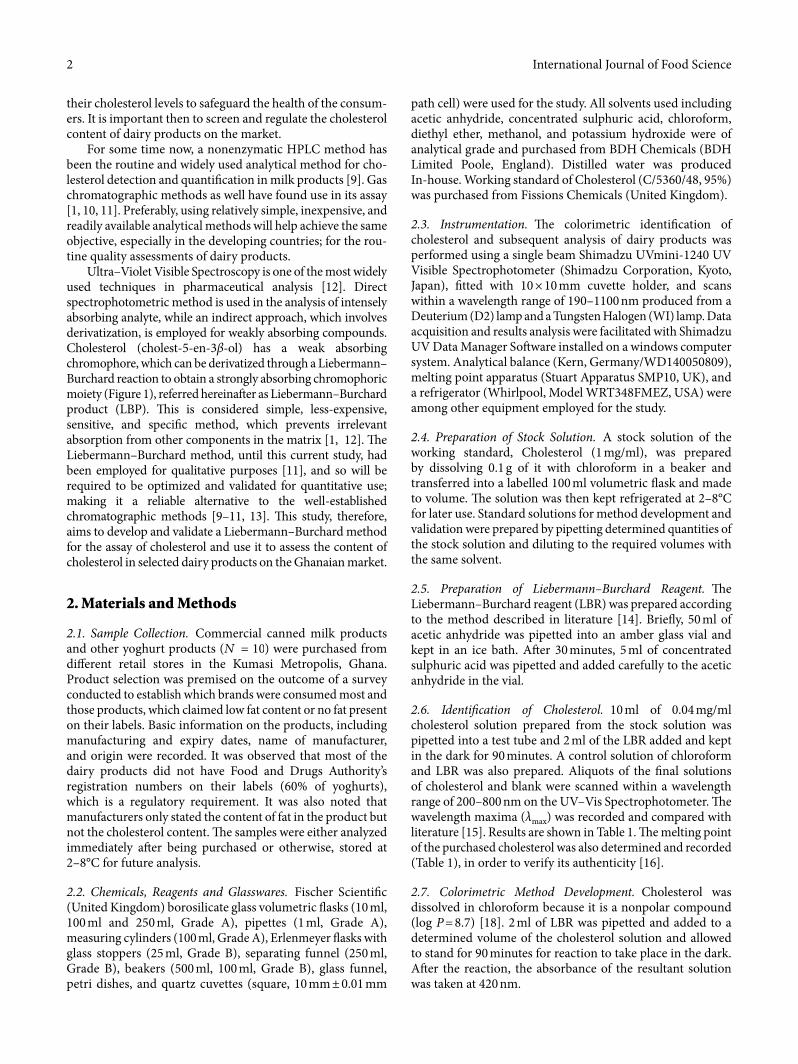
Ultra–Violet Visible Spectroscopy is one of the most widely used techniques in pharmaceutical analysis [12]. Direct spectrophotometric method is used in the analysis of intensely absorbing analyte, while an indirect approach, which involves derivatization, is employed for weakly absorbing compounds. Cholesterol (cholest-5-en-3β-ol) has a weak absorbing chromophore, which can be derivatized through a Liebermann–Burchard reaction to obtain a strongly absorbing chromophoric moiety (Figure 1), referred hereina¨er as Liebermann–Burchard product (LBP). is is considered simple, less-expensive, sensitive, and speci�c method, which prevents irrelevant absorption from other components in the matrix [1, 12]. e Liebermann–Burchard method, until this current study, had been employed for qualitative purposes [11], and so will be required to be optimized and validated for quantitative use; making it a reliable alternative to the well-established chromatographic methods [9–11, 13]. is study, therefore, aims to develop and validate a Liebermann–Burchard method for the assay of cholesterol and use it to assess the content of cholesterol in selected dairy products on the Ghanaian market.
2. Materials and Methods
2.1. Sample Collection. Commercial canned milk products and other yoghurt products (� = 10) were purchased from di©erent retail stores in the Kumasi Metropolis, Ghana. Product selection was premised on the outcome of a survey conducted to establish which brands were consumed most and those products, which claimed low fat content or no fat present on their labels. Basic information on the products, including manufacturing and expiry dates, name of manufacturer, and origin were recorded. It was observed that most of the dairy products did not have Food and Drugs Authority’s registration numbers on their labels (60% of yoghurts), which is a regulatory requirement. It was also noted that manufacturers only stated the content of fat in the product but not the cholesterol content. e samples were either analyzed immediately a¨er being purchased or otherwise, stored at 2–8°C for future analysis.
2.2. Chemicals, Reagents and Glasswares. Fischer Scienti�c (United Kingdom) borosilicate glass volumetric ̄ asks (10 ml, 100 ml and 250 ml, Grade A), pipettes (1 ml, Grade A), measuring cylinders (100 ml, Grade A), Erlenmeyer ̄ asks with glass stoppers (25 ml, Grade B), separating funnel (250 ml, Grade B), beakers (500 ml, 100 ml, Grade B), glass funnel, petri dishes, and quartz cuvettes (square, 10 mm ± 0.01 mm
path cell) were used for the study. All solvents used including acetic anhydride, concentrated sulphuric acid, chloroform, diethyl ether, methanol, and potassium hydroxide were of analytical grade and purchased from BDH Chemicals (BDH Limited Poole, England). Distilled water was produced In-house. Working standard of Cholesterol (C/5360/48, 95%) was purchased from Fissions Chemicals (United Kingdom).
2.3. Instrumentation. e colorimetric identi�cation of cholesterol and subsequent analysis of dairy products was performed using a single beam Shimadzu UVmini-1240 UV Visible Spectrophotometer (Shimadzu Corporation, Kyoto, Japan), �tted with 10 × 10 mm cuvette holder, and scans within a wavelength range of 190–1100 nm produced from a Deuterium (D2) lamp and a Tungsten Halogen (WI) lamp. Data acquisition and results analysis were facilitated with Shimadzu UV Data Manager So¨ware installed on a windows computer system. Analytical balance (Kern, Germany/WD140050809), melting point apparatus (Stuart Apparatus SMP10, UK), and a refrigerator (Whirlpool, Model WRT348FMEZ, USA) were among other equipment employed for the study.
2.4. Preparation of Stock Solution. A stock solution of the working standard, Cholesterol (1 mg/ml), was prepared by dissolving 0.1 g of it with chloroform in a beaker and transferred into a labelled 100 ml volumetric ¯ask and made to volume. e solution was then kept refrigerated at 2–8°C for later use. Standard solutions for method development and validation were prepared by pipetting determined quantities of the stock solution and diluting to the required volumes with the same solvent.
2.5. Preparation of Liebermann–Burchard Reagent. e Liebermann–Burchard reagent (LBR) was prepared according to the method described in literature [14]. Brie¯y, 50 ml of acetic anhydride was pipetted into an amber glass vial and kept in an ice bath. A¨er 30 minutes, 5 ml of concentrated sulphuric acid was pipetted and added carefully to the acetic anhydride in the vial.
2.6. Identi�cation of Cholesterol. 10 ml of 0.04 mg/ml cholesterol solution prepared from the stock solution was pipetted into a test tube and 2 ml of the LBR added and kept in the dark for 90 minutes. A control solution of chloroform and LBR was also prepared. Aliquots of the �nal solutions of cholesterol and blank were scanned within a wavelength range of 200–800 nm on the UV–Vis Spectrophotometer. e wavelength maxima (λmax) was recorded and compared with literature [15]. Results are shown in Table 1. e melting point of the purchased cholesterol was also determined and recorded (Table 1), in order to verify its authenticity [16].
2.7. Colorimetric Method Development. Cholesterol was dissolved in chloroform because it is a nonpolar compound (log P = 8.7) [18]. 2 ml of LBR was pipetted and added to a determined volume of the cholesterol solution and allowed to stand for 90 minutes for reaction to take place in the dark. A¨er the reaction, the absorbance of the resultant solution was taken at 420 nm.
3International Journal of Food Science
For the dairy products, a determined aliquot of the prod-uct was pipetted, saponi�ed with 10% methanolic potassium hydroxide and separated in a solvent-solvent extraction with diethyl ether : water (5 : 2). e ethereal fraction, containing the cholesterol was then carried through the above-described procedure. e cholesterol content was estimated upon gen-erating a linear calibration model from standard solutions of the working standard and inserting recorded absorbances of the samples into such model.
2.8. Analytical Method Validation
e developed method was validated in accordance with recommendations from the ICH guidelines [19], for speci�city, precision, linearity and range, and robustness, and stability of the sample solutions.
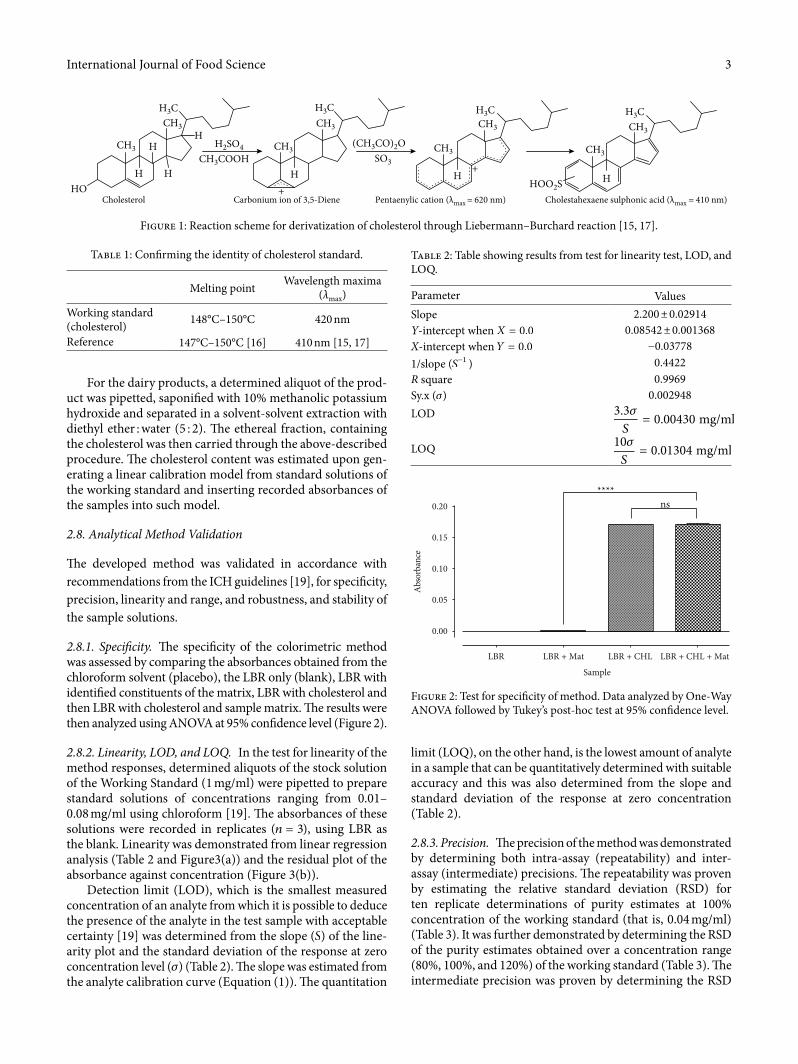
2.8.1. Speci�city. e speci�city of the colorimetric method was assessed by comparing the absorbances obtained from the chloroform solvent (placebo), the LBR only (blank), LBR with identi�ed constituents of the matrix, LBR with cholesterol and then LBR with cholesterol and sample matrix. e results were then analyzed using ANOVA at 95% con�dence level (Figure 2).
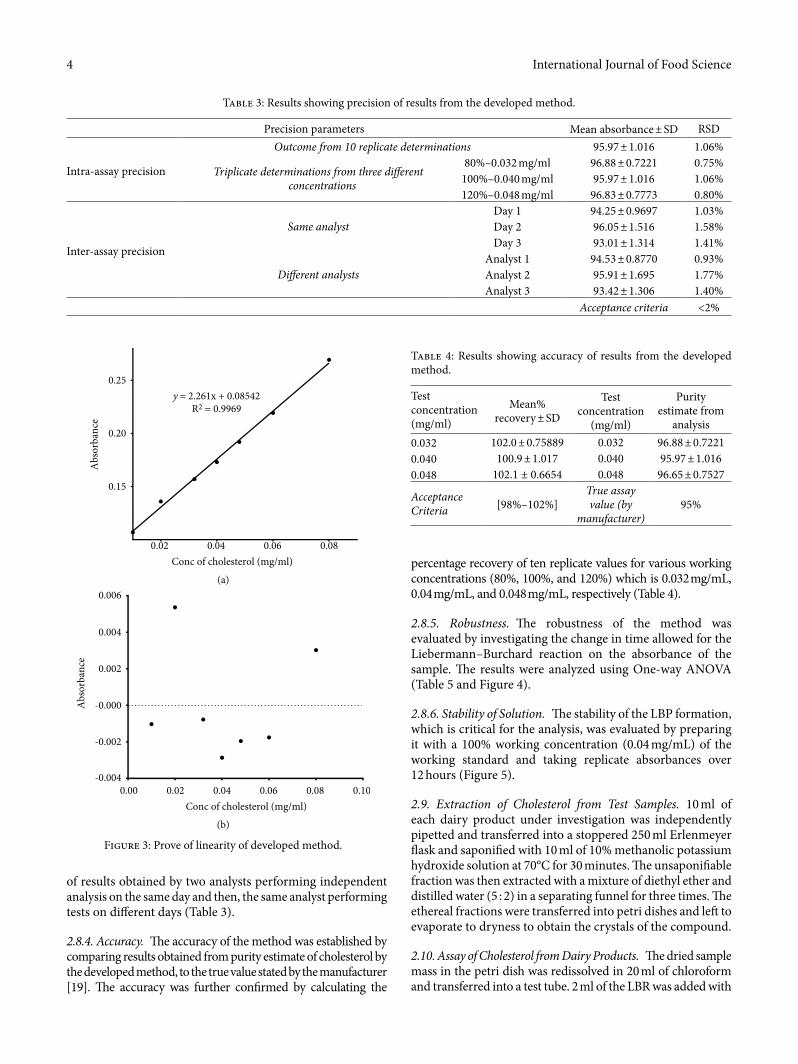
2.8.2. Linearity, LOD, and LOQ. In the test for linearity of the method responses, determined aliquots of the stock solution of the Working Standard (1 mg/ml) were pipetted to prepare standard solutions of concentrations ranging from 0.01–0.08 mg/ml using chloroform [19]. e absorbances of these solutions were recorded in replicates (� = 3), using LBR as the blank. Linearity was demonstrated from linear regression analysis (Table 2 and Figure3(a)) and the residual plot of the absorbance against concentration (Figure 3(b)).
Detection limit (LOD), which is the smallest measured concentration of an analyte from which it is possible to deduce the presence of the analyte in the test sample with acceptable certainty [19] was determined from the slope (�) of the line-arity plot and the standard deviation of the response at zero concentration level (�) (Table 2). e slope was estimated from the analyte calibration curve (Equation (1)). e quantitation
limit (LOQ), on the other hand, is the lowest amount of analyte in a sample that can be quantitatively determined with suitable accuracy and this was also determined from the slope and standard deviation of the response at zero concentration (Table 2).
2.8.3. Precision. e precision of the method was demonstrated by determining both intra-assay (repeatability) and inter-assay (intermediate) precisions. e repeatability was proven by estimating the relative standard deviation (RSD) for ten replicate determinations of purity estimates at 100% concentration of the working standard (that is, 0.04 mg/ml) (Table 3). It was further demonstrated by determining the RSD of the purity estimates obtained over a concentration range (80%, 100%, and 120%) of the working standard (Table 3). e intermediate precision was proven by determining the RSD
Table 1: Con�rming the identity of cholesterol standard.
Melting point Wavelength maxima (λmax)
Working standard (cholesterol) 148°C–150°C 420 nm
Reference 147°C–150°C [16] 410 nm [15, 17]
Table 2: Table showing results from test for linearity test, LOD, and LOQ.
Parameter ValuesSlope 2.200 ± 0.02914Y-intercept when � = 0.0 0.08542 ± 0.001368X-intercept when � = 0.0 −0.037781/slope (�−1 ) 0.4422� square 0.9969Sy.x (�) 0.002948LOD 3.3�
� = 0.00430 mg/ml
LOQ 10�� = 0.01304 mg/ml
Cholesterol Carbonium ion of 3,5-Diene Pentaenylic cation (λmax = 620 nm) Cholestahexaene sulphonic acid (λmax = 410 nm)HO
H H H H H+
+
HH2SO4HCH3
CH3
CH3
CH3
CH3
CH3 CH3
CH3SO3
HOO2S
H3C H3C H3C H3C
CH3COOH(CH3CO)2O
Figure 1: Reaction scheme for derivatization of cholesterol through Liebermann–Burchard reaction [15, 17].
Abs
orba
nce
Sample
LBR LBR + Mat LBR + CHL LBR + CHL + Mat
0.00
0.05
0.10
0.15
0.20 ns****
Figure 2: Test for speci�city of method. Data analyzed by One-Way ANOVA followed by Tukey’s post-hoc test at 95% con�dence level.
International Journal of Food Science4
percentage recovery of ten replicate values for various working concentrations (80%, 100%, and 120%) which is 0.032 mg/mL, 0.04 mg/mL, and 0.048 mg/mL, respectively (Table 4).
2.8.5. Robustness. e robustness of the method was evaluated by investigating the change in time allowed for the Liebermann–Burchard reaction on the absorbance of the sample. e results were analyzed using One-way ANOVA (Table 5 and Figure 4).
2.8.6. Stability of Solution. e stability of the LBP formation, which is critical for the analysis, was evaluated by preparing it with a 100% working concentration (0.04 mg/mL) of the working standard and taking replicate absorbances over 12 hours (Figure 5).
2.9. Extraction of Cholesterol from Test Samples. 10 ml of each dairy product under investigation was independently pipetted and transferred into a stoppered 250 ml Erlenmeyer ¯ask and saponi�ed with 10 ml of 10% methanolic potassium hydroxide solution at 70°C for 30 minutes. e unsaponi�able fraction was then extracted with a mixture of diethyl ether and distilled water (5 : 2) in a separating funnel for three times. e ethereal fractions were transferred into petri dishes and le¨ to evaporate to dryness to obtain the crystals of the compound.
2.10. Assay of Cholesterol from Dairy Products. e dried sample mass in the petri dish was redissolved in 20 ml of chloroform and transferred into a test tube. 2 ml of the LBR was added with
of results obtained by two analysts performing independent analysis on the same day and then, the same analyst performing tests on di©erent days (Table 3).
2.8.4. Accuracy. e accuracy of the method was established by comparing results obtained from purity estimate of cholesterol by the developed method, to the true value stated by the manufacturer [19]. e accuracy was further con�rmed by calculating the
Table 3: Results showing precision of results from the developed method.
Precision parameters Mean absorbance ± SD RSD
Intra-assay precision
Outcome from 10 replicate determinations 95.97 ± 1.016 1.06%
Triplicate determinations from three di�erent concentrations
80%–0.032 mg/ml 96.88 ± 0.7221 0.75%100%–0.040 mg/ml 95.97 ± 1.016 1.06%120%–0.048 mg/ml 96.83 ± 0.7773 0.80%
Inter-assay precision
Same analystDay 1 94.25 ± 0.9697 1.03%Day 2 96.05 ± 1.516 1.58%Day 3 93.01 ± 1.314 1.41%
Di�erent analystsAnalyst 1 94.53 ± 0.8770 0.93%Analyst 2 95.91 ± 1.695 1.77%Analyst 3 93.42 ± 1.306 1.40%
Acceptance criteria <2%
0.15
0.02 0.04Conc of cholesterol (mg/ml)
0.06
y = 2.261x + 0.08542R2 = 0.9969
0.08
0.20
Abs
orba
nce
0.25
0.00-0.004
-0.002
-0.000
0.002
0.004
0.006
0.02 0.04 0.06 0.08 0.10Conc of cholesterol (mg/ml)
Abs
orba
nce
Figure 3: Prove of linearity of developed method.
(b)
(a)
Table 4: Results showing accuracy of results from the developed method.
Test concentration (mg/ml)
Mean% recovery ± SD
Test concentration
(mg/ml)
Purity estimate from
analysis0.032 102.0 ± 0.75889 0.032 96.88 ± 0.72210.040 100.9 ± 1.017 0.040 95.97 ± 1.0160.048 102.1 ± 0.6654 0.048 96.65 ± 0.7527
Acceptance Criteria [98%–102%]
True assay value (by
manufacturer)95%

5International Journal of Food Science
also analyzed inferentially, using One-Way ANOVA (at 95% con�dence level) to determine statistical di©erences in results generated. Results from the cholesterol assay in the sampled dairy products were also expressed Mean ± SD, and tested for statistical di©erence using Student t-test and One-Way ANOVA at 95% con�dence level from SPSS Statistics (IBM Corporation, version 20, 2011).
3. Results and Discussion
3.1. Principle of the Colorimetric Assay. e colorimetric method developed for the assay of cholesterol in the dairy products was based on the ability of cholesterol, a weakly UV absorbing compound, to be derivatized into a strongly absorbing moiety at a wavelength (λmax) of approximately 420 nm [15] (Figure 1), void of sample matrix interferences in a reaction known as the Liebermann–Burchard Reaction [20]. Cholesterol, which was identi�ed accordingly (Table 1), in the presence of concentrated sulphuric acid and acetic anhydride, was oxidized to a conjugated pentaene known as cholestapolyene carbonium ion [15, 21] and this undergoes further reaction to form cholestahexaene sulphonic acid, with wavelength of absorption (λmax) of 410 nm [15, 17] (Figure 1). LBR, containing acetic anhydride and concentrated sulphuric acid, provided the necessary conditions for the reaction to proceed. e quantitative conversion of all cholesterol to LBP provided the basis for the colorimetric estimation of its content. In the dairy products, however, saponi�cation was carried out to convert all cholesteryl esters and glycosides to free cholesterol, which was then extracted into the ethereal fraction in the solvent-solvent extraction.
3.2. Validation of Developed Colorimetric Method. e developed method was showed to be speci�c towards cholesterol (Figure 2). In addition, it was observed that the absorbance of LBP from a reaction of cholesterol and LBR was signi�cantly di©erent from that of LBR, sample matrix and chloroform (�(3, 16) = 72033; � < 0.0001 ; � = 483.1 ; � = 5). e sample matrix was shown not to contribute signi�cantly to the absorbance (� = 1.697). e method has been demonstrated to have a suitable level of precision (Table 3), accuracy (Table 4), and linearity within a concentration range of 0.01–0.08 mg/ml, with an LOD of 0.00430 mg/ml and LOQ of 0.01304 mg/ml (Figure 3 and Table 2). It was also robust (Figure 4 and Table 5). e LBP was shown to be stable within 6 hours of preparation (Figure 5). is indicated that, the prepared solution is recommended to be used within 6 hours of preparation.
3.3. Analysis of Dairy Products. e results from the experiment show that all the samples contained sterols, particularly, cholesterol, as they all reacted with LBR to
shaking. e reaction was allowed to proceed for 90 minutes, with a dark green colouration indicating its completion. A blank solution of 20 ml of chloroform was kept for the determination. Triplicate absorbances of test and blank solutions were recorded and used to estimate the content of cholesterol. is procedure was repeated for all sampled dairy products.
2.11. Statistical Analysis. e results from the study were analyzed using GraphPad Prism 6 for Windows (Version 6.01, GraphPad So¨ware, 2012). Test results were expressed as Mean ± SD and relative standard deviations (RSD), and
Table 5: Robustness of developed method at di©erent times for Liebermann–Burchard reaction.
0.5 h 1 h 4 h 6 hMean Absorbance ± SD 0.1551 ± 0.0007379 0.1555 ± 0.0005270 0.1549 ± 0.0008756 0.1548 ± 0.0007888RSD 0.48% 0.34% 0.57% 0.51%One-way ANOVA �(3,36) = 1.734; � = 0.1775
0.157
0.155
0.156
0.154
0.1530.5 h 1 h 4 h 6 h
Time allowed for colour formation (h)
Mea
n ab
sorb
ance
Figure 4: Box plot to illustrate robustness of developed method.
Reaction time (h)0 5 10
160
140
120
Lower limit
Upper limit
Ass
ay
80
Figure 5: Stability pro�le of Fresh LBP prepared with 0.04 mg/ml of cholesterol as studied over 12 hours.
International Journal of Food Science6
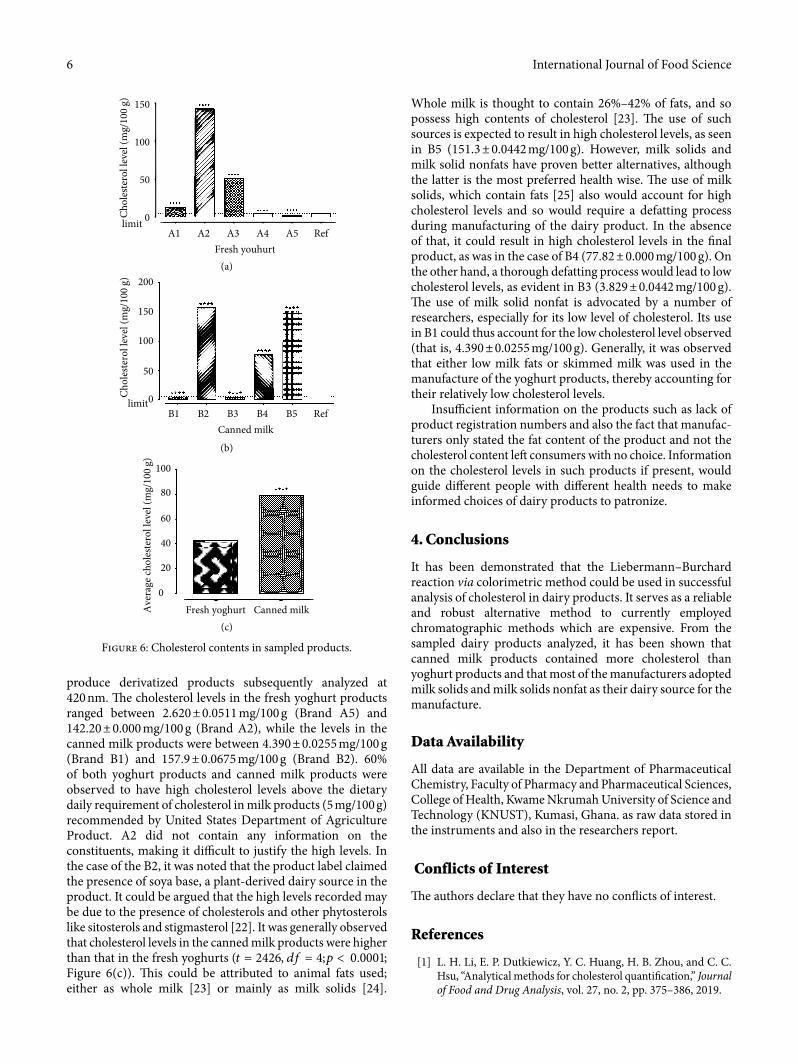
Whole milk is thought to contain 26%–42% of fats, and so possess high contents of cholesterol [23]. e use of such sources is expected to result in high cholesterol levels, as seen in B5 (151.3 ± 0.0442 mg/100 g). However, milk solids and milk solid nonfats have proven better alternatives, although the latter is the most preferred health wise. e use of milk solids, which contain fats [25] also would account for high cholesterol levels and so would require a defatting process during manufacturing of the dairy product. In the absence of that, it could result in high cholesterol levels in the �nal product, as was in the case of B4 (77.82 ± 0.000 mg/100 g). On the other hand, a thorough defatting process would lead to low cholesterol levels, as evident in B3 (3.829 ± 0.0442 mg/100 g). e use of milk solid nonfat is advocated by a number of researchers, especially for its low level of cholesterol. Its use in B1 could thus account for the low cholesterol level observed (that is, 4.390 ± 0.0255 mg/100 g). Generally, it was observed that either low milk fats or skimmed milk was used in the manufacture of the yoghurt products, thereby accounting for their relatively low cholesterol levels.
InsuÁcient information on the products such as lack of product registration numbers and also the fact that manufac-turers only stated the fat content of the product and not the cholesterol content le¨ consumers with no choice. Information on the cholesterol levels in such products if present, would guide di©erent people with di©erent health needs to make informed choices of dairy products to patronize.
4. Conclusions
It has been demonstrated that the Liebermann–Burchard reaction via colorimetric method could be used in successful analysis of cholesterol in dairy products. It serves as a reliable and robust alternative method to currently employed chromatographic methods which are expensive. From the sampled dairy products analyzed, it has been shown that canned milk products contained more cholesterol than yoghurt products and that most of the manufacturers adopted milk solids and milk solids nonfat as their dairy source for the manufacture.
Data Availability
All data are available in the Department of Pharmaceutical Chemistry, Faculty of Pharmacy and Pharmaceutical Sciences, College of Health, Kwame Nkrumah University of Science and Technology (KNUST), Kumasi, Ghana. as raw data stored in the instruments and also in the researchers report.
Conflicts of Interest
e authors declare that they have no con¯icts of interest.
References
[1] L. H. Li, E. P. Dutkiewicz, Y. C. Huang, H. B. Zhou, and C. C. Hsu, “Analytical methods for cholesterol quanti�cation,” Journal of Food and Drug Analysis, vol. 27, no. 2, pp. 375–386, 2019.
produce derivatized products subsequently analyzed at 420 nm. e cholesterol levels in the fresh yoghurt products ranged between 2.620 ± 0.0511 mg/100 g (Brand A5) and 142.20 ± 0.000 mg/100 g (Brand A2), while the levels in the canned milk products were between 4.390 ± 0.0255 mg/100 g (Brand B1) and 157.9 ± 0.0675 mg/100 g (Brand B2). 60% of both yoghurt products and canned milk products were observed to have high cholesterol levels above the dietary daily requirement of cholesterol in milk products (5 mg/100 g) recommended by United States Department of Agriculture Product. A2 did not contain any information on the constituents, making it diÁcult to justify the high levels. In the case of the B2, it was noted that the product label claimed the presence of soya base, a plant-derived dairy source in the product. It could be argued that the high levels recorded may be due to the presence of cholesterols and other phytosterols like sitosterols and stigmasterol [22]. It was generally observed that cholesterol levels in the canned milk products were higher than that in the fresh yoghurts (� = 2426, �� = 4;� < 0.0001; Figure 6(c)). is could be attributed to animal fats used; either as whole milk [23] or mainly as milk solids [24].
A1 A2 A3Fresh youhurt
A4 A5 Reflimit
Cho
lest
erol
leve
l (m
g/10
0 g)
0
50
100
150
B1limit
Cho
lest
erol
leve
l (m
g/10
0 g)
0
50
100
150
200
B2 B3Canned milk
B4 B5 Ref
Ave
rage
chol
este
rol l
evel
(mg/
100
g)
0
20
40
60
80
100
Fresh yoghurt Canned milk
Figure 6: Cholesterol contents in sampled products.
(a)
(b)
(c)
7International Journal of Food Science
[20] Q. Xiong, W. K. Wilson, J. Pang, “�e Liebermann–burchard reaction: sulfonation, desaturation, and rearrangment of cholesterol in acid,” pp. 87–96, 2007.
[21] C.-H. Brieskorn and H. Herrig, “�e chemical activity of color reactions according to liebermann-burchard in sterols and triterpenes as well as in their esters,” Mitteilungen Deutsche Pharmazeutische Gesellscha�, vol. 29, pp. 485–496, 1959.
[22] J. L. Weihrauch and J. M. Gardner, “Sterol content of foods of plant origin,” Journal of American Dietic Association, vol. 73, no. 1, pp. 39–47, 1978.
[23] A. Y. Tamime and R. K. Robinson, Tamime and Robinson’s yoghurt: science and technology, CRC, 2007.
[24] V. V. Mistry and H. N. Hassan, “Manufacture of nonfat yogurt from a high milk protein powder,” Journal of Dairy Science, vol. 75, no. 4, pp. 947–957, 1992.
[25] A. Puvanenthiran, R. P. Williams, and M. Augustin, “Structure and visco-elastic properties of set yoghurt with altered casein to whey protein ratios,” International Dairy Journal, vol. 12, no. 4, pp. 383–391, 2002.
[2] J. L. Boyer, “Bile formation and secretion,” Comprehensive Physiology, vol. 3, no. 3, pp. 1035–1078, 2013.
[3] P. A. S. Alphonse and P. J. H. Jones, “Revisiting human cholesterol synthesis and absorption: the reciprocity paradigm and its key regulators,” Lipids, vol. 51, no. 5, pp. 519–536, 2016.
[4] J. M. Nunes and E. Pretorius, “Red blood cell membrane cholesterol in type 2 diabetes mellitus,” �rombosis Research, vol. 178, pp. 91–98, 2019.
[5] L. Fernández-Friera, V. Fuster, B. López-Melgar et al., “Normal LDL-cholesterol levels are associated with subclinical atherosclerosis in the absence of risk factors,” Journal of the American College of Cardiology, vol. 70, no. 24, pp. 2979–2991, 2017.
[6] S. Xu, Z. Liu, and P. Liu, “HDL cholesterol in cardiovascular diseases: the good, the bad, and the ugly?,” International Journal of Cardiology, vol. 168, no. 4, pp. 3157–3159, 2013.
[7] R. B. Shekelle, A. M.M. Shryock, O. Paul et al., “Diet, serum cholesterol, and death from coronary heart disease,” New England Journal of Medicine, vol. 304, no. 2, pp. 65–70, 1981.
[8] T. Scior, A. Bender, G. Tresadern et al., “Recognizing pitfalls in virtual screening: a critical review,” Journal of Chemical Information and Modeling, vol. 52, no. 4, pp. 867–881, 2012.
[9] H. I. Oh, T. S. Shin, and E. J. Chang, “Determination of cholesterol in milk and dairy products by high-performance liquid chromatography,” Asian-Australasian Journal of Animal Sciences, vol. 14, no. 10, pp. 1465–1469, 2001.
[10] M. Beggio, C. Cruz-Hernandez, P.-A. Golay, L. Y. Lee, and F. Giuffrida, “Quantification of total cholesterol in human milk by gas chromatography,” Journal of Separation Science, vol. 41, no. 8, pp. 1805–1811, 2018.
[11] K. Lian, P. Zhang, W. Wang, T. Dai, and L. Li, “Determination of total cholesterol in serum by gas chromatography-mass spectrometry,” Asian Journal of Chemistry, vol. 26, no. 9, pp. 2646–2648, 2014.
[12] A. H. Stenlake and J. B. Beckett, Practical Pharmaceutical Chemistry: Part II, �e Athlone Press, London, 4th edition, 1988.
[13] D. M. Amundson and M. Zhou, “Fluorometric method for the enzymatic determination of cholesterol,” Journal of Biochemical and Biophysical Methods, vol. 38, no. 1, pp. 43–52, 1999.
[14] A. P. Kenny, “�e determination of cholesterol by the liebermann-burchard reaction,” Biochemical Journal, vol. 52, no. 4, pp. 611–619, 1952.
[15] B. I. Diamondstone, R. A. Velapoldi, R. W. Burke, and O. Menis, “Mechanisms of the liebermann-burchard and zak color reactions for cholesterol,” Clinical Chemistry, vol. 20, no. 7, pp. 794–801, 1974.
[16] B. P, “Cholesterol”, in British Pharmacopoeia, British Pharmacopoeia Commission. �e Stationary Office, London, UK, 2013.
[17] T. S. Sorensen, “�e preparation and reactions of a homologus series of aliphatic polyenylic cations,” Journal of the American Chemical Society, vol. 87, pp. 5075–5084, 1965.
[18] E. G. C. Clarke, Clarke’s Analysis of Drugs and Poisons. In Pharmaceuticals, Body Fluids, and Postmortem Material, vol. 2, Pharmaceutical Press, London, 4th edition, 2011.
[19] ICH, “Validation of analytical procedures: text and methodology Q2 (R1),” in International Conference on Harmonization 1997.

Hindawiwww.hindawi.com
International Journal of
Volume 2018
Zoology
Hindawiwww.hindawi.com Volume 2018
Anatomy Research International
PeptidesInternational Journal of
Hindawiwww.hindawi.com Volume 2018
Hindawiwww.hindawi.com Volume 2018
Journal of Parasitology Research
GenomicsInternational Journal of
Hindawiwww.hindawi.com Volume 2018
Hindawi Publishing Corporation http://www.hindawi.com Volume 2013Hindawiwww.hindawi.com
The Scientific World Journal
Volume 2018
Hindawiwww.hindawi.com Volume 2018
BioinformaticsAdvances in
Marine BiologyJournal of
Hindawiwww.hindawi.com Volume 2018
Hindawiwww.hindawi.com Volume 2018
Neuroscience Journal
Hindawiwww.hindawi.com Volume 2018
BioMed Research International
Cell BiologyInternational Journal of
Hindawiwww.hindawi.com Volume 2018
Hindawiwww.hindawi.com Volume 2018
Biochemistry Research International
ArchaeaHindawiwww.hindawi.com Volume 2018
Hindawiwww.hindawi.com Volume 2018
Genetics Research International
Hindawiwww.hindawi.com Volume 2018
Advances in
Virolog y Stem Cells International
Hindawiwww.hindawi.com Volume 2018
Hindawiwww.hindawi.com Volume 2018
Enzyme Research
Hindawiwww.hindawi.com Volume 2018
International Journal of
MicrobiologyHindawiwww.hindawi.com
Nucleic AcidsJournal of
Volume 2018
Submit your manuscripts atwww.hindawi.com