validation and standardisation of a two dimensional motion ...clok.uclan.ac.uk/7809/1/charlotte...
TRANSCRIPT

Validation and standardisation of a two dimensional motion analysis technique to measure normal
conformation and gait in Arabian horses.
Charlotte Robin B.Sc. (Hons)
A thesis submitted in partial fi.ilfilment for the requirements for the degree of M.Sc. by Research at the University of Central Lancashire in collaboration with Myerscough
College.
December 2009
• ) I L/
I /5

AV
uclan University of Central Lancashire
Student Declaration
Concurrent registration for two or more academic awards
*1 declare that while registered as a candidate for the research degree, I have not been a registered candidate or enrolled student for another award of the University or other academic or professional institution.
Material submitted for another award
*1 declare that no material contained in the thesis has been used in any other submission for an academic award and is solely my own work.
Collaboration
Where a candidate's research programme is part of a collaborative project, the thesis must indicate in addition clearly the candidate's individual contribution and the extent of the collaboration. Please state below:
Signature of Candidate C -
Type of Award M.Sc. (by research)
School School of Psychology

Abstract
The development of standardised two dimensional motion analysis techniques to obtain
baseline measures would provide the equine industry with a consistent method for
analysing equine conformation and gait. The use of these methods to define breed
specific conformation and gait could be utilised by the industry for conformation and
gait assessment. This study focussed on validating and standardising such methods to
define normal conformation and gait for the Arabian horse. Validation involved
comparing the accuracy of two 2D motion analysis software programmes; Quintic© and
HUMANTh. Static and dynamic linear and angular validation was performed by
comparing known values to values calculated by the software programmes. Higher
variation was established for Quintic ° measurements; the margin of error was up to
20mm for static measurements and 3.36° for angular measurements. When using
Quintic©, angles of different size were measured with varying amounts of accuracy;
these differences were significant (P<0.001). The pattern of these differences was
similar to a sine wave. It was concluded that Quintic ° was not compatible with a normal
video camera recording at a 4:3 aspect ratio which may have related to calibration or
angle measurement algorithms. HUMANTh was used for all further analysis due to the
smaller margin of error established during validation. Intra-horse variation in
conformation and stride characteristics (stride length and RUM) were measured in a
group of three horses over five consecutive days. Stride length was consistently longer
on day one than subsequent days for all horses (P<0.001), and positively correlated to
velocity. Variation in stride length between days varied for each horse; some horses had
more stable gait characteristics than others. Little variation was established for RUM
data between days; few joints demonstrated RUM that was significantly different
between days for individual horses. Providing stance of the horse, marker placement
and velocity are closely regulated, baseline data can be obtained on one occasion. The
standardised method previously validated was used to define normal gait for Arabian
horses. Conformation and stride characteristics were assessed for a group of six
purebred Arabian horses (mean age 27± 10.56 months). There was no significant
difference in RUM between any of the horses measured (P>0.05); the horses had breed-
specific gait patterns which allowed normal gait to be defined for a distinct breed. A
database of normal gait for the Arabian horse was created for use by Arab horse owners
or breeders in the UK.

Contents
Contents
Declaration .
Abstract ...................................................................................................................... ii
Contents ..................................................................................................................... iii
Listof figures............................................................................................................. ix
Listof tables............................................................................................................... xi
Acknowledgements................................................................................................... xiii
Chapter One: Literature Review
1
1.0 Introduction ............................................ 1
1.1 Evaluating conformation ....................... 2
1.1.1 Conformation and performance
4
1.1.2 Conformation and soundness.... 5
1.2 Evaluating gait ........................................ 6
1.2.1 Gait analysis techniques............ 6
1.3 Two-dimensional motion analysis ........ 7
1.3.1 Marker placem en!..................... 7
1.12 Soft tissue artefact..................... 8
1.3.3 Repeated measures.................... 9
1.4 Variation in equine gait ......................... 10
1 .5 Breed ........................................................ 12
1.6 Age .......................................................... 13
1 .7 Velocity .................................................... 14
1.8 Validation ................................................ 14
1.8 1 Static linear validation.............. 16
1. & 2 Static angular validation .......... 16
1.8.3 Dynamic validation .................. 17

Contents
Part 1: Validation
Chapter Two: Aims and Objectives........................................................................ 21
2.0 Aim....................................................................................................................... 21
2.1 Objectives............................................................................................................ 21
2.2 Null hypothesis.................................................................................................... 21
Chapter Three: Methods.......................................................................................... 22
3.0 Instrumentation ....................................... ........................................................... 22
3.1 Data smoothing................................................................................................... 22
3.2 Linear accuracy.................................................................................................. 23
3.3 Angular accuracy ....................................... ......................................................... 24
3.4 Dynamic accuracy............................................................................................... 25
3.5 Statistical analysis............................................................................................... 26
ChapterFour: Results............................................................................................... 27
4.0 Linear validation ............................................... ................................................... 27
4.0.1 Comparison of Quintic© and HUMANFM 27
4.0.2 Effect of true distance, orientation and software .................................... 30
4.1 Angular validation............................................................................................... 31
4.1.1 Comparison between Quintic ° and HU-M-AN ................................... 31
4.1.2 Effect of true angle, orientation, software .............................................. 33
4.1.3 Further analysis of Quintic° ................................................................... 35
4.2 Dynamic validation.............................................................................................. 36
4.2.1 Dynamic angular validation................................................................... 36
4.2.2 Dynamic linear validation...................................................................... 37
4.2.3 Velocity................................................................................................... 38
4.3 Summary.............................................................................................................. 39
Chapter Five: Discussion ...................................... .................................................. 40
iv

Contents
Part 11: Standardisation
Chapter Six: Aims and Objectives.................................. 47
6.0 Aim............................................................................... 47
6.1 Objectives.................................................................... 47
6.2 Null hypothesis............................................................ 47
Chapter Seven: Methods..............................................
7.0 Subjects....................................................................
7.1 Instrumentation.......................................................
7.2 Anatomical markers...............................................
7.2.1 Dynamic and static marker sets.................
7.3 Filming procedure...................................................
7.3. 1 Conformation assessment...........................
7.3.2 Stride length and range of motion.............
7.4 Analysis of videos...................................................
7.41 Scale and aspect ratio................................
7.4. 1 Digitisation................................................
74.3 Data smoothing..........................................
7.5 Statistical analysis...................................................
ChapterEight: Results ....................... ...................................................................... 56
8.0 Intra-horse variation .......................................................................................... 56
8.1 Variation in conformation.................................................................................. 56
8.2 Investigating the effect of day and side on conformation................................ 58
812.1 Subject One............................................................................................ 58
812.2 Subject Two............................................................................................ 59
8.2.3 Subject Three.......................................................................................... 60
8.3 Variation in stride length and velocity over five consecutive days ................ 61
8.3.1 Subject One............................................................................................ 63
8.12 Subject Two............................................................................................ 64
813.3 Subject Three.......................................................................................... 65
8.4 Correlation between stride length and velocity................................................ 66
8.5 Variation in range of motion over five days..................................................... 68
V

Contents
8.6 Effect of day, repeat and side on range of motion............................................69
8.61 Subject One.................
8.62 Subject Two..... 70
8.63 Subject Three.......................................................................................... 72
8.7 Correlation between range of motion and velocity .........................................73
8.8 Summary..............................................................................................................75
Chapter Nine: Discussion.........................................................................................76
vi

Contents
Part III: Normal gait in Arabian horses
Chapter Ten: Aims and Objectives..........................................................................86
10.0 Aim ...................................................................................................................... 86
10.1 Objectives ............................................. .............................................................. 86
10.2 Null hypothesis...................................................................................................86
Chapter Eleven: Methods .............................................................................. .......... 87
11.0 Subjects.............................................................................................................. 87
11.1 Instrumentation............................................................................................... 87
11.2 Anatomical markers ....................................................................................... 87
11.3 Filming procedure............................................................................................ 87
11.3.1 Conformation assessment.................................................................... 87
11.3.2 Stride length and range of motion assessment.................................... 88
11.4 Analysis of videos............................................................................................. 88
11.5 Statistical analysis ......................................................... .................................... 88
Chapter Twelve: Results................................................................ 89
12.0 Conformation.......................................................................... 89
12.0.1 Variation in conformation......................................... 89
12.1 Stride length and velocity...................................................... 90
12.1.1 Normal stride length in Arabian horses.................... 90
12. 1.2 Inter-horse variation................................................. 90
12.1.3 Correlation between stride length and velocity......... 92
12.2 Range of motion...................................................................... 93
12.2.1 Normal range of motion in Arabian horses............... 93
12.2.2 Inter-horse variation................................................. 94
12.3 Correlation between conformation and gait ....................... 95
Chapter Thirteen: Discussion........................... 99
Chapter Fourteen: Conclusion............................................ 107
Chapter Fifteen: References. 110
vii

Contents
Appendices
Appendix 1-Ethics Form I
Appendix 2-Risk Assessments ......................................................................... XI
Appendix 3-Informed Consent Forms ............................................................ XIX
Appendix 4-Inter-horse variation ................................................................... XXVIII
1.0 Inter-horse variation .......................................................................... XXVffl
1.1 Conformation .................................................................................... XXVIII
1.2 Stride length and velocity................................................................. XXIX
1.3 Range of motion ............................................................................... XXX
1.4 Summary .......................................................................................... XXXI
VIII

Contents
List of Figures
3.0 Test rig for linear accacy 23
3.1 Test rig for angular accuracy .......................................................................... 24
3.2 Test rig for dynamic accuracy ......................................................................... 25
4.0 Mean difference between true and measured distances (horizontal)............... 27
4.1 Mean difference between true and measured distances (vertical)................... 28
4.2 Mean difference between true and measured distances (diagonal).................. 29
4.3 Comparison of mean difference between true and measured angle
(horizontal)............................................................................................................. 34
4.4 Comparison of mean difference between true and measured angle
(horizontal) ..................................................................... ........................................ 34
4.5 Difference between true and measured angles using Quintic©
(horizontal)............................................................................................................. 35
4.6 Difference between true and measured angles using Quintic©
(vertical)................................................................................................................. 35
4.7 Mean ROM of one pendulum swing ............................................................... 36
4.8 Mean distance travelled by mass from one pendulum swing.......................... 37
4.9 Mean velocity of mass from one pendulum swing......................................... 38
5.0 Angular measurements before and after sine correction applied
(horizontal)............................................................................................................. 45
5.1 Angular measurements before and after sine correction applied
(vertical) ....................... .......................................................................................... 45
7.0 Location of anatomical markers..................................................................... 49
7.1 How static conformation was assessed............................................................ 51
7.2 Set up of filming equipment ............................................................................ 52
8.0 Variation in conformation over five days (subject one)............................... 58
8.1 Variation in conformation over five days (subject two).................................. 59
8.2 Variation in conformation over five days (subject three)................................ 60
8.3 A Mean stride length and velocity over five days (subject one)...................... 63
8.3 B Difference between stride length left and right side (subject one).............. 63
8.4 Mean stride length and velocity over five days (subject two)......................... 64
8.4 B Difference between stride length left and right side (subject two)............... 64
8.5 A Mean stride length and velocity over five days (subject three)................... 65
ix

Contents
8.5 B Difference between stride length left and right side (subject three)............. 65
8.6 Regression analysis for stride length and velocity (subject one)..................... 66
8.7 Regression analysis for stride length and velocity (subject two)..................... 66
8.8 Regression analysis for stride length and velocity (subject three)................... 67
8.9 Mean ROM over five days (subject one)......................................................... 69
8.10 Mean ROM over five days (subject two)....................................................... 71
8.11 Mean ROM over five days (subject three).................................................... 72
12.0 Mean stride length for a group of Arabian horses ........................................91
12.1 Regression analysis for stride length and velocity ........................................92
12.2 Mean ROM for all horses...............................................................................94
12.3 Regression for tibia length and stride length. 97
A4.0 Inter-horse variation in stride length.............
A4. 1 Mean scapulohumeral ROM for subjects 1-3...............................................XXX
x

Contents
List of Tables
1.0 Normal gait in various breeds.......................................................................13
1.1 Results of validation tests..............................................................................19
4.0 Comparison of Quintic © and HUMANTh for static linear validation
(horizontal)..........................................................................................................27
4.1 Comparison of Quintic © and HIJMANTh for static linear validation
(verti cal) .............................................................................................................. 28
4.2 Comparison of Quintic © and HUMANTh for static linear validation
(diagonal).............................................................................................................29
4.3 Linear validation of Quintic © and HUMANTh 30
4.4 Comparison of Quintic © and H1J.MANTh for angular validation
(horizontal).......................................................................................................... 31
4.5 Comparison of Quintic ° and HUMANTh for angular validation
(vertical).............................................................................................................. 32
4.6 Angular validation of Quintic © and HUMANTh 33
4.7 Comparison between Quintic © and HUMANTh (dynamic angular) 36
4.8 Comparison between Quintic © and HUMANTh (dynamic linear) 37
4.9 Comparison between Quintic © and HUMANThI (velocity) ....................... 38
4.10 Range in margin of error ............................................................................. 39
5.0 Validation of sine corrected data................................................................... 46
7.0 Location of anatomical markers.................................................................... 50
8.0 Intra-horse variation in conformation (subject one)..................................... 56
8.1 Intra-horse variation in conformation (subject two)...................................... 57
8.2 Intra-horse variation in conformation (subject three).................................... 57
8.3 Effect of day and side on conformation (subject one)................................... 58
8.4 Effect of day and side on conformation (subject two).................................. 59
8.5 Effect of day and side on conformation (subject three)................................ 60
8.6 Intra-horse variation in stride length (subject one)...................................... 61
8.7 Intra-horse variation in stride length (subject two)....................................... 61
8.8 Intra-horse variation in stride length (subject three).................................... 62
8.9 Effect of day, repeat and side on stride length and velocity (subject
one)...................................................................................................................... 63
xi

Contents
8.10 Effect of day, repeat and side on stride length and velocity (subject
two) ............................................................................................. ........................ 64
8.11 Effect of day, repeat and side on stride length and velocity (subject
three)................................................................................................................... 65
8.12 Variation in ROM over five days (subject one).......................................... 68
8.13 Variation in ROM over five days (subject two).......................................... 68
8.14 Variation in ROM over five days (subject three)........................................ 68
8.15 Effect of day, repeat and side on ROM (subject one)................................. 69
8.16 Effect of day, repeat and side on ROM (subject two)................................. 70
8.17 Effect of day, repeat and side on ROM (subject three)............................... 72
8.18 Correlation between ROM and velocity (subject one) ............................... 73
8.19 Correlation between ROM and velocity (subject two) .... ............................ 74
8.20 Correlation between ROM and velocity (subject three).............................. 74
8.21 Summary of main results............................................................................. 75
12.0 Variation in conformation of Arabian horses.............................................. 89
12.1 Variation in stride length and velocity for a group of Arabian horses
90
12.2 Inter-horse variation in stride length in a group of Arabian horses 90
12.3 Correlation between stride length and velocity .......................................... 92
12.4 Variation in ROM for Arabian horses......................................................... 93
12.5 Effect of horse and repeat on ROM ............................................................ 94
12.6 Correlation between forelimb conformation and stride length................... 95
12.7 Correlation between hind limb conformation and stride length ................. 96
12.8 Stepwise regression for hind limb conformation and stride length 98
13.0 Normal conformation and stride characteristics for Arab horses 99
A4.0 Inter-horse variation in conformation ......................................................... XXVIII
A4. I Inter-horse variation in stride length ......................................................... XXIX
A4.2 Inter-horse variation in ROM..................................................................... XXX
xii

Acknowledgements
Sarah
Sarah- you have been an inspiration to me throughout this research; I know for sure I would not have been able to do it without you. I would like to thank you for not only sharing your experience of all things biomechanical, but also your unparalleled patience with me.
Charlotte
Charlotte you have been a fantastic support both intellectually and emotionally. I would like to thank you for always being there to answer my many questions and for supporting me throughout this year.
Jaime
Jaime you probably given me the best guidance I could ask for ... 1 would like to thank you for your sage advice, unwavering encouragement and positive attitude you bring to everything you do.
Ode tie
Thank-you for your company, entertainment and enthusiasm that has helped me complete the year with a smile.
David
David, thank-you for letting us invade your space, putting up with us every day and always being willing to make a brew. I could not think of anyone I would rather share an office with. Your unwavering support, advice and encouragement has been an inspiration.
Jane
Jane, the best research assistant any M.Sc. student could want. You have made this year not only bearable but incredibly entertaining.
Fiona, Charlotte, Jo and Catherine
Thank-you for the kind use of your very well behaved horses, and your complete willingness for me to cover them with stickers on a daily basis.

Birkrigg Park
Liz and Roger; thank you not only for the kind use of your horses but for sharing your incredible knowledge of all things Arabian. Lesley-Anne, thank you for your assistance with filming days, it would have been impossible without you.
Mark
A special thank-you to Mark for solving my cosine problem.
Family
Lastly, I would like to thank my family. Despite me being stubborn and opinionated, I know I have their unconditional love. Thank you.

Chapter One: Literature Review
1.0 Introduction
The development of standardised two dimensional motion analysis techniques would
provide the equine industry with a consistent method for analysing equine conformation
and gait, which according to Colbome (2004) would enable equine practitioners to
quickly and simply obtain valuable biomechanical information. Currently there is a
paucity of information about the validity of such systems; research into equine
locomotion is often performed in laboratory conditions using three-dimensional
methods (Barrey, 1999). These systems have previously been established as accurate
and are recognised as the "gold standard" for gait analysis (Nankervis ci al., 2009).
Accurate two dimensional methods of analysing equine gait "in-field" would be more
beneficial to the equine industry, as they would be accessible to equine practitioners,
including breed societies. Normal conformation and gait would have to be defined and
this information used in conjunction with standardised methods in order for these
systems to be utilised practically by the industry. This study focussed on validating and
standardising the methods in order to define normal conformation and gait for the
Arabian horse.
The official breed society for the Arabian horse in the United Kingdom is the Arab
Horse Society. One of the aims of the Arab Horse Society is to ensure that good quality
animals remain within the breeding population, by promoting the breeding of these
animals through a Premium Scheme. Horses registered with the scheme must be
graded; this involves an evaluation of confomiation and gait quality, and is currently
performed by judges. This grading is subjective, as the horses are scored in relation to a
perceived ideal. There is no quantitative data available on what constitutes normal
conformation or gait characteristics, for horses to be graded against. Defining normal
conformation and gait for Arabian horses (using a quantitative method such as two
dimensional motion analysis) would facilitate the creation of a database to aid the Arab
Horse Society in its grading and selection process.
Assessment of conformation is also an important factor to consider when defining
normal gait. Conformational studies frequently focus on Thoroughbreds (Anderson,
2004; Anderson etal., 2004; Mawdsley cial., 1996; Weller etal., 2006a; Weller eta!,
2006b) and Warmbloods (Back ci at, 1996; Holmstrom c/at, 1990; Magnusson, 1985)
as these sports horse breeds are more commonly used in competition. These studies
1

Literature Review
attempt to link conformation to performance or soundness rather than defining what
normal conformational traits are specific to that breed. The studies that have focused on
Arab conformation (Gharahveysi ci at, 2008; Sadek ci at, 2006) attempt to define
normal Arab conformation, and use body measurements as an objective method to
measure conformation. These studies are a start in the implementation of databases of
normal conformation for Arabian horses; however gait has yet to be included.
1.1 Evaluating conformation
Equine conformation refers to the shape of the horse; the lengths of bone segments,
angles ofjoints and deviations of segments from the vertical or horizontal (Weller c/al.,
2006b). Quantitative measurements of these bone segments and joint angles will not
change with training. Conformation therefore provides the foundation of how the horse
moves, and ultimately limits performance and the probability of the horse remaining
sound throughout its competitive career. Evaluation of conformation is an essential
factor in any selection process.
The evaluation of conformation is assessed from the extemal appearance of the horse
(Wc!Icr ci al., 2006b). Traditionally in the equine industry conformation is subjectively
assessed, evaluating the conformation of a horse in relation to a perceived ideal. This
subjective evaluation is dependent on the opinion and experience of the individual
performing the evaluation, and has been described as an "individual feeling" (Mawdsley
ci at, 1996) for the overall appearance of the horse that seems to be more of an art than
a science (Rossdale and Butterfield, 2006). It is possible the lack of objectivity in this
method of assessment will lead to poor consistency between conformation scores from
different assessors. It is still the most commonly used method of evaluating
conformation in the equine industry in the UK and is the method currently utilised by
the Arab Horse Society.
Evaluation techniques need to be standardised in order to provide breeders with reliable
and useable information. This can be done by using an objective and repeatable method
for assessing conformation. Attempts have been made to quantify the evaluation of
conformation using linear scoring systems. A linear scoring system was introduced in
the bovine industry by the American Holstein Cattle Association in the 1970s, called the
Linear Assessment Trait Evaluation Programme (Mawdsley ci at, 1996). This method
2

Literature Review
aimed to score specific conformational traits on a scale between two biological
extremes, rather than defining good or poor conformation. This method has been
modified for use in the equine industry (Mawdsley ci a/., 1996). Foot slope for
example, would be scored in relation to "upright" or "sloping" (Mawdsley ci cii., 1996).
This system quantified conformation by providing the animal with an overall
conformation score, supplying more accurate information to the breed society.
Linear scoring systems have been compared with traditional conformation scoring in
Irish Draught horses (Breen, 2009). A group of Irish Draught horses were assessed by a
panel of experienced Irish Draught or Irish Sports horse judges. The judges scored each
horse twice using the linear and traditional method. The strength of intra-judge
agreement for each horse was calculated for the traditional and linear methods using
intra-class correlation coefficients (ICCs). ICC values describe how closely correlated
conformation scores are for each individual judge. Consistency was poor for both
scoring methods. The ICC values for the traditional scoring method were low, ranging
from 0.020 to 0.243, with eight of the nine traits scoring below the 0.20 cut off point.
The traits with the highest ICC values were "type" and "barrel and back". The traits
with the lowest ICC values were "foreleg" and hind leg". The linear scoring method
showed similar low consistency of scores between judges, with ICC values ranging
from 0.037 to 0.320. The traits with the highest ICC values were again, those relating to
the body of the horse; "barrel and back", "scapula" and "type", with traits of the distal
limb being significantly lower.
Traits that concern scoring lengths and angles had the lowest ICC values. It could be
argued that it is difficult to accurately estimate lengths and angles by eye. This would
explain the low ICC values for traits that involved these types of assessments. Traits
that do not involve estimating lengths or angles, such as muscularity of the hindquarters
and muscularity of the neck showed higher ICC values, suggesting these traits are easier
to score accurately. Research has previously suggested that it is difficult to judge by
eye lengths and angles, leading to inaccuracies and inconsistencies in conformation
scores (Magnusson, 1985).
The low inter-judge consistency scores imply that the linear scoring method of
evaluating conformation is still affected by a degree of subjectivity. The linear method
does quantify conformation scores, however it is not a completely objective method of
assessing conformation as the horses still have to be scored by an individual. This
Literature Review
means that the scores are subject to individual interpretation, decreasing the
reproducibility of the method.
Lack of experience of using the linear scoring method could contribute to the low
consistency between judges. The judges in study by Breen (2009) were experienced in
assessing conformation using the traditional method, rather than the linear scoring
method. Judges with more experience in using the linear scoring method might have
produced more consistent results. It has been suggested in previous studies that inter-
judge consistency would increase with experience and more detailed definitions of the
traits being scored (Magnusson, 1985). Standardisation of conformation assessment,
leading to a completely objective method would be expected to increase reproducibility
of conformation evaluation, making the information collected more beneficial to the
breed society. Thformation about how the conformational traits measured affect the
movement and consequently the performance of the horse will also provide beneficial
information to the Arab Horse Society.
1.1.1 Conformation and performance
Predicting performance using conformation is a long standing tradition in the equine
industry. Elite horses may not necessarily have "ideal" conformation (van Weeren and
Crevier-Denoix, 2006), therefore the traditional method of evaluating conformation will
not be entirely useful. Quantification of conformation, as well as investigating direct
links between particular traits and movement will provide essential information to
breeders. A reliable and repeatable method of evaluating conformation by measuring
traits will ultimately lead to a more in-depth understanding of how those traits affect
movement and subsequently performance.
The majority of evidence supporting the relationship between conformation and
performance has been anecdotal until recently. Research has been conducted to
determine the effect different conformational traits have on movement, and how
conformation can be related to performance. Performance is not a quantifiable measure,
due to other parameters affecting overall performance (Weller ci' at, 2006b), making
comparisons between conformation and performance difficult. Research has overcome
this by comparing conformation in elite and non-elite horses. Preliminaiy studies
showed that certain static measurements of conformation were either larger or smaller in
4

Literature Review
better performing horses (van Weeren and Crevier-Denoix, 2006). This type of research
makes the assumption that all elite horses perform to a higher standard than non-elite
horses, whereas the non-elite horses may have the conformational potential to perform
but lack the opportunity (in terms of training or resources). These studies do however
show some interesting correlations between conformation and performance.
A long sloping femur; sloping scapula; long humerus and proximal phalanx length have
been linked to good performance in Swedish Warmblood horses (Holmstrom ci at,
1990). The mean inclination of the scapula in elite horses was 65.3 ° and 64.4° (for
dressage and showjumping respectively) compared to 66.3° for the non-elite horses. A
larger scapula inclination leads to a more sloping scapula, which is preferable as it
leads to a smoother more comfortable ride (Back c/at, 1996) and has also been linked
to a longer stride length (Weller c/al., 2006b) which is desirable in most disciplines. It
has also been noted that a long radius, short third metacarpal and flat ilium are all
desirable traits for good movement (Holmstrom, 2000).
1.1.2 Conformation and soundness
Conformation evaluation is used to select horses with a low risk of developing lameness
(Back ci at, 1996) as conformation can be a predisposing factor in the development of
musculoskeletal injuries. Studies have been conducted into correlations between
conformational measurements and soundness. An upright scapula (a larger inclination
of the scapula) has been linked to increased concussion of the distal limb in show
jumpers (Back ci at, 1996) and therefore an increased risk of developing lameness.
Upright proximal phalanxs have been correlated with a greater ROM of the
metacarpophalangeal joint (de Souza ci al., 2004). Mean ROM in trot was 54.6 1° for
horses with normal forelimb conformation, compared with 60.72° for "camped under"
(upright proximal phalanxs) horses. Larger ROM of the metacarpophalangeal can put
more strain on the superficial flexor tendon or increased pressure on the navicular area
of the foot, leading to an increased chance of lameness (de Souza ci at, 2004). A small
tarsal joint angle has been correlated to increased flexion in this area, which in tum
minimises concussion on the joint. It could be argued therefore that a large tarsal angle
could lead to increased concussion on the hind limb and therefore predisposes for
lameness. A straight tarsus however has also been linked to a longer stride, increased
swing duration and range of motion within the joint, all of which are desirable in most
5
Literature Review
disciplines (Back ci al., 1996). These studies confirm there is no "ideal" conformation
for horses to be rated against in traditional evaluation methods. Traits have both
negative and positive effects on performance and soundness. It is essential therefore to
quantify how conformation is measured and also to quantify how these measures affect
equine locomotion. One method of doing this would be to use two dimensional motion
analysis techniques, such as using videography combined with a software package that
will measure static conformational traits and dynamic movement.
1.2 Evaluating gait
Evaluation of equine locomotion has two main purposes; to assess gait quality and to
identify gait irregularities. Gait quality is traditionally subjectively assessed, in much
the same way as conformation with gait being scored in relation to an "ideal". This
subjective evaluation relies on the experience or opinion of the judge doing the scoring.
It is also limited by the innate restrictions of the human eye in its ability to detect subtle
differences between individual horses or to register fast movement (Holmstrom ci at,
1990). Currently, identification of irregularities of equine gait uses linear scoring to
attempt to standardise the method as well as making it more objective (Back ci a!,
2007). The linear scale used to determine the degree of lameness is a scale from 0-10
(Fuller ci al., 2006) and is generic throughout the equine industry in the UK. Clinical
experience has been shown to have a significant effect on ability to identify gait
abnormalities accurately and the reliability of subjective assessments is poor when the
lameness is mild (Keegan, 2007). Research has also shown that while intra-assessor
consistency for detecting lameness is good (repeatability); inter-assessor consistency is
poor (reproducibility) for horses ranging from 0 (sound) to 10 (non-weight bearing) by
three veterinary surgeons (Fuller ci al., 2006). Gait analysis systems could be used to
objectively evaluate gait, and also provide quantitative data that could be used for direct
compansons.
1.2.1 Gail analysis techniques
One method of quantifying conformation and gait is to use motion analysis techniques.
These techniques have been used in research to evaluate lameness and the subsequent
effect of treatment (Back cial., 1993b); analyse performance (Leleu cia!, 2005, Deuel

Literature Review
and Park, 1990) and determine the predictive qualities of gait (Canoe! at, 1999, Cano
c/al, 2001b, Back etal., 1995a).
Some gait analysis systems consist of expensive and complicated equipment designed
specifically for laboratory environments. Data recorded from these systems may be
accurate however it is hard to extrapolate data recorded in a laboratory environment to
"real life" situations. There is a need to develop usable tools for objectively analysing
gait, and to prove they can provide reliable and accurate information to practitioners
quickly and inexpensively (Colbome, 2004).
Currently, the most popular technique for "in field" motion analysis is videography in
conjunction with two-dimensional (2D) motion analysis software. The method involves
attaching markers to anatomical landmarks on the horse, and filming the horse in
motion. The videos are downloaded and analysed using motion analysis software such
as Equinalysis, Quintic © or HU-M-AN'. The video cameras used are portable and
can be taken to the site of the horse. The markers used are circular or spherical and can
be attached to specific points on the body of the horse depending what is to be
measured. The markers can be tracked manually or semi-automatically to determine the
marker co-ordinates in space and time (Barrey, 1999). The video clips are analysed
frame by frame, so (depending on the speed of the video camera used) the stride can be
analysed in more detail than the capabilities of the human eye. Information such as
stride length; duration; frequency of the minimum and maximum flexion and extension
of the joints being measured, can be extrapolated from the video clips, as well as linear
and angular measurements of static conformation.
1.3. Two-dimensional motion analysis
1.3.1 Marker placement
The minimum number of markers needed to measure a specific joint is three
(Schamhardt ci a!, 1993) although more can be used (two markers on each limb
segment). Most two dimensional motion analysis techniques require markers to be
placed over the approximate centre of rotation of the joints being measured (Clayton
and Schamhardt, 2001) however some studies have placed markers at the proximal and
distal ends of limb segments (Galisteo ci al., 1996). It is hard to estimate the
approximate centre of rotation of joints using palpation, which leads to potential errors
7

Literature Review
in accurately calculating joint range of motion. Proximal and distal ends of limb
segments are easier to palpate, therefore placement of markers is more accurate. This
does not necessarily lead to more accurate data being recorded. Using two markers on
each limb segment allows for the calculation of the joint angle as it changes, however if
the markers are not aligned with the bone axes the joint angles calculated will be offset
(Schamhardt cial., 1993). Providing the marker position is known in respect to the joint
segments or angles being measured; and the horse is standing square, the exact marker
set being used has little influence on the accuracy of the data obtained (Schamhardt ci
al., 1993). It could be argued that a simple marker set will produce more reliable data
when repeated measures are being taken due to ease of application. It should also be
noted that a simple and easy to apply marker set is essential in the development of a
standardised method of gait analysis if it is to be utilised by the equine industiy.
1.3.2 Soft tissue ariefaci
The purpose of using anatomical markers is to identi& specific points of the skeleton on
the surface of the skin, by palpating the muscle and underlying tissue to feel the relevant
bony segments underneath. Soft tissue artefact (STA) relates to the movement of the
anatomical markers placed on the skin, in relation to the underlying bone. It is one of
the main sources of error when it comes to motion analysis techniques that use
anatomical skin markers (Leardini ci at, 2005). The amount of STA is dependent on the
position of the markers; some joints will display more STA than others due to the
amount of underlying tissue or the way the joint moves. STA is a contributing factor to
distortion or "noise" that is visible when it comes to analysing the movement that has
been recorded. The nature of the STA is often similar to the actual movement of the
horse, therefore it is difficult to distinguish between the two (Schamhardt ci at, 1993).
Soft tissue artefact on the human carpus has been reported as up to 21mm distally and
23mm posteriorally (Leardini ci at, 2005); up to 10mm on the human tibia (Leardini ci
at, 2005). Equine studies have shown similar results, with the distal limb having
smaller deviations than more proximal locations. Measurements of 8mm were found for
the metacarpus compared to 142mm for the greater trochanter (van Weeren ci at,
I 990a). These results are supported by further research (van Weeren ci at, I 990b)
where deviations of 10 to 40mm were found for the scapula and 130mm to 170mm for
the greater trochanter. This difference could be accounted for by the difference in the
8

Literature Review
amount of skin and underlying tissue in these areas. The distal limb has no underlying
muscle or adipose tissues (the distal limb contains only tendons and ligaments under the
skin) whereas more proximal locations, such as the femorotibial joint, have greater
amounts of tissue, including muscle and adipose tissue. STA can be corrected for using
different techniques. Van Weeren at al. (1990th) attempted to quantify the amount of
skin displacement caused by STA for different joints. The quantification of skin
displacement means that algorithms can be utilised to correct for errors caused by STA.
Schamhardt etal. (1993) suggested another method to overcome STA would be use to
choose anatomical sites to place markers where skin movement is negligible, therefore
not an issue. This is not an accurate or practical method of correcting for skin
displacement; it may be practical for distal limb markers where there is little STA, but
not for proximal markers. Some distortions from STA can be minimised using data
smoothing and filtering techniques applied after data is downloaded and digitised. This
is a quick and simple method therefore appropriate to be used in this study.
1.3.3 Repeated measures
Baseline measurements of stride characteristics are obtained using repeated
measurements for each horse. Number of repeats recorded for each horse varies from
three (Drevemo ei at, 1980a) to twelve (Clayton cial., 2002). Degueurce cial. (1997)
used five repeats to measure stride characteristics to ensure precision when investigating
variability of limb joint patterns. A study by Cano c/at (1999) recorded a high number
of repeats for each horse, and then randomly selected five to analyse further. Research
by Drevemo ci al. (1980a) recorded eight successive strides per horse and found very
little variance in individual horses. Based on these results it was estimated that three to
five strides would be a sufficient number to record in order to determine baseline gait
characteristics for individual horses.
Further research (Drevemo et al., 1980b) recorded the same group of horses
immediately after the first recording, to test the reproducibility of equine gait on more
than one occasion. The overall means and standard deviations were very similar on both
occasions, however there were some small variations within individual horses.
Additional research (Degueurce ci at, 1997, Sloet van Oldruitenborgh-Oosterbaan ci
at, 1996, van Weeren ci at, 1993, Back ci at, 1994b, Leleu ci all, 2004) has shown
similar results. Minor variations could be due to instrumental errors or soft tissue

Literature Review
artefact, such as skin displacement (Chiari cial., 2005; Leardini ci at, 2005), but results
suggest that horses have stable locomotion pattems, which would allow normal gait to
be quantified.
1.4 Variation in equine gait
Small intra-horse variation in gait is desirable as it means that baseline measures can be
obtained on a single occasion. Intra-horse variation in range of motion of specific joints
changes depending on what joint is being measured, as different joints move in different
ways. In French Saddle horses, variability of joint angles was shown to differ depending
which joint was being measured (Degueurce ci at, 1997). The coxofemoral joint ROM
had the lowest variability of 10, the joints with the largest variability were the fore and
hind metacarpophalangeal and distal interphalangeal joints. The variability of these
joints ranged from 3.2° to 3.5°. The low intra-horse variability confirms other studies
that have concluded individual horses have stable locomotion patterns that are repeated
for each stride (Degueurce ci at, 1997, van Weeren cial., 1993, Back ci at, 1994a).
The intra-horse variability was greater for joints of the distal limb, rather than the
proximal. Inter-horse variability (1EV) was greater than intra-horse variability. The
inter-horse variability ranged from 0.9° (coxofemoral) to 6.3° (fore distal
interphalangeal). There was greater variability in the distal joints compared to the
proximal joints. Galisteo ci at (1996) investigated the variability of angular joint
parameters in Andalusian horses. Intra and inter-individual variability were recorded.
The results indicate low variability in most of the joints measured (less than 10%),
however some joints showed a significantly higher variance. The intra-individual
variation in the scapulohumeral joint was 24.9%, and the inter-indi vi dual variation was
33.1%. The high variation between repeats of the same horse, as well as between
different horses could be due to the way the scapulohumeral joint moves, or limitations
of the method for example soft tissue artefact. The scapula has a higher degree of
muscle or fat mass than bone segments in the distal limb (Holmstrom ci at, 1990),
leading to increased soft tissue artefact (more movement of the skin and underlying
tissues over the bone). This could lead to an increased intra and inter-horse variability in
the range of motion for the scapulohumeral joint.
A study by Drevemo cial. (1980a) analysed linear and temporal stride characteristics in
30 Standardbred trotters. Intra-individual variation within horses was considerably
smaller than inter-individual variation between horses. Intra-horse variation for stride
10

Literature Review
length ranged from 8.5cm to 10.8cm compared to 31.4cm to 32.1cm for the inter-horse
variation. Similar results were found for stride duration, with intra-horse variation
ranging from 7.2 milliseconds to 9.3 milliseconds, and inter-horse variation ranging
from 23.3 milliseconds to 23.8 milliseconds. The inter-horse variation was larger than
the intra-horse variation, which is to be expected as no two horses will display the same
stride characteristics. The differences were surprisingly large however, considering the
horses used were all the same breed (Standardbred trotters). This suggests that
conformation could be a contributing factor to the inter-horse differences. It could be
possible that horses of the same breed vary considerably in conformation, therefore an
assessment of conformation should be included in any study into equine gait.
Drevemo etal. (1980b) published further work into the short and long term repeatability
of equine stride characteristics. The same group of horses from the first study (Drevemo
etal., 1980a) were recorded again immediately after the first recording, then again four
years later. The most constant stride parameters were stride length with a mean standard
deviation of 11.4cm on the first recording and 9.7cm on the second; swing (7.Omsecs
compared to 7.3msecs); step (5.4msecs compared to 6.2msecs) and suspension duration
(7.3msecs compared to 6.8msecs). These results show that the short term reproducibility
of equine gait is good due to the stability of stride parameters. The long term study
indicated that the horses changed locomotion patterns between the two recordings (three
years later). The largest change was seen in stride duration, increasing from a mean of
460.6 milliseconds to 487.3 milliseconds. The swing phase also increased significantly
(from a mean of 352.3 milliseconds to 375.2 milliseconds), which could be the cause of
the increased stride duration. The decrease in long term reproducibility in equine gait
could be accounted for by age or training effects.
11

Literature Review
1.5 Breed
Equine breeds exhibit distinct characteristics, developed through selective breeding
performed over a number of generations (Galisteo etal., 1997). There is a huge amount
of variation between equine breeds, with horses being selected for different attributes
such as strength, speed or beauty (Cano c/al, 2001b). Conformation has a direct effect
on the locomotion of the horse (Holmstrom ci at, 1990) and is inherently different
between breeds. It could be argued therefore that horses will exhibit breed-specific
patterns of locomotion. Few studies have focussed on exactly what these specific
patterns are related to different breeds, as most studies into locomotion and breed are
comparative, and sometimes contradictory (Cano et al., 2001b, Galisteo ci at, 1997,
(ialisteo ci at, 2001b). One study established Arabian horses had significantly larger
scapulohumeral range of motion (ROM) in walk compared to Andalusian horses; but
smaller than Anglo-Arab horses (Galisteo ci at, 2001b). The Arabian horses had a
mean ROM of 17.6±3.4° compared to 15.7±2.5 ° and 19.0±4.3° for the Anglo-Arabians
and Andalusians respectively. A study by Cano ci al. (2001b) contradicts these results
(table 1.0); Arabians had the largest mean scapulohumeral ROM (25.3°) compared to
Anglo —Arab (16.8 °) and Andalusian (22.3 0). The horses in this study were recorded in
trot, compared to the horses in the previous study (Galisteo ci al., 2001b) that were
recorded in walk, The difference in gait could account for the difference in ROM. Both
studies established significant differences between breeds for all joints measures;
highlighting the possibility of defining breed-specific gait patterns. The Arabian horses
measured by Cano ci at (2001b) had a significantly shorter stride length in trot;
demonstrated in table 1.0 (page 13). The standard deviation of the mean Arabian stride
length was the largest out of the three, suggesting Arab horses have more variable gait.
Variability in gait of Arab horses could present some difficulties for the present study
when attempting to define normal gait for the breed.
12

Literature Review
Table 1.0: Stride length (in trot) and range of motion reported for various breeds (adapted from Galisteo cial., 1997; Cano ci at., 2001 b).
TraitlBreed Arab Anglo-Arab Andalusian Dutch Warmblood
Stride length(m) 2.6 2.6 2.7 3,1 Velocity (m/s) 4.8 3.7 3.9 4.0
Scapulohumeral ROM (°) 25.3 16.8 22.3 19.3
Humeroradial ROM( °) 58.4 60.1 67.1 57.8 Carpus ROM(°) 83.2 95.2 108.0 98.5 Metacarpophalangeal 85.3 88.2 103.0 82.6 ROM(°) Coxofemoral ROM(°) 29.5 24.8 29.6 N/A
Tarsus ROM(°) 58.8 61.3 69.0 N/A
Metatarsophalangeal 99.1 102.6 122.5 N/A
1.6 Age
Selection of horses for breeding and performance is often performed at a young age,
therefore it is important to ascertain how locomotion develops as the horse grows.
Consequently there have been a range of studies investigating how locomotion changes
with age (Cano etal., 2001a, Back c/at, 1993a, Back c/at, 1994a, Cano cial., 1999,
Back ci at, 1995a), providing some contradictory results. The studies by Cano ci at
(2001a) and Cano ci al. (1999) indicate that horses do not have inherent locomotion
patterns from birth, they change and evolve with age. These studies measured stride
characteristics of young and mature Andalusian horses using two dimensional motion
analysis techniques. The greatest amount of modification to locomotion was found to be
between 12 and 24 months, with some changes still occurring up to 36 months (Cano et
al., 2001a). Other studies, such as those by Back ci al. (1994a; 1993a) indicate that
horses' locomotion stabilises at a much younger age (four months) as no differences
were found in temporal and angular characteristics in Dutch Warmblood horses aged
four to 26 months. The studies by Cano cial. (1999; 2001a) recorded the horses being
led in-hand on a track, whereas the studies by Back etal. (1993a; 1994a) recorded the
horses on a treadmill. It has been reported that treadmill stride characteristics differ
from those over ground (Barrey ci al., 1993; Buchner ci al., 1994). Higher stride
frequency and longer stride length, (Barrey ci at, 1993) as well as an increase in stance
duration (Buchner ci al., 1994) were established in horses trotting on a treadmill
compared to over ground. The differences between gait using these two methods of data
13

Literature Review
collection makes it difficult to formulate direct comparisons between gait analysed in
the Cano ci a/i and Back eta!, studies.
1.7 Velocity
The quantification of equine gait requires stable locomotion patterns, with little intra-
horse variation. Low intra-horse variation means that baseline data can easily be
obtained, therefore when collecting baseline locomotion data consideration of factors
affecting variability of gait must be considered. Velocity is one factor that can affect
locomotion patterns in horses. At faster velocities longer distances are covered in a
shorter space of time; stride length increases and stride duration decreases (Clayton ci
at, 2002). A change in velocity has been shown to have a significant effect on stride
characteristics in foals (Back ci at, 1 993b). As velocity increased, stance phase duration
decreased and flexion of the humeroradial, metacarpophalangeal and carpal joints
increased. The data in this study was collected using a treadmill, which has been shown
to have significant effects on equine locomotion (Sloet van Oldruitenborgh-Oosterbaan
and Clayton, 1999). Over ground, horses will select a speed at which they are most
comfortable (Peham ci at, 1998). This optimum speed has also been shown to be the
speed at which there is the least variation between cycles of successive strides (Peham
ci at, 1998). In this study, the smallest standard deviation between successive strides
was found when horses were travelling at their optimum speed on a treadmill, and as the
speed of the treadmill altered so did intra-horse variation between strides (with standard
deviations ranging from 0.6cm to 5.8cm for one horse studied). The study also showed
that each horse had different optimum speeds, ranging from 3.7 to 6.9mIs. Evidently
velocity does have a significant effect on the variability of equine gait, efforts should be
made when measuring variability to ensure all horses travel at similar speeds.
1.8 Validation
When using videography combined with motion analysis software as a method of
equine gait analysis, the size of the horse can present some difficulty due to the
amplitude of movement (Degueurce ci al., 1996). A large subject, such as a horse
requires a large field of view in order to capture the full range of movement. Equine
stride length can range from 2.63m to 3.07m at trot (see table 1.0, page 12). Human
stride length has been reported as on average 1.4m (White and Lage, 1993; Dubost ci
14

Literature Review
al., 2008). The video camera must be situated further from the subject than human
motion analysis studies. It is essential that the motion analysis techniques used are still
accurate and reliable at this distance to ensure they are a valuable tool for the equine
industry to use. In order to validate the accuracy of the software, standard reference
lengths or angles can be used (true values); accuracy is determined by the amount of
conformity between the true and measured values. Defining the limits of the system's
accuracy will enable effective and accurate interpretations of the results (Deluzio etal.,
1993; Wilson c/al., 1999).
Results of validation studies reported on one system will not generalise to other
systems, therefore the accuracy of each system requires definition (Klein, 1995). Results
of validation on some commercially available systems can be seen in table 1.1 (page
19). The majority of validation studies so far determine the accuracy of three-
dimensional motion analysis techniques, there appears to be very little validation
research using iwo-dimensional equivalents or the specific software programmes used
in this research (Quintic © and HIJ-M-ANTh). There is currently no published research
into the validation of QuinticC or FfU-M-ANTm in the use of measuring static and
dynamic values or the tracking of movement in horses. There has been research into the
reliability of Quintic° to measure tibial rotation in humans (Lovett, 2006). This study
used Quintic© in conjunction with a tibial pointer device to measure the amount of
rotation. The intra-class correlation coefficients (ICC) were calculated from two
separate digitisations of the same ten subjects. The ICC values were >0.7 in 70% of the
subjects, indicating a good reliability. This study used two measurement techniques
(Quintic© and the tibial pointer device) therefore it is hard to distinguish the reliability
of Quintic© alone from this study. HUMANTh has been used in previous research to
validate the temporal accuracy of digital video-based motion capture systems (Teeple c-
al., 2009). This study did not test the accuracy of the software alone, but the accuracy of
different camera systems (HU-M-ANTh was used to digitise the videos). The study
revealed that differences (up to 5% for angular position and up to 15% for angular
velocity) for different camera systems were caused by the method of compression used
(to download the video clips onto the computer), rather than the software.
15

Literature Review
1. & I S/a/ic linear validation
Static linear accuracy is applicable when analysing equine conformation; the assessment
of linear conformation traits involves the measurement of varying static lengths
(measuring the distance between two points on limb segments).Linear validation is
normally calculated using inter-marker distance measurements (Chiari ci al., 2005).
This is done by placing makers a set distance apart and comparing this true value to the
value measured by the software. It is a basic requirement of all motion analysis systems
yet despite this, very few studies have validated static linear measurements when
calculating the accuracy of motion analysis software. The majority of studies into linear
validation are regarding dynamic rather than static measurements. Two studies that
measured static linear accuracy were Klein and De Haven (1995) and Thornton ci al.,
(1998). The two motion analysis software packages (Ariel and Kinemetrix 3-D) were
considered accurate with a mean error of 500±1.3mm (Klein and De Haven, 1995), and
80±0.1mm (Thornton ci al. 1998). The studies only tested one length respectively
(500mm and 80mm), rather than a range of lengths. It is possible that different lengths
could be measured to varying degrees of accuracy, therefore a range of different lengths
should be tested.
1.8.2 Static angular validation
Angular validation involves comparing true values to measured values (as with linear
validation). True angles are frequently taken from recording a goniometer; an
established tool to objectively measure individual joint movement in human patients
(Edgar ci at, 2009) and in assessments of static conformation in horses, prior to the use
of photography or videography (Magnusson, 1985). Scholtz (1989) validated a motion
analysis software programme called WATSMART (Waterloo Spatial Motion Analysis
Recording Technique) using a goniometer. The goniometer had infrared light emitting
diodes attached to the axis and arms. Scholtz recorded the goniometer at 12 angles,
varying by 50, from 45 0 to 1000, using a video camera, 10 times for each angle. The
variation for each angle was less than 0.50 (P<0.05), however it was noted that if the
goniometer rotated out of plane the reliability and accuracy decreased. The software
will recognise the pixels comprising the marker and automatically calculate the centre
point. This automatic identification will be limited if distortions occur (if the camera or
marker is rotated out of plane). These inaccuracies due to out of plane rotations were
16

Lilerature Review
also noted by Wilson c/at (1999). Further research by Klein and De Haven (1995) used
a similar method to calculate angular accuracy of the Ariel Performance Analysis
System. The goniometer was manually positioned at each angle (from 100 to 180° in 10°
increments) and recorded using a video camera. This process was repeated ten times.
The average deviation was <0.03 0 (more accurate than WATSMART), and considered
to be within the normal error range and the software was deemed reliable at accurately
measuring static angles. Angular consistency was measured using the same process as
above but moving the goniometer through the field of view. Accuracy was consistent
for angles <120° however angles >120° there was increased variability between the
goniometer reading and the value shown using the software. The decrease in accuracy
for angles >120° is supported by further research by Linden (1992). This study used a
similar method (a goniometer with markers attached) and motion analysis software
(Motion Analysis'). The mean differences were smaller for angles <90° (0.5°)
compared to the mean differences for angles >90° (1°). The system demonstrated the
greatest error in calculating the 1800 angle (between 1.50 and 2.4°). The system was less
accurate at calculating angles greater than 180 ° . The author suggests this could be due to
the algorithm the software uses to calculate the angles. The algorithm uses the cosine
rule to calculate the angle, and as the cosine approaches one, the software appears to be
limited when the opposite side becomes very small (Linden ci al., 1992). None of these
studies validated angles >180°. When assessing equine conformation, some joints can
have angular values of over 180 ° for tarsal, proximal phalanx and carpus angles
(Anderson and Mcllwraith, 2004), therefore it is important that validation of the
software reflects these types of measurements.
1.8.3 Dynamic va/ida/ion
Calculating the accuracy of dynamic measurements commonly uses a device of known
value (length) moving throughout a calibrated field of view. Linden ci al. (1992) used
two spherical markers attached to each end of a rigid wooden bar (178.5mm apart). The
wooden bar was moved randomly within the field of view, and recorded using a video
camera. The system calculated the distance between the markers from 174.1mm to
177.6 mm, giving an error value of between 0.9 mm and 4.4mm. This method was
repeated by Degueurce ci al. (1996) to evaluate the use of a three dimensional opto-
electronic system for capturing movement. The absolute and calculated distances were
17

Literature Review
tested for variance, and showed no significant differences (P<0.05), with a mean error
of less than 5mm for a reference length of 60.9cm
Dynamic validation has also been performed using a pendulum test (Wilson etal., 1997;
Chiari ci at, 2005), although this is not as widely used. Markers were attached to either
end of a wooden bar, which was then oscillated. The linear distance was calculated for
the distance between the markers as the pendulum was in motion. The swing phase of
the equine distal limb is likened to an inverted pendulum (Back ci at, 1993) as has the
human athlete (Chiari ci al., 2005), therefore it would seem appropriate to use a
pendulum to test the accuracy of motion analysis software that will be used for equine
locomotion analysis. This simple test could be developed to enable the accuracy of
linear and angular measurements, as well as velocity to be calculated.
A common method of validating dynamic accuracy of motion analysis systems is to
compare the system being tested to a "gold standard" system-one that has already been
validated as accurate and is widely used in research. One such system is the Qualisys
Oqus motion capture system. This is an optoelectronic system that uses both active and
passive markers to track moving objects. This system is accurate to within 1mm, and a
similar system (ProReflex) has been used in previous studies as the standard with which
to compare other systems to (Nankervis etal., 2009).
The study by Chiari ci at (2005) also reported the results of validation tests of various
motion analysis systems that are commercially available. Accuracy was reported in a
typical gait analysis setting for marker distance estimates. The standard error and
standard deviation ranged from 0.1mm (standard deviation 0.53mm) to 5.3mm
(standard deviation 4.2mm). For most of the systems tested, the standard error was
greater than 1mm. There was variation in errors reported for each system, which shows
the importance of testing the accuracy of each motion analysis system prior to use.
18

Literalure Review
Table I. I: Results of validation tests performed on various commercially available systems (adapted from
Wilson etal., 1999; Chiari etal., 2005).
Author (s) Software Type of True value (s) Margin of validation error
Inter-marker distance value
Klein and De Ariel
Static linear of 50cm 1.3mm
Haven (1995) Performance
and angular Goniometer
Analysis System values from <0.03 0 100 to 180° in 100 increments
Thornton etal. Kinemetrix 3-D Static linear
(1998)
WATSMART (Waterloo Spatial Motion Static
Scholz (1989) Analysis angular Recording Technique)
Linden etal. Motion Analysis Static (1992) System angular
Ariel Wilson etal. Dynamic
Performance (1997) (angular)
Analysis System
Inter-marker distance value
0.1mm of 80mm
Goniometer values from
0 5 45 ° to 100° in 5° increments
Goniometer values from
<04° 200 to 180 0 in 10° increments
12 angles at four initial
0.183 ° angular positions
Degueurce et 3D Vision
al. (1996)
Linden etal. Motion Analysis
(1992)
Dynamic Inter-marker
(linear) distance value <5mm of 60.9cm
Dynamic Inter-marker
(linear) distance value 4.4mm of 178.5cm
The provision of accurate quantitative data on normal conformation and stride
characteristics of Arabian horses, creating a unique baseline dataset would provide the
Arab Horse Society as well as Arab horse owners and breeders with interesting and
useful information. Accurate data cannot be obtained without a valid and standardised
method of data collecting. This research will form three separate but inter-linked
studies. Firstly, a comparison of two commercially available two-dimensional software
programmes will be undertaken to establish the accuracy and suitability of the
19

Literature Review
programmes for use with equine gait analysis. Secondly, variability in equine gait will
be measured to standardise how "normal" (baseline) gait characteristics are measured
using two-dimensional motion analysis techniques. These two studies will form the
basis of the final section of this research; to establish normal conformation and gait in a
group of purebred Arabian horses.
pzi
PART I
Validation and comparison of Quintict and HU-M-AI'P'Mfbr use in two-dimensional
motion analysis.

Chapter Two: Aims and Objectives
2.0 Aim
The aim of this part of the study was to validate and compare the accuracy of Quintic °
and HU.MANTh as two-dimensional motion analysis software packages, for static
linear and angular measurements and dynamic linear and angular measurements and
velocity.
2.1 Objectives
i) Record a metre ruler and measure different distances with both software
packages. Compare the measured values to the known values (and to each other).
ii) Record a goniometer and measure different angles with both software
packages. Compare the measured values to the known values (and to each other).
iii) Record dynamic length, angle (and velocity) using a pendulum to measure
length of arc, change in angle and velocity with both software packages. Compare these
values to measurements taken with a previously validated "gold standard" system
(Oqus).
2.2 Hypothesis
i) There will be a significant difference between the known linear distances and
the measured linear distance with both software packages.
ii) There will be a significant difference between the known angle and the
measured angle with both software packages.
iii) There will be a significant difference between the standard values for
dynamic distance, angle or velocity with both software packages.
21

Chapter Three: Methodology
3.0 Instrumentation
Manual digitising of the video clips used Quintic ° Biomechanics 9.03 v14 and HU-M-
ANTh (2D) v6.0. In addition to this, hardware used included a Sony DV-tape digital
video camera (HDR-FX1000) recording at 50 hertz (25 frames per second, two fields
per frame), and a Fujitsu Siemens laptop for downloading the video clips. A purpose
built wooden cube (50cmx5Ocm) was used to provide a reference length and ratio for
calibrating the video clips. The majority of validation tests use a standardised
measurement technique or a known value to compare the software against (Klein and
De Haven, 1995). The standards to be used in this study are a metre ruler (for static
linear measurements), goniometer (for static angular measurements) and a pendulum
(for dynamic measurements).
3.1 Data smoothing
The majority of data obtained from motion analysis is low frequency (Chiari et al.,
2005). This data is often smoothed to remove the high frequency noise associated with
data collected using two dimensional motion analysis techniques (Howarth and
Callaghan, 2009). HUMANTh and Quintic© use a low pass, second order Butterworth
filter for data smoothing. This is an appropriate filter for analysis of low frequency data
Cut off frequencies for the majority of human movement data is between 4 and 8 Hertz
(Bartlett, 2007). There were only small amounts of distortion for the data for this
investigation (no noise from impact or STA) therefore a cut off frequency of 10 Hertz
was used. Data smoothing using this technique will remove any data above the cut off
frequency (removing high frequency data), therefore leaving the low frequency data that
represents the movement being measured, rather than the distortions.
22

Methodology
3.2 Linear accuracy
Static linear estimations tested the accuracy of the software to calculate linear distances
from a standard length. The method was developed from a similar method used by
Klein and De Haven (1995). The standard length used was a metre rule, clamped in a
retort stand. Circular markers (5mm diameter) were attached to the meter rule at 10cm
intervals (giving ten known lengths from 10 to 100cm to calculate). The centre of the
marker was used to digitise. The linear estimations tested three positions of the metre
rule (figure 3.0) which was placed at different angles (against the vertical) i) 90 degrees
(horizontal) ii) 0 degrees (vertical) iii) 45 degrees (diagonal). A camera on a tripod was
positioned 4m away from the metre rule, and levelled using a spirit level. A calibration
cube (50x5Ocm) was used to ensure the camera was perpendicular to the equipment and
to calibrate the video clips. The calibration cube was recorded for three seconds, and
then removed from the field of view. The meter rule was recorded for three seconds,
three times for each position (in total nine clips were recorded).
i) ii) iii)
Figure 3.0: Test rig for estimation of linear accuracy: showing i) horizontal ii) vertical and iii) diagonal orientations of the meter rule. Ten, 5mm markers were placed at 10cm intervals on the metre rule (giving ten known linear distances), which was clamped into a retort stand (the clamp is marked with an X).
23

Methodology
3.3 Angular accuracy
Static angular estimations tested the accuracy of the software to calculate static angles.
The standard used was a clinical goniometer clamped in a retort stand (figure 3]).
(3oniometers have previously been used as standards for angular validation studies
(Klein and De Haven, 1995; Linden, 1992). The test rig was set up and calibrated as
above. Three circular markers (5mm diameter) were attached to the centre pivot point,
and the end of each axis of the goniometer (250mm from the centre). The reference
angles used were between 10 and 360 degrees at 10 degree increments (based on the
same procedure as Linden ci al., 1992)). The goniometer was manually positioned into
each of the 36 reference points, in the vertical and horizontal plane, and recorded for
three seconds three times for each angle. A total of216 references angles were recorded.
Figure 3.1: Estimation of static angles using a goniometer clamped to a retort stand. Circular markers (5mm) were attached to the centre of the pivot and each axis (shown in grey). The angle was measured between the three markers (angle shown in red). The goniometer was positioned into 36 different angles (between 10 and 360 0) .
24

Methodology
3.4 Dynamic accuracy
To measure the accuracy of the software in measuring dynamic distances and angles, a
pendulum was used. This is not a widely used method but has been reported previously
as a technique to validating dynamic measurements (Chiari c/at, 2005). The pendulum
was constructed by hanging a mass from a retort stand using a wire cable (112cm).
Circular markers (20mm, in addition to this a 5mm circular marker to identify the
centre) were attached to the pendulum at the centre of the mass, centre of the pivot and
base of the retort stand (figure 3.2). The pendulum mass was pulled back to starting
angles of 20°, 300 and 60° (measured from the retort stand) and set in motion, five times
for each angle. The pendulum was recorded simultaneously with two systems; the two
dimensional system used for the previous static validation (standard digital video
camera) and a three dimensional optoelectronic system (Oqus) that acted as the
standard. The Oqus system digitises automatically and has previously been validated to
be accurate to 1mm for dynamic measurements, and has been used as the "gold
standard" for other research validating new motion analysis techniques therefore an
appropriate system to compare Quintic© and HI.JMANTh to. Once the clips were
downloaded and digitised, range of motion, length of arc (linear distance travelled by
the mass) and velocity (of the mass) were calculated using all three systems. The results
from Quintic© and HUMANTh were compared to the standard results obtained from
Oqus.
Figure 3.2; Test rig to simulate a pendulum. A mass was suspended from a retort stand from a pivot (X). Circular markers (5mm) shown in grey were attached to the centre of the mass, centre of the pivot and base of the stand (shown in grey). The angle measured is shown in red.
25

Methodology
3.5 Statistical analysis
Descriptive statistics were calculated for the data for each true value (distance and
angle) and orientation. Descriptive statistics included mean difference (the difference
between the true and measured value), standard error, variance (the distance of the data
from the mean value) and the coefficient of variation (the standard deviation as a
percentage of the mean, which allows data sets of different values to be compared).
Data for each true value and orientation were tested for normality using an Anderson-
Darling normality test. Data for the measured value, and the difference between true and
measured values were tested. Data that were established as parametric were analysed
further using a General Linear Model (GLM).
26

2.5 .5 Ge
m S E
.5 C 15 Ge
1 Cu 5 -• .0
C 0.5
Ge U C
0
-0.5 Ge 2
-1
Results
4.0 Linear validation
4.0.1 Comparison of Quint/c 0 and HUMANIM
Tables 4.0 to 4.2 and figures 4.0-4.2 illustrate the differences between the true linear
measurements taken from the software programmes in the horizontal, vertical and
diagonal planes. The amount of variation between repeated measurements using the
same programme has also been established. All data were parametric.
Table 4.0 Comparisons between Quintic ° and I-1UMANTM for static linear measurements in the horizontal plane. The highest and lowest mean difference values for each software have been highlighted in grey.
True value Mean difference SE Variance %COV (cm)
Quintic' HU-M -AN" Quintic HEJ-M.AN" Quintic'1 HU-M-AN" Quint/c'3 HU-M-Atr
10 -0.33 3 0.33 0.22 5.97 0.15 1.00 3.80 20 ED 0.07 0.00 0.08 0.00 0.02 0.00 0.72 30 0.67 0.18 0.33 0.08 1.88 0.02 1.00 0.46 40 0.67 0.30 0.33 0.38 1.42 0.44 1.00 1.64 50 0.67 0.24 0.33 0.38 1.14 0.44 1.00 1.32 60 1.00 0.53 0.58 0.22 1.64 0.15 2.00 0.64 70 1.00 0.23 0.58 0.09 1.41 0.02 2.00 0.21 80 To 0.00 0.15 0.00 0.07 0.00 0.33 90 1.67 0.22 0.33 0.16 0.63 0.08 1.00 0.31 100 0.33 0.25 033 0.29 0.58 0.25 1.00 0.50
• Quintic
• F-1U-M-AN
True length (cm)
Figure 4.0: Mean difference (±SE) betven true and measured distances with QuinticC and HU.MANTM in the horizontal plane.
27

U Quintic
U HU-M-AN
True length (cm)
Results
Table 4.1: Comparisons between Quintic ° and HlJtvtANtM for static linear measurements in the vertical plane. The highest and lowest mean difference values for each software are highlighted in grey.
True value Mean difference SE Variance %COV (cm)
Quint/c0 HtJ-M-AN" Quint/c 0 HU-M-AN 0 Quintic' HU-M-AN" Quint/c 0 HU-M-AN"'
10 öFo 0.00 0.15 5.97 0.07 1.00 2.65
20 0.00 0.14 0.00 0.00 0.00 0.00 0.00 0.01
30 0.00 0.28 0.00 0.08 0.00 0.02 0.00 0.44
40 0.00 0.27 0.33 0.13 1.43 0.05 1.00 0.57
50 0.33 0.47 0.33 0.23 1.14 0.16 1.00 0.78
60 0.56 0.00 0.15 0.00 0.07 0.00 0.44
70 1.00 ETE 0.00 0.23 0.00 0.16 0.00 0.56
80 1.00 0.45 0.00 0.23 0.00 0.16 0.00 0.49
90 1.00 0.60 0.00 0.26 0.00 0.21 0.00 0.50
100 0.00 -0.46 0.00 0.13 0.00 0.05 0.00 0.23
1.2
1
C i' 0.8 a,
tI 0.6 Cu
0.4
n2 0.2 a, t us C- 0
E -0.2 C C a, -0.4
-0.6
-0.8
Figure 4.1: Mean difference (±SE) between true and measured distances with Quintic ° and HUM.ANTM in the vertical plane.
28
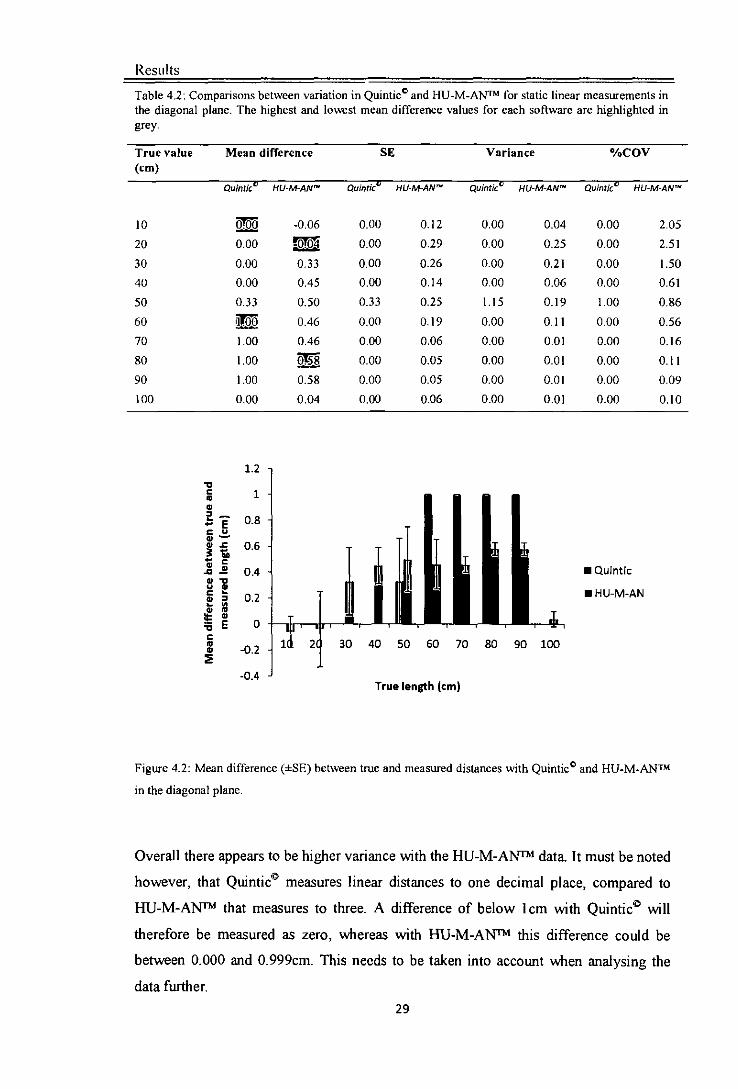
• Quintic
• HIJ-M-AN
True length (cm)
C U ci 3-. I-
-E Cu
ci -C
ci C -Os ci U C- ci. I- UI •10
C U ci 2
1.2
1
0.8
0.6
0.4
0.2
0
-0.2
-0.4
Results
Table 4.2: Comparisons between variation in QuinticC and HUMANTM for static linear measurements in the diagonal plane. The highest and lowst mean difference values for each software are highlighted in grey.
True value Mean difference SE Variance %COV (cm)
Quint/c' HU-M-Ar Quintic HU-M-AN' Quint/c' HU-M-AN' Quint/c' HU-M-AN'
10 O -0.06 0.00 0.12 0.00 0.04 0.00 2.05
20 0.00 0.00 0.29 0.00 0.25 0.00 2.51
30 0.00 0.33 0.00 0.26 0.00 0.21 0.00 1.50
40 0.00 0.45 0.00 0.14 0.00 0.06 0.00 0.61
50 0.33 0.50 0.33 0.25 1.15 0.19 1.00 0.86
60 0.46 0.00 0.19 0.00 0.11 0.00 0.56
70 1.00 0.46 0.00 0.06 0.00 0.01 0.00 0.16
80 1.00 0=5 8 0.00 0.05 0.00 0.01 0.00 0.11
90 1.00 0.58 0.00 0.05 0.00 0.01 0.00 0.09
100 0.00 0.04 0.00 0.06 0.00 0.01 0.00 0.10
Figure 4.2: Mean difference (±SE) between true and measured distances with Quintic ° and HUMANTM
in the diagonal plane.
Overall there appears to be higher variance with the HUMANTh data. It must be noted
however, that Quintic° measures linear distances to one decimal place, compared to
HUMANTh that measures to three. A difference of below 1cm with Quintic ° will
therefore be measured as zero, whereas with HUMANTh this difference could be
between 0.000 and 0.999cm. This needs to be taken into account when analysing the
data further.
29

Results
There does appear to be a trend in the mean difference values for the HU-M-ANTm data.
Values in the middle range (between 30cm and 90cm) tend to display higher mean
differences (figures 4.0-4.2). Values in the lower and upper ranges (10-20cm and
100cm) tend to display lower mean differences.
4.0.2 Effect of true distance, orientation and sofiware
Table 4.3: Linear validation of Quintic ° and H1JMANTM for the true distances of 10-100cm in three orientations (horizontal, vertical and diagonal) for the measured values and difference between true and measured values. Levels of significance are indicated by P<0.05; P<0.005; ***P<0001; NS not significant.
Variables Measured value Absolute difference
Quintic° HU'M-ANTM Quint/c 0 HU-M-AN"
True Distance 5*5 *5* *5*
Orientation • NS * MS
True distance and orientation interaction NS NS NS NS
Repeat NS NS NS NS
Software *5* *5*
True distance and software interaction C"
Table 4.3 demonstrates Quintic © and HUMANTh measure varying lengths
consistently; repeat was not a significant factor for either software package (P>0.05).
Depending on which software was being used, the true values were measured
differently. Software was a significant influence on the measured value and the absolute
difference (Pc0.001). Each software package will measure varying lengths to different
degrees of accuracy (true distance was a significant influence on absolute difference).
Quintic° is affected by the orientation of the lengths being measured (P<0.05), whereas
HU-M-ANTm is not (P>0.05), although there was no interaction between true length and
orientation for either software packages (P>0.05).
30
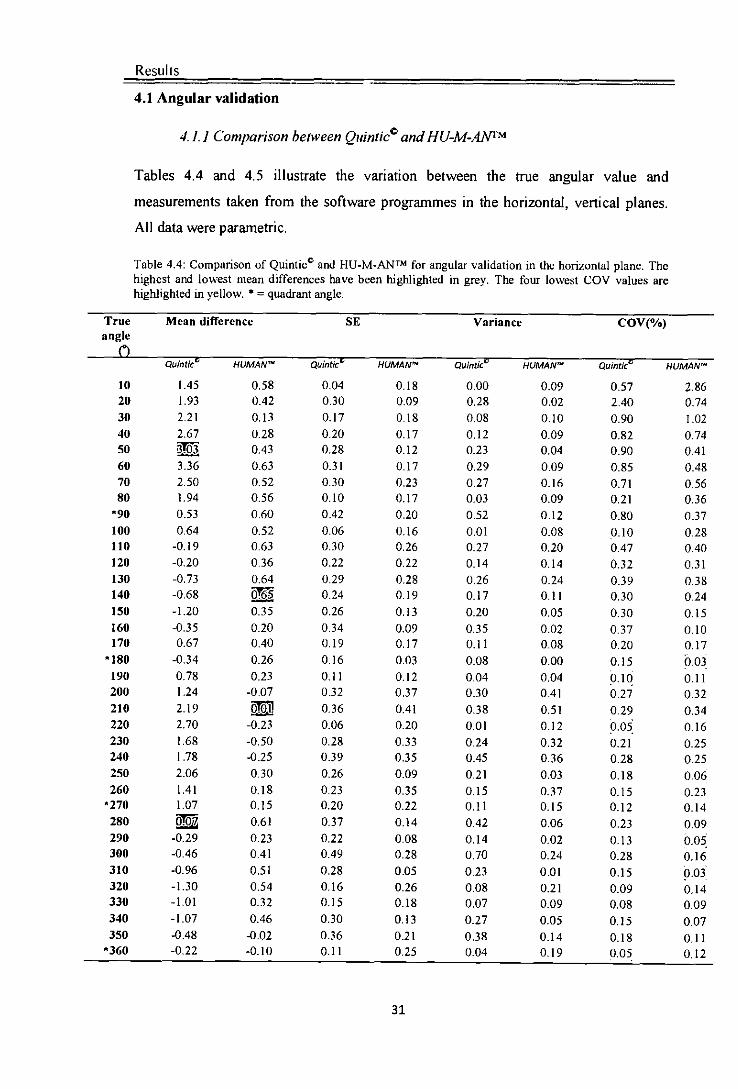
Results
4.1 Angular validation
4.1.1 Comparison between Quintic° and HUMANIM
Tables 4.4 and 4.5 illustrate the variation between the true angular value and
measurements taken from the software programmes in the horizontal, vertical planes.
All data were parametric.
Table 4.4: Comparison of Quintic ° and FIIJ.M.ANTM for angular validation in the horizontal plane. The highest and lowest mean differences have been highlighted in grey. The four lowest CCV values are highlighted in yellow. * = quadrant angle.
True Mean difference SE Variance COV(%) angle
C) Quintk HUMAN" Quint/c" HUMAN" Quint/c" HUMAN" Quint/c' HUMAN"'
10 1.45 0.58 0.04 0.18 0.00 0.09 0.57 2.86 20 1.93 0.42 0.30 0.09 0.28 0.02 2.40 0.74 30 2.21 0.13 0.17 0.18 0.08 0.10 0.90 1.02 40 2.67 0.28 0.20 0.17 0.12 0.09 0.82 0.74 50 0.43 0.28 0.12 0.23 0.04 0.90 0.41 60 3.36 0.63 0.31 0.17 0.29 0.09 0.85 0.48 70 2.50 0.52 0.30 0.23 0.27 0.16 0.71 0.56 80 1.94 0.56 0.10 0.17 0.03 0.09 0.21 0.36
*90 0.53 0.60 0.42 0.20 0.52 0.12 0.80 0.37 100 0.64 0.52 0.06 0.16 0.01 0.08 0.10 0.28 110 -0.19 0.63 0.30 0.26 0.27 0.20 0.47 0.40 120 -0.20 0.36 0.22 0.22 0.14 0.14 0.32 0.31 130 -0.73 0.64 0.29 0.28 0.26 0.24 0.39 0.38 140 -0.68 M 0.24 0.19 0.17 0.11 0.30 0.24 150 -1.20 0.35 0.26 0.13 0.20 0.05 0.30 0.15 160 -0.35 0.20 0.34 0.09 0.35 0.02 0.37 0.10 170 0.67 0.40 0.19 0.17 0.11 0.08 0.20 0.17 180 -0.34 0.26 0.16 0.03 0.08 0.00 0.15 0.03 190 0.78 0.23 0.11 0.12 0.04 0.04 0.10 0.11 200 1.24 -0.07 0.32 0.37 0.30 0.41 0.27 0.32 210 2.19 OUT 0.36 0.41 0.38 0.51 0.29 0.34 220 2.70 -0.23 0.06 0.20 0.01 0.12 0.05 0.16 230 1.68 -0.50 0.28 0.33 0.24 0.32 0.21 0.25 240 1.78 -0.25 0.39 0.35 0.45 0.36 0.28 0.25 250 2.06 0.30 0.26 0.09 0.21 0.03 0.18 0.06 260 1.41 0.18 0.23 0.35 0.15 0.37 0.15 0.23
'270 1.07 0.15 0.20 0.22 0.11 0.15 0.12 0.14 280 0=0 7 0.61 0.37 0.14 0.42 0.06 0.23 0.09 290 -0.29 0.23 0.22 0.08 0.14 0.02 0.13 0.05 300 -0.46 0.41 0.49 0.28 0.70 0.24 0.28 0,16 310 -0.96 0.51 0.28 0.05 0.23 0.01 0.15 0,03' 320 -1.30 0.54 0.16 0.26 0.08 0.21 0.09 0.14 330 -1.01 0.32 0.15 0.18 0.07 0.09 0.08 0.09 340 -1.07 0.46 0.30 0.13 0.27 0.05 0.15 0.07 350 -0.48 -0.02 0.36 0.21 0.38 0.14 0.18 0.11
'360 -0.22 -0.10 0.11 0.25 0.04 0.19 0.05 0.12
31

Results
Table 4.5: Comparison of Quintic ° and HUMANTM for angular validation in the vertical plane. The highest and lowest mean differences have been highlighted in grey. The four lowest %COV values are highlighted in yellow. * = quadrant angle.
True Mean difference SE Variance COV(%) angle
(.) Quintic' HUMAP Quintic' HUMAN" Quintic° HUMAN"' Qujntjc' HUMANtm
10 -0.23 0.54 0.14 0.16 0.06 0.07 2.41 20 -1.11 0.35 0.15 0.12 0.06 0.04 1.34
30 -1.24 0.60 0.05 0.12 0.01 0.04 0.32
40 -1.50 0.29 0.28 0.30 0.24 0.28 1.26 50 -1.33 0.54 0.16 0.20 0.07 0.13 0.55 60 -1.07 0.32 0.29 0.28 0.25 0.24 0.85 70 -0.86 0.24 0.15 0.16 0.07 0.07 0.37 80 -0.74 0.45 0.42 0.11 0.52 0.04 0.91
*90 0=0 1 0.12 0.50 0.57 0.75 0.97 0.96 100 0.87 0.25 0.17 0.13 0.09 0.05 0.29 110 2.91 M 0.12 0.36 0.05 0.40 0.19
120 2.28 0.47 0.41 0.10 0.52 0.03 0.59 130 1.81 0.29 0.62 0.52 1.14 0.80 0.81 140 M 0.37 0.21 0.17 0.14 0.08 0.26
150 1.96 0.45 0.49 0.15 0.71 0.06 0.55 160 1,47 0.54 0.21 0.08 0.14 0.02 0.23 170 0.46 -0.02 0.21 0.34 0.13 0.35 0.21
*180 -0.35 -0.17 0.32 0.11 031 0.04 0.31 190 -0.53 -0.13 0.09 0.10 0.02 0.03 0.08 200 -1.74 -0.21 0.03 0.34 0.00 0.34 0.03 210 -2.38 -0.32 0.38 033 0.43 0.33 0.32 220 -2.26 -0.16 0.26 0.11 0.21 0.04 0.21
230 -2.35 0.06 0.32 0.20 0.30 0.12 0.24 240 -1.84 0.22 0.21 0.04 0.13 0.00 0.15 250 -1.62 -0.17 0.20 0.25 0.12 0,19 0.14 260 -0.91 -0.53 0.13 0.05 0.05 0.01 0.08
*270 -0.21 -0.19 0.38 0.22 0.43 0.15 0.24 280 0.67 0.15 0.15 0.10 0.07 0.03 0.09 290 1.76 0=0 1 0.25 0.26 0.19 0.21 0.15 300 1.56 -0.22 0.17 0.10 0.09 0.03 0.10 310 1.63 -0.03 0.27 0.09 0.21 0.02 0.15 320 1.53 0.11 0.21 0.18 0.13 0.10 0.11 330 1.55 0.07 0.06 0.04 0.01 0.01 0:03 340 0.92 -0.01 0.13 0.24 0.05 0.18 0.07 350 0.71 -0.41 0.19 0.22 0.10 0.15 0.09
*360 -0.30 0.10 0.17 0.10 0.08 0.03 0.08
A comparison of angular data in the horizontal and vertical plane for both software
packages established angles measured with Quintic ° had the highest mean differences.
The Quintic° data appears to follow a trend for angles measured in both horizontal and
vertical planes. The lowest COV values are for the measurement of true angles that
correspond closely to the four quadrant angles (90°, 180°, 2700 , 3600). It seems as the
32

Results
true angle approaches the quadrant angles the software becomes more accurate at
measuring them. Angles measured with HU-M-ANTNI illustrated a different trend; larger
angles had the lower COV values comparedto smaller angles. Larger angles were more
accurately measured compared to smaller angles.
4.1.2 Effect of true angle, orientation and software
Table 4.6: Angular validation of Quintic ° and H1JMANTM for all data. Levels of significance are indicated by P<0.05; "P<0.005; "P<O.00l; NS not significant.
Variables Measured value Absolute difference
Quintic' HU-M-AN" Quintic ° HtJ-M-AN"
True angle NS
Orientation ** NS NS
True angle and orientation NS NS
interaction
Repeat NS NS NS NS Software NS
True angle and softwnre interaction NS
Analysis of the measured value established true angle and orientation were significant
covariates (P<0.001) for both software packages. Software and repeat number were not
significant factors when analysing data for measured value (P>0.05). Analysis of the
absolute difference (the difference between the true and measured values) established
difference between true and angles measured using Quintic© varied significantly,
depending on the size of the angle being measured (P<0.001). Orientation was also
established as not significant (P>0.05) for either software, however there was an
interaction between true angle and orientation using Quintic* (P<O.00I). Absolute
difference varied significantly for angles measured in the horizontal and vertical planes,
depending on the size of the angle being measured.
Software was also established as significant when analysing the absolute difference
(P<O.00l), the difference between true and measured angles were significantly different
when the same angle was measured with Quintic ° and HUMANTh. Repeat number
was not significant (P>0.05), the true angles were consistently measured when repeated
measures were taken. Figures 4.3 and 4.4 illustrate the large variation between the two
33

Results
software packages being tested. Much less variation was displayed in the HU-M-AN"
results, and these results do not appear to follow a trend. Both figures appear to follow
the same trend for Quintic ° but with a phase shift.
4
3
0
S U Cl S
-2
-3
—Quintic
—HU-M-AN
True angIe (0)
Figure 4.3: A comparison of the mean difference between true and measured angles for Quintic ° and HUMANTM in the horizontal plane.
.4
3
C S
1
-1
-2
—Quintic
—HU-M-AN
True angle (0)
Figure 4.4: A comparison of the mean difference between true and measured angles for Quintic ° and HUMANtM in the vertical plane.
34

Results
4.1.3 Fun/icr analysis of Quiniic°
Further analysis was performed on the angular results for Quintic °. The residuals, when
plotted against the true angular values, appear to follow the pattern of a sine wave.
Figure 4.5 (horizontal) is similar to a sine wave whereas figure 4.6 is similar to a sine
wave with a positive phase shift (along the x axis).
5 w C • 4. ci I-
- 15 3 ci • .1
•, . E S .5 C -. • • S C • •. • .5 : .
ci .—. .
•5 • S. I- -
1 • • • •• ci .1 • •• ci
4.. .
.Z 0 ,1 S . a ci o 90 .180 27ç! • •350 C
ci U • •• • . -1 •. S t . •.,.: o .
-2 - True angIe (0)
• First repeat
• Second repeat
. Third repeat
Figure 4.5: Difference between true and calculated angles measured in the horizontal plane using QuinticC
4
.. 1801 70
S • S.
S S I ...T
•,.
I..
.5 ! I,
2
.5 C •
w 0 • -1
.0
ci U c -2 ci
I. 0 • .• U
• S S ..
• •: S •
S .
00 90 U .. I..
U
S
S • . • • I U. •• •
U •• S.
S . U
S 380
• First repeat
• Second repeat
• Third repeat
C
.4J True angIe (0)
Figure 4.6: Difference between true and calculated angles measured in the vertical plane using Quintic °
35

Results
4.2 Dynamic validation
4.2. I Dynamic angular validation (Pendulum study)
Tables and figures 4.7-4.9 illustrate the amount of variation between the "gold standard"
Oqus system and Quintic ° and HUMANTh. All data were established as parametric.
There was no difference between any of the software programmes for the measurement
of range of motion of a pendulum when released from position A (released from an
angle of 600 from the vertical). For release positions B and C (released from angles of
30° and 200 respectively) Quintic measurements were significantly smaller than the
standard (Oqus). There was no difference between the ROM measured using HU-M-
ANTh and the standard.
Table 4.7: Comparison between variation in Quintic ° and HI.J.M.ANTM for dynamic angular measurement (ROM) of a pendulum released from three different positions. Values are in relation to the "gold standard" Oqus system.
Release Position
Mean difference SE Yarinnce %COV
Quint)? HtJ-M-AN' Quint/c 0 HU-M-AN" Quinti? HU-M-AN" Quint/c0 HU-M-AN"
A 5.65 1.56 0.57 0.33 1.62 0.55 2.38 1.29
B 4.71 1.21 0.76 0.58 2.91 1.69 6.37 4.3
C 4.19 0.66 0.35 0.41 0.61 0.82 4.17 4.08
70
60
50 0
j40
30
20
10
0
DOqus
o HU-M-AN
OQuintic
A B C
Release Position
Figure 4.7: Mean ROM of one pendulum swing from three different release positions (A, B, C), comparing Quintic ° and HU.MANTM to the "gold standard" Oqus system. (P<0.05; "Pc0.005; ***p.cO 001 denotes a significant difference from the standard and level of significance).

Results
4.2.2 Dynamic linear validation
No significant differences were established between HU-M-ANTm and the standard
(P>0.05). In all three release positions, Quintic ° measurements were significantly
shorter than the standard distance, with higher levels of significance for the longer
distances from the release positions A and B (P<0.001), compared to the shorter
distance from release position C (P<0.05).
Table 4.8: Comparison between variation in Quintic ° and J4UMANTM for dynamic linear measurement (cm) of a pendulum released from three different positions. Values are in relation to the "gold standard" Oqus system.
Release Mean difference SE Variance %COV Position
Quintic HU-M-AN" Quintic' HU-M-AN"' Quint ic HU-MAN"' Quintic' HU-M-AN"
A 13.06 0.46 1.14 0.59 6.50 1.75 2.41 1.12 B 5.98 3.45 0.98 1.05 4.80 5.55 3.88 3.58 C 5.62 3.30 0.93 0.46 4.30 1.04 5.26 2.11
140
120
E 100 U
80
60
40
20
A B C
Release Position
DOqus
QHU-M-AN
Oouintic
Figure 4.8: Mean distance travelled by the mass from one pendulum swing from three different release positions (A, B, C), comparing Quintic ° and HUMANTM to the "gold standard" Oqus system. (*Pc0.05; "Pc0.005; P<0.001 denotes a significant difference from the standard and level of significance).
37

Results
4.2.3 Velocity
No significant differences were established between HUMANTh and the standard for
measurement of velocity. Small variations were demonstrated between Quintic °
measurements and the standard (table 4.9, figure 4.9), however these variations were
only significant when the pendulum was released from position B, When the pendulum
was released from position B, it was measured by Quintic ° as being significantly faster
than the standard and HUMANTh (P<0.05).
Table 4.9: Comparison between variation in Quintic ° and HUMANTM for velocity (cmls) of a pendulum released from three different positions. Values are in relation to the "gold standard" Oqus system.
Release Mean difference SE Variance °IOCOV Position
Quintk' HU-M-AN' Quint/c 0 HLJ-M-AN" Quint/c 0 HU-M-AN" Quint/c 0 HU-M-AN"
A 22.84 0.81 6.94 7.72 240.76 298.24 8.38 8.34 B 6.11 3.68 4.19 4.27 87.68 91.21 15.78 13.81 C 7.75 4.96 2.24 2.28 25.10 26.00 8.92 7.40
250
200
E 150
U 0 4) > 100 C (0
50
A B C
Release Position
DOqus
DHU-M-AN
OQuintic
Figure 4.9: Mean velocity of the mass from one pendulum swing from three different release positions (A, B, C), comparing Quintic ° and HU.MANTM to the "gold standard" Oqus system. (P<0.05; "P<0.005; ***P<0.001 denotes a significant difference from the standard and level of significance).
38

Results
4.3 Summary
The main findings for this chapter are summarised in the table below. Table 4.10
illustrates the range in margin of error for static and dynamic validation of the two
software programmes.
Table 4.10: Range in margin of error values for static and dynamic validation of Quintic ° and
HU-M-AN'M.
Type of validation Standard measurement Error range Quintic° HU.AIANtM
Static Linear Inter-marker distance values 0.00mm- 0.00mm- ranging from 10-100cm (three 20.00mm 7.00mm orientations)
Static Angular
Dynamic Linear
Dynamic Angular
Goniometer values ranging from 10.3600 (two orientations)
Pendulum swing (distance travelled by mass)
Pendulum swing (change in angle between mass and vertical)
0.07°-3.360 0.0060-0.880
5.62-13.06cm 0.46-3.45cm
4.190-5.560 0.66°-1.560
Velocity Pendulum swing (speed travelled 6.11-22.84cm/s 0.81-4.96cm/s by mass)
39

Chapter Five: Discussion
5.0 Discussion
Static linear and angular accuracy is fundamental when analysing equine conformation;
the assessment of linear conformation traits involves the measurement of static lengths
(measuring the distance between two points on limb segments), and angles of joints
(measuring the angle between three points on the horse). Dynamic accuracy is vital
when measuring gait characteristics; dynamic linear accuracy is applicable when
measuring stride length. Dynamic angular accuracy is important when measuring range
of motion of the equine joints throughout a stride cycle. It is also important to validate
how accurately velocity is measured due to the importance of regulating velocity when
measuring stride characteristics. The reproducibility of measurements obtained using
Quinti cC and HUMANTh of linear and angular values (dynamic and static) and
velocity established small variations between repeats, however repeat had no effect on
the measurement or difference between the true and measured values (P>0.05). This
means both software packages were consistent at performing repeated measures of the
same value. Consistency is an important part of determining how accurate and
appropriate the software is for equine biomechanics research; repeated measures have to
be taken to obtain baseline measurements due to the intrinsic variability in equine gait
(Clayton and Schamhardt, 2001). Static linear validation established higher variation
between repeats using HU-M-AN, %COV values ranged from between 0.01-3.80%,
whereas the majority of %COV values for QuinticC were 0%. The same video clips
were analysed with both software packages, therefore experimental set-up was
discounted as a source of error in the discrepancy between the two software packages.
Digitiser error may be a causal factor, due to the manual input required for digitising
each video clip. Digitiser error affects the accuracy and reliability (repeatability) of the
data obtained (Wilson etal., 1999). Digitiser error often occurs when manually aligning
the crosshairs over the marker in question; the cross hairs must be accurately positioned
to gain accurate results. Surprisingly, when comparing manual and automatic
digitisation, Wilson ci al. (1999) demonstrated manually digitised clips were more
accurate than automatically digitised clips, with a mean error of 0.1530 for the manually
digitised clips, compared to 0.223° for the automatically digitised clips, when
comparing dynamic angular values (Wilson cia!, 1999). The authors suggest this could
be due to distortions in the spherical markers. The software will recognise the pixels
comprising the marker and automatically calculate the centre point. This automatic
identification will be limited if distortions occur (if the camera or marker is rotated out
of plane), or due to varying light conditions making identification of the pixels 40

Discussion
inaccurate. Manual digitisers can identify the centre of the marker regardless of uneven
lighting (although distortions may still be a cause of error). This source of error was
also noted in research by Scholtz (1989). Conversely, automatically digitised clips
produced more reliable results; errors that did occur were more consistent compared to
manually digitised clips. The authors suggest this could be due to a systematic fault with
the software (although this was not tested), however it could also be due to inherent
inconsistencies when manual input is required for a repetitive task. This could also
explain the differences in the coefficient of variation between repeats when analysing
dynamic accuracy and static angular accuracy in the present study; differences were
much greater for the dynamic results compared to the static ones. It is possible the effect
of digitiser error was amplified due to the movement of the markers; as the camera
recorded at a relatively low frame rate (50 Ri) the markers were not as clear as they
would have been using a high speed camera. Quintic© measurements were significantly
smaller than the standard for all types of dynamic validation (P<0.001). HUMANTh
results were smaller but not significantly, (apart from dynamic length from release
position B) where HU-M-ANTm measurements were significantly longer than the
standard (Pc0.05). The manual digitisation of clips requires the researcher to pinpoint
the start of movement of the pendulum (compared to Oqus where the start of motion is
automatically detected). It is feasible that the researcher could not detect the initial start
of movement as it was too subtle, therefore less frames were digitised leading to smaller
measurements.
Analysis of the %COV for Quintic ° when measuring static angles, revealed the lowest
values correspond closely to quadrant angles (900, 1800, 2700, 360°). When the true
angle approached values equivalent to quadrant angles, the angles were measured more
accurately; as angles deviated away from quadrant angles the angles were measured less
accurately; up to 3.36° for the true angle of 60 ° . It is possible that due to the manual
input required for digitisation, angles that are easily identifiable (quadrant angles) are
more accurately measured. This is only the case for Quintic° however, as %COV values
for angular validation in HUMANTh do not follow the same trend. Manual input
required for motion analysis is a limitation of the method. This is one possible cause of
the difference in variation in dynamic accuracy between the standard (Oqus) and tested
softwares. Oqus automatically digitises, which as previously discussed produces more
consistent results compared to manual digitisation. Variation was less for linear, angular
and velocity measurements using Oqus compared to the other two software
41

Discussion
programmes. Manual input error was reduced for the present study as just one
researcher digitised all video clips.
Using mean difference as an indicator of static linear accuracy, it was established that
both software packages were within an acceptable margin of error for use in equine
biomechanics research (<10mm) for linear measurements, and orientation had no effect
on accuracy (P>0.05). In clinical research an error of <3.5mm is considered acceptable
(Klein and De Haven, 1995). Dynamic linear validation established much larger
differences for both programmes, although there was only a significant difference
between Quintic° and Oqus (P<0.001). It can be stated that HU-M-AN'°" is
significantly more accurate than Quintic ° in static and dynamic linear measurements;
when analysing the difference between true and measured distances there was a
significant difference between the two software packages (P<0.001). Static linear
validation of Quintic© established a mean margin of error of between 0mm and 20mm
compared to HUMANTh, where mean margin of error ranged from 0mm to 7mm.
Errors that occurred were both positive and negative (the systems over estimated and
under estimated lengths on different occasions). The overall mean errors for each
software were 6mm for Quintic °, and 3mm for FW-M-AN'. These errors are
comparable to other software programmes, where reported errors range from 0.53mm
for the Elite Plus system, to 11.61mm for the Ariel Performance Analysis System
(Chiari ci at, 2005). The majority of systems had a reported mean margin of error of
between 2 and 8mm (within the range of error for RU-M-ANTm but not Quintic ©). The
maximum errors reported on these systems were +28.23mm (Video Locus); -26.3mm
(Ariel) and +24.07mm (Ariel Performance Analysis System). The maximum errors
reported for these systems are greater than the maximum errors reported for Quintic ©
and HUMANTh. True length had a significant influence on accuracy for both
software packages (Pc0.001); margin of error was dependent on the length being
measured as some length measurements were more accurate than others. Lengths that
demonstrated the most error were between 50cm and 90cm for both software packages.
Both packages were more accurate at measuring lengths of 10cm and 100cm, rather
than mid-range lengths. One difficulty is the accuracy to which Quintic© measures
linear distances. Quintic ° only allows linear distances to be measured to one decimal
place (compared to HU-M-AN" where distances can be measured to three decimal
places). This means that a difference of less than 10mm with QuinticC would be
measured as zero, whereas with HU-M-AN, this difference could be between 0.000
42

Discussion
and 9.999mm. This has led to more true lengths having an error of zero when measured
with Quintic°, compared to 1-IIU-M-AN°", making direct comparisons between the two
software programmes difficult. The range in margin of error for dynamic validation was
larger than previously reported values. Degueurce etal. (1996) reported a mean margin
of error of <5mm for the dynamic validation of a 3D motion analysis programme 3D
Vision); Linden ci at (1992) reported a mean margin of error of 4.4mm for the Motion
Analysis programme. 3D motion analysis is fundamentally more accurate than 2D,
therefore it is hard to make direct comparisons between the two. Similarly for dynamic
angular validation, a greater margin of error was established for Quintic © compared to
HU-M-AN'; HUMANTh error values were comparable to previously validated
dynamic angular accuracy of Ariel Performance Analysis System (Wilson cial., 1997)
thathad amean errorofo.18 °. Quintic° margin of error was much higher.
Static angular validation established more variation in the absolute difference values in
Quintic© , compared to HU-M-AN, there was a significant difference between the two
software packages when analysing the absolute differences (P<0.00I). The mean
difference with Quintic° varied depending on the size of the angle being measured, true
angle was a significant factor when analysing absolute differences with Quintic ©
(P<0.001), but not HU-M-AN'' (P>0.05), there was also an interaction between true
angle and orientation using Quintic °, but not HUMANTh. Quintic° was more
accurate at measuring some angles compared to others; and this variation depended on
the orientation of the goniometer. The error values calculated for HU-M-ANTm were
consistent with previous angular validation of motion analysis systems. Error values of
between 0.03° (Klein and De Haven, 1995) and 0.50 (Scholtz, 1989; Linden cial., 1992)
were established, although these systems are 3-D rather than 2-D. The error values
calculated for Quintic° were much greater than the majority of previous validation
studies, except Linden ci al. (1992) when measuring 180°. Angles <180° were measured
with a error of 0.5 °, however the error for 1800 angles was much greater, and similar to
the Quintic° error value (between 1.50 and 2.4°). Linden cial. (1992) suggested this was
due to the cosine algorithm used to calculate angles, and the software is more inaccurate
when calculating 180° angles as the cosine approaches one and the opposite side
becomes very small. There is however a problem with this theory as the cosine of 180°
is actually minus one, and the opposite side of an 180° angle is very large (not small).
This would make more sense as a theory of why Quintic ° has varying accuracy; as
Quintic° is actually more accurate when measuring quadrant angles (including 180°),
43

Discussion
not less accurate (as Motion AnalysisTh was). There is however another problem with
the error values for Quintic ©-they follow a specific pattern
In addition, the residuals, when plotted against the true angular values follow the pattern
of a sine wave. This could be due to two factors; cosine algorithms and aspect ratio.
Motion analysis software uses mathematical algorithms to calculate angles, the cosine
rule is often used as an algorithm (Linden cial., 1992). The cosine rule is used as it
allows angles within a triangle to be calculated providing the lengths of the sides are
known. There are no details available specifying what algorithms Quintic ° software
uses, therefore it can only be suggested that the cosine rule is being used (due to the
pattern of the residuals). Angular measurement using motion analysis software requires
three markers (one at each corner of the triangle), the software will measure the lengths
of each side of the triangle and use the cosine algorithm to calculate the required angle.
It is possible that the software has a fault in the algorithm that it uses to calculate angles,
leading to a variation in accuracy when angles of different sizes are measured. Previous
research that has validated static angular accuracy has suggested the cosine algorithm to
be a cause of inaccuracies (Linden ci al., 1992). This research however noted angles
became less accurately measured at 1800 (whereas the current study noted better
accuracy for this angle).
Aspect ratio of the camera used to record the clips could also be contributing to the
angular inaccuracies. Aspect ratio is the image width divided by the height, most normal
digital video cameras record at an aspect ratio of 4:3. The video camera in this study
recorded at an aspect ratio of 4:3, therefore the image was 1.3 times wider than it was
high (in other words the image was stretched by 1.3). When calibrating the video clips
with HUMANTh, aspect ratio is taken into account, however there is no option using
Quintic° to calibrate for the aspect ratio of the camera being used. It appeared to be less
of an issue when measuring linear lengths (lengths are measured only along one axis; x
or y). When calculating angles, lengths are measured along three sides, therefore any
distortions that may occur due to aspect ratio will be enhanced. This could be the reason
why there was a significant interaction between true angle and orientation when
analysing Quintic° results. An image recorded horizontally would be more "stretched"
than an image recorded vertically, due to the aspect ratio. Higher variation was
established in the horizontal compared to the vertical plane when analysing Quintic °
results. The aspect ratio can be accounted for by calibrating the video clips in the x and
y plane. If aspect ratio cannot be accounted for, or there is a fault with the method of
-4

Discussion
calibration, the number of pixels comprising the length in either the x or y orientation
will be incorrect with respect to the 4:3 image size. The inaccuracies of angular
measurements in Quintic© can be reduced by minimising the sine effect of the residuals.
A correction formula has been developed (using the sine of the measured angle) and a
correction factor (calculated from the mean differences). The correction formula is;
corrected angle = 9+ ((sinO2)2. 21))
This correction formula was applied to all the angular data obtained from Quintic ° and
the results re-analysed (figure 5.0 and 5.1).
4
3 I, CI
.5 C
CI
2 -1
-2
- Before
—After
True angle (degrees)
Figure 5.0: Qurntic° angular measurements before and after sine correction was applied (horizontal).
CI CI
CI -5
C CI
g CI
3
—Before
—After
011
-3
True angle (degrees)
Figure 5.1: Quintic© angular measurements before and after sine correction was applied (vertical).
45

Discussion
Table 5.0: Validation of sine corrected data for angular validation of Quintic ° . Levels of significance are indicated by P<0.05; "P<0.005; P<0.001; Nsnot significant.
Variables Measured value Absolute difference
True angle
Orientation S..
True angle and orientation
interaction
Repeat
NS NS
Software
NS **
Figures 5.0 and 5.1 demonstrate the sine correction formula is more effective for angles
measured in the vertical plane. When analysing the corrected results (table 5.0), true
angle size was still a significant factor (Quintic 0 measures angles of difference sizes
more accurately than others), however orientation became a significant factor for the
absolute difference whereas previously it was not (table 4.6 in chapter four). This is
probably because due to the aspect ratio, there is less distortion vertically than
horizontally. Software was still a significant factor when analysing the absolute
difference, therefore FHJMANTh was still significantly more accurate than Quintic ° .
It was decided from the results of this validation study that HU-M-AN'" is a more
accurate and reliable software programme to be used for two-dimensional motion
analysis research. Bearing in mind the equipment available (normal digital video camera
recording at an aspect ratio of 4:3), HUMANTh was used for analysing video clips for
the further two parts of this study.
Erl

PART It
Standardisation of two dimensional niolion analysis techniques to establish baseline
data.

Chapter Six: Aims and Objectives
6.0 Aim
The aim of part II of this study was to standardise a method to obtain baseline
conformation and gait parameters using two-dimensional motion analysis techniques,
by establishing intra-horse variation (variation within individual horses over five
consecutive days).
6.1 Objectives
i) Obtain measurements for static conformation for the left and right side of three horses
for five consecutive days.
ii) Obtain measurements for stride length and range of motion for the left and rigjn side
of three horses for five consecutive days.
iii) Use statistical methods to determine intra-horse variation for the trial.
6.2 Hypothesis
I) There will be no intra-horse variation in conformation between sides
ii) There will be no intra-horse variation in conformation between days
iii) There will be no intra-horse variation in stride characteristics (stride length or range
of motion) between sides.
iv) There will be no intra-horse variation in stride characteristics (stride length or range
of motion) between days.
47

Methodology
7.0 Subjects
The subjects consisted of three horses; two geldings and one mare of various breeds
(Thoroughbred, Anglo-Arab, Cob). Mean age 10±3.46 years; mean height
154.43±1.02cm. The horses had a similar workload (medium work) and kept in the
same management routine throughout the trial.
7.1 Instrumentation
Video clips were downloaded using Quintic © Biomechanics 9.03 v14 (splitting each
frame into two fields) and digitised using 1-[U-M-AN' (21)) v6.0 (validated and
determined accurate in part I). In addition to this, hardware used included a Sony DV-
tape digital video camera (HDR-FXI 000) recording at 50 hertz (25 frames per second),
and a Fujitsu Siemens laptop for downloading the video clips. A wooden cube
(SOcmxsOcm) was used to provide a reference length and aspect ratio for calibrating the
video clips.
7.2 Anatomical markers
7.2.1 Dynamic and static marker sets
The majority of two dimensional motion analysis techniques use anatomical markers to
measure joint ROM, usually placed at the centre of rotation of the joint to be measured
(Clayton and Schamhardt, 2001). Anatomical markers used to assess conformation are
often placed on the distal and proximal ends of limb segments (Holmstrom c/al., 1990)
as lengths of limb segments as well as angles of joints are being measured. Providing
the marker position is known with respect to joint angles, and in a well known position
on the horse, the exact marker site has no influence on the accuracy and value of final
kinematic data (Schamhardt ci at, 1993). One marker set was adapted from Holmstrom
ci at, (1990) and Degueurce ci al., (1997) to allow static conformation and dynamic
ROM to be measured. The location of the anatomical markers can be seen in figure 4.0
and table 4.0. A marker was also located at the approximate centre of mass, to
determine velocity for each horse (adapted from Buchner etal., 2000). lntra-horse ROM
varies depending on which joints are being measured (Degueurce ci al., 1997); therefore
both proximal and distal limb joints were investigated. In total, eight joints were
analysed for ROM; four proximal joints of the fore and hind limb (scapulohumeral,
humeroradial, coxofemoral, femorotibial) and four distal joints of the fore and hind limb
(carpal, metacarpophalangeal , tarsal, metatarsophalangeal ). The marker set identified
48
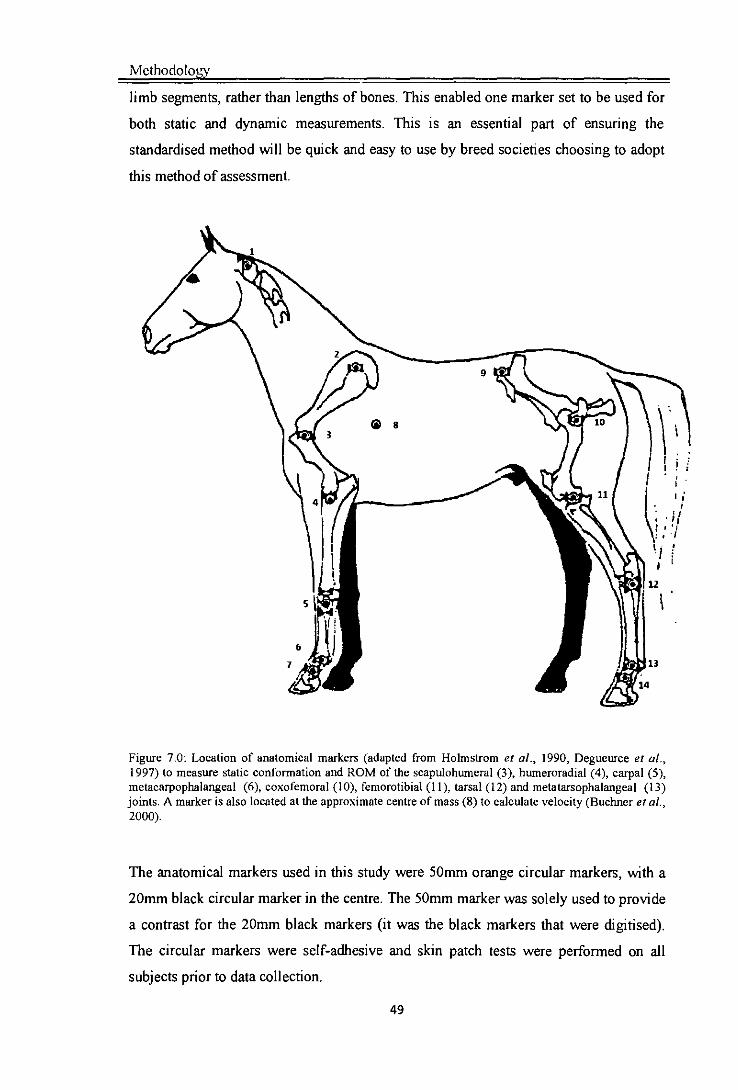
Methodology
limb segments, rather than lengths of bones. This enabled one marker set to be used for
both static and dynamic measurements. This is an essential part of ensuring the
standardised method will be quick and easy to use by breed societies choosing to adopt
this method of assessment.
Figure 7.0: Location of anatomical markers (adapted from Holinstrom et al., 1990, Degueurce et al., 1997) to measure static conformation and ROM of the scapulohumeral (3), humeroradial (4), carpal (5), metacarpophalangeal (6), coxofemoral (10), femorotibial (II), tarsal (12) and metatarsophalangeal (13) joints. A marker is also located at the approximate centre of mass (8) to calculate velocity (Buchner etal., 2000).
The anatomical markers used in this study were 50mm orange circular markers, with a
20mm black circular marker in the centre. The 50mm marker was solely used to provide
a contrast for the 20mm black markers (it was the black markers that were digitised).
The circular markers were self-adhesive and skin patch tests were performed on all
subjects prior to data collection.
ESII

Methodology
Table 7.0: Location of the anatomical markers in conjunction with figure 4.0, adapted from Holmstrom ci al. (1990), Degueurce etal. (1997).
Hind limb
Proximal end of the spine of the scapula (2) Anterior part of the tuber coxae (9)
Caudal part of huineral head (3) Greater trochanter (10)
Proximal part of shaft of radius (4) Lateral epicondyle of the femur (11)
Centre of third and fourth metacarpal bones (5) Lateral side of the talus (12)
Distal end of third metacarpal bone (6) Distal end of the third metatarsal bone (13)
Distal end of the proximal phalanx (7) Distal end of the proximal phalanx (14)
7.3 Filming procedure
Filming took place in an outdoor arena (the surface consisted of sand and rubber fibre).
The equipment was set up prior to horses entering the arena (see figure 7.2 for
experimental set-up). Prior to any horses being filmed, a calibration video was filmed in
order to calibrate the videos after downloading. This involved filming a calibration cube
(SOxSOcm) that was positioned in the field of view (same position the horses would be
filmed), and in the centre of the video camera's optical axis. The calibration cube served
three purposes; to ensure the equipment set up was perpendicular to the video camera;
as a measurement of scale for subsequent video analysis; as a measurement of aspect
ratio for subsequent video analysis. The calibration cube was recorded for three
seconds, then removed from the field of view before filming of the horses began.
Horses were led passed the equipment for ten minutes before recording took place. This
habituated horses to the video analysis equipment as well as warming the horses up
before recording. Filming took place at the same time each day (7-9am) and horses were
filmed in the same order each day.
7.3.1 Conformation assessment
Conformation was measured using a quantitative method adapted from Holmstrom ci
al. (1990), based on the methods developed by Magnusson (1985). These authors used
measurements obtained from static photographs to measure traits (with direct
measurements for reference lengths). This method was developed to use a digital video
camera to record the horses, and two-dimensional motion analysis software to measure
the traits. A calibration cube was used for reference lengths. Horses were stood square
(equally weight bearing on all four limbs) in the calibrated field and held by a handler.
A rectangle (2x6m) was marked out in the arena surface (see figure 7.2) to ensure the
50

Methodology
horse was perpendicular to the video camera, and stood square. Each horse was
recorded for three seconds on the left and right side. This process was repeated on each
day of the trial, giving a total of five repeats for each side. The linear and angular traits
measured can be seen in figure 6.1.
/ /
-
E
V
K
Figure 7.1: Flow static conformation traits were measured (horse stood square and weight bearing) and position of anatomical markers (adapted from Holmstrom etal., 1990 and Degueurce etal. 1997). Linear traits measured; (A) neck; (B) scapula; (C) humerus; (D) radius; (E) metacarpal; (F) fore proximal phalanx; (0) ilium; (H) femur; (I) tibia; (J) metatarsal; (K) hind proximal phalanx. Angular traits measured; (I) neck; (2) scapulohumeral; (3) humeroradial; (4) metacarpophalangeal; (5) coxofemoral; (6) femorotibial; (7) tarsal; (8) metatarsophalangeal joints.
7.3.2 Stride length and range of motion assessment
Stride length and ROM were assessed in trot only. Horses were led in hand (by the same
handler to maintain consistency) passed the video camera through the calibrated field of
view, at a distance of 7m from the video camera (see figure 7.2) in order to capture one
full stride (one full stride cycle was determined as mid-stance to mid-stance of the near
fore limb). A ground pole was placed at the back of the calibrated field of view to assist
the handler in leading the horse in a straight line.
Repeated measures were taken for each horse; ten repeats for each side (left and right)
over five consecutive days giving 20 repeats for each horse for each day (a total of 100
repeats were recorded for each horse for the whole five day trial). Taking repeated
measures to obtain baseline measures is a standard procedure in equine biomechanics
51

Methodology
research, however number of repeats suggested as suitable varies, Figures of between
three repeats (Drevemo ci al., 1980a) and 12 repeats (Clayton el at, 2002) have been
reported. Subjects in this investigation were recorded over five consecutive days,
therefore it was decided ten repeats (on each side) was a sufficient number.
Rectangle (2x6m) marked on the arena surface
Direction of horse
Jump pole on blocks (as barrier) and ground pole
video camera and tripod
p Distance from camera
Figure 7.2: Set up of filmthg equipment in the arena.
Horses were recorded in the same order each day (horse 1-3), however left and right
side could not be recorded simultaneously. This is because only one camera was
available that recorded at the required specification (50 hertz). Order in which the left
and right sides were recorded was alternated for each day. This was to minimise the
effect of repeat number on stride length or ROM.
zmt
J
52

Methodology
7.4 Analysis of videos
Video clips were downloaded using Quintic © Biomechanics 9.03 v14. The videos were
downloaded (using a Belkin firewire 2.0 Expresscard") and compressed using a
Microsoft MPEG-4 video codec (version 2). The video file compression splits each
frame into two fields (vertical and horizontal) and converts the file into an avi format.
Files were then imported into HUMANTh (213) v6.0 for analysis.
7.4.1 Scale and aspect ratio
Prior to digitisation video clips were calibrated for scale and aspect ratio. To calibrate
the scale, vertical and horizontal lines were drawn on the calibration cube and the true
length entered (50cm). The software calculates the scaling factor and this figure was
recorded. To calibrate aspect ratio, top left, top right, bottom left and bottom right
corners of the cube were digitised (in order), and the aspect ratio recorded. The figures
for scale and aspect ratio were entered for each video clip analysed in order to calibrate.
7.4.2 Digitisation
A trial subsequence for each clip was created (this included only the frames that were
being analysed). One full stride was determined from mid-stance to mid-stance (when
the limb was vertical and in contact with the ground), therefore frames before or after
the required frames were discarded. A trial was created to connect anatomical markers,
and define the angles being measured. This involved linking the required points and
defining from which points the ROM would be calculated. Manual digitisation of the
clips involved linking the markers for each frame (one full stride length consisted of 30-
40 frames). Fore and hind limb were digitised separately. Before SL and ROM could be
calculated, data smoothing was applied. To calculate linear velocity the centre of mass
marker was digitised separately for one full stride length.
53
Methodology
7.4.3 Data smoothing
The majority of data obtained from motion analysis is low frequency (Chiari ci al.,
2005). This data is often smoothed to remove the high frequency noise associated with
data collected using two dimensional motion analysis techniques (Howarth and
Callaghan, 2009). HUMANTh uses a low pass, second order Butterworth filter for
data smoothing. This is an appropriate filter for analysis of low frequency data. The
high frequency noise can be caused by impact (hoof strike) or distortions from soft
tissue artefact. The amount of noise will vary depending on which joint is being
analysed, therefore data for each joint was smoothed individually. Cut off frequencies
for the majority of human movement data is between 4 and 8 Hertz (Bartlett, 2007). The
cut-off frequency for this investigation was 10 Hertz due to the larger amplitude of
movement in equine compared to human subjects. Data smoothing using this technique
will remove any data above the cut off frequency (removing high frequency data)
therefore leaving the low frequency data that represents the movement of the horse,
rather than the distortions.
7.5 Statistical analysis
Descriptive statistics were calculated for the data for intra-horse variation and inter-
horse variation. Descriptive statistics included mean difference (the difference between
the true and measured value), standard error, variance (the distance of the data from the
mean value) and the coefficient of variation (the standard deviation as a percentage of
the mean, which allows data sets of different values to be compared). All data were
tested for normality with an Anderson-Darling normality test. If data were established
as non-parametric, skew was determined with a histogram. If data were skewed, data
were transformed. For positively skewed data, the transformations 'Ix, log x, were
used. For negatively skewed data the transformations x 2, x3 and antilog x were used.
Data were then re-tested for normality.
Intra-horse and inter-horse variation and intra-group variation were established for each
subject and all subjects for conformation, stride length and ROM. Parametric data was
tested using a GLM with day, repeat and side as covariates. Non parametric data was
tested with a Kruskal-Wallis. To determine where differences occurred, a post-hoc
Tukey comparison was used.
54

Methodology
Correlations were performed between stride length and ROM data with velocity to
determine if a significant relationship existed. Parametric data were tested with a
Pearson correlation, non parametric data were tested with a Spearman correlation (on
ranked data). Regression analysis was also performed to determine the strength of the
relationship.
55

('hapter Eight: Results
8.0 Intra-horse variation
8.1 Variation in confonnation
All data were established as parametric, tables 8.0-8.2 show results for subjects one-
three. For subject one (table 8.0), traits that measured linear distances (lengths of bones
segments) had lower SE values compared to traits that measured angular values (joint
angles). There was a large variation between SE values for all conformational traits for
subject two (table 8.1), with no apparent pattern between linear or angular traits (unlike
subject one). Similarly to subject two, there was no obvious trend to the results for
linear and angular conformation traits for subject three (table 82).
Table 8.0: Intra-horse variation for conformation for subject one for the five day trial. Traits with the highest and lowest %COV values are highlighted in grey.
Trait N Mean SE SD Variance %COV Neck (cm) 10 79.44 2.10 6.64 44.07 8.36 Scapula (cm) 10 49.95 1.08 142 11.69 6.84 Humerus (cm) 10 28.82 1.02 3.24 10.47 11.23 Radius (cm) 10 51.13 1.32 4.18 17.49 8.18 Metacarpal (cm) 10 28.99 0.82 2.59 6.70 8.93 Proximal phalanx (!i .Q ft4 14.64 Ilium (cm) 10 32.60 0.41 1.28 1.64 3.93 Femur (cm) 10 40.17 0.74 2.35 5.50 5.84 Tibia (cm) 10 44.41 1.71 5.42 29.34 12.20 Metatarsal (cm) 10 38.21 0.41 1.31 1.71 3.42 Poximal phalanx (cm) 10 11.90 0.19 0.61 0.37 5.13 Neck () 10 67.56 1.02 3.23 10.42 4.78 Scapulohumeral
( i.7i ?Bii IF 174 Humeroradial () 10 124.60 0.91 2,88 8.28 2.31 Metacarpophalaageal C) 10 139.93 0.94 2.98 8.90 2.13 Coxofemoral (°) 10 108.81 1.90 6.01 36.06 5.52 Femorotibial (°) 10 169.44 2.20 6.95 48.35 4.10 Tarsus (0) 10 168.96 1.45 4.59 21.05 2.72 Metatarsophalangeal (0) 10 145.66 1.37 4.32 18.70 2.97
56

Results
Table 8.1: Intra-horse variation for conformation for subject two for the five day trial. Traits with the highest and lowest %COV values are highlighted in grey.
Trait N Mean SE SD Variance %COV Neck (cm) 10 76.39 1.67 5.29 27.98 6.93 Scapula (cm) 10 47.84 0.56 1.76 3.11 3.69 Humerus (cm) 10 25.74 0.52 1.65 2.72 6.41 Radius (cm) 10 52.88 0.78 2.45 6.01 4.64 Metacarpal (cm) 10 28.84 0.42 1.32 1.74 4.58 Proximal phalanx (cmi öT74 oTTo o9s OTO i Ilium (cm) 10 38.34 0.61 1.93 3.71 5.03 Femur(cm) 10 37.58 0.53 1.66 2.77 4.43 Tibia (cm) 10 44.63 0.94 2.98 8.88 6.68 Metatarsal (cm) 10 41.11 0.36 1.14 1.29 2.77 Proximal phalanx (cm) 10 10.41 0.18 0.57 0.32 5.47 Neck () 10 63.15 1.15 3.62 13.13 5.74 Scapulohumeral (°) 10 86.13 1.77 5.58 31.18 6.48 Humeroradial (C) 10 119.31 1.01 3.20 10.24 2.68 Metacarpophalangeal (C) 10 154.23 1.07 3.39 11.50 2.20 Coxofemoral (C) 10 105.62 1.87 5.92 35.03 5.60 Femorotibial (C) 10 158,49 1.54 4.88 23.85 3.08 Tarsus () 10 164.76 0.93 2.94 8.61 1.78 Metatarsophalangeal( .P 150.09 OT 2T4 1T7
Table 8.2: Intra-horse variation for conformation for subject three for the five day trial. Traits with the highest and lowest %COV values are highlighted in grey.
Trait N Mean SE SD Variance %COV Neck (cm) 10 62.97 1.53 4.83 23.32 7.67 Scapula (cm) 10 48.51 0.75 2.37 5.60 4.88 Humerus (cm) 10 26.24 0.46 1.44 2.07 5.48 Radius (cm) 10 50.39 1.21 3.83 14.64 7.59 Metacarpal (cm) 8 27.46 0.72 2.04 4.17 7.44 Proximal phalanx (cm) 8 10.38 0.40 1.14 1.29 10.96 flium(cm Ioø Femur (cm) 10 42.49 0.61 1.92 3.68 4.52 Tibia (cm) 10 38.80 0.67 2.12 4.49 5.46 Metatarsal (cm) 8 37.35 0.53 1.49 2.23 4.00 Proximal phalanx (cm) 8 10.71 0.36 1.03 1.06 9.61 Neck () 10 76.97 1.92 6.07 36.82 7.88 Scapulohumeral (C) 10 81.85 1.28 4.06 16.49 4.96 Humeroradial () 10 121.85 2.27 7.18 51.55 5.89 Metacarpophalangeal (°) 8 141.80 0.90 2.54 6.47 1.79 Coxofemoral () 10 119.66 0.78 2.46 6.05 2.06 Femorotibial (C) 10 156.97 1.51 4.77 22.70 3.04 ___ [30 Metatarsophalangeal C) 8 142.50 0.74 2.09 4.37 1.47
57

Results
8.2 Investigating the effect of day and side on conformation
8.2.1 Subject One
Two traits were established as significantly different between days. Figure 8.0
demonstrates length of neck decreased from day one to three, then remained at a
constant length for the rest of the trial. Scapuiohumeral angle increased from day one to
two and decreased on day three. The angle increased again on day four, before
decreasing on the final day. Length of neck varied significantly between left and right
side, whereas scapuiohumeral angle did not (table 8.3).
Table 8.3: Effect of day and side on conformation for subject one. Levels of significance are indicated by pc0.05; **PJ.005 ; *Pc0 .00I NS not significant.
Trait Day Side
F- Value P-Value
Neck (cm) **
Scapulohumeral fl * NS
88
95
86
84
82
-C
t 80 C
.2 78 C
72
90
0
85 w C
80 —s—Neck
—t--Scapulohumeral
75
70
70
0 1 2 3 4 5 6
Day
Figure 8.0: Variation in static conformation (neck length (cm) and scapulohumeral angle (°)) between
days for the left side for subject one.
58

Results
8.2.2 Subject Two
Six traits were established as significantly different between days for subject two all of
which were linear traits (table 8.4). Figure 8.1 demonstrates that length of neck and
scapula followed a similar pattern. Length did not vary between days one, two or three
but decreased significantly on day four and five. Length of humerus and metacarpal
followed the same pattern; with almost identical measurements. The length of these
traits did not vary between days except for a decrease on day four. Figtire 8.1
demonstrates small variation in length of radius between all days, however the only
significant variation was the decrease in length on day four. Length of tibia did not vary
between day one and two, but decreased significantly on day three. There was no
variation between day three and five for this trait.
Table 8.4: Effect of day and side on conformation for subject two. Levels of significance are indicated by
p<0.05; **PC.005; "P<0.001 NS not significant,
Trait Day Side
P-Value P-Value
Neck (cm) * NS
Scapula (cm) * NS
Humerus (cm) * **
Radius (cm) * *
Metacarpal (cm) * *
Tibia (cm) * NS
Tarsus fl NS *
100
90
80-
70
- 60-
Neck
C —4--Scapula -: s° C —I—Humerus
E .2- 30-
—I— Radius -c
0 Metarpal 20
-s —I—Tibia 10
0 - p I p I I
0 1 2 3 4 5 6
Day
Figure 8.1: Variation in static conformation (length of neck, scapula, humerus, radius, metacarpal and
tibia (cm)) between days for left side for subject two.
59

Results
8.2.3 Subject Three
Angular traits were established as significantly different between days for subject three
(table 8.5). Figure 8.2 demonstrates that tarsal angle decreased significantly on day
three, but tarsus angle on day one and two were the same. Humeroradial angle did not
change between day one and two, but increased significantly between day two and four.
Humeroradial angle then decreased significantly on day five (although this angle was
the same as humeroradial angle on day three). Scapulohumeral angle did not vary
between day one to five consecutively, however days three and four scapulohumeral
angle were significantly larger than day one.
Table 8.5: Effect of day and side on conformation for subject three. Levels of significance are indicated by P<0.05; **P<0.005; P<0.001; NS not significant.
Trait Day Side P-Value P-Value
Femur (cm) NS
Scapululohumeral (0) * NS
Humeroradial (0) ** NS
Femorotibial (°) NS **
Tarsusfl * NS
180
f 160 •-.
o 140
120 S c 100 15
80 c •___ _ —e--Scapulohumeral 15
60 —t-Humeroradial
£ 40 ——Tarsus
C 20
0•
0 2 4 6
Day
Figure 8.2: Variation in static conformation (scapulohumeral, humeroradial and tarsus angle (°)) between days for left side for subject three.

Results
8.3 Variation in stride length and velocity over five consecutive days
Tables 8.6-8.8 illustrate intra-horse variation in stride length and velocity over five
consecutive days. Data for stride length and velocity showed considerably higher
variance and %COV than conformation data for all subjects. Similarly for all subjects,
right side velocity had the highest SE value, and left forelimb stride length had the
lowest.
Table 8.6: Intra-horse variation for stride length in trot and velocity for subject one for all days. Variables with the highest and lowest %COV are highlighted in grey.
Variable N Mean SE SD Variance %COV Parametric
Left FSL' 50 23104 11493 fl]J 222.84
Right FSL 50 223.65 21.88 3.09 478.79 9.78
Log right FSL 50 /
Left HSL 50 233.66 20.08 2.84 403.28 8.59
Right HSL 50 223.01 28.34 4.01 803.14 12.71
Log right HSL 50 1'
Left velocity 50 318.60 29.71 4.20 882.42 9.32
Log left velocity 50 /
Right velocitj TO 314.88 ji 2622.58 T6 2-6
Log right 50 1'
Table 8.7: Intra-horse variation for stride length in trot and velocity for subject two for all days. Variables with the highest and lowest %COV are highlighted in grey.
Variable N Mean SE SD Variance °IOCOV Parametric
LeftFSJj 0 236.99, t8l.9
Right FSL 48 220.44 23.97 3.46 574.72 10.88
Left HSL 50 229.05 24.64 3.48 606.91 10.76
Right HSL 48 220.32 33.69 4.86 1135.18 15.29
Leftvelocity 50 324.08 38.34 5.42 1469.94 11.83
KigtLt ~velo city, W8 305.33: b81 581.15 64
61

Results
Table 8.8: Intra-horse variation for stride length in trot and velocity for subject three for all days. Variables with the highest and lowest %COV are highlighted in grey.
Variable N Mean SE SD Variance %COV Parametric
Left FSL' 50 239.38 jI J3 384.52
Log left FSL 50
Right FSL 50 220.78 22.87 3.23 523.15 10.36
Log right FSL 50 1
Left HSL 50 235.54 24.88 3.52 619.21 10.56 Right HSL 50 218.33 22.80 3.22 519.80 10.44 * Left velocity 50 312.47 33.10 4.68 1095.42 10.59
Log left velocity 50 1
Right velocit 288.60 39.04 72 9523.9k T3 5-3
62
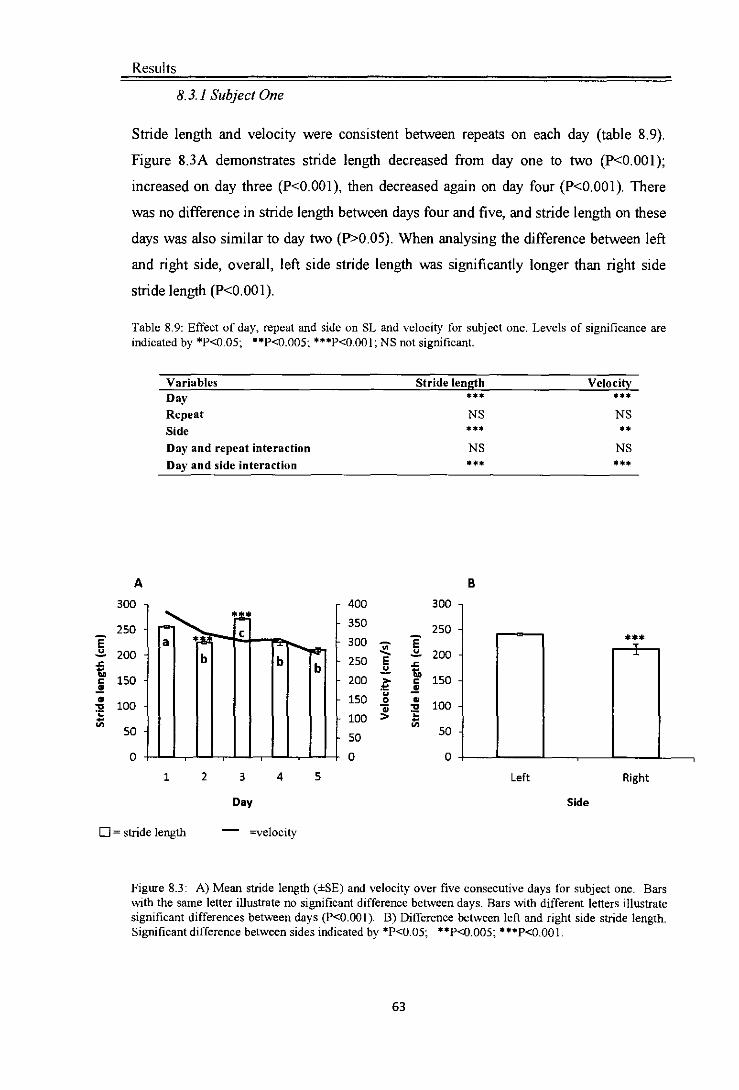
250 E
200
150
100
50
1 2 3 4 5
B
300
250 E - 200
150
100
50
Left Right
Results
8.3.1 Subject One
Stride length and velocity were consistent between repeats on each day (table 8.9).
Figure 83A demonstrates stride length decreased from day one to two (P'cO.00l);
increased on day three (P<0.001), then decreased again on day four (P<0.001). There
was no difference in stride length between days four and five, and stride length on these
days was also similar to day two (P>0.05). When analysing the difference between left
and right side, overall, left side stride length was significantly longer than right side
stride length (P<0.001).
Table 8.9: Effect of day, repeat and side on SL and velocity for subject one. Levels of significance are indicated by *P<005; P<0.005; ***p<o.00l; NS not significant.
Variables Stride length Velocity Day Repeat MS NS Side ** Day and repent interaction NS NS Day and side interaction
400
350
300 -.
250 E U
200
150 - I,
100 >
50
0
Day Side
U = stride length - =velocity
Figure 8.3: A) Mean stride length (±SE) and velocity over five consecutive days for subject one. Bars with the same letter illustrate no significant difference between days. Bars with different letters illustrate significant differences between days (P<0.001). B) Difference between left and right side stride length. Significant difference between sides indicated by P<0.05; "P-c13005 ***p<Q 001
63
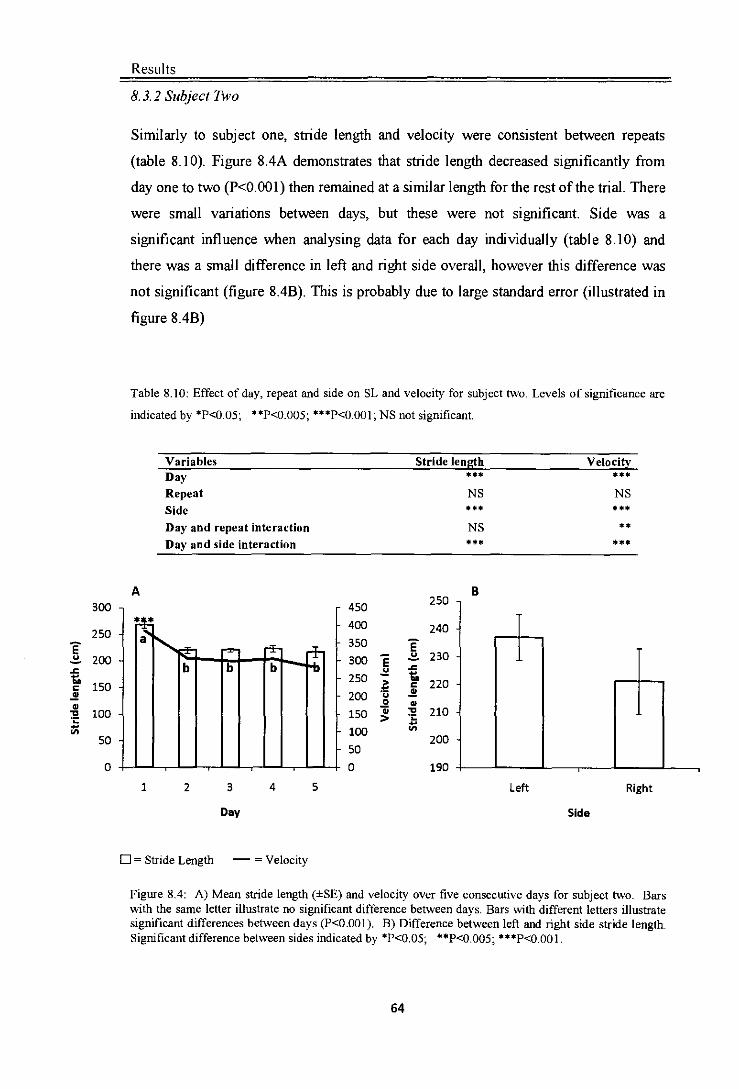
Results
8.3.2 Subject Two
Similarly to subject one, stride length and velocity were consistent between repeats
(table 8.10). Figure 8.4A demonstrates that stride length decreased significantly from
day one to two (Pc0.00I) then remained at a similar length for the rest of the trial. There
were small variations between days, but these were not significant. Side was a
significant influence when analysing data for each day individually (table 8.10) and
there was a small difference in left and right side overall, however this difference was
not significant (figure 8.4B). This is probably due to large standard error (illustrated in
figure 8.4B)
Table 8.10: Effect of day, repeat and side on SL and velocity for subject two. Levels of significance are
indicated by *P<005; **P<0 005 ***pco 001; NS not significant.
Variables Stride length Velocity Day Repeat NS NS Side Day and repeat interaction NS **
Day and side interaction
300
250 E .2. 200
150
:2 100 I-
In 50
ri
A
B 450 400 350
250 200 150 100 50 0
250
240
E 2. 230
220
210 .t I-
(I,
'lIT,:
190
1 2 3 4 5
Left Right
Day Side
E = Stride Length - = Velocity
Figure 8.4: A) Mean stride length (±SE) and velocity over five consecutive days for subject two. Bars with the same letter illustrate no significant difference between days. Bars with different letters illustrate significant differences between days (P<0.001). B) Difference between left and right side stride length. Significant difference between sides indicated by P<0.05; P<0.005; ***P.co 001
64
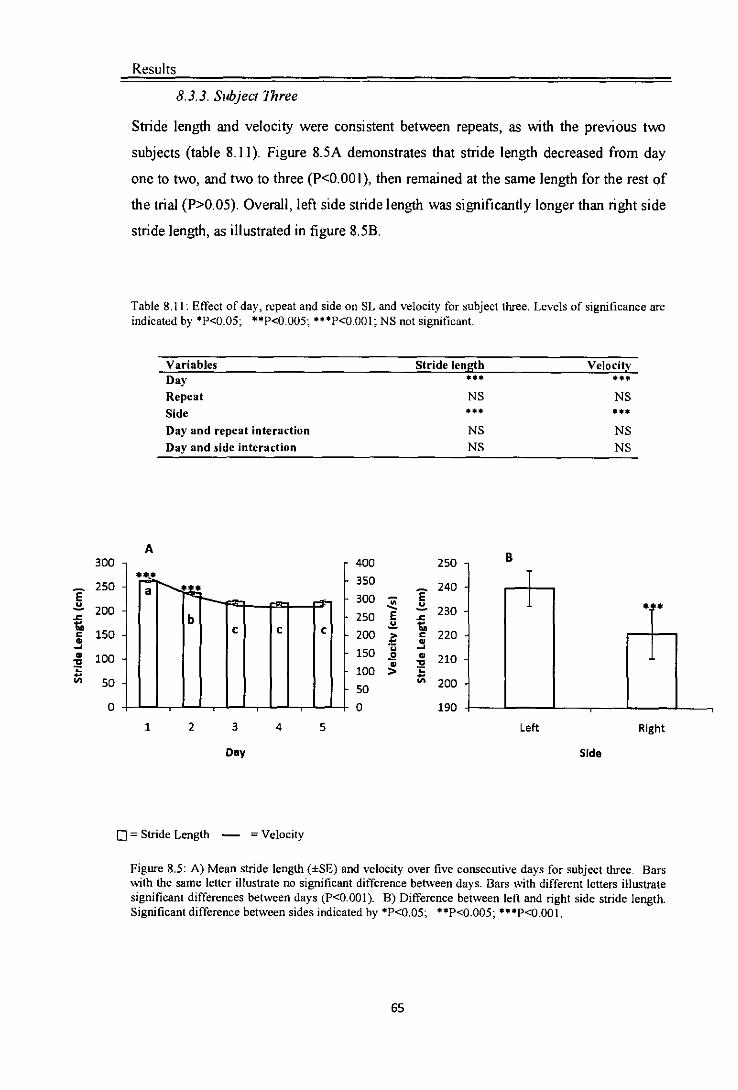
Results
8.3.3. Subject Three
Stride length and velocity were consistent between repeats, as with the previous two
subjects (table 8.11). Figure 8.5A demonstrates that stride length decreased from day
one to two, and two to three (PcO.00l), then remained at the same length for the rest of
the trial (P>0.05). Overall, left side stride length was significantly longer than right side
stride length, as illustrated in figure 8.513.
Table 8.11 Effect of day, rcpeat and side on SL and velocity for subject three. Levels of significance are indicated by P<0.05; **p<o.00s; P<0.00I; NS not significant.
Variables Stride length Velocity Day Repeat NS NS Side Day and repeat interaction NS NS Day and side interaction NS NS
twu]
250 E
200
150
100
Id,
50
A 400 350 300 250 200 150 •$ 100 50 0
250
240 E
230
220
i 210
' 200
190
B
1 2 3 4 5 Left Right
Day Side
D = Siride Length - = Velocity
Figure 8.5: A) Mean stride length (±SE) and velocity over five consecutive days for subject three. Bars with the same letter illustrate no significant difference between days. Bars with different letters illustrate significant differences between days (P<0.001). B) Difference between left and right side stride length. Significant difference between sides indicated by P<0.05; **P<0.005 ; ***P<O.oOl .
4-
65

Results
8.4 Correlation between stride length and velocity
Significant correlations were established for all subjects between stride length and
velocity. Right side had the strongest correlations compared to left, and subject one had
the greatest difference between left and right side correlations. This horse also had the
highest and lowest R2 values (52.7% for the left and 92.7% for the right).
350
300 -
I
•• •°
•;. ••
a 250 •
200 •
S • Left stride length
Right stride length • • • Ge
150 -I- 200
250 300 350 400 450 500
Velocity (cm/s)
Figure 8.6: Regression analysis for stride length and velocity for left and right side for subject one (R2 52.7%, 92.7%) showing a significant positive correlation (P<0.001).
350
I U
300 to C a
250 • Left stride length
• Right stride length 200 • •
• 0
150
250 300 350 400 450
Velocity (cm/s)
Figure 8.7: Regression analysis for stride length and velocity for left and right side for subject two (R2=71 .0%, 86.7%) showing a significant positive correlation (P<0.001).
FrI

Results
350
- 300- E a-
250
0I Left SL .5 t
200 - • Right SL
150
200 250 300 350 400 450
Velocity (cm/s)
Figure 88: Regression analysis for stnde length and velocity for left and right side for subject three (R2=78.7%, 889%) showing a significant positive correlation (P<0.001).
67
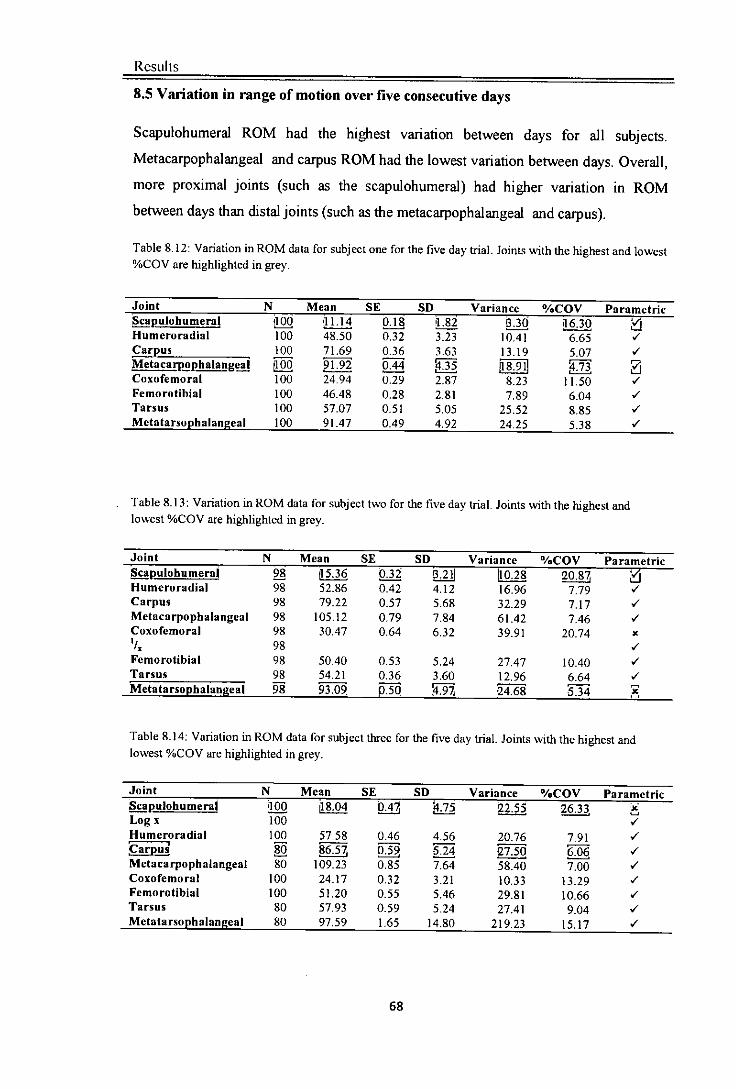
Results
8.5 Variation in range of motion over five consecutive days
Scapulohumeral ROM had the highest variation between days for all subjects.
Metacarpophalangeal and carpus ROM had the lowest variation between days. Overall,
more proximal joints (such as the scapulohumeral) had higher variation in ROM
between days than distal joints (such as the metacarpophalangeal and carpus).
Table 8.12: variation in ROM data for subject one for the five day trial. Joints with the highest and lowest %COV are highlighted in grey.
Joint N Mean SE SD Variance %COV Parametric Scapglohumeml 1199 ft14 Qj QJ O Humeroradial 100 48.50 0.32 3.23 10.41 765 Vt Carpus 100 71.69 0.36 3.63 13.19 5.07 1
Metacarpophalangeal 2L2 Q±! Coxofemoral 100 24.94 0.29 2.87 8.23 11.50 Vt Femorotibial 100 46.48 0.28 2.81 7.89 6.04 Vt Tarsus 100 57.07 0.51 5.05 25.52 8.85 Vt Metatarsophalangeal 100 91.47 0.49 4.92 24.25 5.38 Vt
Table 8.13: variation in ROM data for subject two for the five day trial. Joints with the highest and lowest %COV are highlighted in grey.
Joint N Mean SE SD Variance %Xfl' Parfimetric
Humeroradial 98 52.86 0.42 4.12 16.96 739 / Carpus 98 79.22 0.57 5.68 32.29 7.17 Vt Metacarpophalangeal 98 105.12 0.79 7.84 61.42 7.46 Vt Coxofemoral 98 30.47 0.64 6.32 39.91 20.74 x
98 Vt Femorotibiat 98 50.40 0.53 5.24 27.47 10.40 Vt Tarsus 98 54.21 0.36 3.60 1196 6.64 Vt Metatarsophatangeal 98 93.09. Q.5Q !4T7 24.68 534 X.
Table 8.14: Variation in ROM data for subject three for the five day trial. Joints with the highest and lowest %COV are highlighted in grey.
Joint N Mean SE SD Variance %COV Parametric
Logx 100 Humeroradial 100 57.58 0.46 46 20.76 7.91 Vt
§9 §3 Q70 Vt Metacarpophalangeal 80 109.23 0.85 7.64 58.40 7.00 Vt Coxofemoral 100 24.17 0.32 3.21 10.33 13.29 Vt Femorotibiat 100 51.20 0.55 5.46 29.81 10.66 Vt Tarsus 80 57.93 0.59 5.24 27.41 9.04 Vt Metatarsophalangeal 80 97.59 1.65 14.80 219.23 15.17 Vt

-e-Humeroradial
-*— Carpus
--Tarsus
1 2 3 Day 4 5 6
Results
8.6 Effect of day, repeat and side on range of motion
8.61 Subject One
Table 8.15: Effect of day, repeat and side on joint ROM for subject one. Levels of significance are indicated by P<0.05; "P<0.005; 'P<O.00l; NS not significant.
a - 1 a
0 2 a •= E
a a o a
Variables Day NS " NS NS NS ** NS
Repeat NS NS NS NS NS NS NS NS
Side NS NS NS NS ** * NS
Day and repeat NS NS NS NS NS NS NS NS interaction
Day and side * * ** NS " " NS interaction
80
75
70
2 0 60 C m
1 55
50
45
40
0
Figure 8.9: Mean ROM humeroradial, carpus and tarsus joints (left side) over five days for subject one.
69

Results
ROM for each joint was consistent between repeats on each day (table 8.15); this
pattern is consistent with data for SL and velocity (table 8.9). Figure 8.9 demonstrates
that ROM for the scapulohumeral, metacarpophalangeal , coxofemoral, femorotibial and
metatarsophalangeal did not vary significantly day to day (P>0.05). ROM for the
humeroradial decreased from day one to two (P<O.00l), did not vary between days two
to four, then increased on day five (Pc0.001). Carpal ROM did not vary between days
one, two, four and five, however ROM decreased between day one and three, and
increased between day three and four and again between four and five (P<0.01). Tarsal
ROM did not vary between consecutive days, however tarsal angle on day five was
significantly larger than tarsal angle on day one.
8.62 Subject Two
Table 8.16: Effect of day, repeat and side on joint ROM for subject two. Levels of significance are indicated by P<0.05; •*p<o 005; P<0.001; NS not significant.
- C Cs c's
Cs
C's
e c's 0
ft E Cs c's
U .
Cs
Variables Day " NS " ** NS " NS NS
Repeat
Side
Day and repeat iateraction
Day and side interaction
NS NS NS NS
** NS **
NS NS NS NS
NS * NS
NS NS NS NS
NS NS ** NS
NS NS NS NS
NS NS NS NS
70

Results
120
100
r80 2
60 --Scapulohumeral
C —ta-- Ca rpus al
2 40 ——Metacarpophalangeal
20 —0-- Fernorotibial
0 I p
0 1 2 3 4 5 6
Day
Figure 8.10: Mean ROM for scapulohumeral, carpus, metacarpophalangeal and femorotibial joints (left
side) over five days for subject two.
All joint ROM was consistent between repeats (table 8.16). Figure 8.10 demonstrates
ROM that changed significantly over the five day trial were for the scapulohumeral,
carpus, metacaipophalangeal and femorotibial. All joints followed the same pattern of
variation between days. There was no variation between day one and two, or three to
five (all significant differences were established between day two and three).
Metacaipophalangeal and carpal ROM decreased between day two and three (P<0.001),
whereas femorotibial and scapulohumeral increased between day two and three
(Pc0.001).
71

Results
8.6.3 Subject Three
Table 8.17: Effect of day, repeat and side on joint ROM for subject three. Levels of significance are indicated by Pc005; "P<0.005; ***P<0.001 NS not significant.
a a
e a , a
— a a
Os E a — 0
a • 0.
a E L
LI 0
a U 0 a
Variables Day NS " NS NS NS * ** ***
Repeat NS NS Ns NS NS NS NS NS
Side NS NS " ** NS NS ** "
Day and repeat NS NS NS NS NS NS NS NS interactioa
Day and side NS ** " NS NS NS ** interaction
100
90
— 80
5 0 70 C 10 a' 5 60
50
40
0 1 2 3
Day
——Hurneroradial
-- Femerotibial
—c--Tarsus
—0--Metatarsaiphalangeal
4 5 6
Figure 8.11: Mean ROM for the humeroradial, femorotibial, tarsus and metatarsophalangeal joints (left side) over five days for subject three.
Similarly to subjects two and three, ROM was consistent between repeats (table 8.17).
Figure 8.11 demonstrates that humeroradial ROM did not change between day one and 72

Results
two (P>0.05), or from day two for the remainder of the trial. ROM on day one however,
was significantly smaller than days three, four and five (P<0.001). Femorotibial ROM
remained constant for most of the trial, decreasing significantly on day four (P<O.00l).
ROM of the metatarsophalangeal increased significnatly beween day one and two
(Pc0.001), but did not change between day two and three (P>0.05). Day three ROM
was significantly larger than day one ROM (P<O.00I). There was missing data for the
hind distal limb joints (tarsus and metatarsophalangeal ) for days four and five.
8.7 Correlation between range of motion and velocity
Correlations were established between two joints' ROM for subjects one and two
(scapulohumeral and humeroradial for subject one, carpus and tarsus for subject two).
Subject three demonstrated the most significant correlations between joint ROM and
velocity (five joints were correlated with velocity). More joints were established as
significantly different between days for this subject (compared to subject one).
Significant correlations had both positive and negative relationships, however the
regression values were not as strong as the regression between SL and velocity.
Table 8.18: Correlation between ROM data for each joint (left and right side) and velocity over the five day trial for subject one. Levels of significance are indicated by P<0.05; **p<j 05 "Pc0.001; NS not significant.
Joint P value CC value R' value (%)
Scapulohumeral NS -0.195 3.8 Humeroradial NS 0.182 3.3 Carpus 0.508 25.8 Metacarpophalangeal NS 0.191 3.6 Coxofemoral NS 0.093 0.9 Femorotibial NS 0.157 2.5 Tarsus * 0.212 4.5 Metatarsophalangeal NS 0.175 3.1
73

Results
Table 8.19: Correlation between ROM data for each joint (left and right side) and velocity over the five day trial for subject two. Levels of significance are indicated by PC0.05; **Pe_0.005; "P<0.001; NS not significant.
mt P value CC value R' value (%)
Scapulohumeral * 0.250 6.3 Humeroradial NS 0.006 0.0 Carpus 0.432 18.7 Metacarpophalangeat ** -0.311 9.7 Coxofemoral NS -0.134 1.8 Femorotihial * 0.228 5.2 Tarsus NS 0.012 0.0 Metacarpophalangeal -0.439 19.3
Table 8.20: Correlation between ROM data for each joint (left and right side) and velocity over the five day trial for subject three. Levels of significance are indicated by P<0.05; **P<0 . 005 ; ***P<0.001; NS not significant.
Joint
Significance CC value R2 value (%)
Scapulohumeral * -0.223 5.0 Humeroradial NS -0.092 0.8 Carpüs * 0.248 6.1 Metacarpophalangeal NS -0.044 0.2 Coxofemoral NS 0.107 1.1 Femorotibjal NS -0.062 0.4 Tarsus NS -0.075 0.6 Metatarsoophalangeal NS 0.117 1.4
74

Results
8.8 Summary
Intra-horse variation established significant variation in stride length between days for
all horses (Pc0.001), and stride length was positively correlated to velocity (velocity
was also established as significantly different between days). Less variation was
demonstrated for intra-horse range of motion for the trial, a maximum of four joints
(subjects two and three) were established as significantly different between days
(P<0.001). The majority of joints measured did not vary significantly between days. A
summary of the main findings are presented in the table below.
Table 8.21: Summary of main results for conformation (how many traits were different between sides or day); stride length (which days and sides were significantly different); ROM (how many traits were different between side and day) for each subject.
Subject Conformation Stride Length Range of Motion (number of traits) (day number) (number ofjoints)
Side Day Side Day Side
One 1 2 Right side One and 3 3 >left side three>
two, four, five
Two 4 6 No One>two- 4 4 difference five
Three 2 3 Left side One and 4 4 >right two>
side three-five
75
Chapter Nine: Discussion
9.0 Discussion
The aim of part II was to obtain measurements for static conformation and stride
characteristics for a group of horses over five consecutive days, to determine if baseline
measures can be obtained on a single occasion. It has previously been established that
traditional methods of assessing conformation can lead to inconsistencies between
assessors (Breen, 2009). Using a quantitative method like the one used in the present
study (based on Magnusson (1985) and Holmstrom cial., (1990)) should lead to more
consistent evaluations, providing the method is standardised. Unlike stride parameters,
when assessing conformation repeated measures are rarely taken; in theory there is less
variation when measuring static lengths and angles compared to dynamic ones. This
was evident in part I of this research, where static validation produced smaller margin of
error values than dynamic validation. The majority of conformation studies to date
investigate the effect of conformation on future performance (Holmstrom ci aI.,1990;
Back ci at, 1996; Weller c/at, 2006b; Holmstrom, 2000) and soundness (Back ci at,
1996; de Souza ci at, 2004). In the present study, the purpose of establishing intra-
horse variation in conformation was to determine the reproducibility of the method in
terms of consistency, as well as determining confonnational differences between left
and right side. It was important that the method was standardised and highly repeatable
to make it accessible to the equine industry to use on a practical level. Limb segments
were defined and measured (rather than lengths of bone segments of the limb), for ease
of application. This was a preliminary investigation to determine the methodology for
part ifi that aimed to established normal conformation for a distinct breed of horse.
Variations in intra-horse conformational measurements can be an amalgamation of
inherent asymmetry between left and right side, changes in the stance, and errors in
marker placement due to soft tissue artefact. These limitations will vary horse-to-horse;
it is hard to distinguish between them to ascertain which limitations are causing
significant variations between sides or days. The horses in this study demonstrated
varying degrees of intra-horse variation in conformation, due to methodological and
intrinsic limitations in the evaluation of conformation using two dimensional motion
analysis techniques. One of these limitations, and a main source of error according to
Weller ci al. (2006a) is marker placement, however the actual marker set used could
also be a limitation.
WO

Discussion
Markers used for dynamic analysis are usually placed at the centre of rotation of the
joint to be measured (Clayton and Schamhardt, 2001), whereas for evaluating static
conformation markers are often placed on the distal and proximal ends of limb segments
(Holmstrom ci at, 1990). The current study developed a marker set that allowed
conformation and gait to be assessed from one marker set; limb segments rather than
actual lengths were measured. This is an essential part of ensuring the standardised
method will be adopted by the equine industry as it needs to be simple and quick to
obtain the data, as well as easy to process once downloaded (ease of digitising).
Providing the marker position is known with respect to joint angles, and in a well
known position on the horse, the exact marker site has no influence on the accuracy and
value of final kinematic data (Schamhardt ci al., 1993). The purpose of using
anatomical markers is to identify specific points of the skeleton on the surface of the
skin, by palpating the muscle and underlying tissue to feel the relevant bony segments
underneath. The accuracy of marker placement is dependent on the experience of the
person applying the markers and the amount of soft tissue artefact (STA); the amount of
tissue between the skin and bone. Soft tissue artefact is one of the main sources of error
in the use of anatomical skin markers (Leardini ci al., 2005), and this error will vary
depending on which joints are being measured. Joints with higher amounts of STA
(proximal joints) will be harder to palpate to locate the correct bony segment under the
skin compared to joints with smaller amounts of STA (distal joints). This has been
demonstrated in the present study where scapulohunieral ROM had the highest amount
of variation in all subjects, ranging from 16.30% to 26.33% (tables 8. 12-8.14, page 68).
This theory has been tested by Weller ci al. (2006a), using hypodermic needles to locate
the end of segment lengths and centre of rotation for joints on a whole cadaver.
Radiographs were then used to determine the accuracy of the external location of the
anatomical point, in relation to the actual point on the skeleton. The results confirmed
that proximal locations were harder to palpate compared to distal locations; errors of
less than 0.5cm were reported for points distal to the humeroradial and femorotibial
joints. It was also suggested that size of the landmark may also be a factor in decreased
accuracy for marker location. The proximal locations such as the greater trochanter tend
to be larger areas, compared to the metacarpophalangeal for example. Taking repeated
measurements over a number of days means repeated marker placement; if bony
segments are hard to locate, inaccuracies could occur. This could be why it appears
some conformational traits change day to day. Accuracy of marker placement is also
very much dependent on the experience of the researcher doing the palpation. In other
77

Discussion
types of assessment, level of experience has been established as a significant factor in
consistency between assessors (Breen, 2009). In the present study, the same experienced
researcher applied all the anatomical markers following a specified palpation protocol.
This minimised chances of inconsistency in marker placement, however there was still a
risk that accuracy was decreased when applying markers in the same positions over
consecutive days. To reduce this risk further, small areas of hair could be clipped at the
site of the anatomical landmark, to provide a reference point for marker placement. This
method has been used in previous research where repeated measures have been taken
from the same horses (Rose ci al., 2009), however could not be used in the present
study due to lack of consent from the owners of the horses used. The amount of STA
varies depending on individual horses, and this is strongly correlated to body condition.
Horses with higher condition scores (higher fat mass) will display more STA. Subject
one (Thoroughbred) had a lower body condition score compared to subjects two and
three. This could be a reason why there was less variation in conformation data for
subject one, compared to three, as bony segments were more easily palpated on the
Thoroughbred horse. Subject one demonstrated two traits that varied significantly
between days (neck length and scapulohumeral angle), compared to subjects two and
three that demonstrated six and four traits respectively. Subjects two and three (Anglo-
Arab and Cob) had higher amounts of STA than subject one, a possible limitation in the
accuracy of marker placement. The specific marker model used could also account for
some of the variation; the model aimed to enable the researcher to measure static
conformation as well as ROM from the same model. Previously, research has used
different marker sets depending on whether conformation or ROM is being measured.
Holmstrom ci al. (1990) used a different marker set for measuring conformation to
Degueurce ci al. (1997) for measuring ROM variability. The present study aimed to
combine both these marker models, however it may have been more accurate to use a
different one for measuring conformation and ROM.
In the present study, the difference between variability in linear or angular traits differed
depending on the horse. Subject two demonstrated the highest variability for linear
traits; six out of seven traits that were significantly different between days were linear.
Subject three demonstrated higher variability for angular traits; four out of five traits
that were significantly different between days were angular traits, this subject also
demonstrated a significant difference between left and right side stride length
(Pc0.005), which could be accounted for by the differences in conformation. It could be
78

Discussion
possible that intra-horse variation for subject two was mostly due to stance related
variability, compared to subject three. Conformational asymmetry has previously been
reported in National Hunt horses (Watson etal., 2003; Weller etal., 2006c). The study
by Watson et al. (2003), measured skeletal asymmetry of the third metacarpal bone
using radiographs. The right metacarpal bone was longer in 76% of horses measured.
Lengths of bone segments is one factor attributing to overall conformation (Weller ci
al., 2006b) therefore it can be assumed that asymmetry in bone lengths will lead to
asymmetry in the conformation for the corresponding limb segment. Weller ci al.
(2006c) used 3D motion analysis techniques to assess conformation for 106 National
Hunt horses. Results were similar to the present study where some but not all traits
demonstrated left and right side asymmetry; both linear and angular traits were
significantly different between sides. The authors suggested angular traits (joint angles)
were more dependent on the stance of the horse, and that variations may reflect the
asymmetrical stance of the horse rather than true asymmetry (Weller ci' al., 2006a).
Changes in stance could also affect measurement of conformation between days. Stance
related dependency of conformation assessment has previously been tested using 3D
motion analysis techniques by taking repeated measurements of the same horse, three
times for each side (Weller c/at, 2006b). Horses were led out of the calibrated field of
view, in again and repositioned between each data collection. Conformation traits varied
between each repeated data collection for each horse; deviations of limb segments
proved to be the most stance dependent traits measured.
True asymmetry in conformation is difficult to assess without the use of radiographs or
three-dimensional analysis systems that can measure traits from both sides
simultaneously. The purpose of this study was to standardise a method of assessing
conformation that is not only accurate and reliable, but accessible to the equine industry.
In order for the equine industry to start using a quantitative method such as the one
described in this study, it needs to be practical and easily reproducible for equine
practitioners to use on a daily basis for "in field" evaluations. The method is not
without its limitations; which are difficult to overcome, particularly if this method is to
be utilised by equine practitioners. Accuracy of marker placement can be improved by
one experienced researcher applying the markers following a specific palpation method,
however for this method to be adopted by the industry, the method needs to be
accessible to everyone not just experienced researchers. Taking the time to ensure the
horse is stood square (evenly weight bearing) and perpendicular to the camera will limit
79

Discussion
stance related variations and distortions due to out of plane rotation, this was done in the
present study by using an area marked on the surface of the school to ensure the horse
was perpendicular to the camera. Differences were established between sides and days
for some traits, and different traits were different on each day. This indicates the
variations established in this study were due to methodological discrepancies rather than
true asymmetry. Variation in conformation has been previously established for a group
of Thoroughbred horses (Weller ci al., 2006c); therefore providing confonnation is
reported as a range within which normal conformation should lie, small variations
should not be an issue.
Baseline measures are integral when analysing equine stride characteristics. Baseline
data is used in place of an independent variable, for evaluating treatment (Stergiou and
Scott, 2005) or in the present case, to define normal gait. Variability is inherent in
animals (Danion ci al., 2003; Fomer-Cordero ci al., 2006); it appears impossible for
biological systems to repeat identical locomotion patterns on successive occasions.
Equine gait characteristics may not be identical between repeats but conclusions drawn
from previous studies on the variability of equine gait established small intra-horse
variation (Drevemo ci al., 1980a; Drevemo ci al., 1980b; Degueurce ci a/., 1997;
Galisteo ci at 1996). This is desirable for gait analysis studies as it means that baseline
measures can be obtained on a single occasion. It also means that "normal" gait for
individual horses can be quantified. In the present study the amount of intra-horse
variation in stride length varied depending on which subject was being analysed. Ten
repeats were taken for each side, and no significant differences between repeats were
established for stride length or velocity (P>0.05). Repeated measures were taken to
obtain a mean value, the number of repeats can vary from three (Drevemo cial., 1980b)
to twelve (Clayton ci al., 2002), but ten were used in the present study. The results of
the current study demonstrate that ten repeats are sufficient for obtaining baseline
measures; stride length data obtained on one occasion is consistent. This confirms
previous studies, where little variation was established between repeats of the same
horse recorded on one occasion (Drevemo cial., 1980a; Degueurce cial., 1997). Stride
length was significantly different between sides for some horses and stride length was
significantly different between some but not all days (P<0.001), so although stride
length was consistent between repeats on one day, there was less consistency between
days. Intra-horse variation in stride length established differences on days one and three
for subject one; stride length was significantly longer on these days than other days in

Discussion
the trial (Pc0.00I). Subject two demonstrated significantly longer stride length on day
one (Pc0.001) than all subsequent days; stride length did not vaiy between days from
day two to five. Similar results were illustrated for subject three; stride length was
significantly longer on day one and two than subsequent days (P<0.001). It is evident
from these results that stride length had good short term repeatability (between
successive repeats on the same day), but repeatability on different days was less
consistent. The level of consistency depended on the horse; stride stability is unique to
individual horses. This confirms previous studies that have established horses have
inherent locomotion patterns (Drevemo etal., 1980a; Drevemo etal., 1980b; Degueurce
et at, 1997; Galisteo c/at 1996); some locomotion patterns may be more variable than
others. This variability may be due to a number of factors, all of which are limitations of
the present study some of which could be accounted for to make stride characteristics
less variable for future studies.
Variation in stride characteristics between sides could be partly due to asymmetrical
conformation, asymmetrical conformation is a limitation that cannot be altered. Subject
two demonstrated no significant difference between left stride length and right stride
length overall (P>0.05); this horse also had the least asymmetry in conformation
between sides. Two traits were different between sides (femur length and femorotibial
angle), the small amount of conformational asymmetry is probably why there is less
asymmetry when analysing stride length; conformation has a direct effect on movement
(Holmstrom ci at, 1990; Back ci at, 1996; Weller ci at, 2006b). A horse with
symmetrical conformation will probably lead to more symmetrical gait. Evaluation of
conformation is an important part of any investigation into stride characteristics, due to
the relationship between conformation and locomotion. It could be suggested from the
present study that an assessment of conformation prior to gait analysis should provide
useful information on symmetry of the individual horse, allowing decisions to be made
on whether to analyse gait from one or two sides. Stride characteristics for the left and
right side were not recorded simultaneously for the present study; only one camera was
used therefore a comparison of left and right side was not a true comparison. Horses
were also recorded for ten repeats on each side, rather than capturing each side
sequentially. It could be possible that whichever side was recorded first demonstrated
significantly different stride length to the subsequent side. If two cameras were used,
and sides recorded simultaneously, it is possible that less variation would have been
established between sides.
81

Discussion
Correlations on the data established significant correlations between stride length and
velocity, and this has been well documented in other biomechanics research (Leach and
Drevemo, 1991; Peham ci al., 1998; Clayton ci at, 2001). The consistency of stride
length between days was also closely correlated to consistency of velocity. Where
differences between days in stride length was established, a significant different in
velocity was also established. This is more than likely due to the strong correlation
between stride length and velocity, and demonstrates how velocity-dependent stride
length is. The dependency of stride length on velocity demonstrates how important it is
to regulate velocity when aiming to obtain baseline measures in gait analysis. Velocity
in the present study was not consciously regulated; consistency was improved by using
the same handler to trot each horse. The variation in velocity demonstrates this is not
the most reliable method of regulating velocity of trotting horses. In future work, timing
gates could be utilised to ensure the horse is travelling within the same range of speed
(±5% of the mean velocity) for each repeat. The analysis of inter-horse variation (results
of inter-horse variation can be seen in Appendix C) established horse one had
consistently shorter stride length than horses two and three. Horse one had higher
variation in stride length than horse three. It is also possible that faster horses (longer
stride length) were more consistent; this has been established for human athletes
(Danion cial., 2003), and due to the correlation of velocity and stride length in equine
gait it is a plausible explanation for the increased variability seen in shorter strides.
The amount of variation in range of motion for the specific joints measured was less
than variation in stride length over the five day trial. ROM for eight joints were
measured, a maximum of four joints displayed variation that was established as
significant between days for all subjects. Subject one demonstrated a significant
reduction in carpus ROM between day one and three, but then an increase on days four
and five. Carpus ROM was significantly negatively correlated to velocity, and although
the correlation was not very strong (5%), ROM does follow the same pattern as change
in velocity over the five days. Humeroradial and tarsus ROM were also significantly
different between days; humeroradial ROM decreased between day one and two then
stayed consistent until day five when it increased. Tarsus ROM increased from day one
to five. Neither of these joints were significantly correlated to velocity therefore there
must be another factor involved in the variation ofjoint ROM.
(lialisteo cial. (1996) demonstrated similar results to the present study. Variability in the
majority of joints measured was less than 10%, however the scapulohumeral joint
82

Discussion
demonstrated the highest amount of variation (mean of 24.9%) which is comparable to
the mean scapulohumeral COY value for the present study (21.2%). This study recorded
the horses at walk, leading to a much lower velocity (1.68±0.15rnIs). The authors did
not take into account velocity due to the low SE value; they assumed velocity to be a
constant parameter therefore lacking significance on stride parameters. Velocity
however had the highest COY value compared to other stride parameters. It could be
argued that COy is a more reliable measure of the variability of the parameter measured
as it lets two sets of data to be compared that have different values as it shows the
variability as a percent of the original value. Standard error is not a proportionate
measure; a smaller value will have a smaller SE value, even though COY might be
higher. This could be why velocity had a small SE, but larger COY value.
Intra-horse variation in ROM differed for each joint; this variation followed a pattern
that was similar for all subjects. ROM for proximal joints had higher COY values
compared to ROM for distal joints. Scapulohumeral ROM was the joint with the highest
COY value for all subjects. The joints with the lowest COY values were
metacarpophalangeal, metatarsophalangeal and carpus. It has previously been
established that different joints undergo a different amount of variability (Galisteo etal.,
1996; Degueurce ci al., 1997), with contradictory results. Intra-horse variation studied
by Degueurce ci al. (1997) indicated distal joints such as the distal interphalangeal,
carpus and tarsus joints displayed the lowest amount of individual variation between
repeats. These joints therefore were considered to be more representative of the
individual horse, whereas in proximal joints that had higher amounts of intra-horse
variation, the range of motion was less characteristic of the individual horse. The study
by Galisteo ci al. (1996) revealed results more similar to the current study; proximal
joints demonstrated higher amounts of variation compared to distal joints. The results
indicate distal joints are more representative of the individual, compared to proximal
joints (that undergo higher amounts of variation between repeats). It is possible that
marker placement could be causing variation in proximal joint ROM, such as the
scapulohumeral. The analysis of scapulohumeral joint conformation indicated
scapulohumeral joint angle was significantly different between days for subject one and
three, and scapula length for subject two. Actual scapulohumeral conformation will not
have changed over the trial, one possible cause of this variation could be marker
placement (as discussed earlier). Soft tissue artefact is another possible cause of the
higher variation in the proximal joints. The proximal joints (scapulohumeral,
83

Discussion
coxofemoral, femorotibial) displayed the highest COV values compared to distal joints
in the current study, this is likely to be due to the varying amount of STA in these joints.
Proximal joints have higher amounts of STA compared to distal joints (van Weeren ci
at, 1990a). Variations of up to 8mm were established for distal joints, compared to
values of as much as 142mm for more proximal locations. Deviations of up to 40mm
have been found for the scapula (van Weeren et al., 1990b), which when taking
repeated measures of the same horse could be an influence on the amount of variation.
A simple and accessible method of accounting for some of the distortions caused by
STA is to use data smoothing and filtering techniques (Howarth and Callaghan, 2009).
The present study used a Butterworth filter, at a cut-off frequency of 10 hertz to smooth
all data. This technique will not account for large amounts of skin displacement, but is
an acceptable and widely used protocol making it ideal to use with a standardised
method aimed at equine practitioners.
The definition of gait is the "cyclic pattern of limb movements that occur during each
stride" (Nicodemus and Clayton, 2002), therefore by its' very nature a stride cycle is an
accumulation of the range of motion of each joint making up that stride. This is one
reason why stride length data is more variable than ROM data, as it is in effect the
overall movement of the horse; the sum of minor variations displayed for each joint will
lead to larger variations in stride length. The aim of this chapter was to establish if gait
characteristics for individual horses were stable enough to allow for baseline data to be
collected on one occasion, rather than separate occasions over a number of days. It
could be argued that when measuring stride length alone, due to the higher intra-horse
variation baseline data should be obtained over more than one day. The amount of
variation in stride length did vary depending on the horse, indicating some horses have
more stable stride characteristics than others. It is possible this different amount of
variation is linked to age or training effects; the mean age was 10±3.5 years and each
horse has competed to different levels in different disciplines. Age and training have
both previously been established as factors contributing to changes in gait
characteristics (Barrey c/ al., 1993; Buchner ci al., 1994), and are often linked. To
minimise age and training effects, the sample of horses used should be of similar age
and have undergone the same level of training. One method to ensure this is to use un-
backed young horses. The horses in the present study all demonstrated significant
differences between day one and two, but not all for subsequent days. This suggests that
if baseline stride length data is needed, the first data collection should be discounted
84
Discussion
(possibly due to the novelty factor) but subsequent baseline data should be stable
enough to be collected on one occasion. Range of motion of specific joints
demonstrated different amounts of variability, this could cause difficulties when
suggesting how variable gait is overall. The standardised method developed from this
research needs to be simple and accessible if it is to be utilised on a practical level by
the equine industry, as well as providing equine practitioners with accurate and useful
information. It can be concluded from this chapter, that although stride length is more
variable than ROM, providing measures are taken to control the methodology
(standardised marker placement, regulating velocity) then baseline measures to define
the range of normal locomotion of the horse can be collected on one occasion (as long
as stride length alone is not used as a measure of the horses gait). The results of this
study indicate horses do have unique locomotion patterns and that these patterns vary
between horses; it has yet to be seen if these patterns are not just unique to individual
horses but within distinct breeds as well.
85

PART HI
Defining normal gait in the Arabian Horse.

Chapter Ten: Aims and Objectives
10.0 Aim
The aim of part III of this study were to apply the methods and techniques from parts I
and H in order to measure normal conformation and gait of Arabian horses; and from
these measurements develop a unique baseline dataset for the Arab horse.
10.1 Objectives
i) Use the standardised technique developed in part I and II to obtain measurements of
static conformation of a group of Arabian horses.
ii) Use the standardised technique to obtain measurements of stride length and range of
motion for a group of Arabian horses.
iii) To provide a unique data set of baseline stride and conformation data to the Arab
Horse Society and Arab stud/horse owners.
10.2 Hypothesis
i) Normal conformation (determined by the mean values obtained) will be normally
distributed.
ii) There will be no difference in stride length or range of motion between horses.
iii) There will be significant correlations between conformation and gait.
EM

Chapter Eleven: Methodology
11.0 Subjects
The subjects consisted of six purebred Arabian horses; four mares, one gelding and one
colt. Mean age 27±10.56 months. None of the horses were backed, therefore had not
received any training, but were capable of trotting in hand. Five of the horses shared
identical routines (lived out full time), one horse (the colt) was stabled at night. Horses
were selected based on horses available at the time of the study that fulfilled the
required criteria of being purebred unbroken Arabian horses.
11.1 Instrumentation
P/ease see sec/ion 7.1 in chap/er six, part II (page 49) for de/ai/s of/he equipment used
11.2 Anatomical markers
P/ease see sec/ion 7.2 in chapter six, part II (page 49) for detai/s on the marker sets
used to measure conformation and gait.
113 Filming procedure
Filming procedure is explained in detail in section 7.3 in chapter six, part II (page 51).
Filming took place on location at the participating stud, on the yard which consisted of a
large, flat area most suitable for trotting horses in hand. Prior to filming taking place, a
calibration video was filmed using a 50 by 50cm calibration cube. Horses were led
passed the equipment in walk for ten minutes before recording took place, to habituate
the horses to the equipment and to warm the horses up prior to filming. Filming took
place over a period of two weeks, on three separate days from 10am to 2pm.
11.3.1 Conformation assessment
Procedure for assessing conformation is explained in detail in section 7.3, chapter six
(page 51). Horses were stood square (equally weight bearing on all four limbs) in the
calibrated field and held by a handler, ensuring the horse was perpendicular to the
camera. Horses were recorded for three seconds from the left side (traditionally the
side conformation is assessed from), on one occasion. The linear and angular traits
measured can be seen in figure 6.1 (chapter six).
87

Methodology
11.3.2 Stride length and range of motion assessment
Procedure for assessing stride length and range of motion is explained in detail in
chapter six. Stride length and ROM were assessed in trot only. Horses were led in hand
(by the same handler to maintain consistency) passed the video camera through the
calibrated field of view, at a distance of 7m from the video camera (see figure 7.2, page
52) in order to capture one full stride (one full stride cycle was determined as mid-
stance to mid-stance of the near fore and hind limb). Horses were recorded from the left
side only, with five repeats being taken from each horse.
11.4 Analysis of videos
Video analysis and data s,noothing techniques were carried out according to the
methodology described in section 7.4, chapter six (page 54)
11.5 Statistical analysis
Descriptive statistics were calculated for the data for intra-group variation and inter-
horse variation. Descriptive statistics included mean, standard error, variance (the
distance of the data from the mean value) and the coefficient of variation (the standard
deviation as a percentage of the mean, which allows data sets of different values to be
compared). All data were tested for normality with an Anderson-Darling normality test.
If data were established as non-parametric, skew was determined with a histogram. If
data were skewed, data were transformed. For positively skewed data, the
transformations vx, log x, were used. For negatively skewed data the transformations
x2, x3 and antilog x were used. Data were then re-tested for normality.
Inter-horse variation and intra-group variation were established for each subject and all
subjects for conformation, SL and ROM. Parametric data was tested using a GLM. Non
parametric data was tested with a Kruskal-Wallis. To determine where differences
occurred, a post-hoc Tukey comparison was used.
Correlations were performed between SL and ROM data with velocity to determine if a
significant relationship existed. Parametric data were tested with a Pearson correlation,
non parametric data were tested with a Spearman correlation (on ranked data).
Regression analysis was also performed to determine the strength of the relationship.
ml

Chapter Twelve: Results
12.0 Conformation
12.0.1 Variation in conformation
Traits that measured linear distances (lengths of limb segments) overall had lower SE
values than traits that measured angular values (ioint angles). When comparing COY
values, higher variance was established for linear traits, compared to angular traits.
These results followed similar patterns to the intra-horse variation in conformation seen
in part II. All data were established as parametric, therefore normally distributed within
the population.
Table 12.0: Variation in conformation of a group of purebred Arabian horses. Traits with the highest and
lowest %COV are highlighted in grey.
Trait N Mean SE SD Variance %COV Neck (cm) 6 54.14 6.16 2.52 37.98 11.38
Scapula (cm) 6 33.17 4.04 1.65 16.31 12.17 Humerus (cm) 6 28.74 3.97 1.62 15.73 13.80
Radius (cm) 6 48.87 2.89 1.18 8.38 5.92 Metacarpal (cm) 6 30.75 3.64 1.48 13.22 11.83
Proximal phalanx (cm) 6 11.13 0.94 0.38 0.88 8.43 Pelvis (cm) 6 28.63 3.32 1.35 11.00 11.58
Femur (cm) 6 37.86 4.56 1.86 20.80 12.05 Tibia (cm) 6 42.61 1.83 0.75 3.36 4.30
Metacarpal (cm) 6 38.78 3.39 1.38 11.48 8.74 Proximal phalanx (cmj j73
Neck (0) 6 97.82 5.56 2.27 30.93 5.69 Scapulohumenl (°) 6 114.40 2.92 1.19 8.53 2.55
Humeroradial () 6 152.03 8.85 3.61 78.34 5.82 Metacarpophalangeal (0) 6 141.88 4.58 1.87 21.01 3.23
Coxofemorat (j f° Femorotibjal (0) 6 162.78 10.99 4.49 120.75 6.75
Tarsus (0) 6 164.30 3.49 1.42 12.17 2.12 Metatarsophalangeal (0) 6 148.62 8.89 3.63 78.96 5.98

Results
12.1 Stride length and velocity
12.1. 1 Normal stride length in Arabian horses
Data for stride length and velocity demonstrated variance within a similar range to
conformation data. Velocity had the highest %COV value forelimb and hind limb SL
had similar %COV values. Data for hind limb SL and velocity were parametric (once
transformed), however forelimb SL was not; data were for this trait were not normally
distributed within the population.
12.1: Variation in stride length in trot and velocity for a group of purebred Arabian horses
Trait N Mean SD SE Variance %COV Parametric Forelimb SL 30 206.38 13.24 2.42 175.25 6.41
Hind limb 30 204.80 12.50 2.28 156.28 6.10 SL Log hind V limb Velocity 30 318.49 32.98 6.02 1087.60 10.35
Log velocity V
12.1.2 Inter-horse variation
There was no significant difference between fore and hind limb SL (P>0.05) therefore
for further analysis, forelimb SL and hind limb SL were analysed together as SL (these
data were established as parametric).
Table 12.2: Inter-horse variation of stride length in trot and velocity for a group of purebred Arabian
horses. Levels of significance are indicated by P<0.05; "Pc0.005; "P<0.001; NS not significant.
Variable Stride length Velocity
Sign (ficance Sign ylcance Horse Repeat NS NS
II

Results
400
350
300
250 C. E U
200 U 0
150
100
50
0
230
220
210
200
Jb 190 VI
180
170
1 2 3 4 5 6
Horse
Dsthde length - =velocity
Figure 12.0: Mean stride length (±SE) and velocity for all horses. Different letters denote a significant difference between horses P<0.001). Sane letter denotes no significant difference between days.
Stride length and velocity were consistent between repeats (P>0.05), this was true of all
horses. There was no significant difference in SL between horses one, two or three
(P>0.05), or between horses four, five and six (P>0.05). Horses one to three had
significantly shorter stride length compared to horses four to six (Pc0.001). A similar
pattern was established for velocity. Horses one to three demonstrated no significant
differences (P>0.05), horses three to six demonstrated no significant differences
(P>0.05). Horses four to six were significantly faster than horses one to three (P<0.001).
Horse three was faster than horses two and three, and slower than horses four to six,
however this small variation was not significant. This horse also had the largest SE
value (331.15±1 4.44cm/s).
91

Results
12.1.3 Correladon between stride length and velocity
A significant positive correlation was established between mean stride length and
velocity (R2=76.2). This value is comparable to the intra-horse correlations
demonstrated in part H.
Table 12.3: Correlation between fore and hind limb stride length and velocity showing, correlation coefficient (CC value) and regression value (R value). Levels of significance are indicated by sp.coos; "Pc0.005; "P<0.001
Variable Significance CC Value R2 value (%)
Stride length * ** 0.873
76.2
250
240
230
220
210
200
190
180 S 2 170
160
150
S
S S
S .
.1
200 250 300 350 400 450
Mean velocIty (cm/s)
Figure 12.1: Regression analysis for stride length and velocity (76.2%) showing a significant positive correlation (P<0.001).
92
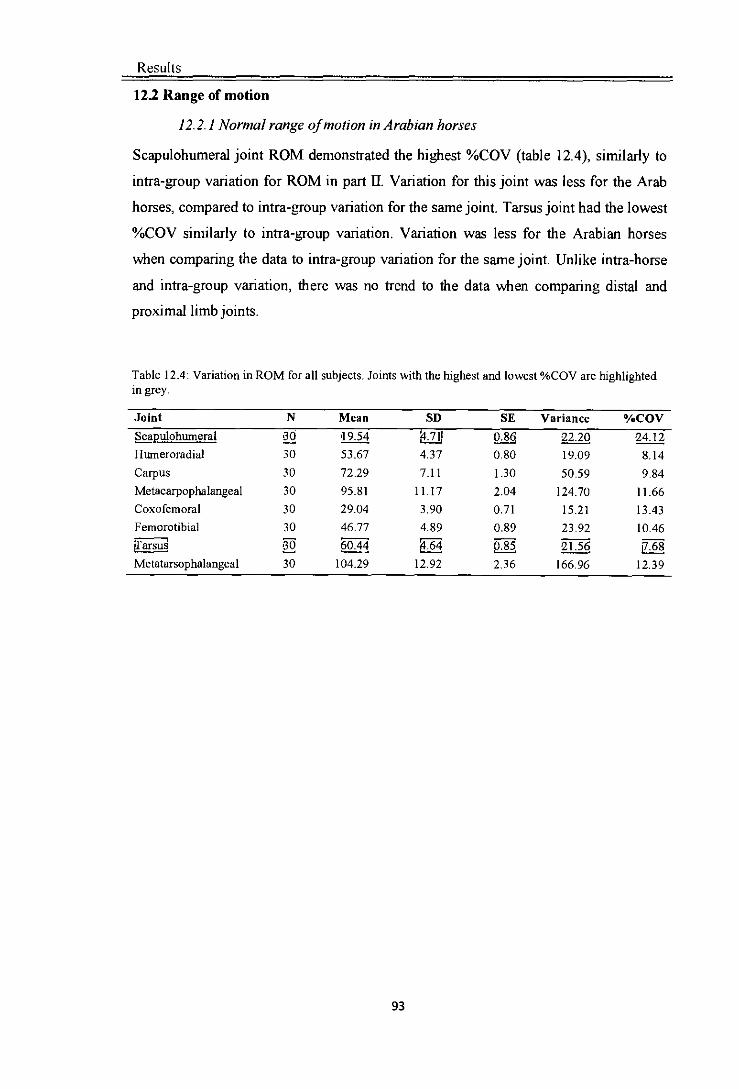
Results
121 Range of motion
12.2.1 Normal range ojmouion in Arabian horses
Scapulohumeral joint ROM demonstrated the highest %COV (table 12.4), similarly to
intra-group variation for ROM in part H. Variation for this joint was less for the Arab
horses, compared to intra-group variation for the same joint. Tarsus joint had the lowest
%COV similarly to intra-group variation. Variation was less for the Arabian horses
when comparing the data to intra-group variation for the same joint. Unlike intra-horse
and intra-group variation, there was no trend to the data when comparing distal and
proximal limb joints.
Table 12.4: Variation in ROM for all subjects. Joints with the highest and lowest %COV are highlighted in grey.
Joint N Mean SD SE Variance °IOCOV
Scapulohumeral 954 JJJ 0. 80 2120 24A2
Humeroradial 30 53.67 4.37 0.80 19.09 8.14
Carpus 30 72.29 7.11 1.30 50.59 9.84
Metacarpophalangeal 30 95.81 11.17 2.04 124.70 11.66
Coxofemoral 30 29.04 3.90 0.71 15.21 13.43
Femorotibial 30 46.77 4.89 0.89 23.92 10.46
1T&SU 4 2L56
Metatarsophalangeal 30 104.29 12.92 136 166.96 12.39

Results
12.2.2 Inter-horse variation in range of motion
Table 12.5 demonstrates that neither horse nor repeat had a significant effect on ROM
for any of the joints measured (P>0.05). There was no significant difference between
horses for each joint ROM measured (figure 12.2). Normal joint ROM for this group of
Arabian horses can therefore be established from the mean values for each joint ROM.
Table 12.5: Effect of horse and repeat onjoint ROM for all subjects. Levels of significance are indicated by P<O.05; "P<0.005; "Pc0.001; NS not significazt.
a a
.2 .2 a a 0
E —
E a
'- 0 E
-
Variables Horse NS NS NS NS NS NS NS NS
Repeat NS NS NS NS NS NS NS NS
140
:1
——Scapulohurneral
—4— Humeroradial
—0— Carpus
—4— Metacarpophalangeal
—4— Coxofernoral
—C— Femorotibial
—0—Tarsus
0 1 2 3 4 6 —0—Metatarsophalangeal
Horse number
Figure 12.2: Mean ROM for all joints and subjects showing no significant differences between horses (P>0.05).
94
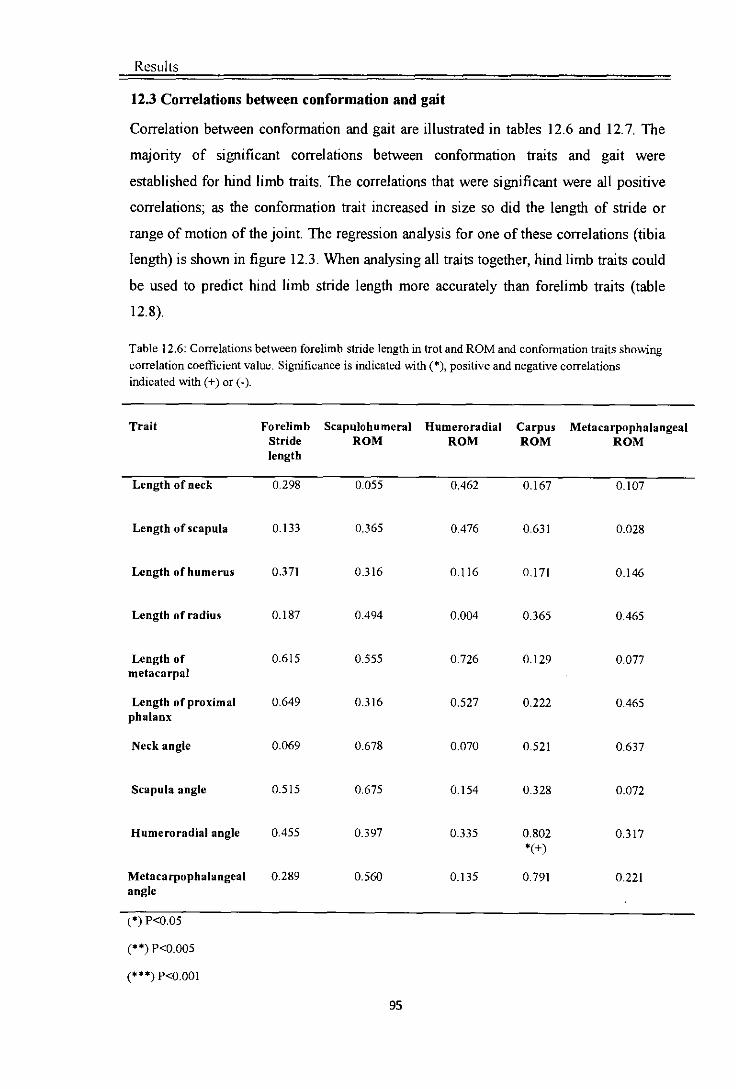
Results
123 Correlations between conformation and gait
Correlation between conformation and gait are illustrated in tables 12.6 and 12.7. The
majority of significant correlations between conformation traits and gait were
established for hind limb traits. The correlations that were significant were all positive
correlations; as the conformation trait increased in size so did the length of stride or
range of motion of the joint. The regression analysis for one of these correlations (tibia
length) is shown in figure 12.3. When analysing all traits together, hind limb traits could
be used to predict hind limb stride length more accurately than forelimb traits (table
12.8).
Table 12.6: Correlations between forelimb stride length in trot and ROM and conformation traits showing correlation coefficient value. Significance is indicated with (), positive and negative correlations indicated with (+) or (-).
Trait Forelimb Scapulohumeral Humeroradial Carpus Metacarpophalangeal Stride ROM ROM ROM ROM length
Length of neck 0.298 0.055 0.462 0.167 0.107
Length of scapula 0.133 0.365 0.476 0.631 0.028
Length of humerus 0.371 0.316 0.116 0.171 0.146
Length of radius 0.187 0.494 0.004 0.365 0.465
Length of 0.615 0.555 0.726 0.129 0.077 metacarpal
Length of proximal 0.649 0.316 0.527 0.222 0.465 phalanx
Neck angle 0.069 0.678 0.070 0.521 0.637
Scapula angle 0.515 0,675 0.154 0.328 0.072
Humeroradial angle 0.455 0.397 0,335 0.802 0.317
Metacarpophalangeal 0.289 0.560 0.135 0.791 0.221 angle
() P<0.05
() P<0.005
(***) P<0.001
Wi

Results
Table 12.7: Correlations between hind limb stride length in trot and hind limb conformation traits showing correlation coefficient. Significance is indicated with (), positive and negative correlations indicated with (+) or
(-).
Trait Hind Tarsus Metatarsopophulangeal limb Coxofemoral Femorotibjal (ROM) (ROM) Stride ROM ROM length
Length of pelvis 0.020 0.365 0.026 0.080 0.116
Length of femur 0.347 0.368 0.053 0.630 0.115
Length of tibia 0.933 0.516 0.321 0.478 0.365
Length of 0.167 0.174 0.373 0.404 0.003 metatarsal
Length of proximal 0.252 0.361 0.417 0.217 0.318 phalanx
Coxofemoral angle 0.786 0.537 0.124 0.390 0.433
Femorotibial angle 0.075 0.823 0.645 0.190 0.136
Tarsal angle 0.246 0.456 0.535 0.252 0.093
Metatarsophalangeal 0.904 0.099 0.136 0.018 0.530 angle
(*) P<0.05
(**) P<0.005
(***) p<0.001
OR

41 42 43 44 45 46
Tibia Length (cm)
j 210 -C
to 205
—200
195
190
40
220
215
Results
Figure 12.3: Regression for tibia length and hind limb stride length showing a significant positive
conelation(PCU.005) with a regression value of 83.99%.
Table 12.8: Stepwise regression analysis of all hind limb conformation traits with hind limb stride length.
Levels of significance indicated by; * P<0.05; ** P<0.005; "a P<0.001; NS not significant.
Trait 1 2 3 4
Length of tibia ** NS ** **
Metatarsophalangeal NS ** **
angle
Length of proximal ** **
phalanx
Femorotibial angle NS
Regression value (¼) 83,88 93.14 99.84 100.00
F;Yi

Results

Chapter Thirteen: Discussion
13.0 Discussion
The aim of this chapter was to define the normal range of conformation and stride
characteristics for a distinct breed of horse (the Arabian) to determine if a specific breed
has unique conformation and gait patterns. It has previously been established in part II
that individual horses have inherent locomotion patterns; more so for range of motion
than stride length (small intra-horse variation), and this has also been documented
previously in research using horses of different breeds (Drevemo ci al., I 980a; Drevemo
ci al., 1980b; Degueurce el al., 1997). To date, no attempt has been made to define
normal conformation and gait in the Arabian horse, using a method that will be easily
reproducible for use by the equine industry.
Table 13.0: Normal conformation and stridc characteristics (in trot) for purebred Arabian horses (mean age 27±10.56 months).
Conformation traits Mean value (th1SE) Neck (cm) 54.14 ±6.16 Scapula (cm) 33.17±4.04 Humerus (cm) 28.74±3.97 Radius (cm) 48.87±2.89 Metatarsal (cm) 30.75±3.64 Proximal phalanx (cm) 11.13±0.94 Ilium (cm) 28.63±3.32 Femur (cm) 37.86±4.56 Tibia (cm) 42.61±1.83 Metatarsal (cm) 38.78±3.39 Proximal phalanx (cm) 11 .28±2.00 Neck (°) 97.82±5.56 Scapulohumeral (°) 114.40±2.92 Hurneroradial (°) 152.03±8.85 Metacarpophalangeal (°) 141.88±4.58 Coxofemoral (°) 116.13±2.10 Femorotibial (°) 162.78±10.99 Tarsus (°) 164.30±3.49 Metatarsophalangeal (°) 148.62±8.86 Stride Parameters (in trot) Mean value (±1SE) Forelimb stride length (cm) 206.38±2.42 Hind limb stride length (cm) 204.80±2.28 Velocity (cm/s) 318.49±6.02 Scapulohumeral ROM (°) 19,54±0.86 Humeroradial ROM (°) 53.67±0.80 Carpus ROM (') 72.29±1.3 Metacarpophalangeal ROM (°) 95.81±2.04 Coxofemoral ROM (°) 29.04±0.71 Femorotibial ROM (°) 46.77±0.89 Tarsus ROM (°) 60,44±0.85 Metatarsophalangeal ROM (°) 104.29±2.36

Discussion
The method used in this chapter was validated and standardised in the previous parts of
this research, and it was established that the two dimensional motion analysis software
used is accurate and reliable, and the method simple but accurate enough to be used on a
day-to-day basis by equine practitioners. Inter-horse variation was used to determine if
there were any significant differences between horses; intra-group variation used to
develop the baseline dataset (table 13.0).
Conformation data obtained from analysing the Arab horses used in this study were
parametric; the data were normally distributed within the population. In normally
distributed data, 68.26% of the data is within one standard deviation of the mean, and
nearly all the data (99.74 1/o) within three standard deviations from the mean; the mean
value therefore is a reliable figure to represent the population. This is important in a
smaller sample size (six horses). It is almost impossible to measure all the individual
members of a population (Wheater and Cook, 2000), therefore samples were used as a
representation of the population being measured-in this case conformation of Arabian
horses. The null hypothesis was rejected as all data were parametric. Previous studies
into breed-specific conformation have also established quantitatively measured
conformation traits to be normally distributed when analysing variation in conformation
of a distinct breed (Weller etal., 2006c).
Cano ci al. (2001b) compared Arab conformation to other breeds, using a similar
method to the present study. Angular conformation traits of seven Arab horses were
measured, all measurements for joint angles were smaller than the present study except
hind metacarpophalangeal angle that was larger. The standard deviations in the Cano et
al. (2001b) study were much higher than the ones in the present study, showing the data
was more spread out; there was higher variation between horses in the study by Cano ci
a! (2001b) than the present study. This could be due to age effects. Horses in the Cano
ci at (2001b) study were older, mean age was 6. 1±4.0 years, and this led to a large
range in heights (which may be why there was a larger range in conformational
measurements compared to the present study where horses were of a similar age). The
large standard deviation shows there was also a greater range of ages compared to the
horses in the present study. Age has previously been linked to training; it is possible a
horse trained to a higher standard will have a different stance to a young horse that has
received no training (such as the horses in the present study). It has been discussed
previously how stance of the horse (when stood square for conformation assessment)
has a significant effect on the reliability of conformational measurements (Weller ci al.,
100

Discussion
2006), and this could be why measurements were different between the two studies. The
effect of stance on conformational measurements is probably accentuated in Arab show
horses due to the specific training Arab horses are subjected to (particularly with in-
hand showing), to achieve a particular stance in the show ring. There was no
information on the type of Arabs used in the Cano ci a! (2001b) study, or what
discipline (if any) they competed in.
The coefficient of variation values for each trait follow the same pattern as with the
conformation data in part U. Linear traits were more variable between horses than
angular traits. It was suggested in part H that intra-horse variation was partly due to
limitations of the method such as stance of the horse, marker placement and soft tissue
artefact, rather than inherent variation in conformation. This is probably true with the
current data, as it has previously been established that horses of a similar breed have
similar conformation (Holmstrom cial., 1990; Cano c/at, 2001b). In contemplation of
this, the null hypothesis was there would be no significant differences in the quantitative
measurement of conformation between Arab horses in the study. The study aimed at
analysing the amount of variation between horses therefore measures of variance (COV
and SE values) are of more value than analysing differences. This method of reporting
variability of conformation within a population was used by Weller ci al. (2006c) when
analysing the variation in conformation of Thoroughbred horses. Weller ci al. (2006c)
used standard deviation as an indicator of the spread of conformation data within the
population. Comparing the standard deviation from that study to the present study, the
range of values were very similar for angular and linear traits. The Arab conformation
data in the present study ranged from 0.38cm to 2.52cm for linear measurements (length
of fore proximal phalanx and neck), and 2.92° to 10.99° (for scapula and femorotibial
angle respectively). The Thoroughbred conformation in the study by Weller ci al.
(2006c) ranged from 0.65cm to 8.04cm (carpal and horse length), and 3.08 0 to 10.020
(for carpus and coxofemoral angle respectively). Similarly to part II, linear traits were
less variable than angular traits. The low variation within the sample reinforces the idea
that horses of similar breed have similar conformation. This suggests that due to the
strong link between conformation and locomotion, horses of the same breed will have
similar gait characteristics.
Stride length (fore and hind limb) and velocity were not normally distributed; data were
non parametric, although hind limb stride length and velocity could be transformed. The
null hypothesis therefore can only partially be rejected. The coefficient of variation for
101

Discussion
stride length for the Arab horses was less than the intra-group variation in stride length
established for the subjects in part H. These results support the hypothesis that there is
less variation in stride parameters in horses of the same, or similar breeds, and has
previously been established in various breeds such as Dutch Warmblood, Andalusian
(Galisteo ci al., 1996); Standardbreds (Drevemo ci al., 1 980a; Drevemo ci al., 1 980b).
There appears to be two separate groups within the data. Horses one, two and three were
not significantly different from each other for stride length or velocity, and the same
with horses four, five and six; although the second group had significantly longer stride
length and velocity to the first three horses. Horses were recorded over three days, but
these days do not correspond to the different groups. It was established in part II of this
study that day had a significant influence on stride length (Pc0.001), however can be
discounted as a factor in this study. Age of horse may be a factor influencing the
variations in stride length. Horses one, two and three were all the same age (24 months),
which could explain why there was no significant difference between stride length and
velocity for this group. Horses four, five and six however were different ages. Horse
four was the eldest horse (48 months), horse five was the same age as horses one-three
(24 months), and horse six the youngest (18 months). There must be another factor
influencing velocity and stride length that would explain why the two groups are
different. Gender effects might be one explanation of this. Horses one-three were all
fillies; horses four to six included one mare (48 month old), one gelding (24 months)
and one colt (18 months). It has previously been reported that fillies have shorter stride
lengths than colts in racing Thoroughbreds (Seder ci al., 2003) therefore it is possible
that gender is having the same effect in the present study.
A comparison of stride characteristics of Arab horse from the present study, with horses
of various breeds from previous studies reveals some interesting differences. The
analysis of stride length data established the Arab horses in the present study had the
shortest stride length compared to Anglo-Arabs, Andalusian and Dutch Warmblood
horses (Galisteo cIal., 1997; Cano cial., 2001b). Analysis of range of motion data also
revealved some interesting comparisons. The majority of joints measured, the Arab
horses displayed the smallest ROM values, compared to other breeds. This would
explain the shorter stride length to a certain extent. Some of the joints measured were
similar to other breeds, namely ROM of the tarsus joint, where values only ranged from
24.8° (Anglo-Arab) to 29.6° (Andalusian). Two joints measured had greater ROM in the
Arabs than the other breeds (except Andalusian); the metacarpophalangeal and
102

Discussion
metatarsophalangeal. This could be accounted for by differences in age. Previous
research has established age affects the kinematics of the metacarpophalangeal joint
(Butcher and Ashley-Ross, 2002). Two year old Thoroughbreds had more
metacarpophalangeal joint flexion compared to five year old Thoroughbreds. Increased
flexion could lead to an increase in ROM, which would explain why the younger Arab
horses had larger ROM for the metacarpophalangeal joint, but generally smaller ROM
for other joints (and shorter stride length) compared to other breeds. These differences
between breeds could be due to not just age, but differences in velocity and
conformation between the different breeds as well.
Comparing the current data to previous studies that have measured Arab stride length at
trot (Cano ci at, 2001b), revealed the horses in the present study had slightly shorter
stride length (2.06±2.4m) compared to the horses in the Cano ci al. (2001b) study
(2.6m). The horses in the present study were also travelling slower, with a mean
velocity of 3.2±6.0mIs compared to 4.8±0.4mIs in the Cano ci al. (2001b) study.
Velocity was regulated in the present study using a stop clock, however this was not a
very reliable method of regulating velocity as there were still high levels of variation
between horses (leading to increased variation in stride length). Velocity is positively
correlated to stride length (Back et al., 1993b; Clayton ci al., 2002), as velocity
increases so does stride length. In the present study there was a significant positive
correlation between velocity and stride length (Pc0.001). The differences in velocity
between the two studies could explain the variations in stride length. The discrepancy
could also be accounted for by the variation in age and size of the horses, as previously
mentioned when discussing differences in conformation. The direct link between
conformation and locomotion means that a difference in conformation will probably
lead to a difference in locomotion between the two groups. Regression between
conformational traits measured and stride characteristics determined exactly how
conformation affected gait characteristics for the Arab horses.
Correlations between conformation and gait characteristics revealed more significant
correlations for the hind limb compared to forelimb. The forelimb established only the
static humeroradial angle to be positively correlated to carpal ROM (P<0.05). Analysis
of the hind limb revealed length of tibia and metatarsophalangeal angle to be positively
correlated to stride length (P<0.005; P<0.05), and femorotibial angle to be positively
correlated to coxofemoral ROM (P<0.05). The stepwise regression established when
using conformation traits (length of tibia, metatarsophalangeal angle, length of hind
103

Discussion
proximal phalanx and femorotibial angle) hind limb stride length could be very
accurately predicted (regression value 100 1/6). Hind limb stride length, compared to
forelimb stride length was less variable, it is possible that stronger correlations were
established because the stride was more stable. Correlations between conformation and
gait have previously been established, particularly for scapula conformation and stride
length (Holmstrom ci at, 1990; Back ci at, 1996; Weller cial., 2006b). It is surprising
therefore that no significant correlations were established between scapula conformation
and stride length in the current study. Differences in conformation may also account for
differences in stride length for Arab horses. The three horses with the longest stride
length also had the longest scapula length, however (possibly due to the small sample
size) this relationship was not significant. When analysing the traits that were
significantly correlated to stride length, inter-horse conformation was fairly similar.
This is reflected by the low standard deviation values for conformation data.
Intra-group variation (variation within the sample as a group) for range of motion was
low, there were small variations between horses but these variations were not
significant. The analysis of inter-horse variation demonstrated repeat had no significant
effect on ROM (P>0.05) for each horse, which had been a consistent result throughout
the study. This reinforces the theory that horses have good short term repeatability in
stride characteristics, and five repeats is sufficient to obtain baseline measures of these
characteristics. Range of motion was not significantly different between horses
(P>0.05). This is an interesting result as it means that from the sample used (six horses),
all of them displayed similar gait characteristics in terms of range of motion. This
indicates normal gait can be defined for a distinct breed of horse. The ROM data in
table 13.0 for the horses in the present study are smaller than the ROM data presented in
table 1.0 (page 13), taken from Canoe! al. (2001b). One joint produced similar ROM,
that was the coxofemoral, with ROM values of 29.04° (present study) and 29.50° (Cano
cial., 2001b). This is interesting, as when comparing the conformation data between the
two studies, larger angles were reported by Cano ei at study for the majority of joints,
compared to the present study. It has previously been established there is a relationship
between conformation and gait, for example larger scapulohumeral angles lead to longer
stride length (Weller ci al., 2006b), although no correlations were established between
scapula conformation and stride length or ROM in the present study. Larger joint angles
measured for static conformation should lead to great ROM in that joint; a larger angle
gives the joint more potential for a larger ROM providing the full potential is used. It
104

Discussion
appears that perhaps the horses in the present study were not using the full ROM
potential available to them hence why although joint angles were larger when assessing
static conformation but ROM was smaller. Velocity is one possible explanation for this.
The horses in the present study were over one meter per second slower (3.2mIs
compared to 4.8mIs). It was established in part II that some joint ROM were correlated
with velocity (table 8.24, page 78), and this accounted for the variability of horses gait
between days. It has been established previously that velocity does affect stride
parameters; Sloet van Oldruitenborgh-Oosterbaan and Clayton, (1999) found an
increase in joint ROM for the humeroradial, metacarpophalangeal and carpal joints with
an increase in velocity. In the present study the correlations were not particularly
strong, with regression values ranging from 1.8% to 33.4%; this implies other factors
influence range of motion. Cano ci al. used a similar sample size to the present study
(seven horses), and a similar method; horses were trotted in hand along a track although
recorded their horses were recorded from the right side, instead of the left. The biggest
difference between the two studies is the age of the horses used (as previously
discussed). It does not state in the study by Cano cI at whether the horses were backed
or un-backed, but it does state the horses were not involved in any specific training
programme. The study also mentions that although the horses conformed to the breed
standard in terms of conformation, the Arabian horses were relatively higher at the
withers than normal. Age, training and height at the withers could all be possible factors
to explain the discrepancies between the two data sets.
Age, height at the withers and training are all linked. Taller horses have longer stride
length, and larger ROM. It is questionable as to when horses' gait patterns stop
developing. Some authors suggest it can be as late as 36 months, with the largest
amount of change being between 12 and 24 months (Cano ci al., 2001 a). Other authors
suggest it can be as young as four months (Back ci al., 1993; 1994), although these
studies were performed in a treadmill therefore not comparable with the present study.
Increasing age may not necessarily lead to larger ROM; a study by Butcher and Ross
(2002) found that young racehorses (two year old Thoroughbreds) had more flexion in
their joints compared to five year old Thoroughbreds; possibly due to immaturity of the
suspensory ligaments in the distal limb allowing for more flexion. A study by Cano ci
at (1999) contradicts these results as greater ROM was established for adult (12.3±2.9
years old) compared to young (3.7±0.2 years old) Andalusian horses. ROM increased
from 17.2±5.5 0 to 22.8±4.9° for scapulohumeral ROM for example. A further study by
105

Discussion
Cano ci al. (2001 a) produced similar results with humeroradial ROM increasing
from54.8±3.6 0 to 60.2±6.6° in horses aged 12 to 36 months. Bearing this in mind, the
horses in the present study may have produced smaller ROM values for the joints
measured compared to the previous study Cano cial. (2001b) due to their age. It is also
possible that ROM may have increased as these horses got older. One of the reasons for
choosing young horses was to eliminate the possible effect training has on stride
parameters; amount or level of training could be another explanation why the results of
the two studies were different. There is plenty of evidence that training does influence
stride parameters (Drevemo ci at, 1980b; Back c/at, 1995; Cano cial., 2000; Ferrari ci
al., 2009), probably due to an increase in coordination (Back cial., 1999). It is plausible
therefore that horses in the present study displayed smaller ROM (despite large joint
angles when analysing static conformation) compared to horses in the study by Cano et
al., 2001a) due to their age and lack of training. It would be interesting to reassess stride
parameters in the same group of horses after they had been backed to establish if there
was a significant difference in stride length or ROM.
The small inter-horse variation established for stride characteristics for a sample of Arab
horses used in this study illustrates that distinct breeds have specific gait patterns.
Conformation data were all established as parametric, therefore the null hypothesis
(conformation data would not be normally distributed within the population) can be
rejected. The null hypothesis that there will be no difference between horses gait can
only be partially rejected; stride length was different between some (but not all horses)
but there was no significant differences in ROM between any horses. Likewise, the
hypothesis there would be no correlation between conformation and gait can only be
partially rejected; few traits were significantly correlated to gait (mostly hind limb
traits). Gait patterns are correlated to conformation, which is inherently different
between breeds (Galisteo ci al. 1997), but may be affected by limitations such as age,
gender and velocity. This reinforces the idea that if normal gait for distinct breeds is to
be quantified by breed societies, the methods used to obtain these baseline measures
must be standardised across all breed societies.
106
Conclusion
14.0 Conclusion
14.1 Overview
This research involved three separate but interlinked studies with the overall aim of
developing an accurate method of defining normal gait in a distinct breed of horse. The
study has highlighted that it is essential to validate software prior to use and to know the
margin of error for the software before analysing results. The aim of the standardisation
study was to determine a method to obtain baseline conformation and gait parameters
using two-dimensional motion analysis techniques. This highlighted the importance of
accuracy in the methodology of using 2D motion analysis, specifically in marker
placement, which was noted as one of the biggest causes of error. These validated
methods were then used to define normal gait in a distinct breed of horse.
14.2 Limitations
Two dimensional motion analysis techniques are not without limitations, namely
distortions due to out of plane movements, when capturing three dimensional motion in
two dimensions. This is an inevitable limitation when using a 2D method to record 3D
movement. The use of 3D methods of gait analysis such as optoelectronic systems are
more accurate, but currently are not practical to be easily used "in field". Other gait
analysis systems such as accelerometers using GPS based technology are suitable for
"in field" analysis, however to do not currently provide the same detailed information
that 2D analysis. Despite its limitations, because 2D gait analysis is designed to be
portable and simple to use, it still remains the most practical solution for this type of
gait analysis.
The purpose of standardising a method of 2D motion analysis was to provide the equine
industry with a practical and reproducible method to assess gait and conformation. The
method therefore needed to be simple and quick to execute. It was evident however
from the intra-horse variation in conformation that there were still discrepancies in
marker placement, despite one researcher following the same specific protocol. In
research, the experience of the person applying the markers may outweigh the
limitations of the method, however if this method was to be adopted by the industry,
inconsistency between equine practitioners applying the markers would be a huge
limitation of the method. This could be addressed by developing a specific palpation
protocol to allow the anatomical landmarks to be identified. This protocol would need
108

Conclusion
rigorous testing and validating to enable it to be deemed appropriate, a possible avenue
for future development of the current study
A further limitation of the current study is regulating the stance of the horse when
assessing conformation. It is difficult to control the stance of the horse, therefore it is a
limitation of using this method to measure conformation. Stance does not have a large
effect on the reliability of the results, compared to marker placement, particularly if
repeated measures are taken. Stance is more repeatable if conformation is measured
when the horse is stood on a hard level surface and evenly weight bearing. Taking the
time to ensure the horse is stood square and perpendicular to the camera will limit
stance related variations and distortions due to out of plane rotation. One possible
method of ensuring the horse is evenly weight bearing would be to use pressure mats.
This would be another opportunity for future research, to develop the current study to
attempt to improve the repeatability of measuring conformation using 2D motion
analysis techniques.
It is also veiy hard to regulate velocity when trotting horses in hand, even when using
the same handler and timing the repeated trials. Other research has accounted for
intrinsic variations in velocity by using treadmills, but these have been shown to alter
gait characteristics therefore it is difficult to extrapolate treadmill data to "real life"
situations. The use of timing gates would be a more accurate method of timing the
horses compared to a stop clock, a method which was tested in the present study then
disregarded due to the time taken to set up the equipment. To overcome this problem in
future research, an accelerometer could be used to measure the horses velocity for each
repeated trial. The accelerometer would have to transmit the data instantly to a
computer, to avoid delays between repeated measures but overall would be a more
accurate method of measuring velocity.
The manual input required for processing the data once downloaded is an additional
limitation; digitiser error can cause errors in accuracy and repeatability of
measurements. Errors can be reduced by using the same researcher to digitise all video
clips, as in the present study, however this method is not infallible. The improvement of
the automatic tracking features of the software would be a worthwhile addition to the
overall efficacy of the software, for both reliability whilst digitising and practicality for
use in the industry. Once developed, the accuracy of automatic tracking would need to
be validated. This would be a very valuable addition to the current research that
109

Conclusion
validated the overall accuracy of the software and definitely a consideration for future
research.
14.3 Future research considerations
Additional considerations for future research would be to re-test the Quintic© software
using a high speed camera. This would establish to what extent the aspect ratio of the
camera was causing the inaccuracies (compared to the cosine algorithm), specifically in
angular measurements, and therefore if the software was suitable to use with a high
speed camera.
A further development would be to use the same protocol to define normal gait in more
than one breed, to allow the direct comparison between gait characteristics in different
breeds. If gait was measured over consecutive days (as with the standardisation study)
this would also provide interesting information about the day-to-day variability of stride
characteristics within different breeds.
14.4 Practical application
The purpose of this research was to inform the equine industiy of the accuracy and
reliability of software and protocols used for "in field" gait analysis, as well as
providing information on normal gait of Arab horses. This research has direct
implications for the equine industry, as it is providing vital practical information that
can be used directly by equine practitioners using gait analysis. The practical
implications of defining normal gait will potentially provide the Arab Horse Society (or
further breed societies willing to adopt the protocol) with not only a standardised
method of measuring conformation and gait, but a baseline with which to compare other
horses to. This will be particularly beneficial for grading and judging performance, by
providing a quantitative measure with which to score horses against, ultimately
producing completely objective grading and judging systems.
110

Conclusion
14.5 Conclusion
The normal conformation and gait for Arab horses that were quantified in part ifi of this
study illustrate distinct breeds have specific gait patterns. Range of motion was similar
for all joints and horses, therefore a reliable indicator of normal gait in Arab horses.
Gait patterns were correlated with conformation, which is inherently different between
breeds. This reinforces the proposal that if normal gait for distinct breeds is to be
quantified by breed societies, the methods used to obtain these baseline measures must
be standardised across all societies. If details of age and training are included as part of
a database of normal conformation and gait a better overall picture of breed
characteristics will develop. In effect, the database would have information on the
typical conformation and gait of a specific breed with the effects of age and training
included. The data from this study provides useful information for future equine gait
analysis research, in terms of accuracy of the software and protocols. It could also be
used to provide the Arab Horse Society with helpful information about normal gait
characteristics for the breed, allowing Arab horses to be classified using gait analysis.
:iii

Chapter Fifteen: References
15.0. References
ANDERSON, T. & MCILWRAITI-1, C. (2004) Longitudinal development of equine conformation from weanling to age 3 years in the Thoroughbred. Equine Veterinary Journal, 36, 563-570.
ANDERSON, T., MCILWRAITFI, C. & DOUAY, P. (2004) The role of conformation in musculoskeletal problems in the racing Thoroughbred. Equine Veterinary Journal, 36, 571-575.
BACK, W., VAN DEN BOGERT, A., VAN WEEREN, P., BRUThT, G. & BARNEVELD, A. (1993a) Quantification of the locomotion of Dutch Warniblood foals. Ac/a Anatomica, 146, 141-147.
BACK, W., BARNEVELD, A., VAN WEEREN, P. & VAN DEN BOGERT, A. (1993b) Kinematic gait analysis in equine carpal lameness. Ac/a Anatomica, 146.
BACK, W., BARNEVELD, A., BRUIN, 0., SCHAMHARDT, H. & HARTMAN, W. (1994a) Kinematic detection of superior gait quality in young trotting warmbloods. The Veterinary Quarterly Supplement, 16, 91-96.
BACK, W., BARNEVELD, A., BRLJIN, G., SCI-L&MHARDT, H. & HARTMAN, W. (1 994b) Longitudinal development of the kinematics of 4, 10, 18 and 26-month old Dutch Warmblood horses. Equine Veterinary Journal Supplement, 17, 3-6.
BACK, W., SCHAMTTIARDT, H. C., HARTMAN, W., BRJJIN, G. & BARNEVELD, A. (1 995a) Predictive value of foal kinematics for the locomotor performance of adult horses. Research in Veterinary Science. 59, 64-69.
BACK, W., SCHAMHARDT, H., SAVELBERG, H., VAN DEN BOGERT, A., BRUTh'.T, 0., HARTMAN, W. & BARNEVELD, A. (1995b) How the horse moves: 1. Significance of graphical representations of equine forelimb kinematics. Equine Veterinary Journal, 27, 31-38.
BACK, W., SCHAMHARDT, H. & BARNEVELD, A. (1996) The influence of conformation on fore and hind limb kinematics of the trotting Dutch Warmblood horse. Pferdeheilkunde, 12,647-650.
BACK, W., MACALLISTER, C. 0., VAN HEEL, M. C. V., POLLMEIER, M. & HANSON, P. D. (2007) Vertical Frontlimb Ground Reaction Forces of Sound and Lame Warmbloods Differ From Those in Quarter Horses. Journal of Equine Veterinary Science, 27, 123-129.
BARREY, E. (1999) Methods, Applications and Limitations of Gait Analysis in Horses. The Veterinary Journal, 157, 7-22.
110

References
BARTLEn, R. (2006) Introduction to sports biomechanics: Analysing human movement patterns. London, Routledge.
BOWLING, A. & RUVINSKY, A. (2000) The genetic resources and their conservation. The Genetics of the Horse. UK, CAB International
BREEN, E. (2009) A comparison ofjudging techniques and conformation traits in Irish Draught horses. Unpublished Thesis, University of Limerick, Ireland
BUCHNER, F., KASTNER, J., G1RTLER, D. & KNEZEVIC, P. (1993) Quantification of hind limb lameness in the horse. ActaAnatomica, 146, 196-199.
BUTCHER, M. T. & ASHLEY-ROSS, M. A. (2002) Metacarpophalangeal joint kinematics differ with age in thoroughbred racehorses. Journal ofBiomechanics, 35, 563-571.
CANO, M., MIRO, F., VIVO, J. & GALISTEO, A. (1999) Comparative biokinematic study of young and adult Andalusian horses at the trot. Journal of Veterinary Medical A ssociation, 46, 91-101.
CANO, M. K, MIRO, F., MONTERDE, J., DJZ, A., MARTIN, J. & GALISTEO, A. (2001a) Changes due to age in the kinematics of trotting Andalusian foals. Equine Veterinary Journal Supplement, 33, 116-121.
CANO, M. K, VIVO, J., lvllRO, F., MORALES, J. L. & GALISTEO, A. M. (2001b) Kinematic characteristics of Andalusian, Arabian and Anglo-Arabian horses: a comparative study. Research in Veterinary Science, 71, 147-1 53.
CERVANTES, I., MOLINA, A., GOYACHE, F., GUTIERREZ, J. P. & VALERA, M. (2008) Population history and genetic variability in the Spanish Arab Horse assessed via pedigree analysis. Livestock Science, 113,24-33.
CHIARI, L., CROCE, U. D., LEARDINT, A. & CAPPOZZO, A. (2005) Human movement analysis using stereophotogrammetry: Part 2: Instrumental errors. Gait & Posture, 21, 197-211.
CLAYTON, H., HOYT, D., WICKLER, S., COGGER, E. & LANOVAZ, J. (2002) Hindlimb net joint energies during swing phase as a function of trotting velocity. Equine Veterinary Journal Supplement, 34, 363-367.
CLAYTON, H. & SCHAMHARDT, H. C. (2001) Measurement techniques for gait analysis. IN BACK, W. & CLAYTON, H. (Eds.) Equine Locomotion. London, W. B. Saunders.
COLBORNE, G. R. (2004) Gait analysis: technology looking for a place to happen? The VeterinaryJournal, 168,112-113.
DAMON, F., VARRAINE, E., BONNARD, M. & PAJLHOUS, J. (2003) Stride variability in human gait: the effect of stride frequency and stride length. Gait and Posture, 18, 69-77.
111
References
DEGUEURCE, C., DIETRICH, G., POURCELOT, P., DENOIX, J. & GEIGER, D. (1996) Three dimensional kinematic technique for evaluation of horse locomotion in outdoor conditions. Medical and Biological Engineering and computing, 34, 249-252.
DEGUEUR.CE, C., POURCELOT, P., AUDIGIE, F., DENOIX, J. & GEIGER, D. (1997) Variability of the limb joint patterns of sound horses at trot. Equine Veterinary Journal Supplement, 23, 89-92.
DELUZIO, K. J., WYSS, U. P., LI, J. & COSTTGAN, P. A. (1993) A procedure to validate three-dimensional motion assessment systems. Journal of Biornechanics, 26, 753-759.
DEHEL, N. & PARK, J. (1990) The gait patterns of Olympic dressage horses. International Journal of Sport Biomechanics, 6, 198-226.
DE SOUZA, M. GALISTEO, A. MIRO, F. (2004) Influence of camped under associated with upright proximal phalanxs in front conformation in the forelimb movement of horses. Equine Veterinary Science, 24, 341-346.
DREVEMO, S., DALIN, (1, FREDRICSON, I. & HJERTEN, G. (1980a) Equine locomotion I: The analysis of linear and temporal stride characteristics of trotting Standardbreds. Equine Veterinary Journal. 12, 60-65.
DREVEMO, S., DALIN, U, FREDRICSON, I & BJORNE, K. (1980b) Equine locomotion 3: The reproducibility of gait in Standardbred trotters. Equine Veterinary Journal 12, 71-73.
DUBOST, V., ANNWEILER, C., AMINIAN, K, NAJAFI, B., HERRMANN, F. R & BEAUCHET, 0. (2008) Stride-to-stride variability while enumerating animal names among healthy young adults: Result of stride velocity or effect of attention-demanding task? Gait & Posture, 27, 138-143.
EDGAR, D., FINLAY, V., WU, A. & WOOD, F. (2009) Goniometry and linear assessments to monitor movement outcomes: Are they reliable tools in bum survivors? Burns, 35, 5 8-62.
FERRARJ, M., PFAU, T., WILSON, A. & WELLER, R. (2009) The effect of training on stride parameters on a cohort of National Hunt racing Thoroughbreds: A preliminary study. Equine Veterinary Journal, 41, 493497.
FULLER, C., BLADON, B., DRWER, A. & BARR, A. (2006) The intra- and inter-assessor reliability of measurement of functional outcome by lameness scoring in horses. The Veterinary Journal, 171.
GALISTEO, A., CANO, M., MORALES, J., VIVO, J. & MIRO, F. (1998) The influence of speed and height at the withers on the kinematics of sound horses at the hand-led trot. Veterinary Research Communications, 22,415423.
GALISTEO, A., CANO, M., MORALES, J., VIVO, J., MIRO, F. & AGUERA, E.
112

References
(1997) Differences between breeds (Dutch Warmblood vs Andalusian Purebred) in forelimb kinematics Journal ofEquine Veterinary Science, 8,43-47.
GALISTEO, A., CANO, M., MORALES, J., VIVO, J., MIRO, F. & AGIJERA, E. (2001) Inter-breed differences in equine forelimb kinematics at the walk. Journal of Veterinary Medical Association, 48, 277-285.
GALISTEO, A. M., CANO, M. R., MIRO, F., VIVO, J., MORALES, J. L. & AGUERA, E. (1996) Angular joint parameters in the Andalusian horse at walk, obtained by normal videography. Journal ofEquine Veterinary Science, 16, 73-77.
GHARAHVEYSI, S., KASFIAN, N. F. J., GERAMI, A. & TORSHIZI, R. V. (2008) Estimation of genetic parameters on conformation traits of the Iranian Arab horses population. Pakistan Journal ofBiological Science, 11,280-4.
GOMEZ-ALVAREZ, C., L'AMT, J., MOFFATCI, D., BACK, W. & VAN WEEREN, P. (2008) Effect of chiropractic manipulations on the kinematics of back and limbs in horses with clinically diagnosed back problems. Equine Veterinary Journal, 40, 153-159.
HERRING, L., THOMPSON, K. N. & JARRET, S. (1992) Defining normal three-dimensional kinematics of the lower forelimb in horses. Journal ofEquine Veterinary Science, 12, 172-176.
HOLMSTROMI, M., MAGNUSSON, L. & PFIILIPSSON, J. (1990) Variation in conformation of Swedish Warmblood horses and conformational characteristics of elite sports horses. Equine Veterinary Journal 22, 186-193.
HOLMSTROM, M., FREDRICSON, I. & DREVEMO, S. (1993) Biokinematic analysis of the Swedish Warmblood riding horse at trot. Equine Veterinary Journal 26, 23 5-240.
HOLMSTROM, M. & DREVEMO, S. (1997) Effects of trot quality and collection on the angular velocity in the hindlimbs of riding horses. Equine Veterinary Journal Supplement, 23, 62-65.
HOLMSTROM, M. (2000) How do we recognise elite Show Jumpers? In Proceedings: Conference on Equine Sports Medicine and Science: 2000. Sicily, Italy. 45-56.
HOWARTH, S. & CALLAGHAM, J. (2009) The rule of Is for padding kinematic data prior to digital filtering: Influence of sampling and filter cut-off frequencies. Journal of Electrornyography and Kinesiology, 19, 875-881.
KEEGAN, K. G. (2007) Evidence-Based Lameness Detection and Quantification. Veterinary Clinics of North America: Equine Practice, 23, 403-423.
KHUMSAP, S., LANOVAZ, J. & CLAYTON, H. (2004) Verification of skin-based markers for 3-dimensional kinematic analysis of the equine tarsal joint. Equine Veterinary Journal, 36, 655-658.
KLEIN, P. & DE HAVEN, J. (1995) Accuracy of three-dimensional linear and angular estimates obtained with the ariel performance analysis system. Archives of
113

References
Physical Medicine and Rehabilitation 76, 183-189.
LEARDINT, A., CHART, L., CROCE, U. D. & CAPPOZZO, A. (2005) Human movement analysis using stereophotogrammetry: Part 3. Soft tissue artifact assessment and compensation. Gait & Posture. 21, 212-225.
LELEU, C., BARILLER, F., COTREL, C. & BARREY, E. (2004) Reproducibility of a locomotor test for trotter horses. The Veterinary Journal, 168, 160-166.
LELEU, C., COTREL, C & BARREY, E. (2005) Relationships between biomechanical variables and race performance in French Standardbred trotters. Livestock Production Science, 92, 39-46.
LINDEN, D., CARLSON, S. & HUBBARD, B.. (1992) Reproducibility and accuracy of angle measurements obtained under static conditions with the motion analysis video system. Physical Therapy, 72, 60-65.
LOVEn, B. (2006) An investigation into the reliability of Quintic biomechanics software when used to measure transverse plane tibial rotation through the use of a tibial pointer. Unpublished thesis. Cardiff, University of Wales.
MAGNUSSON, L. (1985) Studies on the conformation and related traits of Standardbred trotters in Sweden thesis, 5km-a. Swedish University of Agricultural Sciences. 194.
MAWDSLEY, A., KELLY, E., SMITH, F. & BROPHY, P. (1996) Linear assessment of the Thoroughbred horse: an approach to conformation assessment. Equine Veterinary Journal, 28, 461-467.
NANKERVIS, K. H., D. MARLIN, D. (2008) Comparison between a sensor (313 accelerometer) and ProRefiex motion capture systems to measure stride frequency of horses on a treadmill. Comparative Exercise Physiology, 5, 107-109.
PEHAM, C., LICKA, T., MAYR, A., SCHEIDL, M. & GIRTLER, D. (1998) Speed dependency of motion pattern consistency. Journal of Biomechanics, 31, 769-772.
ROSE, N., NORTHROP, A., BRIGDEN, C. & MARTIN, J. (2009) Effects of stretching regime on stride length and range of motion in equine trot. The Veterinary Journal, 181, 53-55.
ROSSDALE, P. & BUTTERFIELD, R. (2006) Conformation: a step along the pathway to objective assessment Equine Veterinary Journal, 38, 588-590.
SADEK, M. H., AL-ABOUD, A. Z. & ASHMAWY, A. A. (2006) Factor analysis of body measurements in Arabian horses. Journal ofAnimal Breeding and Genetics, 123, 369-377.
SCHAMHARDT, H., VAN DEN BOGERT, A. & HARTMAN, W. (1993) Measurement techniques in animal locomotion analysis. Ada Anatomica, 146, 123-129.
114

References
SCHOLTZ, J. P. (1989) Reliability of the WAT-SMART three dimensional optoelectric motion analysis system. Journal ofPhysical Therapy, 69, 679-689.
SEDER, J. & VICKERY, C. (2003) Temporal and kinematic gait variables of Thoroughbred racehorses at or near racing speeds. Journal of Equine Veterinazy Science, 23, 5, 82-112.
SELFE, J. (1998) Validity and reliability of measurements taken by the Peak 5 motion analysis system. Journal ofMedical Engineering & Technology, 22, 220-225.
SLOET VAN OLDRHITENBORGH-OOSTERBAAN, M., BARNEVELD, A. & SCHAIv1IHARDT, H. (1996) Kinematics of unmounted and mounted horses at walk before and after treadmill exercise. Pferdeheilkunde, 12, 65 1-655.
SLOET VAN OLDRUITENBORGH-OOSTERBAAN, M. & CLAYTON, H. (1999) Advantages and disadvantages of track vs treadmill. Equine Veterinary Journal Supplement, 30, 645-647.
STERGTOU, N. & SCOFF, M. M. (2005) Baseline measures are altered in biomechanical studies. Journal of Biomechanics, 38, 175-178.
TEEPLE, T., CASTANETA, M., DELUZIO, K. & BRYANT, T. (2009) Pendulum-based method for determining the temporal accuracy of digital video-based motion capture systems. Gait & Posture, 29, 349-3 53.
THORNTON, M., MORRISSEY, M. & COUTTS, F. (1998) Some effects of camera placement on the accuracy of the Kinemetrix three-dimensional motion analysis system. Clinical Biomechanics, 13, 452-454.
VAN WEEREN, P. & CREVIER-DENOIX, N. (2006) Equine conformation: clues to performance and soundness. Equine Veterinary Journal, 38, 591-603.
VAN WEEREN, P., VAN DEN BOGERT, A., BACK, W. B., G. & BARNEVELD, A. (1993) Kinematics of the Standardbred trotter mesured at 6,7,8 and 9 m/s on a treadmill before and after 5 months of prerace training. ActaAnatomica, 146, 154-161.
VAN WEEREN, P., VAN DEN BOGERT, A. & BARNEVELD, A. (1990a) Quantification of skin displacement in the proximal parts of the limbs of the walking horse. Equine Veterinary Journal Supplement, 9, 110-118.
VAN WEEREN, P., VAN DEN BOGERT, A. & BARNEVELD, A. (1 990b) A quantitative analysis of skin displacement in the trotting horse. Equine Veterinary Journal Supplement, 9, 101-109.
WATSON, K. SmsoN, D. & DAVIES,H. (2003) Third metacarpal bone length and skeletal asymmetry in the Thoroughbred racehorse. Equine Veterinary Journal, 35, 7, 712-714.
WELLER, R., PFAU, T., BABBAGE, fl, BRITHN, E., MAY, S. & WILSON, A. (2006a) Reliability of conformational measurements in the horse using a three-dimensional motion analysis system. Equine Veterinary Journal, 38, 610-615.
115

References
WELLER, R., PFAU, T., VERHEYEN, K., MAY, S. & WILSON, A. (2006b) The effect of conformation on orthopaedic health and performance in a cohort of National Hunt racehorses: preliminary results. Equine Veterinary Journal, 38, 622-627.
WELLER, R. PFAU,T. MAY,S. & WILSON, A. (2006c) Variation in conformation in a cohort of National Hunt Horses. Equine Veterinary Journal, 38. 7, 616-621.
WHEATER, P. & COOK, P. (2000) Using statistics to understand the environment, London, Routledge.
WHITE, S. C. & LAGE, K. J. (1993) Changes in joint moments due to independent changes in cadence and stride length during gait. Human Movement Science, 12, 46 1-474.
WILSON, A., SMITH, B. K, GIBSON, J. K., B., C., GABA, B. & VOELZ, J. (1999) Accuracy of digitising using automated and manual methods. Physical Therapy, 79, 558-566.
WILSON, D. J., SMITH, B. K. & GIBSON, J. K. (1997) Accuracy of reconstructed angular estimates obtained with the Ariel Performance Analysis System (TM). Physical Therapy, 77,1741-1746.
Wfl lE, T., HIRST, C. & WILSON, A. (2006) Effect of speed on stride parameters in racehorses at gallop in field conditions. Journal ofExperimental Biology, 209, 43 80-4397.
116

Appendices
Appendix I
REFERENCE NO. Charlotte Robin
FACULTY OF SCIENCE
APPLICATION TO ANIMAL PROJECTS COMMIYITEE FOR APPROVAL OF RESEARCH PROJECT
This form should be completed for all NEW applications for University research support and submitted to the Chair of the Animal Projects Committee.
Does project require a Home Office Licence? NO Project Licence no:_________
Date:25/0212009
Title of Project:
Title: Standardisation and validation of a two dimensional motion analysis technique to develop a unique baseline data set for Arab horses.

Appendix I
Name of researcher and co-workers:
Charlotte Robin Isarth Hobbs
Charlotte Brigden Jaime Martin
IJane Allot Mai' Bloye
1. Aims and objectives of project:
Aims: The aims of the study are to develop and validate a standardised two-dimensional motion capture technique for equine gait analysis; to use the technique to record and analyse the static conformation of a group of Arab horses; to use the technique to record and analyse the normal gait of a group of Arab horses; to develop a unique baseline data set for Arab horses.
Objectives:
1. Standardisation and validation
-to validate a two-dimensional motion analysis capture technique using known statid and dynamic measurements
-to use statistical methods to test for significant differences between the values
-to obtain measurements for static conformation every day for five days and test for variance
-to obtain measurements for stride length and range of motion every day for five days and test for variance
2. Obtaining the unique baseline data set
-to use the technique to obtain static conformation measurements for a group of Arab horses
-to use the technique to obtain measurements for stride length and range of motion for a group of Arab horses

xl
-to provide a unique data set of baseline stride and conformation data to the Arab Horse Society and Arab stud/horse owners
2. Method
Pilot studies:
All pilot studies will take place on the yard at Myerscough College. A hard, flat surface suitable for trotting horses in hand will be used. The same horse will be used for each pilot study and will take place over two days.
1. Field of view
The field of view will be tested to determine the distance of the camera from the subject. A test area will be set up using chalk to mark one meter intervals on the ground. The horse will be trotted passed the camera three times at the set distances, to determine the field of view capable to record one fill stride.
2. Camera settings
Camera settings need to be tested to determine the optimum settings according to light conditions. The settings will be tested on two days; day one (bright, clear conditions); day two (dull, overcast). The horse will be trotted passed the camera three times (at the pre-determined distance). The camera settings (shutter speed and exposure) will be altered by the researcher for each repeat. The data will be downloaded onto a laptop and analysed using a two dimensional motion analysis software package (Quintictm), and the optimum camera settings that allow the markers to be best identified (using the semi-automatic tracking feature) will be utilised.
3. Calibration
No horses will be needed for the calibration test. Three different calibration methods will be tested; a meter stick; half meter square and half meter right angle. A researcher will hold each calibration device and the device will be recorded by a video camera. The video clips will be downloaded onto a laptop and analysed using Quintictm. The calibration device that can be best aligned with the optical axis of the camera, giving the closet values to the physical measurements of the device will be used.
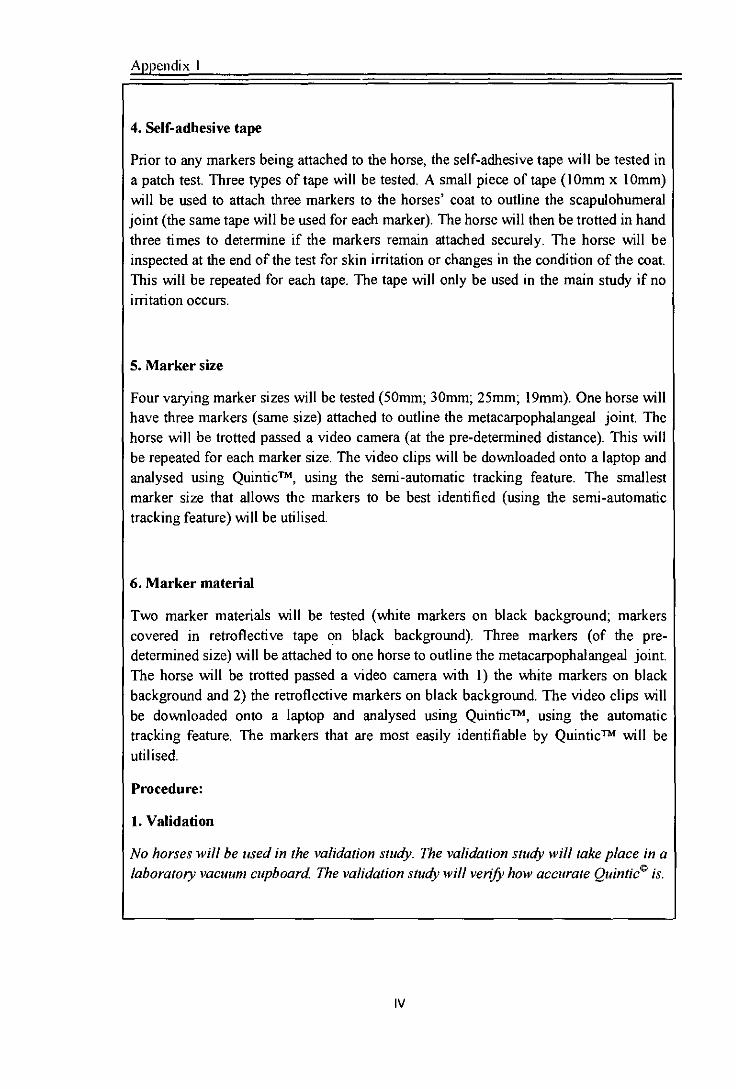
Appendix
4. Self-adhesive tape
Prior to any markers being attached to the horse, the self-adhesive tape will be tested in a patch test Three types of tape will be tested. A small piece of tape (10mm x 10mm) will be used to attach three markers to the horses' coat to outline the scapulohumeral joint (the same tape will be used for each marker). The horse will then be trotted in hand three times to determine if the markers remain attached securely. The horse will be inspected at the end of the test for skin irritation or changes in the condition of the coat. This will be repeated for each tape. The tape will only be used in the main study if no irntation occurs.
5. Marker size
Four varying marker sizes will be tested (50mm; 30mm; 25mm; 19mm). One horse will have three markers (same size) attached to outline the metacarpophalangeal joint. The horse will be trotted passed a video camera (at the pre-determined distance). This will be repeated for each marker size. The video clips will be downloaded onto a laptop and analysed using Quintictm, using the semi-automatic tracking feature. The smallest marker size that allows the markers to be best identified (using the semi-automatic tracking feature) will be utilised.
6. Marker material
Two marker materials will be tested (white markers on black background; markers covered in retroflective tape on black background). Three markers (of the pre-determined size) will be attached to one horse to outline the metacarpophalangeal joint. The horse will be trotted passed a video camera with 1) the white markers on black background and 2) the retroflective markers on black background. The video clips will be downloaded onto a laptop and analysed using Quintictm, using the automatic tracking feature. The markers that are most easily identifiable by QuinticTh will be utilised.
Procedure:
1. Validation
No horses will be used in the validation study. The validation study will take place in a
laboratory vacuum cupboard The validation study will venjj how accurate Quintic ° is.
LIYA

Appendix I
A test rig (see figure 1.0) will be constructed to mimic a pendulum. A bearing with a low coefficient of friction will be attached to a known weight using a nylon cord (fishing line). Spherical markers (shown in black on figure 1.0) will be attached using self-adhesive tape to the centre of the pivot and on the pendulum mass. The pendulum will be set in motion, and recorded using a video camera. Ten individual pendulum swings will be recorded. The data will be downloaded onto a computer and analysed using Quintic ©. The distance travelled by the mass (length of arc); angle between the mass and the vertical; and velocity will be calculated using QuinticTh
(using semi-automatic tracking) and verified using pendulum equations.
2. Standardisation of the method
This study will take place on the yard at Myersco ugh College using a large, fiat non-slip area suitable for trotting horses in hand The study will take place overfive consecutive days.
Figure I .0: Test rig to simulate pendutuen showing; L (length of line); s (length of arc);y (side of right triangle with hypotenuse L); A (height of the mass).
Three horses will be used in the standardisation study to take into account the effects of inter-horse variation. Spherical markers will be attached to the horses using self-adhesive tape. The markers will be attached to specific anatomical landmarks, by the same researcher using a specific palpation method to locate the anatomical site. The horses will be stood square on a level, hard non-slip surface and recorded from the left and right (near and fore) side using two digital video cameras. The horses will be led passed the video camera to habituate the horse to the equipment. This process will also warm the horse up prior to data collection. The horses will then be trotted in hand (by the same handler to attempt to regulate velocity) in front of the cameras (at the pre-determined distance to capture one full stride) ten times for each horse. This procedure will be repeated once a day for five days (capturing 50 repeats for each horse). When the data has been downloaded, the following will be tested; variation for marker placement between days; variation for static conformation between the near and fore side; variation between stride characteristics between the near and for side; variation in stride characteristics between repeats; variation in stride characteristics between days; variation in velocity between repeats; variation in velocity between days.
V

3. Obtaining unique baseline data set (main study)
Data will be collected at the participating Arab studs, over a set period of time (determined by the pilot study). The data will be collected on site at the participating studs, which are all situated in the north west of the UK.
The exact method will depend on the results of the standardisation tests, however the same basic protocol (as above) will be followed. All horses used will be familiarised to the equipment (makers and video camera) prior to data collecting. The horses will be familiarised to the markers by attaching the markers on low risk areas (neck or scapula) before placing them on the distal limb. A patch test with the tape will also be performed on each horse prior to data collection. Any horse that reacts to the tape will be removed from the study. The horses will also be walked (with markers attached) passed the video camera to familiarise them to the presence of the camera (and to warm the horse up prior to data collection). The horse will be given ten minutes for the familiarisation process, if the horse appears to be stressed and is exhibiting abnormal behaviour after this time it will not be used in the study.
The results of the pilot study will be used to work out the sample size needed for the main study. It is estimated that a sample size of twenty will be adequate based on previous studies. Studies by Drevemo et al., 1980a; Drevemo et al., 1980b; Cano et al., 1999; Degueurce et aL, 1997; Cano et al., 2001; Galisteo ci al., 1996 used sample sizes ranging between 30 and 9 horses, giving a mean of 16.
Spherical markers will be attached to the horses using self-adhesive tape. The maikers will be attached to specific anatomical landmarks, by the same researcher using a specific palpation method to locate the anatomical site. The horses will be stood square on a level, hard non-slip surface and recorded (from the near or fore side depending on the outcome of the pilot study) with a digital video camera. The horses will then be trotted in hand in front of the camera by the same handler (at the pre-determined settings to record one successive stride). The number of repeats will be determined by the standardisation study.
The data will be downloaded onto a laptop and analysed for stride length and range of motion using Quintic©. Inter and intra horse variation will be analysed using statistical methods. The data will be used to develop a baseline data set for each individual horse and to define normal gait characteristics for the group.
VI

Appendix I
Handler / owner consent:
The owner of the stud and/or horses will be required to complete and sign an informed consent form prior to any data being collected. Handlers that will be trotting horses in front of the video camera will also be required to complete and sign an informed consent form and a physical readiness activity questionnaire (PAR-Q) form.
Confidentiality:
The horses used in the study will remain anonymous and will not be identified on the video clips or in the written report The data will be analysed as part of a group, with no individual horses being identified. The data will be stored on a password protected computer owned by Myerscough College. Any horses or handlers of whom images are included in the thesis will give written consent for this. It may be possible that the results of this study will be published by the University or Myerscough College to peer reviewed journals and/or conferences. The results may also be released to the Arab Horse Society (written consent from the horse owner will be sought before this happens).
The information from the informed consent and PAR-Q forms will be stored in a locked filing cabinet at UCLan by the director of studies.
3a. How many, and which species of animals are intended to be used in the first year?
Pilot studies
It is intended that three horses will be used in the pilot study, and the standardisation and validation of the method. All horses will be owned and stabled at Myerscough College.
Main study
It is intended that twenty horses will be used for obtaining the unique baseline data set. All horses used in the main study will be purebred Arabs and will be owned and stabled at the various participating Arab studs.
VII
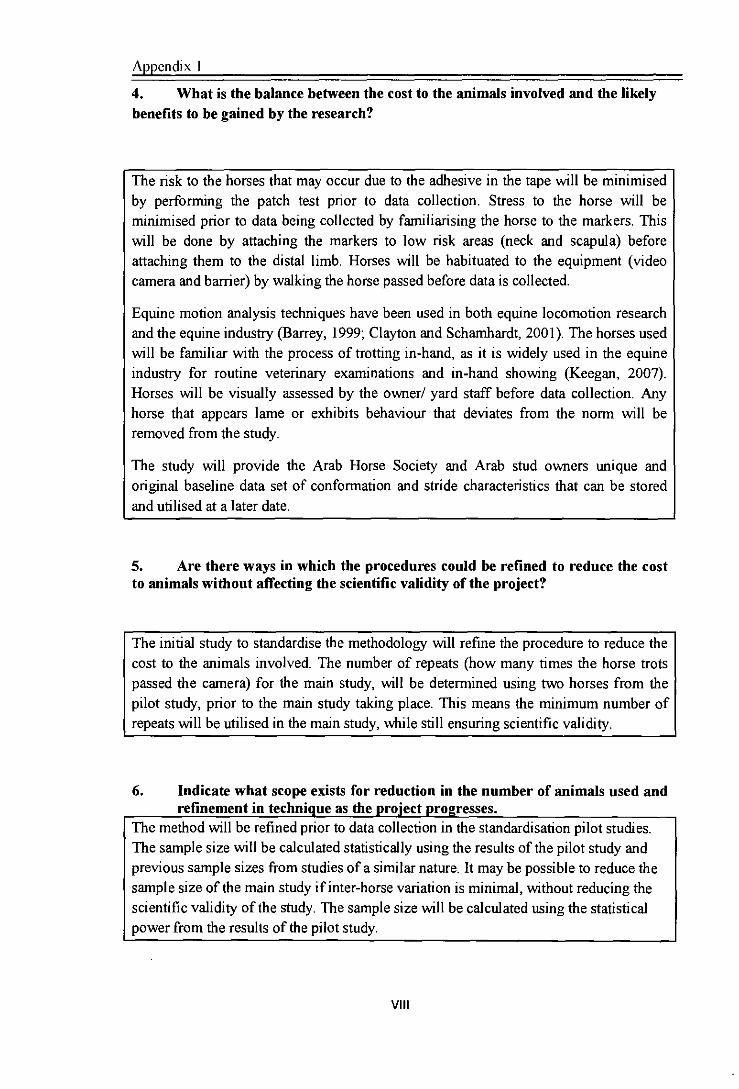
Appendix I
4. What is the balance between the cost to the animals involved and the likely benefits to be gained by the research?
The risk to the horses that may occur due to the adhesive in the tape will be minimised by performing the patch test prior to data collection. Stress to the horse will be minimised prior to data being collected by familiarising the horse to the markers. This will be done by attaching the markers to low risk areas (neck and scapula) before attaching them to the distal limb. Horses will be habituated to the equipment (video camera and bather) by walking the horse passed before data is collected.
Equine motion analysis techniques have been used in both equine locomotion research and the equine industry (Barrey, 1999; Clayton and Schamhardt, 2001). The horses used will be familiar with the process of trotting in-hand, as it is widely used in the equine industry for routine veterinary examinations and in-hand showing (Keegan, 2007). Horses will be visually assessed by the owner/ yard staff before data collection. Any horse that appears lame or exhibits behaviour that deviates from the norm will be removed from the study.
The study will provide the Arab Horse Society and Arab stud owners unique and original baseline data set of conformation and stride characteristics that can be stored and utilised at a later date.
5. Are there ways in which the procedures could be refined to reduce the cost to animals without affecting the scientific validity of the project?
The initial study to standardise the methodology will refine the procedure to reduce the cost to the animals involved. The number of repeats (how many times the horse trots passed the camera) for the main study, will be determined using two horses from the pilot study, prior to the main study taking place. This means the minimum number of repeats will be utilised in the main study, while still ensuring scientific validity.
6. Indicate what scope exists for reduction in the number of animals used and retinement in tecnnigue as me project progresses.
The method will be refined prior to data collection in the standardisation pilot studies. The sample size will be calculated statistically using the results of the pilot study and previous sample sizes from studies of a similar nature. It may be possible to reduce the sample size of the main study if inter-horse variation is minimal, without reducing the scientific validity of the study. The sample size will be calculated using the statistical power from the results of the pilot study.
VIII

Appendix I
7. State any additional reasons that support this proposed use of animals to obtain the specific objectives. Is the number of animals you propose to use appropriate? - i.e. large enough to produce a satisfactory valid result and not greater, in accordance with the principles of Reduction, Refinement and Replacement.
An additional reason to justi' the use of horses in this study is the benefit of the results to the Arab Horse Society, its members and the welfare of the Arab horse. The results will provide a unique baseline data set for conformation and stride characteristics of Arab horses. This has never been done before and will be veiy useful for future work. This data can then be utilised to monitor the effects of training, treatment or to justi& selection for breeding, ultimately improving the welfare of the Arab horse and the quality of horses being bred and registered with the Arab horse society.
The costs to the horses are minimal, and the sample size will be calculated using the statistical power from the pilot study.
8. References
Barrey, E. (1999) Methods, applications and limitations of gait analysis in horses. The Veterinary Journal, 157,1, 7-22.
Cano, M. Miro, F. Vivo, J. Calisteo, A. (1999) Comparative biokinematic study of young and old adult andalusian horses at the trot. Journal of Veterinary Medicine, 46, 91-101.
Cano, M. Miro, F. Monterde, J. Diz, A. Martin, J. Galisteo, A. (2001) Changes due to age in the kinematics of trotting Andalusian foals. Equine Veterinary Journal, 33, 116-121.
Clayton, H. and Schamhardt, H. (2001) Measurement Techniques. In Back, W. And Clayton, H. —eds. Equine Locomotion. London: W. B. Saunders.
Lxi

Degueurce, C. Pourcelot, P. Audigie, F. Denoix, J. Geiger, D. (1997) Variability of the limb joint patterns of sound horses at trot. Equine Veterinary Journal Supplement, 23, 89-92.
Drevemo, S. Dalin, G. Fredricson, i. Hjerten, C. (1980a) Equine locomotion 1: The analysis of linear and temporal stride characteristics of trotting Standardbreds. Equine Veterinary Journal, 12, 2, 60-65.
Drevemo, S. Dalin, G. Fredricson, I. Bjorne, K (1980b) Equine locomotion 3: The reproducibility of gait in standardbred trotters. Equine Veterinary Journal, 12, 2, 71-72.
Galisteo, A. Cano, M. Miro. F. Vivo, J. Morales, J. Aguera, E. (1996) Angular joint parameters in the andalusian horse at walk obtained by normal videography. Journal of Equine Veterinary Science, 16, 2, 73-77.
Keegan, K. (2007) Evidence-based lameness detection and quantification. Veterinary Clinics Equine Practice, 23, 403 -423.
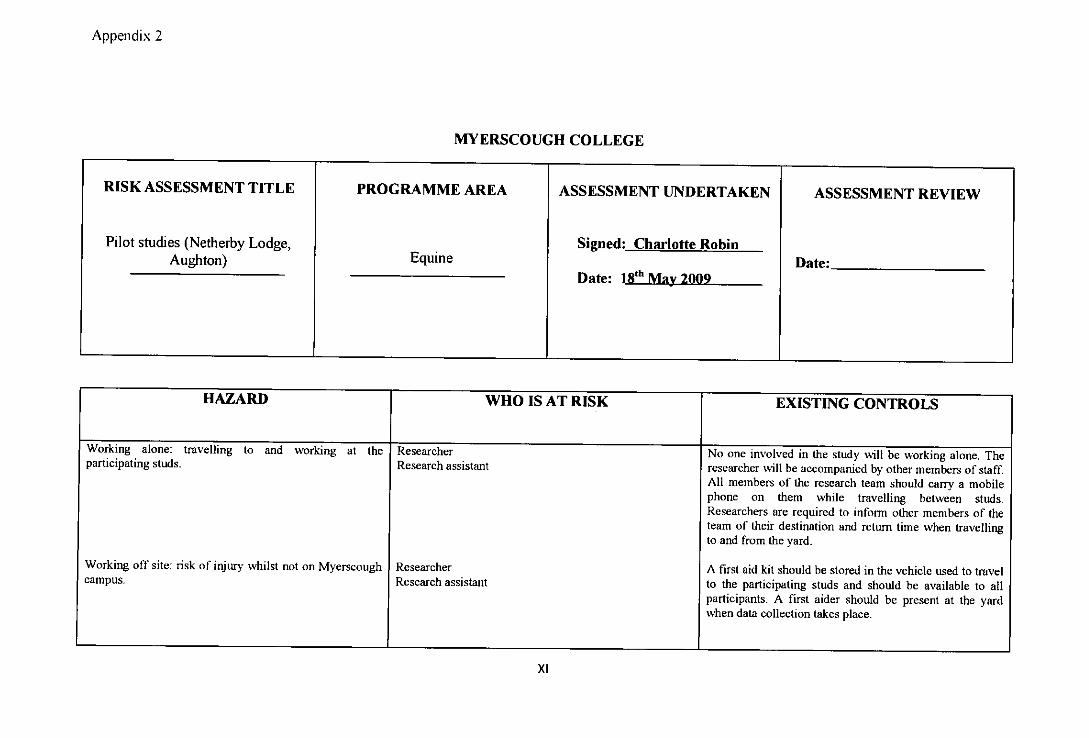
rI x
a) 0
0
cC
z
rID
C,)
rID
rID
S
z
C
cc
C
cc
C)
©
a bO
—
0
rID
ZiD
(ID
(ID
'A
(ID
'iI
F— .0
•i
00
rID
.EE
o.0
- ©
=>
Et
2t
a>
0_c
•- n
2.
0
,Jt
00
o
(ID —
•- >
0
•.t<:
> 00°
•Et
-o
0
oa
0)
0E
z<
as
<98.
rID
(ID
©
I 00
0
0
00
F)'
Z
0)0
00
0
0
0
.0
00
0
0
I- 0
I- 0
N
oo
C
.0
0-
0"
CO
0
at
rz
0
©
CID
a
a

.4
-o
C)
0
a. 'C
0
zE
t
0
.0
>
0°t
tt0.
0
0
k0
0
. oo
So
0
.L
.0
•C
OO
._.00
II 1,cno
9oo
0 .0
.fl .0
0
0
00
t
t
C
In
.0
o E
In
°0
Eo
000
00.
tt
>)
0
.2 _
In
0
0.0
.0
0
.-5t0\
0
In
20
. In
E
°°
-a
c
.0000.0
05
fl'S
InInt
.C
p>
'
-'4
OO
c.C
P
.O
t.fl
In-
. 0
°
H
U
O'to
I In
. - In
In
In
S
In
In
In
In
00
fl
00
fl
00
0
0
00
! fl.0
00
0
o
00
1
00
0
0
oC
t
In
00
In
In
0
0
In
In
00
In
In
00
In
In
In
In
E
00
0
0
Co
00
0
—
0
E
'E 0
E
0
E
0
I-
0.
0
0
'to
0
0
I 0
InC
St
00
h
'C
0
0
-
C,
0
00 01$
0
5
CC -
In
0>
' 0
0
oZ
In
In
C
00"
CO
0
5
0
0
.0
"E
In
0
0
.0
I-
-In
UO

C"
x -c I) 0-
0.
0t0
f0
00
.9
E
00
o.
Sm
.5
.. m
a
0-0
.00
0
Ct
t
0
Q.000t
0.t
.9
oc2
g
00 0
00
•
—
.00
0
00E
- t
to
. oo •
°2
E00
00
Ct
.-
00
0
00
5
Ct
otto
0
.0
°
oE
pm
t0
00 0
E
•\••/
0) 0
t0
.1
0o
,
0\o..
.00 tO
Q
.2
Zt
to ta
.0
tC
0)
' t
E°fl
_cC
'
0_c
00 .0
00
0E
!2
CO E
.d
o.0
00
00000
91
.9
Z
0
•a
0
10 1.
CO 10
.00000101-.
oocm
<
10
•2
1
0
o
o
1-
G0
10
00
10
00
1
00)
00
ot
101000
0)000
0-
t
>0
0
0)
c_U
0
00
0
0
.0
10 .C
,j
00
00 0
1
. o
U
t
t
00
Oo
j 0
0
o 000-0
0
00 0
00
00 0
.0
0
0)
FM
E
0
0
U
0
00
.0
1.
.00 00
- 0
0
00
0
0
0
.9 00
00
0
.00 .00 0
-C
0. •°
00 .9
0. 0. 00
00
•E
2
00
00.
0
><

ci) a
a
t6*c
i) 0LiQ
EE
ooJ
2
ua
cci
C)
- iThzs
- '
>r
0ctt
-,!s
•€ <flt
.c .
o
6*
H
o
x
ft
C)
.9
cci 2
6*
0
ft
- ft
00
a 0
- cci C
) U
cci 0.
o
ft
o
ci) ft
6* o
ft0
2
6*0
90
>
>c

>
><
C-"
-a
0) a
a
z
(ID
(ID
(ID
(-ID IC
2
z
IC a C
C
C
Ge
ri
U
0
(ID
(ID
Ge C
2
DL
IC
IC
IC C
)
C
C
D
C
nO
(ID
(ID
(ID
IC -
N
4
(ID
I- c
Es>
-' S
al
0=
-
>-0
0
o
- 0
I-
(ID
b0
0
>=
E
> -a
0
0
4
IC (ID
-
C
j
.0.0
0
0
.0.0
0
0
O 0
0
0
00
0
0
0
.0
.0
00
0
a 0
00
0
0
0
o a 0
0
'O
I >-' N
0
0
:!
t<
4-
> 0
'0
0-
-- 0 =
00 - 0
C
U
C
U
(ID
a

0 0
.0
>
C.
0)0
aE
•
°-
a 1
0
0
o .0
00...00
0 0
°
rI o
o
'O
• I-
°
o .C
Q
0
to
too-C
a
0
0
00
0-C
.
to_
.8 t
•.C
o\
0) -a
c
tofl
E -
-
C,
.C4 o
• - IE
-d
to-
O
.0
0
.0
-
0000
--coo
H
C)
L•._
._
C,
0
to
• to
to
- - to
to
• to
to
. - to
to
00
00
00
fl
00
to
to
00
00
00
to
to
00
00
to
to
to
to
P
0)0
000
0
a° to
-
C,
C.
2
-S
0)
E 0
E 0
- 0
a
P
P
0
.8
0) .
• •
C-
0
I
to
-c
- to
-P
E 0
I-
E 0
0
0
a
• 0
C,
'5
o
0-
C,
o
t
-9E
to
to
to
90
-
C,
00
0
0
0
.0 -E
C
, to
o
to
0
-
c-I z
-a
C
0)
0-
0.
Ed
>
>c

C-"
-o
0.
0.
'C
oto
qo
ca
zo
ZO
E
0
-o
• .E
o
V)
o
o2
Z°
'-.0
.4
trt2
° E
E
.° E
fl-s1
00
)O
%
0
-°
•0
oti!
"
-
0
0
t
EcE
0
O
o
a.s
00
°
-•-
-
o o
0
00
0
00
Ei
gO
2
&J
I-
0
ot
0
00
0
00
0
I- 0
00
00
--o0
.2 cE
O
0'-
0
0o
0-
E 0-
0-
0
-E
>

z
ci) 0
0
On
O
0O
t.j
t0
Cd, 0
CO
O—
O
• 2-"
CO O
CO
0
2,
tE
CO
-4
0_c
.CC
d 0)
.Mg
>0
t9
CO
Q
-o
.CO
z
0
0
CO E
000C
O
-o .0
CO
t0.oc
t•
o
CO
9.C
O
oo
0o
E
I-
—O
C
_a
.0
2.C
O.o
CO
CO 0
E
.o
.
0
0
— •9
2-
tzC
Ot.
-on
2
0) I-
I!
2o
tC
Oa
0
0
Co
I-
o
CO fto
CO
S
CO
00
00
Cd,
00
00
0
OO
CO
.0
0
>.C
O
DO
S..
CO 0
0
=
CO
I 2
° CO
-.0
0
0
0
0
3E
- 0
0
2
-o
0
0
-CO 2 —
to
CO 0L
0
0
0
5-
- 0
-c
0
0
5-0
0
.2
LI

Appendix 3
Participant Information Sheet
Horse Owner
Dear,
You have been invited to participate in a piece of research which will aim to standardise equine motion analysis techniques. This form provides basic information regarding the testing and also asks for you to agree for your horses to be used in the testing. Such information and agreement is referred to as informed consent. The following information is designed to provide you with answers to questions you may have. Please feel free to ask any other questions to enable you to feel happy to provide consent to take part.
What will I have to do? As the horse owner you will not be required to take part in the study, unless you request to do so. If you do want to participate in the study (to hold or lead horses) you will be required to complete a PAR-Q form (Physical Activity and You Questionnaire) which will ensure your physical ability to take part.
All the horses involved in the study will undergo the same protocol. Firstly, horses will have circular markers attached to specific anatomical landmarks using self-adhesive tape. This will be done by an experienced researcher through a set palpation method. This process will be carried out in an enclosed environment referably a stable) with the horse being held by a handler (either a member of your staff or the Myerscough College research team).
A video camera (on a tripod) will be set up on the yard behind a suitable barrier (such as a jump pole on a block). The horses will be led (in a bridle or head collar) passed the camera a few times to accustom the horse to the cameras presence. This process will also warm the horse up prior to data collection. The horse will be stood square and recorded for a conformation shot. The horses will then be trotted passed the camera ten times by the handler. The handler will be either a member of the Myerscough College research team, or yourself depending on personal preference. Once the data has been recorded, the horse will be returned to the stable and the markers will be carefully removed.
N.B. All Myerscough College research staff have undergone a yard induction and will be capable of trotting horses in hand
What are the risks of taking part? The risks to the horses taking part in the study are minimal. The main risks would be the attachment of the markers with adhesive tape which may cause irritation to the horses skin (a patch test will be performed to minimise this risk). The horses may become stressed during the procedure (either attaching the markers or trotting the horse passed the camera), causing a risk to the horse or handler, in which case it will be removed from the study. A full risk assessment has been carried out by Myerscough College to minimise potential risks to the horses and handlers, which is available on request.
XIX

Appendix 3
Do you have to take Dart? Participation is entirely voluntaiy. You are free to withdraw at any time from the study during the testing phase. Once the testing phase is completed (for each horse) it is not possible to withdraw results as they will be anonymous and will therefore not be distinguishable from the group.
NB. Please inform the researcher if any you have allergies associated with horses prior to the study taking place, as you will be asked to withdraw from the study.
What will happen to my data? All data that is collected from your participation will be anonymous and it will be stored numerically so it cannot be traced back to you. The results from each horse from your stud will go together with the rest of the group and they will be analysed and written up as part of my thesis. The data will be stored on a password protected computer at Myerscough College. It is also possible that the results of this study may be published by the University or College to peer reviewed journals and/or eonferences. The information you provide before the study takes place (and the information from the PAR-Q) is to ensure the safety and eligibility of you and your staff. The information will be stored in a locked filing cabinet by my director of studies at the University of Central Lancashire. It will not be shared or given to any third parties.
Ethical Consent Ethical consent for the study *has been applied for to the School of Psychology Ethics Committee, University of Central Lancashire and Myerscough College.
*NB This will be modified to 'has been approved by' when approval is granted
Please note that if you prefer your own yard staff to handle the horses (lead the horses in front of the camera) they will be required to sign the form as they will be recorded by the camera. The data will be stored on a password protected computer.
If you agree to undertake this testing please sign the section overleaf. It is a requirement you provide a signature to reflect agreement to perform the research.

Appendix 3
A2reement to testin!
I understand the risks associated with this study and that all the data produced will be
treated with confidentiality and individually. However the anonymous results may be
used in possible future publications. If I wish, the results produced will be available to
me.
I willingly agree to participate in the current study. I have read the above information
and understand that withdrawal from the study is possible until all data has been
collected.
Name of owner;
PrintName: ...........................................................................
Signature . ......................................... ......................................
Date . ........ / ........ /.............
Name of witness;
Printnamr ..........................................................................
Signaturr............................................................................
Date. ............ / ............ /............
All communications should be made to;
Dr Sarah Jane Hobbs,
Senior Lecturer in Sport and Exercise,
Centre for Applied Sport and Exercise Sciences,
University of Central Lancashire,
Preston,
FRI 2HE
Tel: 01772 893328
Email:[email protected]
xx'

Appendix 3
Participant Information Sheet
Yard Owner
Dear
You have been invited to participate in a piece of research which will aim to define normal conformation and gait characteristics in Arab horses. This form provides basic information regarding the testing and also asks for you to agree for your horses to be used in the testing. Such information and agreement is referred to as informed consent. The following information is designed to provide you with answers to questions you may have. Please feel free to ask any other questions to enable you to feel happy to provide consent to take part.
What will I have to do? As the stud/horse owner you will not be required to take part in the study, unless you request to do so. If you do want to participate in the study (to hold or lead horses) you will be required to complete a PAR-Q form (Physical Activity and You Questionnaire) which will ensure your physical ability to take part.
All the horses involved in the study will undergo the same protocol. Firstly, horses will have circular markers attached to specific anatomical landmarks. This will be done by an experienced researcher through a set palpation method. This process will be carried out in an enclosed environment (preferably a stable) with the horse being held by a handler (either a member of your staff or the Myerscough College research team).
A video camera (on a tripod) will be set up on the yard behind a suitable barrier (such as a jump pole on a block). A large, flat non-slip area will be needed suitable for trotting horses in hand. The horses will be led (in a bridle or head collar) onto the yard by the handler and passed the camera a few times to accustom the horse to the cameras presence. This process will also warm the horse up prior to data collection. The horse will be stood square on the yard and recorded for a conformation shot. The horses will then be trotted passed the camera five times (each side) by the handler. The handler will be either a member of the Myerscough College research team, or your own yard staff depending on personal preference. Once the data has been recorded, the horse will be returned to the stable and the markers will be carefully removed. Rugs will be put back on if appropriate.
N. B. All Myerscough College research staff have undergone a yard induction and will be capable of trotting horses in hand
What are the risks of taking part? The risks to the horses taking part in the study are minimal. The main risks would be the attachment of the markers which may cause irritation to the horses skin (a patch test will be performed to minimise this risk). The horses may become stressed during the procedure (either attaching the markers or trotting the horse passed the camera), causing a risk to the horse or handler, in which case it will be removed from the study. A full risk assessment has been carried out by Myerscough College to minimise potential risks to the horses and handlers, which is available on request.
XXII

Appendix 3
Do you have to take part? Participation is entirely voluntaly. You are free to withdraw at any time from the study during the testing phase. Once the testing phase is completed (for each horse) it is not possible to withdraw results as they will be anonymous and will therefore not be distinguishable from the group.
Nif P/ease inform the researcher if any you have allergies associated with horses prior to the study taking p/ace, as you will be asked to withdraw from the study.
What will happen to my data? All data that is collected from your participation will be anonymous and it will be stored numerically so it cannot be traced back to you. The results from each horse from your stud will go together with the rest of the group and they will be analysed and wntten up as part of my thesis. The data will be stored on a password protected computer at Myerscough College. It is also possible that the results of this study may be published by the University or College to peer reviewed journals and/or conferences. The information you provide before the study takes place (and the information from the PAR-Q) is to ensure the safety and eligibility of you and your staff. The information will be stored in a locked filing cabinet by my director of studies at the University of Central Lancashire. It will not be shared or given to any third parties.
Ethical Consent Ethical consent for the study *has been applied for to the School of Psychology Ethics Committee, University of Central Lancashire and Myerscough College.
*NB This will be modified to 'has been approved by' when approval is granted
Please note that if you prefer your own yard staff to handle the horses (lead the horses in front of the camera) they will be required to sign the form as they will be recorded by the camera. The data will be stored on a password protected computer.
If you agree to undertake this testing please sign the section overleaf. It is a requirement you provide a signature to reflect agreement to perform the research.
XX Ill

Appendix 3
Aireement to testin
I understand the risks associated with this study and that all the data produced will be
treated with confidentiality and individually. However the anonymous results may be
used in possible future publications. If I wish, the results produced will be available to
me.
I willingly agree to participate in the current study. I have read the above information
and understand that withdrawal from the study is possible until all data has been
collected.
Name of stud owner;
PrintName ............................................................................
Signature . ...............................................................................
Date . ........ I ........ /.............
Name of witness;
Printname' ..........................................................................
Signathre . ...........................................................................
Date . ............ / ............ /............
All communications should be made to;
Dr Sarah Jane Hobbs,
Senior Lecturer in Sport and Exercise,
Centre for Applied Sport and Exercise Sciences,
University of Central Lancashire,
Preston,
flU 2HE
Tel: 01772893328
Email:[email protected]
XXIV
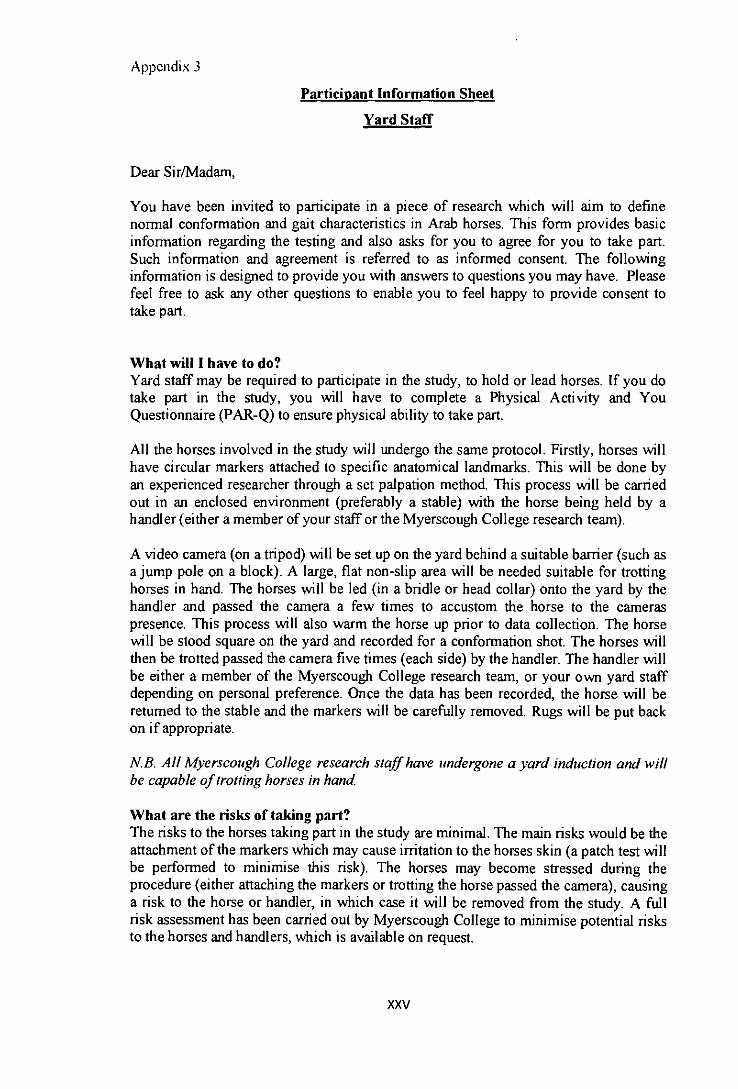
Appendix 3
Participant Information Sheet
Yard Staff
Dear Sir/Madam,
You have been invited to participate in a piece of research which will aim to define normal conformation and gait characteristics in Arab horses. This form provides basic information regarding the testing and also asks for you to agree for you to take part. Such information and agreement is referred to as informed consent. The following information is designed to provide you with answers to questions you may have. Please feel free to ask any other questions to enable you to feel happy to provide consent to take part.
What will I have to do? Yard staff may be required to participate in the study, to hold or lead horses. If you do take part in the study, you will have to complete a Physical Activity and You Questionnaire (PAR-Q) to ensure physical ability to take part.
All the horses involved in the study will undergo the same protocol. Firstly, horses will have circular markers attached to specific anatomical landmarks. This will be done by an experienced researcher through a set palpation method. This process will be carried out in an enclosed environment (preferably a stable) with the horse being held by a handler (either a member of your staff or the Myerscough College research team).
A video camera (on a tripod) will be set up on the yard behind a suitable barrier (such as a jump pole on a block). A large, flat non-slip area will be needed suitable for trotting horses in hand. The horses will be led (in a bridle or head collar) onto the yard by the handler and passed the camera a few times to accustom the horse to the cameras presence. This process will also warm the horse up prior to data collection. The horse will be stood square on the yard and recorded for a conformation shot. The horses will then be trotted passed the camera five times (each side) by the handler. The handler will be either a member of the Myerscough College research team, or your own yard staff depending on personal preference. Once the data has been recorded, the horse will be retumed to the stable and the markers will be carefully removed. Rugs will be put back on if appropriate.
N.B. All Myerscough College research staff have undergone a yard induction and will be capable of trotting horses in hand
What are the risks of taking part? The risks to the horses taking part in the study are minimal. The main risks would be the attachment of the markers which may cause irritation to the horses skin (a patch test will be performed to minimise this risk). The horses may become stressed during the procedure (either attaching the markers or trotting the horse passed the camera), causing a risk to the horse or handler, in which case it will be removed from the study. A full risk assessment has been carried out by Myerscough College to minimise potential risks to the horses and handlers, which is available on request.
xxv

Appendix 3
Do you have to take pan? Participation is entirely voluntary. You are free to withdraw at any time from the study during the testing phase. Once the testing phase is completed (for each horse) it is not possible to withdraw results as they will be anonymous and will therefore not be distinguishable from the group.
NB. Please inform the researcher if any you have allergies associated with horses prior to the study taking place, as you will be asked to wit/idraw from the study.
What will happen to my data? All data that is collected from your participation will be anonymous and it will be stored numerically so it cannot be traced back to you. The results from each horse from your stud will go together with the rest of the group and they will be analysed and written up as part of my thesis. The data will be stored on a password protected computer at Myerscough College. It is also possible that the results of this study may be published by the University or College to peer reviewed journals and/or conferences. The information you provide before the study takes place (and the information from the PAR-Q) is to ensure the safety and eligibility of you and your staff. The information will be stored in a locked filing cabinet by my director of studies at the University of Central Lancashire. It will not be shared or given to any third parties.
Ethical Consent Ethical consent for the study *has been applied for to the School of Psychology Ethics Committee, University of Central Lancashire and Myerscough College.
*NB This will be modified to 'has been approved by' when approval is granted
Please note that if you prefer your own yard staff to handle the horses (lead the horses in front of the camera) they will be required to sign the form as they will be recorded by the camera. The data will be stored on a password protected computer.
If you agree to undertake this testing please sign the section overleaf. It is a requirement you provide a signature to reflect agreement to perform the research.
XXVI

Appendix 3
A&reement to testing
I understand the risks associated with this study and that all the data produced will be
treated with confidentiality and individually. However the anonymous results may be
used in possible future publications. If I wish, the results produced will be available to
me.
I willingly agree to participate in the current study. I have read the above infonnation
and understand that withdrawal from the study is possible until all data has been
collected.
Name of yard staff;
Printnamr ............................................................................
Signature'..............................................................................
Date .......... . ........... /..............
Name of witness;
Printname: ..........................................................................
Signaturr............................................................................
Date . ............ / ............ I............
All communications should be made to;
Dr Sarah Jane Hobbs,
Senior Lecturer in Sport and Exercise,
Centre for Applied Sport and Exercise Sciences,
University of Central Lancashire,
Preston,
PRI 2HE
Tel: 01772 893328
Email:[email protected]
XXVII

Appendix 4
1.0 Inter -horse variation
Inter-horse variation measured the amount of variation between individual horses in the study.
1.1 Conformation
The majority of traits measured were established as significantly different between
horses (16 out of 19). The traits that did not demonstrate significant differences between
horses were length of radius and fore proximal phalanx and tarsal angle.
Table A4.0: Inter-horse variation in conformation traits. Levels of significance are indicated by P<0.05; "N0.005; "P<0.001; NS not significant.
Trait - Horse
Sign j/icance
Neck (cm) Scapula (cm) *
Humerus (cm) Radius (cm) NS Fore metacarpal (cm) **
Fore proximal phalanx (cm) NS Pelvis (cm) Femur (cm) Tibia (cm) Hind metacarpal (cm) Hind proximal phalanx (cm) Neck ( 0 )
Humeroradial (°) *
Coxofemornl (5 Femorotibial (5 Hind metacarpophalangeal (0)
Scapulohumeral angle Fore metacarpophalangeal angle Tarsal angle NS
Dr011

Appendix 4
1.2 Stride length and velocity
Forelimb stride length was not significantly different between horses for the left or right
side (table A4.I). Hind limb stride length did vary significantly between horses, over
the trial. Horse one SL was consistently shorter than horses two and three (Pc0.001).
Small variations were established between horse two and three, however these
variations were not significant (P>0.05) except on day four where horse two had
significantly longer SL than horse three.
A4.1: Inter-horse variation in stride length in trot and velocity for forelimb, hind limb (for left and right side). Levels of significance are indicated by P<005; **P<0005; P<O.00l; NS not significant.
Variable Horse Left forelimb stride length NS Right forelimb stride length NS Left hind limb stride length Right hind limb stride length velocity
350
-Ij
250
200
150
2 100
50
CO
1 2 3 4 5
Day
OHorse 1
Q Horse 2
0 Horse 3
Figure A4.0: Inter-horse variation in hind limb stride length (±SE) for the left side over five consecutive days. Levels of significance are indicated by *pc0.05 ; flP<0.005; P<O.00l.
XXIX

Appendix 4
1.3 Range of motion
All joint ROM was established as significantly different between horses (table A4.2).
Figure A4. 1 demonstrates scapulohumeral ROM as an example of this. Horse one
scapulohumeral ROM was significantly smaller than horse two and three for all days
(PcO.00l). Initially horse three had larger scapulohumeral ROM than horse two (on
days one and two), however on day three horse two had a larger scapulohumeral ROM
than horse three. On day four and five, the same pattern resumed, horse three had a
larger scapulohumeral ROM than horse two.
Table A4.2: Inter-horse variation in ROM for each joint measured. Levels of significance are indicated by *P<OO5;
Joint (°) Horse **P<0005;
"P<0001 NS not significant. Significance
Scapulohumerat Humeroradial Carpal Fore metacarpophalangeal Coxofemoral Femorotibial
Tarsal
Hind metacarpophalangeal
xxx

Appendix 4
21
19 r
15 I-
3 13 —S—Horse 1 0
. 11 -- Horse 2 C C C 9 —0--Horse3
7
0 1 2 3 4 5
Day
Figure A4.1: Mean scapulohumeral ROM for subjects 1-3 for five consecutive days showing a significant difference between horses (P<0.00I).
IA Summary
Analysis of inter-horse variation illustrated the large amounts of variation between
individual horses. Most of the conformation traits measured were established as
different between horses, except for radius length, fore proximal phalanx length and
tarsal angle. Stride length for horse one was significantly shorter than horses two and
three on all days. Horse one also demonstrated the highest amounts of intra-horse
XXXI

Appendix 4
variation during the trial. Horses two and three had similar stride length that did not
vaiy except on day four. ROM for all joints measured were different between horses.
POW