uva-dare (digital academic repository) … m. ouweneel, ... conciseness, this article evaluates the...
TRANSCRIPT

UvA-DARE is a service provided by the library of the University of Amsterdam (http://dare.uva.nl)
UvA-DARE (Digital Academic Repository)
Percutaneous mechanical circulatory support in cardiogenic shock
Ouweneel, D.M.
Link to publication
Citation for published version (APA):Ouweneel, D. M. (2017). Percutaneous mechanical circulatory support in cardiogenic shock
General rightsIt is not permitted to download or to forward/distribute the text or part of it without the consent of the author(s) and/or copyright holder(s),other than for strictly personal, individual use, unless the work is under an open content license (like Creative Commons).
Disclaimer/Complaints regulationsIf you believe that digital publication of certain material infringes any of your rights or (privacy) interests, please let the Library know, statingyour reasons. In case of a legitimate complaint, the Library will make the material inaccessible and/or remove it from the website. Please Askthe Library: http://uba.uva.nl/en/contact, or a letter to: Library of the University of Amsterdam, Secretariat, Singel 425, 1012 WP Amsterdam,The Netherlands. You will be contacted as soon as possible.
Download date: 13 Jun 2018

CHAPTER 4

ASSESSmENT Of CARDIAC DEvICE POSITION ON SUPINE CHEST RADIOGRAPH IN THE ICU: INTRODUCTION AND APPLICABILITY Of THE AORTIC vALvE LOCATION RATIO
Dagmar M. Ouweneel, Krischan D. Sjauw, Esther M. A. Wiegerinck, Alexander Hirsch, Jan Baan, Bas A. J. M. de Mol, Wim K. Lagrand, R. Nils Planken, José P. S. Henriques
Critical Care Medicine. 2016; 44(10):e957-63

76 PART I
ABSTRACT
Objectives
The use of intracardiac assist devices is expanding, and correct position of these devices is required for optimal functioning. The aortic valve is an important landmark for posi-tioning of those devices. It would be of great value if the device position could be easily monitored on plain supine chest radiograph in the ICU. We introduce a ratio-based tool for determination of the aortic valve location on plain supine chest radiograph images, which can be used to evaluate intracardiac device position.
Design
Retrospective observational study.
Setting
Large academic medical center.
Patients
Patients admitted to the ICU and supported by an intracardiac assist device.
Interventions
We developed a ratio to determine the aortic valve location on supine chest radiograph images. This ratio is used to assess the position of a cardiac assist device and is compared with echocardiographic findings.
Measurements and main results
Supine anterior-posterior chest radiographs of patients with an aortic valve prosthesis (n = 473) were analyzed to determine the location of the aortic valve. We calculated several ratios with the potential to determine the position of the aortic valve. The aortic valve location ratio, defined as the distance between the carina and the aortic valve, divided by the thoracic width, was found to be the best performing ratio. The aortic valve location ratio determines the location of the aortic valve caudal to the carina, at a distance of 0.25 ± 0.05 times the thoracic width for male patients and 0.28 ± 0.05 times the thoracic width for female patients. The aortic valve location ratio was validated using CT images of patients with angina pectoris without known valvular disease (n = 95). There was a good correlation between cardiac device position (Impella) assessed with the aortic valve location ratio and with echocardiography (n = 53).

CHAPTER 4 77
Conclusions
The aortic valve location ratio enables accurate and reproducible localization of the aortic valve on supine chest radiograph. This tool is easily applicable and can be used for assessment of cardiac device position in patients on the ICU.

78 PART I
A growing number of patients are being treated with intracardiac assist devices and admitted to the ICU. Correct position of these devices is required for optimal function. Transthoracic echocardiographic (TTE) imaging is frequently used for assessment of device position but may be challenging as patients are frequently intubated and in the supine position. Often, these patients have poor acoustic windows that limit the diag-nostic value of TTE, hampering appropriate echocardiographic assessment and decision making. Supine chest radiograph is done on a regular basis in patients admitted to the ICU. It would be of great value if intrathoracic device position could accurately be deter-mined on plain supine chest radiograph. Specific cardiac structures, such as the native aortic valve, are difficult to localize on a supine chest radiograph image. We introduce a validated, easy, and reliable method to determine the aortic valve location (AVL) on standard supine chest radiograph by using anatomical landmarks to calculate ratios to determine the position of the aortic valve. Furthermore, we evaluated the accuracy of this method in patients admitted to the ICU for circulatory support (Impella, Abiomed, Danvers, MA) 1.
MATERIALS AnD METHODS
The local institutional review board approved the study protocol. Several steps were taken to identify and evaluate the location of the aortic valve on supine chest radiograph, using both supine radiograph and CT images (Figure 1). First, potential anatomical landmarks were determined, that is, carina, thoracic width, lung apex, and diaphragm position. We measured distances between these landmarks and calculated ratios between these distances, which identify the position of the aortic valve (Figure 1). Several ratios with a possible relation to the AVL on chest radiograph were calculated and subsequently analyzed and are available in the Supplementary data. For the sake of conciseness, this article evaluates the novel AVL ratio, which was found to be the best performing ratio. The AVL ratio was determined by measuring the distance between the carina and the aortic valve divided by the thoracic width, measured at the inside of the thoracic wall, on the level of the medial section of the diaphragm at the level of the spine (Figure 1; and Supplementary Figure 1).
widththoracic RatioLocationValveAortic Carina - aortic valve

CHAPTER 4 79
Aim: Investigate if the AVL ratio isdifferent in patients with and without
aortic valve disease
Method: Compare the AVL ratio,measured on CT, between TAVI (n=105)
and angina pectoris patients (n=98)
Conclusion: There is no differencein AVL ratio in patients with and without
aortic valve disease (Table 1)
2
Aim: Compare the AVL ratio measured on CT with supine chest X-ray
Method: Compare the AVL ratiomeasured on CT during screening
with the AVL measured on supine chestX-ray after TAVI placement (n=105)
Conclusion: The AVL ratio is different when measured on CT and supine chest X-ray. This might be due to differences
in patient positioning for the two images modalities (e-Table 3)
3Aim: Investigate the influence of
mechnical ventilation, sternotomy andlung disease on the AVL ratio
Method: Compare the AVL ratio measuredon supine chest X-ray of patients with
radiopaque aortic valve prosthesis
Conclusion: There is no difference in ALV ratio when patients aremechanically ventilated, had a
previous sternotomy or have lung disease (Table 2)
4
Aim: Measure AVL ratio on supine chest X-ray
Method: Measure the distance betweencarina and aortic valve prosthesis and
thoracic width on supine chest X-ray (n=473)
Conclusion: The AVL ratio defines thelocation of the aortic valve at a cranio-caudal
distance of 0.28±0.05 (women) or 0.25±0.05 (man) times the thoracic width
caudal to the carina (e-table 1)
1
carina-aortic valve
thoracic width
AVL-ratio xthoracic width
thoracic width
Aim: Apply the AVL ratio, 0.28±0.05 for women and 0.25±0.05 for man, on patients
on Impella support in the ICU
Method: Locate the aortic valve onsupine chest X-ray and compare
the Impella position on X-ray with echocardiography findings (n=50)
Conclusion: There is a good correlation between echocardiography and the AVL
ratio to evaluate the position of the Impella(Figure 3)
6
RV
LV
LA
SeptumImpella 2.5 inlet area
Impella 2.5outlet area
Mitral valve
Aorta
3.5 cm
Aim: Investigate inter-observeragreement for thoracic width measurement
Method: Compare measurements onsupine chest X-ray of 2 independent
observers
Conclusion: There is a good intra-class correlation for thoracic width
5
Figure 1 Flowchart of the steps taken to calculate, evaluate, and apply the aortic valve location (AVL) ratio.Chest x-ray = chest radiograph; TAVI = transcatheter aortic valve implantation.
Because the native aortic valve is not visible on chest radiograph, supine chest radio-graphs of patients with an implanted radiopaque aortic valve prosthesis were analyzed (n = 473) (step 1). Then, the AVL ratio was validated using CT images of patients with angina pectoris without aortic valve disease (n = 98) and patients referred for transaortic valve implantation (n = 105) (steps 2 and 3; Figure 1). The influence of covariables on the AVL ratio was evaluated (step 4), and the interobserver variability was determined (step 5). Last, the AVL ratio was used to evaluate the position of an intracardiac assist device (Impella) in ICU patients. The position of the Impella on supine chest radiograph was compared with the corresponding TTE findings (n = 53) (step 6; Figure 1).

80 PART I
Determination of the AVL Ratio
Chest radiographs of patients who had received an aortic valve prosthesis either by sur-gical or transcatheter approach were analyzed (Figure 2). Supine chest radiographs of patients after surgical aortic valve replacement (SAVR) were obtained from 294 patients who were operated on between January 2013 and August 2014. Patients were excluded if the aortic valve prosthesis was not visible on radiograph (n = 54), if it was not possible to evaluate the radiograph because of poor quality (n = 4), or if the aortic valve prosthe-sis was not situated in the appropriate position because of anatomic abnormalities (n = 1). Supine chest radiographs of patients after transcatheter aortic valve implantation (TAVI) were obtained from patients who had received an Edwards Sapien prosthesis (Edwards Lifesciences, Irvine, CA) between October 2007 and December 2014 (n = 477). Patients were excluded if a supine chest radiograph was not available (n = 232) or if the chest radiograph did not allow proper assessment of the AVL (n = 5) or if the patient had previously undergone pneumonectomy (n = 2).Combining SAVR (n = 235) and TAVI (n = 238) patients resulted in 473 patients; the su-pine chest radiograph images of those were analyzed, and the AVL ratio was calculated. A total of 401 radiograph images were taken on the same day as the surgical (or TAVI) procedure, 27 were taken on day 1, and 22 on day 2 after the procedure, meaning that 95% of all radiographs were taken within 2 days of the procedure. The remaining 5% were taken within 3 weeks after the procedure.
Validation
In order to validate the AVL ratio, CT scans of consecutive patients without known val-vular disease (n = 98), referred for coronary artery calcium scoring, were compared with CT scans carried out during TAVI workup. In addition, CT scans carried out during TAVI workup were analyzed and compared with chest radiograph measurements of the same patient (n = 105). The influence of a sternotomy, intubation, and lung disease (defined as FEV1/FVC ratio [FEV1%] < 75%) on the AVL ratio was assessed using chest radiographs. To evaluate interobserver variability, two observers independently measured the AVL ratio on supine chest radiograph of 122 TAVI patients.
Monitoring Intracardiac Assist Device Position
Supine chest radiographs were subsequently used to assess intracardiac device posi-tion (Impella) in ICU patients treated between January 2013 and November 2015 in our institution. The Impella (Abiomed) is a catheter-based axial blood pump, inserted into the left ventricle via the femoral artery. Echocardiography is currently the standard technique used to assess the position of the Impella. TTE evaluation of the position was carried out using the parasternal long-axis three-chamber view, showing both the aortic valve and the inlet area (Figure 3). For optimal positioning of the Impella, the inlet area

CHAPTER 4 81
477
patie
nts
rece
ived
an
Edw
ards
Sap
ien
TAVI
bet
wee
n N
ovem
ber 2
007
and
Dec
embe
r 201
4
238
patie
nts
with
AP
ches
t X-r
ay
239
patie
nts
wer
e ex
clud
ed d
ue to
: - n
o A
P ch
est X
-ray
(n=2
32)
- val
ve n
ot v
isib
le o
n A
P ch
est X
-ray
(n=5
)- p
revi
ous
pneu
mon
ecto
my
(n=2
)
105
CT s
cans
sel
ecte
d
98 p
atie
nts
visi
ted
the
outp
atie
nt c
linic
with
angi
na p
ecto
ris a
nd a
CT
scan
was
mad
e be
twee
nJu
ne 2
013
and
Oct
ober
201
4
294
patie
nts
unde
rwen
t a s
urgi
cal a
ortic
va
lve
repl
acem
ent b
etw
een
Janu
ary
2013
and
Aug
ust
2014
59 p
atie
nts
wer
e ex
clud
ed d
ue to
: - a
ortic
val
ve p
rost
hesi
s w
as n
ot v
isib
le o
n ch
est X
-ray
(n=5
4)- c
hest
X-r
ay n
ot in
terp
reta
ble
due
to p
oor q
ualit
y (n
=4)
- aor
tic v
lave
pro
sthe
sis
plac
ed m
ore
dist
ally
in th
e ao
rta
(n=1
)
235
ches
t X-r
ays
wer
e an
alyz
ed
473
X-ra
ys w
ith a
radi
opha
que
aort
ic v
alve
pro
sthe
sis
203
CT s
cans
wer
e an
alyz
ed fo
r aor
tic v
alve
loca
tion
Figu
re 2
Flo
wch
art o
f pat
ient
sel
ectio
n.A
P =
ante
rior-
post
erio
r, ch
est x
-ray
= c
hest
radi
ogra
ph, T
AVI =
tran
scat
hete
r aor
tic v
alve
impl
anta
tion.

82 PART I
should be about 3.5 cm below the aortic valve annulus and well away from papillary muscle and subannular structures. The outlet area should be well above the aortic valve. The distance between the aortic valve annulus and the inlet area was measured by a cardiologist experienced in echocardiographic assessment of Impella position. A five-point scale was developed to evaluate the position of the Impella on chest radiograph (Figure 3). The position of the Impella on supine chest radiograph was then graded by an interventional cardiologist and a cardiovascular radiologist. If no agreement could be reached, a third cardiologist assessed the grading. Concordance of Impella position on chest radiograph and echocardiographic imaging was evaluated if the radiograph and echocardiographic imaging were performed within a 3-hour time frame.
Correct position of aortic valve
Inlet area
Outlet areaGrade 1: too far into the ventricle
Grade 2: a little too far into the ventricle
Grade 3: good position
Grade 4: a little too far into the aorta
Grade 5: too far into the aorta
Grade 1too far into
the ventricle
Grade 2a little too far into the
ventricle
Grade 3good
position
Grade 4a little too far into the
aorta
Grade 5too far into the
aorta
Supine chest X-ray
RV
LV
LA
SeptumImpella 2.5 inlet area
Impella 2.5outlet area
Mitral valve
Aorta
3.5 cm
AVL-ratio x thoracic width
thoracic width
A
DC
B
Figure 3 Comparison of the Impella position between supine chest radiograph (chest x-ray) and echocar-diography.A) Schematic image of the method to estimate the aortic valve location (AVL-ratio times the thoracic width). B) Aortic valve position score on supine chest radiograph. If the Impella is correctly positioned, the aortic valve is just proximal to the curvature. C) Schematic image of a transthoracic echocardiogram of the Impella catheter in the correct position (parasternal long-axis view). The Impella is at the correct position when the inlet area is 3.5 cm below the aortic valve annulus, away from the papillary muscle. D) Comparison of Impella position as determined by echocardiography compared with supine chest radiograph.
CHAPTER 4 83
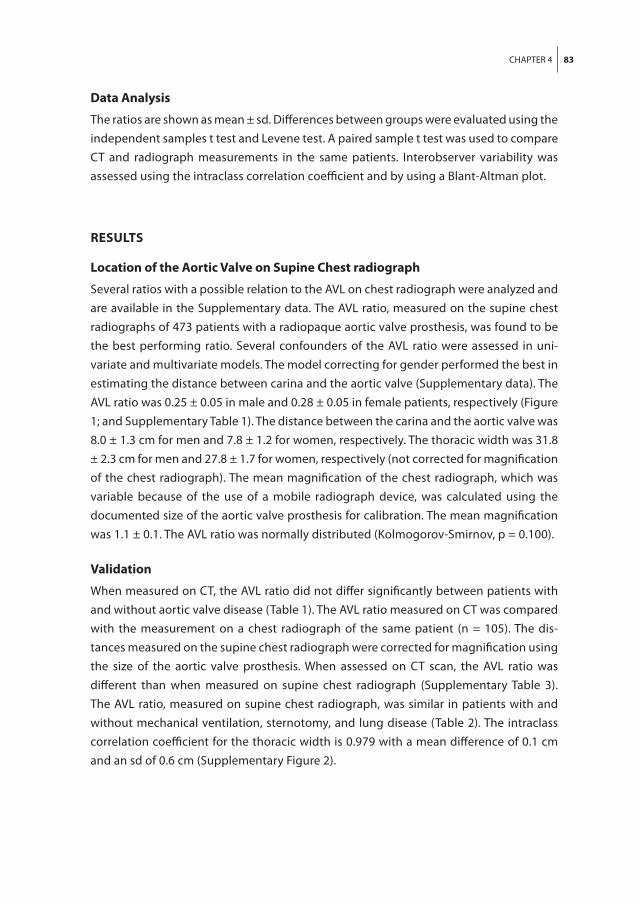
Data Analysis
The ratios are shown as mean ± sd. Differences between groups were evaluated using the independent samples t test and Levene test. A paired sample t test was used to compare CT and radiograph measurements in the same patients. Interobserver variability was assessed using the intraclass correlation coefficient and by using a Blant-Altman plot.
RESULTS
Location of the Aortic Valve on Supine Chest radiograph
Several ratios with a possible relation to the AVL on chest radiograph were analyzed and are available in the Supplementary data. The AVL ratio, measured on the supine chest radiographs of 473 patients with a radiopaque aortic valve prosthesis, was found to be the best performing ratio. Several confounders of the AVL ratio were assessed in uni-variate and multivariate models. The model correcting for gender performed the best in estimating the distance between carina and the aortic valve (Supplementary data). The AVL ratio was 0.25 ± 0.05 in male and 0.28 ± 0.05 in female patients, respectively (Figure 1; and Supplementary Table 1). The distance between the carina and the aortic valve was 8.0 ± 1.3 cm for men and 7.8 ± 1.2 for women, respectively. The thoracic width was 31.8 ± 2.3 cm for men and 27.8 ± 1.7 for women, respectively (not corrected for magnification of the chest radiograph). The mean magnification of the chest radiograph, which was variable because of the use of a mobile radiograph device, was calculated using the documented size of the aortic valve prosthesis for calibration. The mean magnification was 1.1 ± 0.1. The AVL ratio was normally distributed (Kolmogorov-Smirnov, p = 0.100).
Validation
When measured on CT, the AVL ratio did not differ significantly between patients with and without aortic valve disease (Table 1). The AVL ratio measured on CT was compared with the measurement on a chest radiograph of the same patient (n = 105). The dis-tances measured on the supine chest radiograph were corrected for magnification using the size of the aortic valve prosthesis. When assessed on CT scan, the AVL ratio was different than when measured on supine chest radiograph (Supplementary Table 3). The AVL ratio, measured on supine chest radiograph, was similar in patients with and without mechanical ventilation, sternotomy, and lung disease (Table 2). The intraclass correlation coefficient for the thoracic width is 0.979 with a mean difference of 0.1 cm and an sd of 0.6 cm (Supplementary Figure 2).
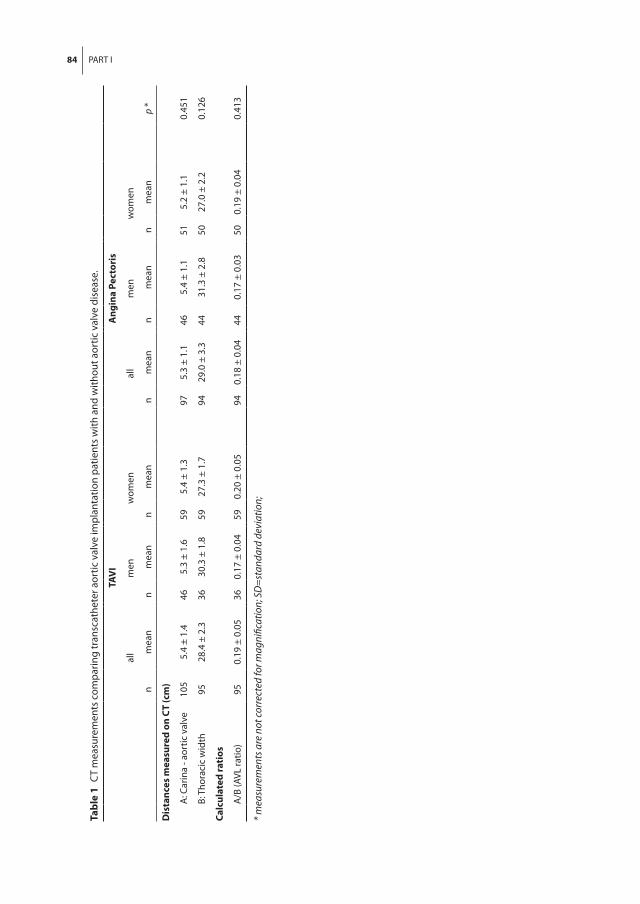
84 PART I
Tabl
e 1
CT
mea
sure
men
ts c
ompa
ring
tran
scat
hete
r aor
tic v
alve
impl
anta
tion
patie
nts
with
and
with
out a
ortic
val
ve d
isea
se.
TAV
IA
ngin
a Pe
ctor
is
all
men
wom
enal
lm
enw
omen
nm
ean
nm
ean
nm
ean
nm
ean
nm
ean
nm
ean
p *
Dis
tanc
es m
easu
red
on C
T (c
m)
A
: Car
ina
- aor
tic v
alve
105
5.4
± 1.
446
5.3
± 1.
659
5.4
± 1.
397
5.3
± 1.
146
5.4
± 1.
151
5.2
± 1.
10.
451
B:
Tho
raci
c w
idth
9528
.4 ±
2.3
3630
.3 ±
1.8
5927
.3 ±
1.7
9429
.0 ±
3.3
4431
.3 ±
2.8
5027
.0 ±
2.2
0.12
6
Calc
ulat
ed ra
tios
A
/B (A
VL ra
tio)
950.
19 ±
0.0
536
0.17
± 0
.04
590.
20 ±
0.0
594
0.18
± 0
.04
440.
17 ±
0.0
350
0.19
± 0
.04
0.41
3
* mea
sure
men
ts a
re n
ot co
rrec
ted
for m
agni
ficat
ion;
SD
=sta
ndar
d de
viat
ion;

CHAPTER 4 85
Table 2 The influence of intubation, sternotomy, and lung disease on the Aortic Valve Location Ratio.
AVL ratio
n mean p
Intubation 0.335
yes 318 0.26 ± 0.05
no 132 0.27 ± 0.05
Sternotomy 0.604
yes 388 0.27 ± 0.05
no 61 0.26 ± 0.05
Lung disease 0.146
yes 112 0.27 ± 0.04
no 291 0.27 ± 0.04
Monitoring Intracardiac Assist Device Position
The position of the Impella, determined by the AVL ratio on supine chest radiograph, was compared with the position of the Impella on corresponding echocardiography images (Figure 3). Echocardiographic assessment of Impella position was done in 42 patients in the ICU, resulting in a total of 73 echocardiographic measurements with correspond-ing supine chest radiograph measurements. Cases were excluded because of 1) non-diagnostic echocardiography image quality with consequently unmeasurable Impella depth (n = 4), 2) more than 3 hours between performing the TTE and the radiograph (n = 17), or 3) repositioning of the Impella between the TTE and the radiograph (n = 2). This resulted in a total of 50 modality comparisons in 28 patients. Figure 3 shows a good correlation between the echocardiographic measurements and the grading of Impella position on supine chest radiograph measurements. Some examples of supine chest radiograph and corresponding echocardiography images are shown in Supplementary Figure 3.
DISCUSSIOn
This study shows that the location of the native aortic valve can be accurately estimated on supine chest radiograph. With this knowledge, we introduced a novel tool, the AVL ratio, which can be used for evaluation of intracardiac assist device position in patients in the ICU. The use of a supine chest radiograph to evaluate the position of an intracar-diac assist device is very useful as supine radiographs are easily and frequently carried out on an ICU, whereas the quality of echocardiography is often impaired. If malposition of a device is suspected on supine chest radiograph, additional echocardiography can be done to further assess and adjust the position of the device. Based on our analyses,
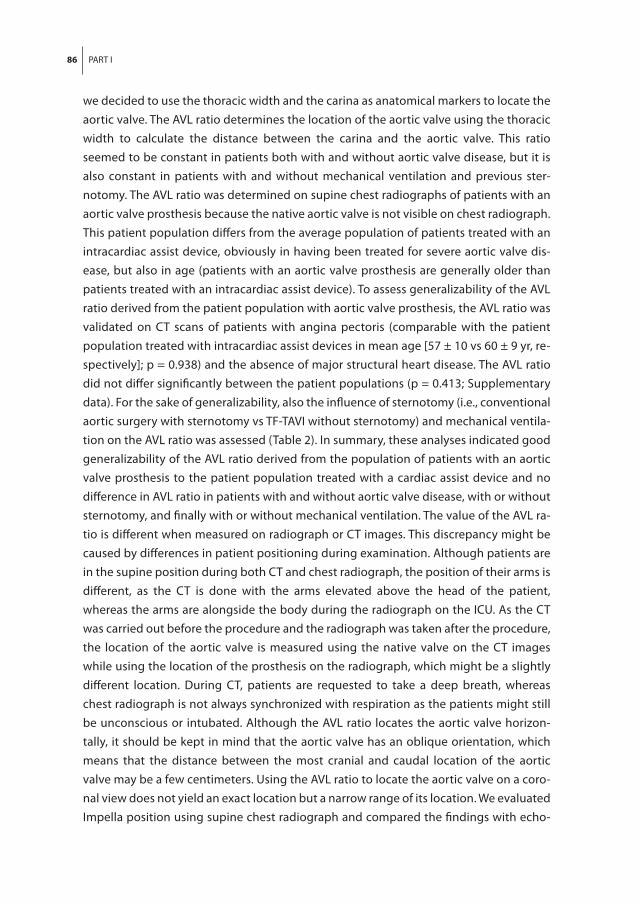
86 PART I
we decided to use the thoracic width and the carina as anatomical markers to locate the aortic valve. The AVL ratio determines the location of the aortic valve using the thoracic width to calculate the distance between the carina and the aortic valve. This ratio seemed to be constant in patients both with and without aortic valve disease, but it is also constant in patients with and without mechanical ventilation and previous ster-notomy. The AVL ratio was determined on supine chest radiographs of patients with an aortic valve prosthesis because the native aortic valve is not visible on chest radiograph. This patient population differs from the average population of patients treated with an intracardiac assist device, obviously in having been treated for severe aortic valve dis-ease, but also in age (patients with an aortic valve prosthesis are generally older than patients treated with an intracardiac assist device). To assess generalizability of the AVL ratio derived from the patient population with aortic valve prosthesis, the AVL ratio was validated on CT scans of patients with angina pectoris (comparable with the patient population treated with intracardiac assist devices in mean age [57 ± 10 vs 60 ± 9 yr, re-spectively]; p = 0.938) and the absence of major structural heart disease. The AVL ratio did not differ significantly between the patient populations (p = 0.413; Supplementary data). For the sake of generalizability, also the influence of sternotomy (i.e., conventional aortic surgery with sternotomy vs TF-TAVI without sternotomy) and mechanical ventila-tion on the AVL ratio was assessed (Table 2). In summary, these analyses indicated good generalizability of the AVL ratio derived from the population of patients with an aortic valve prosthesis to the patient population treated with a cardiac assist device and no difference in AVL ratio in patients with and without aortic valve disease, with or without sternotomy, and finally with or without mechanical ventilation. The value of the AVL ra-tio is different when measured on radiograph or CT images. This discrepancy might be caused by differences in patient positioning during examination. Although patients are in the supine position during both CT and chest radiograph, the position of their arms is different, as the CT is done with the arms elevated above the head of the patient, whereas the arms are alongside the body during the radiograph on the ICU. As the CT was carried out before the procedure and the radiograph was taken after the procedure, the location of the aortic valve is measured using the native valve on the CT images while using the location of the prosthesis on the radiograph, which might be a slightly different location. During CT, patients are requested to take a deep breath, whereas chest radiograph is not always synchronized with respiration as the patients might still be unconscious or intubated. Although the AVL ratio locates the aortic valve horizon-tally, it should be kept in mind that the aortic valve has an oblique orientation, which means that the distance between the most cranial and caudal location of the aortic valve may be a few centimeters. Using the AVL ratio to locate the aortic valve on a coro-nal view does not yield an exact location but a narrow range of its location. We evaluated Impella position using supine chest radiograph and compared the findings with echo-

CHAPTER 4 87
cardiographic images. Maintaining the correct position of the Impella is a key factor in managing these patients. Patients are usually supported for several days, and assessing the position of the Impella needs to be as easy as possible. We have shown a good cor-relation of device position assessed by either supine chest radiograph images, the AVL ratio, or echocardiography. The sensitivity and specificity are 100% and 45%, respec-tively, with malposition defined as grade 1,2, 4 or 5 on chest radiograph (Figure 3) and as a distance of greater than 7.0 or less than 1.0 cm between aortic valve and Impella inlet on echocardiography. The 100% sensitivity indicates that if the chest radiograph sug-gests that the device is well positioned, assessment of device position with echocar-diography will suggest the same (i.e., no false negatives). However, the lower specificity indicates that chest radiograph may suggest device malposition, whereas in truth, the device is properly positioned. Therefore, the AVL ratio can be used as a screening tool as it gives a good indication of when echocardiography should be performed. Although we found a good correlation, there might be a slight discrepancy between the exact position of the device determined with both methods. For example, as the Impella de-vice is freely positioned in the ventricle, across the aortic valve, it is able to move along with the contractions and/or filling properties of the left ventricle. The Impella device therefore is not in one fixed position. However, as the distance between the inlet and the outlet of the Impella 2.5 catheter is 6.5 cm, and even longer in the Impella CP (7.8 cm) or Impella 5.0 (8.0 cm), the Impella is in correct position within a certain range around the aortic valve. Another cause of discrepant findings between supine chest radiograph and echocardiography is the difficulty in some cases to visualize both the distal part of the Impella and the aortic valve in a single three-chamber long-axis view, which could result in accidently measuring the Impella pigtail (which is around 3.5 cm in length) instead of measuring the Impella cannula. A limitation of our study that should be addressed is a possible change in Impella device position in the time between the echocardiography and chest radiograph. We therefore limited the time period between imaging modalities to 3 hours. Nevertheless, the position of the Impella could have been altered by the movement of the patient, altered filling properties of the left ventricle, or altered perfor-mance level of the Impella. The advantage of echocardiography imaging for evaluation of the position of intracardiac assist devices is the possibility to assess the relative posi-tion of the anatomical structures adjacent to the device (i.e., the mitral valve apparatus), instead of only the aortic valve. Also, cardiac function can be evaluated, and as stated above, the position can be adjusted under direct echocardiographic guidance. However, echocardiographic imaging is not always readily available, is time consuming, is opera-tor-dependent, and necessitates the availability of a dedicated echocardiographer. Therefore, we propose a strategy of screening of the position of the intracardiac assist devices with an easily available supine chest radiograph and in the case of a presumed dislocation, further echocardiographic imaging. Previously, a bedside method to moni-
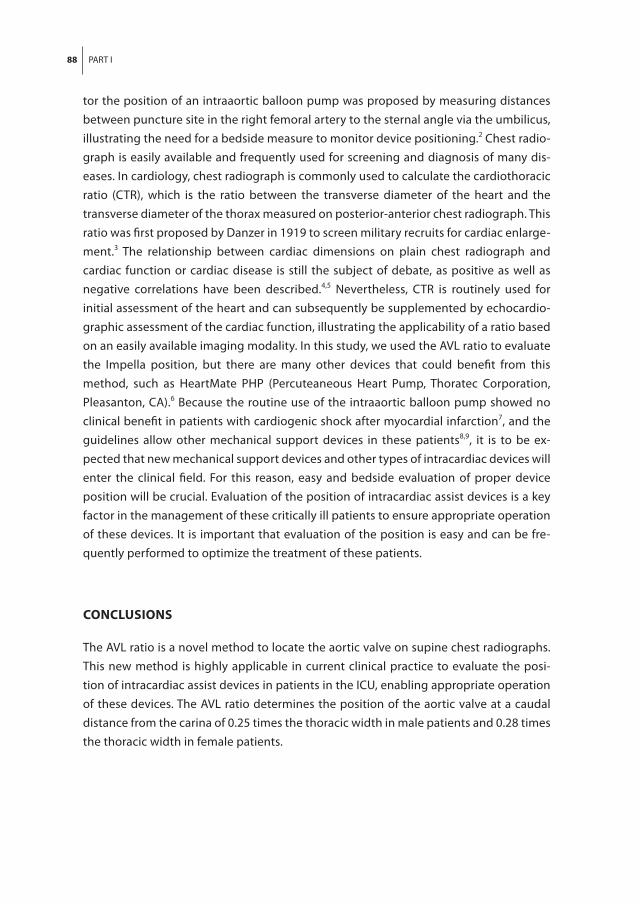
88 PART I
tor the position of an intraaortic balloon pump was proposed by measuring distances between puncture site in the right femoral artery to the sternal angle via the umbilicus, illustrating the need for a bedside measure to monitor device positioning.2 Chest radio-graph is easily available and frequently used for screening and diagnosis of many dis-eases. In cardiology, chest radiograph is commonly used to calculate the cardiothoracic ratio (CTR), which is the ratio between the transverse diameter of the heart and the transverse diameter of the thorax measured on posterior-anterior chest radiograph. This ratio was first proposed by Danzer in 1919 to screen military recruits for cardiac enlarge-ment.3 The relationship between cardiac dimensions on plain chest radiograph and cardiac function or cardiac disease is still the subject of debate, as positive as well as negative correlations have been described.4,5 Nevertheless, CTR is routinely used for initial assessment of the heart and can subsequently be supplemented by echocardio-graphic assessment of the cardiac function, illustrating the applicability of a ratio based on an easily available imaging modality. In this study, we used the AVL ratio to evaluate the Impella position, but there are many other devices that could benefit from this method, such as HeartMate PHP (Percuteaneous Heart Pump, Thoratec Corporation, Pleasanton, CA).6 Because the routine use of the intraaortic balloon pump showed no clinical benefit in patients with cardiogenic shock after myocardial infarction7, and the guidelines allow other mechanical support devices in these patients8,9, it is to be ex-pected that new mechanical support devices and other types of intracardiac devices will enter the clinical field. For this reason, easy and bedside evaluation of proper device position will be crucial. Evaluation of the position of intracardiac assist devices is a key factor in the management of these critically ill patients to ensure appropriate operation of these devices. It is important that evaluation of the position is easy and can be fre-quently performed to optimize the treatment of these patients.
COnCLUSIOnS
The AVL ratio is a novel method to locate the aortic valve on supine chest radiographs. This new method is highly applicable in current clinical practice to evaluate the posi-tion of intracardiac assist devices in patients in the ICU, enabling appropriate operation of these devices. The AVL ratio determines the position of the aortic valve at a caudal distance from the carina of 0.25 times the thoracic width in male patients and 0.28 times the thoracic width in female patients.
CHAPTER 4 89
REFEREnCES
1. Henriques JP, Remmelink M, Baan J, Jr., et al. Safety and feasibility of elective high-risk percutaneous coronary intervention procedures with left ventricular support of the Impella Recover LP 2.5. Am J Cardiol. 2006;97(7):990-992.
2. Kim SH, Choi YJ, Bae KE, et al. Bedside approach to optimizing the positioning of intra-aortic balloon pumps. Br J Anaesth. 2013;110(2):316-317.
3. Danzer CS. The cardiothoracic ratio: an index of cardiac enlargement. The American Journal of the Medical Sciences. 1919;157(4):513-554.
4. Satou GM, Lacro RV, Chung T, et al. Heart size on chest x-ray as a predictor of cardiac enlargement by echocardiography in chil-dren. Pediatr Cardiol. 2001;22(3):218-222.
5. Philbin EF, Garg R, Danisa K, et al. The rela-tionship between cardiothoracic ratio and left ventricular ejection fraction in conges-tive heart failure. Digitalis Investigation Group. Arch Intern Med. 1998;158(5):501-506.
6. Kandzari D, Ebner A, Muller P. TCT-126 First-in-human experience with a novel high-flow percutaneous heart pump. J Am Coll Cardiol. 2013;62(18_S1):B41-B41.
7. Thiele H, Zeymer U, Neumann FJ, et al. Intraaortic Balloon Support for Myocardial Infarction with Cardiogenic Shock. N Engl J Med. 2012.
8. Windecker S, Kolh P, Alfonso F, et al. 2014 ESC/EACTS Guidelines on myocardial re-vascularization: The Task Force on Myocar-dial Revascularization of the European So-ciety of Cardiology (ESC) and the European Association for Cardio-Thoracic Surgery (EACTS). Eur Heart J. 2014;35(37):2541-2619.
9. O’Gara PT, Kushner FG, Ascheim DD, et al. 2013 ACCF/AHA guideline for the manage-ment of ST-elevation myocardial infarc-tion: a report of the American College of Cardiology Foundation/American Heart Association Task Force on Practice Guide-lines. J Am Coll Cardiol. 2013;61(4):e78-140.

90 PART I
SUPPLEMEnTARY DATA
Supplementary Table 1 Measurements on AP chest X-rays of patients with a radiopaque aortic valve prosthesis.
all man women
n mean ± SD n mean ± SD n mean ± SD p
Distances measured (cm) *
A: Carina - aortic valve 455 8.0 ± 1.2 239 8.1 ± 1.3 216 7.8 ± 1.2 0.010
B: Thoracic width 460 29.9 ± 2.8 239 31.8 ± 2.2 221 27.9 ± 1.7 <0.001
C: Aortic valve - diaphragm 445 6.2 ± 1.7 233 6.3 ± 1.6 212 6.2 ± 1.8 0.308
D: Carina - diaphragm 432 14.3 ± 1.8 225 14.5 ± 1.6 207 14.1 ± 1.9 0.023
E: Lung apex - diaphragm 442 24.9 ± 2.5 230 25.5 ± 2.4 212 24.2 ± 2.5 <0.001
Calculated ratios
A/B (AVL ratio) 448 0.27 ± 0.05 232 0.25 ± 0.04 216 0.28 ± 0.05 <0.001
A/D 432 0.56 ± 0.09 225 0.56 ± 0.08 207 0.56 ± 0.09 0.762
A/E 430 0.32 ± 0.05 223 0.32 ± 0.05 207 0.32 ± 0.05 0.130
C/A 432 0.82 ± 0.30 225 0.82 ± 0.27 207 0.82 ± 0.32 0.968
C/B 438 0.21 ± 0.06 226 0.20 ± 0.05 212 0.22 ± 0.06 <0.001
C/D 432 0.43 ± 0.09 225 0.43 ± 0.08 207 0.43 ± 0.09 0.764
C/E 439 0.25 ± 0.05 229 0.25 ± 0.05 210 0.25 ± 0.06 0.613
* measurements are not corrected for magnification; SD=standard deviation; AP=anterior-posterior
Supplementary Table 2 CT measurements - comparing TAVI and AP patients.
TAVI Angina Pectoris
n mean ± SD n mean ± SD p
Distances measured on CT (cm)
A: Carina - aortic valve 105 5.4 ± 1.4 97 5.3 ± 1.1 0.451
B: Thoracic width 95 28.4 ± 2.3 94 29.0 ± 3.3 0.126
C: Aortic valve - diaphragm 105 7.9 ± 1.5 97 7.2 ± 1.3 <0.001
D: Carina - diaphragm 105 13.2 ± 2.0 97 12.4 ± 1.6 0.004
E: Lung apex - diaphragm 67 23.1 ± 2.4 52 21.7 ± 2.6 0.002
Calculated ratios
A/B (AVL ratio) 95 0.19 ± 0.05 94 0.18 ± 0.04 0.413
A/D 105 0.42 ± 0.24 97 0.42 ± 0.07 0.998
A/E 67 0.23 ± 0.07 52 0.25 ± 0.04 0.128
C/A 105 1.58 ± 0.56 97 1.43 ± 0.41 0.028
C/B 95 0.28 ± 0.06 94 0.25 ± 0.05 0.001
C/D 105 0.61 ± 0.14 97 0.58 ± 0.07 0.070
C/E 67 0.35 ± 0.06 52 0.34 ± 0.05 0.260
CT=Computed tomography; SD=standard deviation, TAVI=transcatheter aortic valve replacement;

CHAPTER 4 91
Supplementary Table 3 Difference between CT and AP chest X-ray measured of TAVI patients.
CT X-ray *
n mean ± SD mean ± SD p
Distances measured (cm)
A: Carina - aortic valve 102 5.4 ± 1.5 4.9 ± 1.3 <0.001
B: Thoracic width 93 28.4 ± 2.3 26.1 ± 2.6 <0.001
C: Aortic valve - diaphragm 99 7.9 ± 1.5 5.8 ± 1.8 <0.001
D: Carina - diaphragm 98 13.2 ± 2.0 13.0 ± 2.0 0.441
E: Lung apex - diaphragm 64 23.0 ± 2.4 22.5 ± 2.8 0.101
Calculated ratios
A/B (AVL ratio) 94 0.19 ± 0.05 0.28 ± 0.05 <0.001
A/D 100 0.42 ± 0.25 0.56 ± 0.09 <0.001
A/E 65 0.23 ± 0.07 0.32 ± 0.06 <0.001
C/A 100 1.59 ± 0.56 0.83 ± 0.32 <0.001
C/B 93 0.28 ± 0.06 0.22 ± 0.06 <0.001
C/D 100 0.61 ± 0.14 0.44 ± 0.09 <0.001
C/E 65 0.35 ± 0.06 0.26 ± 0.06 <0.001
* corrected for magnification by measuring the size of the aortic valve prosthesis. SD=standard deviation.
Supplementary Table 4 Different multivariate models for the AVL ratio, with corrections for gender, BMI and age.
ModelCorrecting variables AVL – ratio =
Carina-aortic valve difference(measured and estimated)Mean difference ± SD (cm)
1 - 0.27 -0.15 ± 1.37
2 Gender 0.28 – 0.027 (if male) -0.05 ± 1.31
3 Gender, age 0.24 - 0.024 (if male) + 0.001*age 0.93 ± 1.34
4 Gender, BMI 0.35 - 0.028 (if male) - 0.002*BMI 0.31 ± 1.27
5 Age, BMI 0.27 + 0.001*age - 0.002*BMI 0.70 ± 1.35
6 Gender, Age, BMI 0.30 + 0.002*BMI + 0.001*age -0.026 (if male) 1.18 ± 1.29
We tested different models with corrections for gender, BMI and age. The models were designed by using a multivariate model to estimate the AVL ratio. After estimating the AVL ratio, the AVL ratio was used to calculate the distance between the carina and the aortic valve (by multiplying it with the thorax width). This estimated distance was compared with the measured distance on the supine chest X-ray images of patients with an aortic valve prosthesis. The difference between the calculated and measured distance between the carina and the aortic valve was smallest when only correcting the AVL ratio for gender (see table).The model only correcting for gender performed the best (smallest mean difference in estimating the dis-tance between carina and the aortic valve. Therefore we have chosen to correct the AVL ratio for gender only. We believe it is important for the ratio to be simple and easily applicable, encouraging correction for gender only and not for additional variables.

92 PART I
E
D
C
A
B
Supplementary Figure 1 Measured ratiosSeveral distances were measured to define the location of the aortic valve in relation to anatomical land-marks seen on chest X-ray. The anatomical landmarks used to measure the ratios are: (1) the tracheal bifur-cation (carina), (2) the medial portion of the diaphragm at the level of the spine, (3) the apex of the lung and (4) the middle of the aortic valve prosthesis. The AVL ratio is defined as A/B in which A is the distance between the carina and the aortic valve and B the internal thoracic width at the level of the medial portion of the diaphragm.
20 22 24 26 28 30 32 34 36 38 40
Mean thorax width (cm)
-4
-2
0
2
4
Diff
eren
ce th
orax
wid
th (c
m)
+1.96*SD
-1.96*SD
Mean-0.09
1.06
-1.23
Supplementary Figure 2 Bland-Altman plot thoracic widthBland-Altman plot of the thoracic width measured by 2 independent observers on supine chest X-ray of TAVI patients. The solid line represents the mean difference of -0.09 cm. The dashed lines represent the 95% limits of agreement.

CHAPTER 4 93
B
A
C
D
E
Supplementary Figure 3 Examples of Impella position on supine chest X-ray images and corresponding echocardiographyA) The Impella is too far into the aorta; B) The Impella is a little too far into the aorta; C) The Impella is in correct position; D) The Impella is a little too far into the ventricle; E) The Impella is too far into the ventricle.