using video-based measurements to generate a...
TRANSCRIPT
Using Video-Based Measurements toGenerate a Real-Time Network Traffic Map
Yi Sun⊗, Junchen Jiang†, Vyas Sekar†, Hui Zhang†, Fuyuan Lin⊗, Nanshu Wang⊗⊗ Institute of Computing Technology, Chinese Academy of Sciences, Beijing, China
† Carnegie Mellon University, Pittsburgh, PA, USA{sunyi, linfuyuan, wangnanshu}@ict.ac.cn,
{junchenj, hzhang}@cs.cmu.edu, [email protected]
ABSTRACTWe envision a real-time network traffic map for the Internet,where each network link is annotated with its capacity andits current utilization, with an interface that networked ap-plications can query to inform their control decisions. Whilethis goal is simple to state, it has been out of our reach dueto concerns over measurement overhead and coverage. Ourinsight is that the rise of Internet video and the availability ofmeasurements from video players present an unprecedentedopportunity to address these issues. We outline a prelimi-nary roadmap to build on this opportunity to realize a globaltraffic map.
Categories and Subject DescriptorsC.2.4 [Computer-Communication Networks]: Distributedsystems—Distributed applications
General TermsPerformance, Measurement
1 IntroductionMany Internet applications can benefit from a service thatprovides a real-time traffic map of the Internet [8, 19]. Forinstance, CDNs could improve server selection and peer-to-peer applications can choose peers more intelligently. Sim-ilarly, websites can be optimized to customize content fortheir clients based on the network state. Such a service mayalso be useful for network diagnosis and troubleshooting. Inthe absence of such a service, each application today deployscustom home-grown solutions or operate “in the dark” viatrial-and-error solutions.
While this high-level vision of a global traffic map is notnew, this goal has proved remarkably elusive. The mainchallenge that prior efforts have faced can be captured alongthree key dimensions:
Permission to make digital or hard copies of all or part of this work forpersonal or classroom use is granted without fee provided that copies arenot made or distributed for profit or commercial advantage and that copiesbear this notice and the full citation on the first page. To copy otherwise, torepublish, to post on servers or to redistribute to lists, requires prior specificpermission and/or a fee.Hotnets ’14, October 27–28, 2014, Los Angeles, CA, USA.Copyright 2014 ACM 978-1-4503-3256-9 ...$15.00.
• Coverage: Obtaining a global view of the network neces-sarily entails deploying many millions of vantage pointsrunning some measurement logic to obtain path-level met-rics of interest. While “crowdsourcing” such measure-ments via P2P applications is promising [7, 4, 21], eventhe largest deployed efforts have limited visibility.• Overhead: While reachability or latency are easy to mea-
sure, metrics such as available bandwidth or capacityor the location of bottlenecks have traditionally requiredalgorithms with non-trivial overhead (e.g., few 100s ofKBs per run) per path [24].• Real-time views: To reflect current conditions, this traf-
fic map also needs to be updated in near real-time. Thisraises further concerns in conjunction with the above con-cerns; i.e., we need millions of vantage points continu-ously running non-trivial measurements all the time.
Thus, this vision of a global traffic map has been out ofour reach. In this context, we observe that the growing vol-ume of Internet video traffic [1] and the ability to instrumentvideo players to measure performance of video sessions innear real-time [17, 11] offer an unprecedented opportunity toaddress the above challenges. Specifically, we have (perhapsfor the first time) the capability to obtain real-time measure-ments of the network state from millions of vantage pointswithout any additional probing overhead.
This paper presents an preliminary roadmap to leveragethis opportunity of using video traffic as the “carrier signal”to generate a real-time traffic map. We envision one or moreproviders in the video ecosystem who can offer such a ser-vice. For instance, many content providers (e.g., Googleor Netflix or PPLive), CDNs (e.g., Akamai, ChinaCache),and third-party analytics providers (e.g., Conviva, Ooyala)already collect such measurements and are in a good posi-tion to build (and monetize) this service.
Specifically, our traffic map service annotates each linkin the network1 with its capacity and its current utilization.A networked application can query the service to obtain thestate of links pertinent to its users’ performance. Even though
1The granularity of a link depends on the topology view; e.g.,Layer 2 vs Layer 3, router vs. PoP. We currently use a PoP-levelview as it offers more robust topology measurements. Our visionand algorithms, however, are quite general.
1
Topology & Rou+ng Info
Video player measurements
Traffic Map Service
Low High Med
Throughput Bytes Path
Query API
Clients, CDN, ISP, P2P, 3rd party optimizers
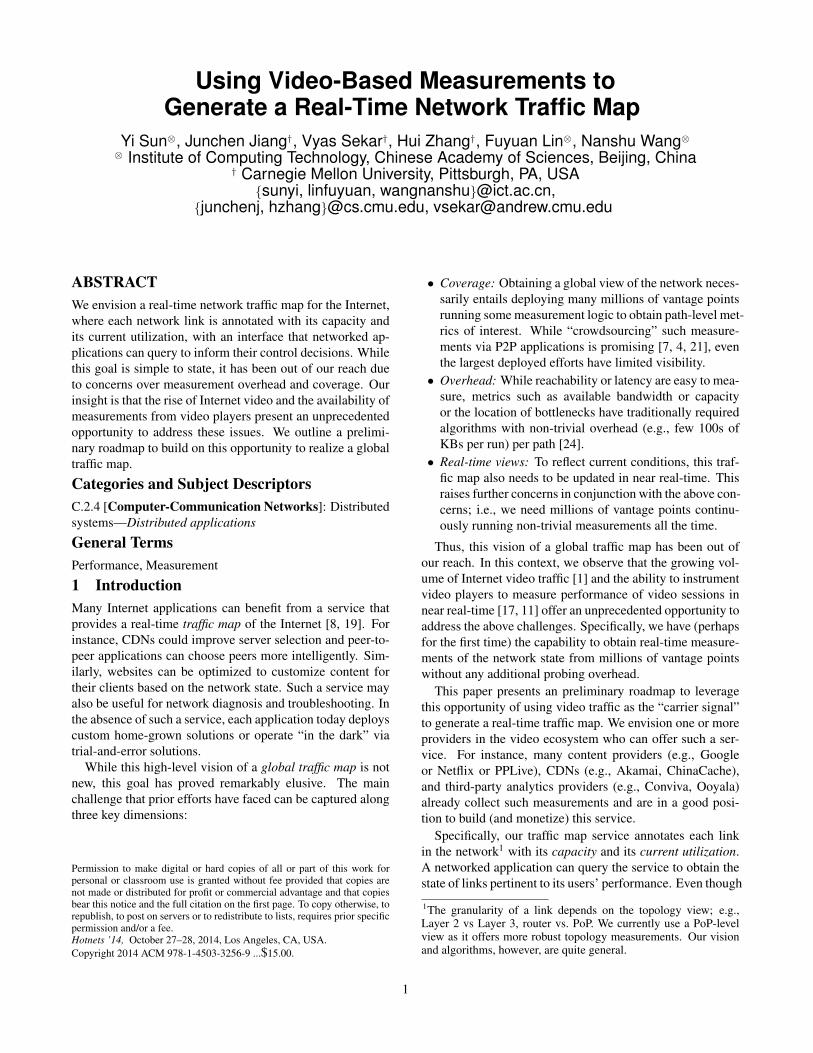
Figure 1: Overview of the ICTM service
video measurements are an enabler for our vision, there aretwo key challenges that remain. First, video measurementsprovide coarse-grained estimates of end-to-end throughputand do not directly provide the available bandwidth or uti-lization per-link. Second, we do not know the backgroundtraffic (i.e., other unobserved video and non-video traffic).
We present an initial attempt to address these challengesby casting them as network tomography problems [6]. Forcapacity inference, we leverage the history of measurementsto compensate for the lack of a fine-grained view. Further-more, we can use side information such as the ratio of mea-surement to background traffic; e.g., Netflix is typically 20-30% of peak traffic in US [2]. We can also exploit typicalgravity-based traffic structures [26]. Third, to compute thecurrent utilization of links we infer the background traffic oneach link by approximating the traffic flows in the networkas a fair sharing solution. Then, we use a maximum likeli-hood estimate of the background flows that best explains ourcurrent observations.
We evaluate our capacity and utilization inference algo-rithms on realistic network topologies with synthetic back-ground and measurement workloads. Our initial results arepromising. Even with our initial algorithms we are able topredict the capacity with 80% accuracy when the measure-ment traffic is roughly 20-30% of the total traffic. Further-more, we observe a positive influence of having more data,wherein adding more historical measurements can substan-tially boost the capacity inference. We also observe that ourbackground inference algorithm is very accurate.
While these early results are promising, we acknowledgeseveral limitations that need to be addressed before our vi-sion becomes practical. First, we need to understand howcritical the different “side” information factors are and howaccurate these need to be. Second, our current backgroundinference is slow as it relies on a simple space search algo-rithm and we need faster algorithms to make ICTM a nearreal-time service. Finally, we need to validate our ideas us-ing real data feeds from popular video providers.
2 ICTM OverviewOur vision is an ICTM (Internet Capacity and Traffic Map)service shown in Figure 1 that applications can query usinga public API to obtain a near real-time estimate of differentaspects of the network status. Applications may request the
link capacity, the traffic and utilization of the link, and theavailable bandwidth between pairs of endpoints.
The figure also shows the key inputs into the system. Thefirst input is a set of video-based measurement feeds, whereeach video client reports throughput and total number ofbytes downloaded in an epoch from a specific video server.We assume access to a route measurement platform such asiPlane [19].2 ICTM does not need any additional active mea-surements beyond these data feeds. We use the video mea-surements and the routing data to annotate each PoP-levellink with its link capacity and current utilization.
Many video providers, CDNs, and third-party providersalready collect large volumes of such video measurementsfor their day-to-day operations [11, 17], and this is not a sig-nificant additional burden. The coverage of the ICTM ser-vice operated by different parties may vary; e.g., CDNs havethe view of all traffic from its own servers, while a contentprovider can offer views across multiple CDNs. As such ourfocus in this paper is on establishing the viability of such anICTM service irrespective of the choice of the provider andeconomic/monetization issues.
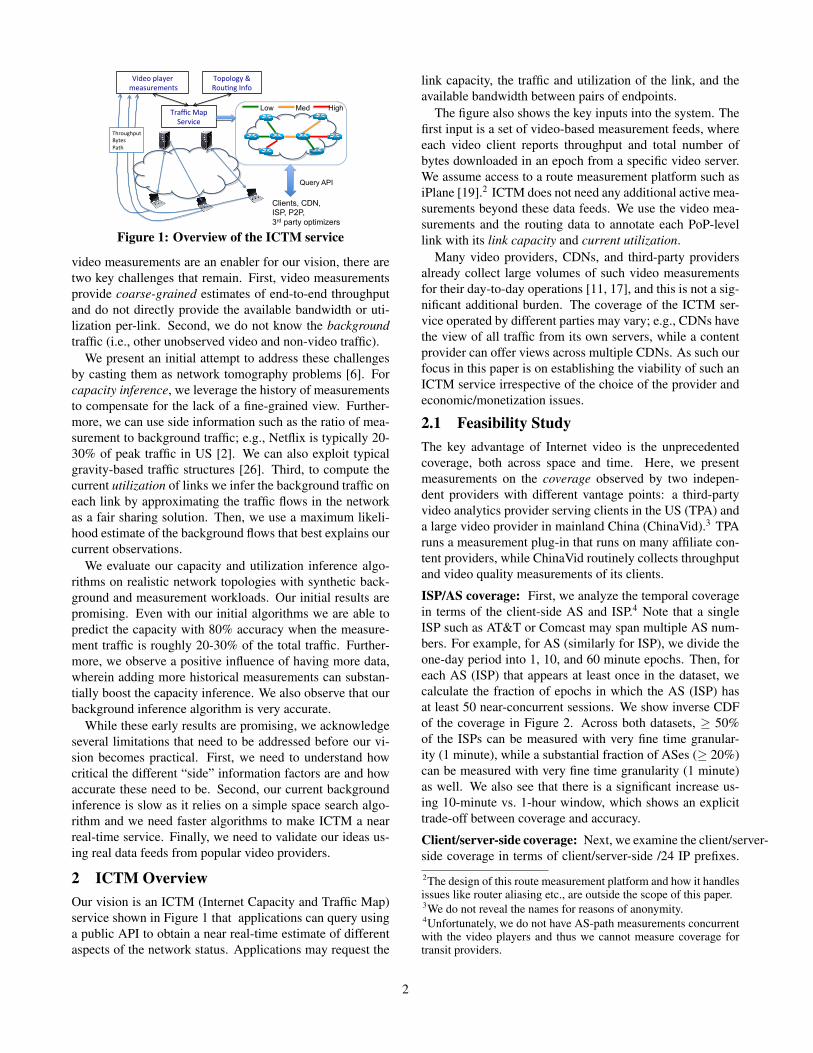
2.1 Feasibility StudyThe key advantage of Internet video is the unprecedentedcoverage, both across space and time. Here, we presentmeasurements on the coverage observed by two indepen-dent providers with different vantage points: a third-partyvideo analytics provider serving clients in the US (TPA) anda large video provider in mainland China (ChinaVid).3 TPAruns a measurement plug-in that runs on many affiliate con-tent providers, while ChinaVid routinely collects throughputand video quality measurements of its clients.
ISP/AS coverage: First, we analyze the temporal coveragein terms of the client-side AS and ISP.4 Note that a singleISP such as AT&T or Comcast may span multiple AS num-bers. For example, for AS (similarly for ISP), we divide theone-day period into 1, 10, and 60 minute epochs. Then, foreach AS (ISP) that appears at least once in the dataset, wecalculate the fraction of epochs in which the AS (ISP) hasat least 50 near-concurrent sessions. We show inverse CDFof the coverage in Figure 2. Across both datasets, ≥ 50%of the ISPs can be measured with very fine time granular-ity (1 minute), while a substantial fraction of ASes (≥ 20%)can be measured with very fine time granularity (1 minute)as well. We also see that there is a significant increase us-ing 10-minute vs. 1-hour window, which shows an explicittrade-off between coverage and accuracy.
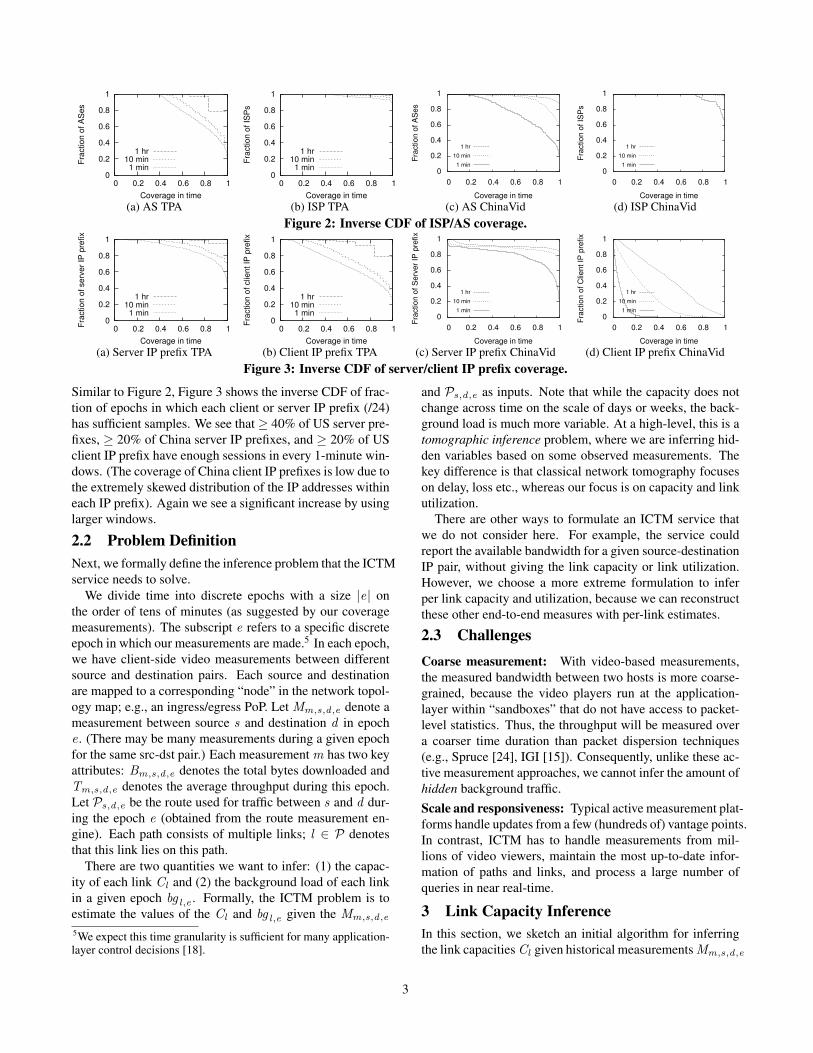
Client/server-side coverage: Next, we examine the client/server-side coverage in terms of client/server-side /24 IP prefixes.2The design of this route measurement platform and how it handlesissues like router aliasing etc., are outside the scope of this paper.3We do not reveal the names for reasons of anonymity.4Unfortunately, we do not have AS-path measurements concurrentwith the video players and thus we cannot measure coverage fortransit providers.
2
0
0.2
0.4
0.6
0.8
1
0 0.2 0.4 0.6 0.8 1
Fra
ction o
f A
Ses
Coverage in time
1 hr10 min1 min
(a) AS TPA
0
0.2
0.4
0.6
0.8
1
0 0.2 0.4 0.6 0.8 1
Fra
ction o
f IS
Ps
Coverage in time
1 hr10 min1 min
(b) ISP TPA
0
0.2
0.4
0.6
0.8
1
0 0.2 0.4 0.6 0.8 1
Frac
tion
ofA
Ses
Coverage in time
1 hr
10 min
1 min
(c) AS ChinaVid
0
0.2
0.4
0.6
0.8
1
0 0.2 0.4 0.6 0.8 1
Frac
tion
ofIS
Ps
Coverage in time
1 hr
10 min
1 min
(d) ISP ChinaVidFigure 2: Inverse CDF of ISP/AS coverage.
0
0.2
0.4
0.6
0.8
1
0 0.2 0.4 0.6 0.8 1Fra
ction o
f serv
er
IP p
refix
Coverage in time
1 hr10 min1 min
(a) Server IP prefix TPA
0
0.2
0.4
0.6
0.8
1
0 0.2 0.4 0.6 0.8 1
Fra
ction o
f clie
nt IP
pre
fix
Coverage in time
1 hr10 min1 min
(b) Client IP prefix TPA
0
0.2
0.4
0.6
0.8
1
0 0.2 0.4 0.6 0.8 1
Frac
tion
ofS
erve
rIP
pref
ix
Coverage in time
1 hr
10 min
1 min
(c) Server IP prefix ChinaVid
0
0.2
0.4
0.6
0.8
1
0 0.2 0.4 0.6 0.8 1
Frac
tion
ofC
lient
IPpr
efix
Coverage in time
1 hr
10 min
1 min
(d) Client IP prefix ChinaVidFigure 3: Inverse CDF of server/client IP prefix coverage.
Similar to Figure 2, Figure 3 shows the inverse CDF of frac-tion of epochs in which each client or server IP prefix (/24)has sufficient samples. We see that ≥ 40% of US server pre-fixes, ≥ 20% of China server IP prefixes, and ≥ 20% of USclient IP prefix have enough sessions in every 1-minute win-dows. (The coverage of China client IP prefixes is low due tothe extremely skewed distribution of the IP addresses withineach IP prefix). Again we see a significant increase by usinglarger windows.
2.2 Problem DefinitionNext, we formally define the inference problem that the ICTMservice needs to solve.
We divide time into discrete epochs with a size |e| onthe order of tens of minutes (as suggested by our coveragemeasurements). The subscript e refers to a specific discreteepoch in which our measurements are made.5 In each epoch,we have client-side video measurements between differentsource and destination pairs. Each source and destinationare mapped to a corresponding “node” in the network topol-ogy map; e.g., an ingress/egress PoP. Let Mm,s,d,e denote ameasurement between source s and destination d in epoche . (There may be many measurements during a given epochfor the same src-dst pair.) Each measurement m has two keyattributes: Bm,s,d,e denotes the total bytes downloaded andTm,s,d,e denotes the average throughput during this epoch.Let Ps,d,e be the route used for traffic between s and d dur-ing the epoch e (obtained from the route measurement en-gine). Each path consists of multiple links; l ∈ P denotesthat this link lies on this path.
There are two quantities we want to infer: (1) the capac-ity of each link Cl and (2) the background load of each linkin a given epoch bg l,e . Formally, the ICTM problem is toestimate the values of the Cl and bg l,e given the Mm,s,d,e
5We expect this time granularity is sufficient for many application-layer control decisions [18].
and Ps,d,e as inputs. Note that while the capacity does notchange across time on the scale of days or weeks, the back-ground load is much more variable. At a high-level, this is atomographic inference problem, where we are inferring hid-den variables based on some observed measurements. Thekey difference is that classical network tomography focuseson delay, loss etc., whereas our focus is on capacity and linkutilization.
There are other ways to formulate an ICTM service thatwe do not consider here. For example, the service couldreport the available bandwidth for a given source-destinationIP pair, without giving the link capacity or link utilization.However, we choose a more extreme formulation to inferper link capacity and utilization, because we can reconstructthese other end-to-end measures with per-link estimates.
2.3 ChallengesCoarse measurement: With video-based measurements,the measured bandwidth between two hosts is more coarse-grained, because the video players run at the application-layer within “sandboxes” that do not have access to packet-level statistics. Thus, the throughput will be measured overa coarser time duration than packet dispersion techniques(e.g., Spruce [24], IGI [15]). Consequently, unlike these ac-tive measurement approaches, we cannot infer the amount ofhidden background traffic.Scale and responsiveness: Typical active measurement plat-forms handle updates from a few (hundreds of) vantage points.In contrast, ICTM has to handle measurements from mil-lions of video viewers, maintain the most up-to-date infor-mation of paths and links, and process a large number ofqueries in near real-time.
3 Link Capacity InferenceIn this section, we sketch an initial algorithm for inferringthe link capacities Cl given historical measurements Mm,s,d,e
3
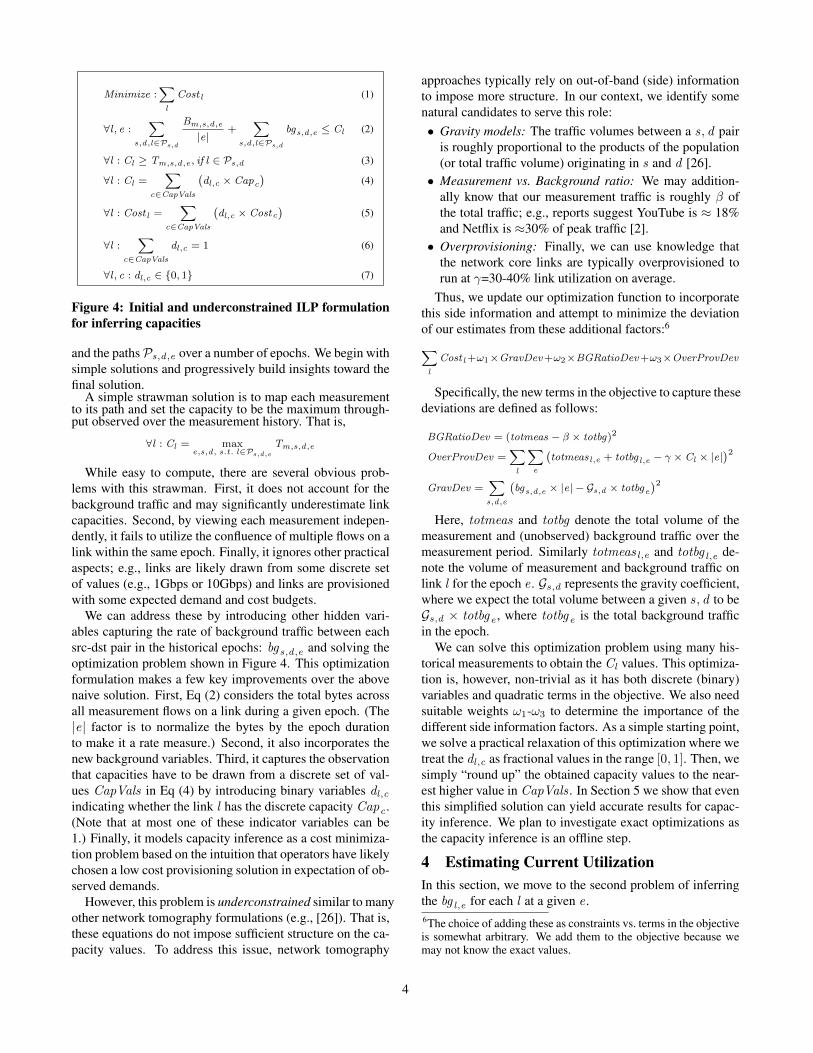
Minimize :∑l
Cost l (1)
∀l , e :∑
s,d,l∈Ps,d
Bm,s,d,e
|e|+
∑s,d,l∈Ps,d
bgs,d,e ≤ Cl (2)
∀l : Cl ≥ Tm,s,d,e , if l ∈ Ps,d (3)
∀l : Cl =∑
c∈CapVals
(dl,c × Capc
)(4)
∀l : Cost l =∑
c∈CapVals
(dl,c × Costc
)(5)
∀l :∑
c∈CapVals
dl,c = 1 (6)
∀l , c : dl,c ∈ {0, 1} (7)
Figure 4: Initial and underconstrained ILP formulationfor inferring capacities
and the pathsPs,d,e over a number of epochs. We begin withsimple solutions and progressively build insights toward thefinal solution.
A simple strawman solution is to map each measurementto its path and set the capacity to be the maximum through-put observed over the measurement history. That is,
∀l : Cl = maxe,s,d, s.t. l∈Ps,d,e
Tm,s,d,e
While easy to compute, there are several obvious prob-lems with this strawman. First, it does not account for thebackground traffic and may significantly underestimate linkcapacities. Second, by viewing each measurement indepen-dently, it fails to utilize the confluence of multiple flows on alink within the same epoch. Finally, it ignores other practicalaspects; e.g., links are likely drawn from some discrete setof values (e.g., 1Gbps or 10Gbps) and links are provisionedwith some expected demand and cost budgets.
We can address these by introducing other hidden vari-ables capturing the rate of background traffic between eachsrc-dst pair in the historical epochs: bgs,d,e and solving theoptimization problem shown in Figure 4. This optimizationformulation makes a few key improvements over the abovenaive solution. First, Eq (2) considers the total bytes acrossall measurement flows on a link during a given epoch. (The|e| factor is to normalize the bytes by the epoch durationto make it a rate measure.) Second, it also incorporates thenew background variables. Third, it captures the observationthat capacities have to be drawn from a discrete set of val-ues CapVals in Eq (4) by introducing binary variables dl,cindicating whether the link l has the discrete capacity Capc .(Note that at most one of these indicator variables can be1.) Finally, it models capacity inference as a cost minimiza-tion problem based on the intuition that operators have likelychosen a low cost provisioning solution in expectation of ob-served demands.
However, this problem is underconstrained similar to manyother network tomography formulations (e.g., [26]). That is,these equations do not impose sufficient structure on the ca-pacity values. To address this issue, network tomography
approaches typically rely on out-of-band (side) informationto impose more structure. In our context, we identify somenatural candidates to serve this role:• Gravity models: The traffic volumes between a s, d pair
is roughly proportional to the products of the population(or total traffic volume) originating in s and d [26].• Measurement vs. Background ratio: We may addition-
ally know that our measurement traffic is roughly β ofthe total traffic; e.g., reports suggest YouTube is ≈ 18%and Netflix is ≈30% of peak traffic [2].• Overprovisioning: Finally, we can use knowledge that
the network core links are typically overprovisioned torun at γ=30-40% link utilization on average.
Thus, we update our optimization function to incorporatethis side information and attempt to minimize the deviationof our estimates from these additional factors:6∑l
Cost l+ω1×GravDev+ω2×BGRatioDev+ω3×OverProvDev
Specifically, the new terms in the objective to capture thesedeviations are defined as follows:
BGRatioDev = (totmeas − β × totbg)2
OverProvDev =∑l
∑e
(totmeas l,e + totbg l,e − γ × Cl × |e|
)2GravDev =
∑s,d,e
(bgs,d,e × |e| − Gs,d × totbge
)2Here, totmeas and totbg denote the total volume of the
measurement and (unobserved) background traffic over themeasurement period. Similarly totmeas l,e and totbg l,e de-note the volume of measurement and background traffic onlink l for the epoch e . Gs,d represents the gravity coefficient,where we expect the total volume between a given s, d to beGs,d × totbge , where totbge is the total background trafficin the epoch.
We can solve this optimization problem using many his-torical measurements to obtain the Cl values. This optimiza-tion is, however, non-trivial as it has both discrete (binary)variables and quadratic terms in the objective. We also needsuitable weights ω1-ω3 to determine the importance of thedifferent side information factors. As a simple starting point,we solve a practical relaxation of this optimization where wetreat the dl,c as fractional values in the range [0, 1]. Then, wesimply “round up” the obtained capacity values to the near-est higher value in CapVals . In Section 5 we show that eventhis simplified solution can yield accurate results for capac-ity inference. We plan to investigate exact optimizations asthe capacity inference is an offline step.
4 Estimating Current UtilizationIn this section, we move to the second problem of inferringthe bg l,e for each l at a given e .6The choice of adding these as constraints vs. terms in the objectiveis somewhat arbitrary. We add them to the objective because wemay not know the exact values.
4
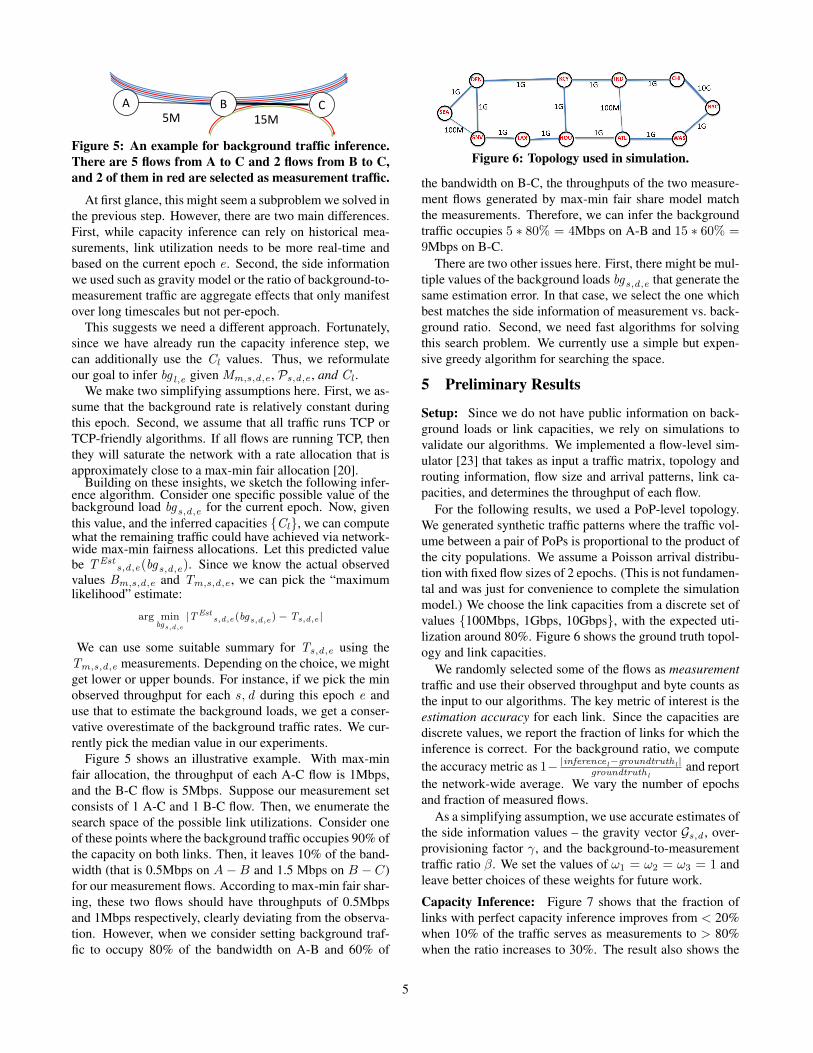
A C 5M 15M
B
Figure 5: An example for background traffic inference.There are 5 flows from A to C and 2 flows from B to C,and 2 of them in red are selected as measurement traffic.
At first glance, this might seem a subproblem we solved inthe previous step. However, there are two main differences.First, while capacity inference can rely on historical mea-surements, link utilization needs to be more real-time andbased on the current epoch e . Second, the side informationwe used such as gravity model or the ratio of background-to-measurement traffic are aggregate effects that only manifestover long timescales but not per-epoch.
This suggests we need a different approach. Fortunately,since we have already run the capacity inference step, wecan additionally use the Cl values. Thus, we reformulateour goal to infer bg l,e given Mm,s,d,e , Ps,d,e , and Cl .
We make two simplifying assumptions here. First, we as-sume that the background rate is relatively constant duringthis epoch. Second, we assume that all traffic runs TCP orTCP-friendly algorithms. If all flows are running TCP, thenthey will saturate the network with a rate allocation that isapproximately close to a max-min fair allocation [20].
Building on these insights, we sketch the following infer-ence algorithm. Consider one specific possible value of thebackground load bgs,d,e for the current epoch. Now, giventhis value, and the inferred capacities {Cl}, we can computewhat the remaining traffic could have achieved via network-wide max-min fairness allocations. Let this predicted valuebe TEst
s,d,e(bgs,d,e). Since we know the actual observedvalues Bm,s,d,e and Tm,s,d,e , we can pick the “maximumlikelihood” estimate:
arg minbgs,d,e
|TEsts,d,e(bgs,d,e)− Ts,d,e |
We can use some suitable summary for Ts,d,e using theTm,s,d,e measurements. Depending on the choice, we mightget lower or upper bounds. For instance, if we pick the minobserved throughput for each s, d during this epoch e anduse that to estimate the background loads, we get a conser-vative overestimate of the background traffic rates. We cur-rently pick the median value in our experiments.
Figure 5 shows an illustrative example. With max-minfair allocation, the throughput of each A-C flow is 1Mbps,and the B-C flow is 5Mbps. Suppose our measurement setconsists of 1 A-C and 1 B-C flow. Then, we enumerate thesearch space of the possible link utilizations. Consider oneof these points where the background traffic occupies 90% ofthe capacity on both links. Then, it leaves 10% of the band-width (that is 0.5Mbps on A−B and 1.5 Mbps on B − C)for our measurement flows. According to max-min fair shar-ing, these two flows should have throughputs of 0.5Mbpsand 1Mbps respectively, clearly deviating from the observa-tion. However, when we consider setting background traf-fic to occupy 80% of the bandwidth on A-B and 60% of
Figure 6: Topology used in simulation.
the bandwidth on B-C, the throughputs of the two measure-ment flows generated by max-min fair share model matchthe measurements. Therefore, we can infer the backgroundtraffic occupies 5 ∗ 80% = 4Mbps on A-B and 15 ∗ 60% =9Mbps on B-C.
There are two other issues here. First, there might be mul-tiple values of the background loads bgs,d,e that generate thesame estimation error. In that case, we select the one whichbest matches the side information of measurement vs. back-ground ratio. Second, we need fast algorithms for solvingthis search problem. We currently use a simple but expen-sive greedy algorithm for searching the space.
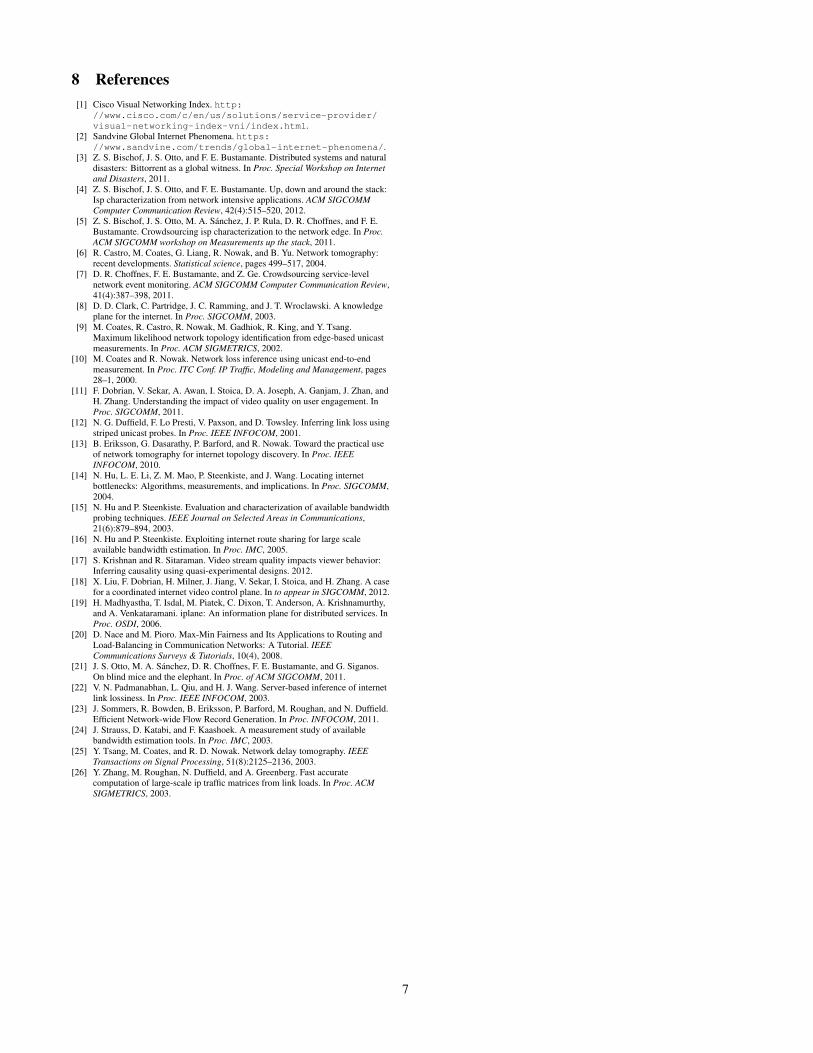
5 Preliminary Results
Setup: Since we do not have public information on back-ground loads or link capacities, we rely on simulations tovalidate our algorithms. We implemented a flow-level sim-ulator [23] that takes as input a traffic matrix, topology androuting information, flow size and arrival patterns, link ca-pacities, and determines the throughput of each flow.
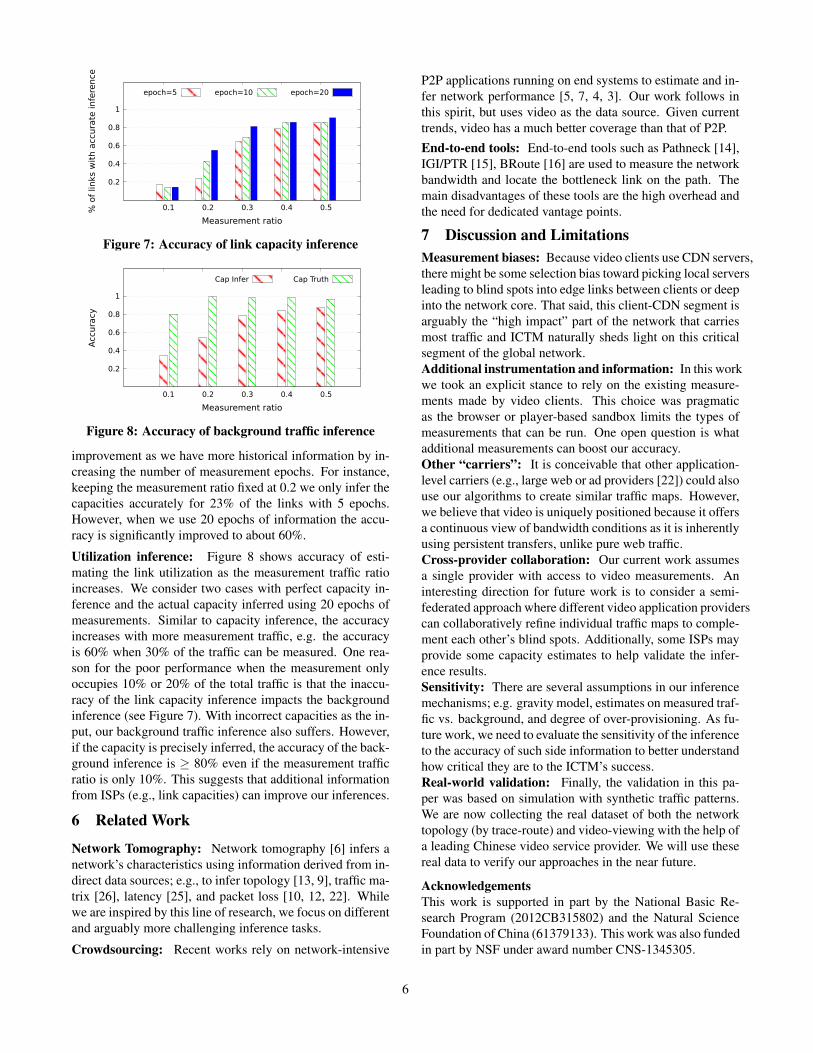
For the following results, we used a PoP-level topology.We generated synthetic traffic patterns where the traffic vol-ume between a pair of PoPs is proportional to the product ofthe city populations. We assume a Poisson arrival distribu-tion with fixed flow sizes of 2 epochs. (This is not fundamen-tal and was just for convenience to complete the simulationmodel.) We choose the link capacities from a discrete set ofvalues {100Mbps, 1Gbps, 10Gbps}, with the expected uti-lization around 80%. Figure 6 shows the ground truth topol-ogy and link capacities.
We randomly selected some of the flows as measurementtraffic and use their observed throughput and byte counts asthe input to our algorithms. The key metric of interest is theestimation accuracy for each link. Since the capacities arediscrete values, we report the fraction of links for which theinference is correct. For the background ratio, we computethe accuracy metric as 1− |inference l−groundtruth l |
groundtruth land report
the network-wide average. We vary the number of epochsand fraction of measured flows.
As a simplifying assumption, we use accurate estimates ofthe side information values – the gravity vector Gs,d , over-provisioning factor γ, and the background-to-measurementtraffic ratio β. We set the values of ω1 = ω2 = ω3 = 1 andleave better choices of these weights for future work.
Capacity Inference: Figure 7 shows that the fraction oflinks with perfect capacity inference improves from < 20%when 10% of the traffic serves as measurements to > 80%when the ratio increases to 30%. The result also shows the
5
0.2
0.4
0.6
0.8
1
0.1 0.2 0.3 0.4 0.5% o
f lin
ks w
ith a
ccura
te infe
rence
Measurement ratio
epoch=5 epoch=10 epoch=20
Figure 7: Accuracy of link capacity inference
0.2
0.4
0.6
0.8
1
0.1 0.2 0.3 0.4 0.5
Acc
ura
cy
Measurement ratio
Cap Infer Cap Truth
Figure 8: Accuracy of background traffic inference
improvement as we have more historical information by in-creasing the number of measurement epochs. For instance,keeping the measurement ratio fixed at 0.2 we only infer thecapacities accurately for 23% of the links with 5 epochs.However, when we use 20 epochs of information the accu-racy is significantly improved to about 60%.
Utilization inference: Figure 8 shows accuracy of esti-mating the link utilization as the measurement traffic ratioincreases. We consider two cases with perfect capacity in-ference and the actual capacity inferred using 20 epochs ofmeasurements. Similar to capacity inference, the accuracyincreases with more measurement traffic, e.g. the accuracyis 60% when 30% of the traffic can be measured. One rea-son for the poor performance when the measurement onlyoccupies 10% or 20% of the total traffic is that the inaccu-racy of the link capacity inference impacts the backgroundinference (see Figure 7). With incorrect capacities as the in-put, our background traffic inference also suffers. However,if the capacity is precisely inferred, the accuracy of the back-ground inference is ≥ 80% even if the measurement trafficratio is only 10%. This suggests that additional informationfrom ISPs (e.g., link capacities) can improve our inferences.
6 Related Work
Network Tomography: Network tomography [6] infers anetwork’s characteristics using information derived from in-direct data sources; e.g., to infer topology [13, 9], traffic ma-trix [26], latency [25], and packet loss [10, 12, 22]. Whilewe are inspired by this line of research, we focus on differentand arguably more challenging inference tasks.
Crowdsourcing: Recent works rely on network-intensive
P2P applications running on end systems to estimate and in-fer network performance [5, 7, 4, 3]. Our work follows inthis spirit, but uses video as the data source. Given currenttrends, video has a much better coverage than that of P2P.End-to-end tools: End-to-end tools such as Pathneck [14],IGI/PTR [15], BRoute [16] are used to measure the networkbandwidth and locate the bottleneck link on the path. Themain disadvantages of these tools are the high overhead andthe need for dedicated vantage points.
7 Discussion and LimitationsMeasurement biases: Because video clients use CDN servers,there might be some selection bias toward picking local serversleading to blind spots into edge links between clients or deepinto the network core. That said, this client-CDN segment isarguably the “high impact” part of the network that carriesmost traffic and ICTM naturally sheds light on this criticalsegment of the global network.Additional instrumentation and information: In this workwe took an explicit stance to rely on the existing measure-ments made by video clients. This choice was pragmaticas the browser or player-based sandbox limits the types ofmeasurements that can be run. One open question is whatadditional measurements can boost our accuracy.Other “carriers”: It is conceivable that other application-level carriers (e.g., large web or ad providers [22]) could alsouse our algorithms to create similar traffic maps. However,we believe that video is uniquely positioned because it offersa continuous view of bandwidth conditions as it is inherentlyusing persistent transfers, unlike pure web traffic.Cross-provider collaboration: Our current work assumesa single provider with access to video measurements. Aninteresting direction for future work is to consider a semi-federated approach where different video application providerscan collaboratively refine individual traffic maps to comple-ment each other’s blind spots. Additionally, some ISPs mayprovide some capacity estimates to help validate the infer-ence results.Sensitivity: There are several assumptions in our inferencemechanisms; e.g. gravity model, estimates on measured traf-fic vs. background, and degree of over-provisioning. As fu-ture work, we need to evaluate the sensitivity of the inferenceto the accuracy of such side information to better understandhow critical they are to the ICTM’s success.Real-world validation: Finally, the validation in this pa-per was based on simulation with synthetic traffic patterns.We are now collecting the real dataset of both the networktopology (by trace-route) and video-viewing with the help ofa leading Chinese video service provider. We will use thesereal data to verify our approaches in the near future.
AcknowledgementsThis work is supported in part by the National Basic Re-search Program (2012CB315802) and the Natural ScienceFoundation of China (61379133). This work was also fundedin part by NSF under award number CNS-1345305.
6
8 References[1] Cisco Visual Networking Index. http:
//www.cisco.com/c/en/us/solutions/service-provider/visual-networking-index-vni/index.html.
[2] Sandvine Global Internet Phenomena. https://www.sandvine.com/trends/global-internet-phenomena/.
[3] Z. S. Bischof, J. S. Otto, and F. E. Bustamante. Distributed systems and naturaldisasters: Bittorrent as a global witness. In Proc. Special Workshop on Internetand Disasters, 2011.
[4] Z. S. Bischof, J. S. Otto, and F. E. Bustamante. Up, down and around the stack:Isp characterization from network intensive applications. ACM SIGCOMMComputer Communication Review, 42(4):515–520, 2012.
[5] Z. S. Bischof, J. S. Otto, M. A. Sanchez, J. P. Rula, D. R. Choffnes, and F. E.Bustamante. Crowdsourcing isp characterization to the network edge. In Proc.ACM SIGCOMM workshop on Measurements up the stack, 2011.
[6] R. Castro, M. Coates, G. Liang, R. Nowak, and B. Yu. Network tomography:recent developments. Statistical science, pages 499–517, 2004.
[7] D. R. Choffnes, F. E. Bustamante, and Z. Ge. Crowdsourcing service-levelnetwork event monitoring. ACM SIGCOMM Computer Communication Review,41(4):387–398, 2011.
[8] D. D. Clark, C. Partridge, J. C. Ramming, and J. T. Wroclawski. A knowledgeplane for the internet. In Proc. SIGCOMM, 2003.
[9] M. Coates, R. Castro, R. Nowak, M. Gadhiok, R. King, and Y. Tsang.Maximum likelihood network topology identification from edge-based unicastmeasurements. In Proc. ACM SIGMETRICS, 2002.
[10] M. Coates and R. Nowak. Network loss inference using unicast end-to-endmeasurement. In Proc. ITC Conf. IP Traffic, Modeling and Management, pages28–1, 2000.
[11] F. Dobrian, V. Sekar, A. Awan, I. Stoica, D. A. Joseph, A. Ganjam, J. Zhan, andH. Zhang. Understanding the impact of video quality on user engagement. InProc. SIGCOMM, 2011.
[12] N. G. Duffield, F. Lo Presti, V. Paxson, and D. Towsley. Inferring link loss usingstriped unicast probes. In Proc. IEEE INFOCOM, 2001.
[13] B. Eriksson, G. Dasarathy, P. Barford, and R. Nowak. Toward the practical useof network tomography for internet topology discovery. In Proc. IEEEINFOCOM, 2010.
[14] N. Hu, L. E. Li, Z. M. Mao, P. Steenkiste, and J. Wang. Locating internetbottlenecks: Algorithms, measurements, and implications. In Proc. SIGCOMM,2004.
[15] N. Hu and P. Steenkiste. Evaluation and characterization of available bandwidthprobing techniques. IEEE Journal on Selected Areas in Communications,21(6):879–894, 2003.
[16] N. Hu and P. Steenkiste. Exploiting internet route sharing for large scaleavailable bandwidth estimation. In Proc. IMC, 2005.
[17] S. Krishnan and R. Sitaraman. Video stream quality impacts viewer behavior:Inferring causality using quasi-experimental designs. 2012.
[18] X. Liu, F. Dobrian, H. Milner, J. Jiang, V. Sekar, I. Stoica, and H. Zhang. A casefor a coordinated internet video control plane. In to appear in SIGCOMM, 2012.
[19] H. Madhyastha, T. Isdal, M. Piatek, C. Dixon, T. Anderson, A. Krishnamurthy,and A. Venkataramani. iplane: An information plane for distributed services. InProc. OSDI, 2006.
[20] D. Nace and M. Pioro. Max-Min Fairness and Its Applications to Routing andLoad-Balancing in Communication Networks: A Tutorial. IEEECommunications Surveys & Tutorials, 10(4), 2008.
[21] J. S. Otto, M. A. Sanchez, D. R. Choffnes, F. E. Bustamante, and G. Siganos.On blind mice and the elephant. In Proc. of ACM SIGCOMM, 2011.
[22] V. N. Padmanabhan, L. Qiu, and H. J. Wang. Server-based inference of internetlink lossiness. In Proc. IEEE INFOCOM, 2003.
[23] J. Sommers, R. Bowden, B. Eriksson, P. Barford, M. Roughan, and N. Duffield.Efficient Network-wide Flow Record Generation. In Proc. INFOCOM, 2011.
[24] J. Strauss, D. Katabi, and F. Kaashoek. A measurement study of availablebandwidth estimation tools. In Proc. IMC, 2003.
[25] Y. Tsang, M. Coates, and R. D. Nowak. Network delay tomography. IEEETransactions on Signal Processing, 51(8):2125–2136, 2003.
[26] Y. Zhang, M. Roughan, N. Duffield, and A. Greenberg. Fast accuratecomputation of large-scale ip traffic matrices from link loads. In Proc. ACMSIGMETRICS, 2003.
7