using the california api stanford universitystatweb.stanford.edu/~rag/api/charter.pdf · charter...
TRANSCRIPT
Charter Schools, D Rogosa 5/02
A Further Examination of Student Progress in Charter Schools Using the California API David Rogosa Stanford University May 2002 1. Introduction and Summary
In their March 2002 report "California Charter Schools Serving Low-SES Students: An Analysis of the Academic Performance Index" Simeon P. Slovacek, Antony J. Kunnan, and Hae-Jin Kim (hereafter SKK) raise and pursue an important issue: in their words to "compare student achievement between California charter schools and California non-charter schools whiletaking students’ socioeconomic status (“SES”) into consideration" (SKK, p.1). SKK deserve commendation for attempting a longitudinal analysis using three years of API data. However, mistakes in the identification ofschools and in the assembly of school data, plus flaws in their data analysis approaches, render the SKK conclusions incorrect. Even if the SKKdata and data analyses had been sound, the strong conclusions expressed in their report (and also in the press coverage of the report) were unwarranted.
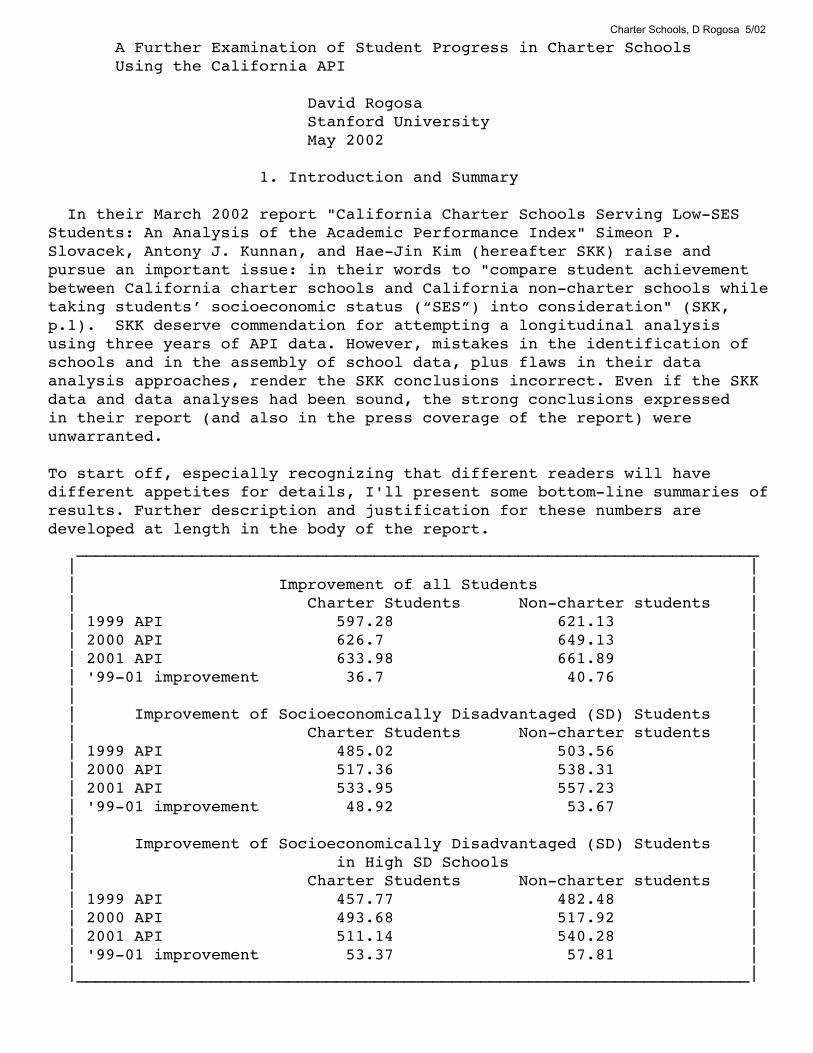
To start off, especially recognizing that different readers will have different appetites for details, I'll present some bottom-line summaries ofresults. Further description and justification for these numbers are developed at length in the body of the report. _______________________________________________________________________ | | | Improvement of all Students | | Charter Students Non-charter students | | 1999 API 597.28 621.13 | | 2000 API 626.7 649.13 | | 2001 API 633.98 661.89 | | '99-01 improvement 36.7 40.76 | | | | Improvement of Socioeconomically Disadvantaged (SD) Students | | Charter Students Non-charter students | | 1999 API 485.02 503.56 | | 2000 API 517.36 538.31 | | 2001 API 533.95 557.23 | | '99-01 improvement 48.92 53.67 | | | | Improvement of Socioeconomically Disadvantaged (SD) Students | | in High SD Schools | | Charter Students Non-charter students | | 1999 API 457.77 482.48 | | 2000 API 493.68 517.92 | | 2001 API 511.14 540.28 | | '99-01 improvement 53.37 57.81 | |______________________________________________________________________|

Charter Schools, D Rogosa 5/02
These summary results indicate that the improvement of students in non-charter California schools exceeds the improvement of students in California charter schools by about 4 points. An appropriate interpretation of a 4 API point difference is: every other student getting an additional item correct on each Stanford 9 test (refer to the original "Interpretive Notes" report, cited below). Thus, in educational terms 4 API points is not that large an amount. Unfortunately, SKK created headlines out of differences smaller than 4 points (sometimes 2 points), and although one wants to be careful not to make a fuss about these rather small differences, it is also important to counter the false conclusions put forth in SKK. Even though I'm writing this report while watching the Kentucky Derby, my inclination is not to focus on the "horse race" aspects of the charter vs non-charter comparisons. However the horse race is what SKK feature. The body of this report contains three main sections. Section 2 "Repairing the SKK Data Set" describes the necessary corrections to the SKK data before the analyses can be conducted. Section 3, "Results from Improved Analyses," describes aggregate student progress by grade-level and subgroups. Section 4, "Reconsidering the SKK Analyses and Results", presents the results of a corrected version of the SKK analyses, and describes the flaws in the SKK analysis strategy that motivated the further analyses in Section 3. The final section, Discussion, contains a point-by-point refutation for the SKK "Summary of Findings" and a recapitulation of the results from the preferred analyses.
API ResourcesPreviously, I've released on the CDE web-site a series of data analysis reports describing the properties of the API and the progress of California schools. Some portions of those reports are relevant to the topics in SKKand this rebuttal. These reports are located at the page: http://www.cde.ca.gov/psaa/apiresearch.htmRogosa, D.R. Interpretive Notes for the Academic Performance Index. California Department of Education, November 2000.Rogosa, D.R. Year 2000 Update: Interpretive Notes for the Academic Performance Index. California Department of Education, October 2001.Rogosa, D.R. Year 2001 Growth Update: Interpretive Notes for the Academic Performance Index. California Department of Education, December 2001. SKK report"California Charter Schools Serving Low-SES Students: An Analysis of the Academic Performance Index" Simeon P. Slovacek, Antony J. Kunnan, and Hae-Jin Kim. March 2002. SKK report available at: http://www.calstatela.edu/academic/ccoe/c_perc/rpt1.pdf

Charter Schools, D Rogosa 5/02
2. Repairing the SKK Data Set As a statistician (and most definitely not an expert on Charter schools)my motivation for looking closely at the SKK analysis was to formulateand illustrate some improved strategies for answering the interesting empirical questions posed by SKK. I have no bias for trying to overturnthe SKK conclusions; instead I was looking to shore up the analysis. Tomy surprise a main methodological lesson here is the most basic: the primacy of scrutiny of the quality and consistency of the data set (perhapsbordering on obsessive).
A. Charter School DataThe starting point is the list of 93 California charter schools suppliedby SKK upon request (and SKK should be commended for their cooperation); ideally, such critical information would be included in the report. The Housecleaning Notes on the following page details the deletions andchanges that needed to be made to the SKK data set. Readers who found the SKK results credible should go through these Housecleaning Notes. The careful (but perhaps imperfect) scrutiny of this data led to deletionof 5 schools, plus assorted corrections to both the API and demographic data of the surviving 88 charter schools from the SKK roster (SKK88).
In addition, 5 California charter schools having API data for the1999-2001 period were identified (and vetted with CDE). These 5 schools are:37683386061956 San Diego City Unified, Memorial Junior High38684786040935 San Franciso Unified, Edison Charter Academy19647336019939 Los Angeles Unified, Westwood Elementary37683386039457 San Diego City Unified, Darnall E-Campus (Elem Char)37681063731023 Escondido Union High, Escondido Charter High
Thus the complete set of charter schools for the analyses is thecorrected SKK88 plus these 5 schools. The listing of the 93 CDS codesplus school-type indicators is given in the Appendix.
B. Non-Charter School DataStart with the set of 7075 California Schools having some API data in the 1999-2001 period. From the CDE California School Directory (located atwww.cde.ca.gov/schooldir) obtain (in March 2002) a list of CDS codesfor 372 active charter schools plus 21 charter schools listed as merged/closed. Remove these 393 CDS codes from the set of 7075 California Schools and select from the remaining schools those having API scores for the 1999-2001 period. This process produces a set of 6592 non-charter schools having API data in both 1999 and 2001.
C. Designation of High SD (Socioeconomically Disadvantaged) Schools. In California's accountability program a student is classified asSocioeconomically Disadvantaged (SD) if either: 1) Neither of the pupil's parents has received a high school diploma OR2) The pupil participates in the free or reduced price lunch program.

Charter Schools, D Rogosa 5/02
The High SD subset of schools is composed of schools having at least 50%of students designated as SD in at least 2 years in the 1999-2001 period.As seen from Housecleaning Notes, a multiple year requirement is helpfulin avoiding the effects of data errors or anomalies. SKK use a portionof the SD designation, participation in free or reduced price lunch program, at single point in time, 2001, to obtain their low-SES schools.The Housecleaning Notes also include the corrections to this "Meals" variable that affect SKK designations into their subset of low-SES schools.

Charter Schools, D Rogosa 5/02
Housecleaning Notes1. delete Soledad Enrichment Action (CDS 19101991996008) because the school has no 2001 data. As Soledad is a very low scoring school (API_99 = 297) inclusion in the 1999 but not 2001 mean-of-school-means distorts the overall comparison of charter improvement by about 3 points.2. delete Elk Grove Charter (CDS 34673146112254) as no 1999 data available. In the SKK report 1999 data actually was taken from a different school-- Elk Grove Elementary (CDS 34673146033047) and then combined with 2000 and 2001 data from Elk Grove Charter to produce the very odd 3-year score listing: 745 531 546. (Elk Grove Elementary CDS 34673146033047 had year 2000 and 2001 scores 806, 829.)3. delete Mare Island Technology Academy (CDS 48705816116255 grades 6-8). Scores used by SKK actually are data from Mare Island Elementary (CDS 48705816051510 grades 2-5)4. delete New Hope Charter (CDS 39686193930435) which does not have 1999 data. SKK use 1999 score from New Hope Elementary (CDS 39686196042428) combined with 2000 and 2001 scores from New Hope Charter. New Hope Elementary has scores (573 564 574); New Hope Charter has 2000 and 2001 scores (666 662).5. correct the 1999 API score for Westside Elementary (Char) (CDS 34674056112643). Transcription error for 1999 score in SKK; correct 1999 score is 748. SKK use a 1999 score of 648 which is the 1999 score for Westside Elementary (CDS 34674056033633, not charter).6. correct the demographic "Meals" designation for Charter Learning (CDS 41690216112213). Charter Learning has API above 800 all three years, with over 2/3 parents listed as college grads, has 80% of students white and has by CDE reports percent Meals equal 0 in 1999 and 2000. Because the CDE report did have percent Meals 99 for 2001, SKK classified the school as disadvantaged. These facts appeared so incongruous to me that I asked CDE to check the demographic data and subsequently the school reported percent Meals is actually 1, not 99. Thus this school should not be included in the disadvantaged collection. This sort of problem argues for using multiple years of data for any labeling of schools on demographics.7. correct the demographic "Meals" designation Edison-McNair Academy in East Palo Alto (CDS 41689996044333). McNair Meals was 100% in year 2000 and 82% in 1999 but CDE database reported only 9% in 2001, which is the value used by SKK in designating this school as non-disadvantaged. Followup from CDE indicated that the Meals measure should be changed from 9% to 75% in '01; thus Edison-McNair Academy is properly included in the disadvantaged grouping. Another example of the importance of using multiple years for designating/classifying schools.8. delete Hickman Elementary (CDS 50711006052559). For 2001 API growth reporting this school has flag 11 (significant demographic change) and thus no official API score. Therefore I chose to delete it from the analysis. The three years of API scores-- 654 720 695-- used by SKK are numerically correct.9. Year 2000 data is missing in four of the SKK charter schools. SKK, in reporting year 2000 mean-of-school-means, imputed the missing data by filling in the 1999 scores instead of simply treating those scores as missing. As year 2000 means are primarily used only for display in SKK this anomaly in the presentation is of cosmetic import. My tables treat missing as missing.

Charter Schools, D Rogosa 5/02
3. Results from Improved Analyses: Description of Student Improvement in Charter and non-Charter Schools
The main results of the analyses are displayed in Exhibits 1-4 andFigure 1. Each Exhibit displays results for different groups of students: Exhibit 1: all students (in 93 charter schools and 6592 non-charter schools) Exhibit 2: Socioeconomically Disadvantaged (SD) students (in 93 charter schools and 6592 non-charter schools) Exhibit 3: Socioeconomically Disadvantaged (SD) students in the subset of High SD schools (41 charter schools and 3189 non-charter schools) Exhibit 4: all students in the subset of High SD schools (41 charter schools and 3189 non-charter schools) As noted before, a student is classified as SD by CDE if neither of the pupil's parents has received a high school diploma or the pupil participates in the free-or-reduced-price lunch program. In this reporta school is classified as High SD if at least half of it's students are SDin at least 2 years of the 1999-2001 period. Exhibits 1-3 reflect a logical progression of conditioning: start withall students in Exhibit 1, then refine to SD students in Exhibit 2,then refine further to SD students in the subset of schools that areclassified as High SD in Exhibit 3. Exhibit 4 provides only an indirect look at the progress of low-SES students, as High SD schools may containup to 50% non-disadvantaged students. Exhibit 4 is included because itcorresponds to the SES breakdown attempted by in SKK.
Each Exhibit contains 3 tables. The bottom table "Complete Grade-by-Grade Display" displays an API score at each grade level and at each year for students in charter and non-charter schools. Also, the right-hand columnsshow the number of students at each grade level for each year. For example, the "Complete Grade-by-Grade Display" in Exhibit 1 shows a Charter Student Grade 2 1999 API score of 585 (computed using the data from the 5319 Grade 2 charter school students as one large school). The top table "Grade-by-Grade Improvement" is derived from the "Complete Grade-by-Grade Display" by taking the difference between the 2001 and 1999 API scores.The middle table "Create One Large School Table" is my best attempt at summary. The grade-by-grade displays are aggregated to the stated gradeinterval: e.g., all students with grades 2-11, or some version of Elementary School students using grade intervals of 2-6 or 2-8.
Why display grade-by-grade results or collections of grades (as in the Create One Large School tables)? Two interrelated reasons: (i) that charter schools often have an unconventional grade span or distribution, and so breaking out grade levels allows clearer comparisons with non-charter schools; (ii) analyses in the Interpretive Notes series have shown much larger API improvement for the lower grade levels (see Year 2000 Update and Year 2001 Growth reports). The collections of grades (as in the Create One Large School tables) are useful (even necessary) to smooth uneven results in the Charter Schools over grade levels. But the grade-by-grade

Charter Schools, D Rogosa 5/02
numbers are interesting, especially if one is careful not to overinterpret results based on relatively small amounts of data. In particular, it's important to note that for the subset of charter schools classified as High SD (Exhibits 3 and 4) only 2 schools contribute grade 10 and 11 students (98% of grade 11 from one school), 3 schools contribute grade 9 students, and although 11 schools contribute grade 8 students nearly 90% of those grade 8 students are from three schools. Therefore, the combinations over grade levels in the Create One Large School tables are more useful summaries.
Summary of results, Exhibits 1-3. Grade-by-Grade Improvement is strong in the lower grades, but for charter students improvement is uneven across upper grades in each of the breakdowns. The non-charter students show greater improvement in 7 of the 10 grades in each exhibit. The Create One Large School Comparisons in Exhibits 1 and 2 show greater improvement for non-Charter students than for Charter students in all configurations except for the grade 9-11 big school. In Exhibit 3, SD students in High SD schools, the grade 2-8 and grade 2-11 (all students) configurations show greater improvement for non-charter students by the 4-to-5 point margin seen in the other breakdowns.
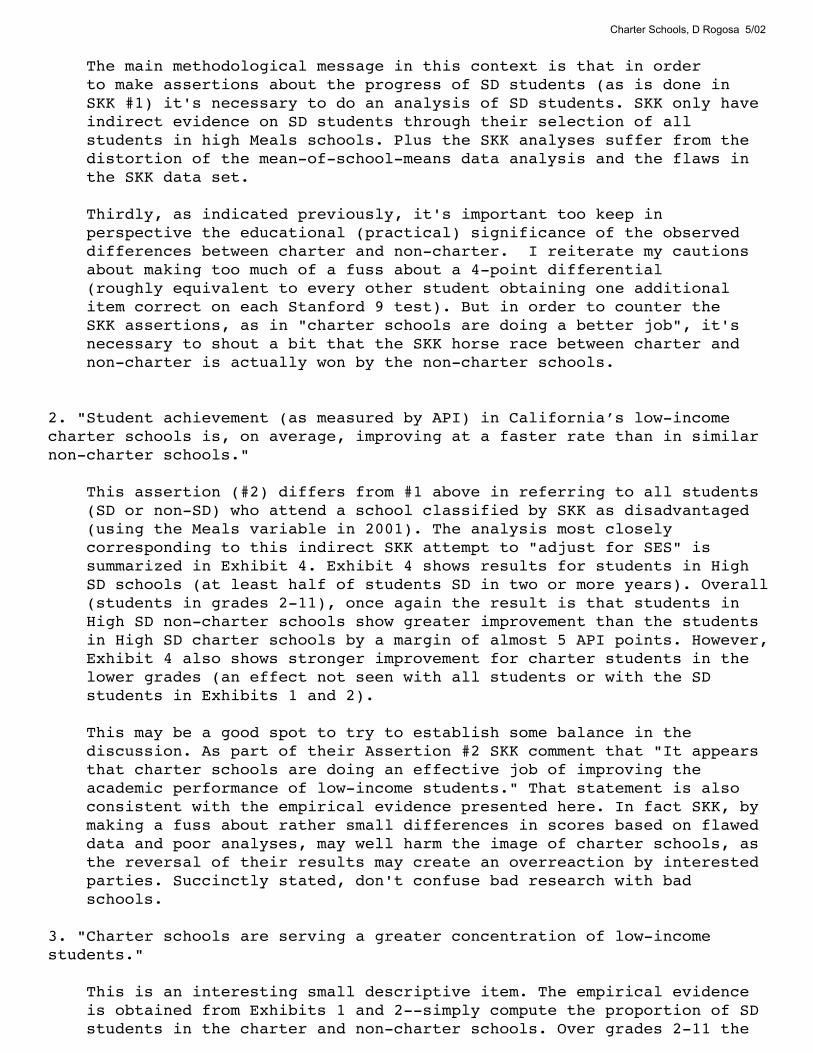
Figure 1 attempts to provide some perspective by showing the considerableimprovement over the 3 years by both charter and non-charter students,especially in comparison to the differential in improvement (the SKK horserace). The API scores for the three groups--All Students, SD Students, SD Students in High SD Schools--conform in descending order to the order of listing. And within each grouping of students, charter school students (in red) have lower scores than non-charter students (in black). A visualchallenge in Figure 1 is produced because the scores for SD students incharter schools are nearly identical to SD students in High SD non-charterschools.
Comparing Cohorts. Exhibits 1-4 provide comparisons of repeated cross sections (e.g. 3rd graders in 1999 compared with 3rd graders in 2001). It's also fun to augment those comparisons by tracing (rough) cohorts over time. Cohorts (and their sizes) can be traced by following diagonals in the Complete Grade-by-Grade Display at the bottom of each Exhibit. Table 1 organizes the grade-by-year results into cohort summaries. The upper half shows results for all students and the lower half for SD students. The "grade-by-grade cohort improvement" displays the difference between 2001 API and 1999 API scores for the cohort beginning in 1999 in the designated grade. For example, charter students in grade 2 in 1999 are in grade 4 in 2001, and the table value for all charter students of 46.5 for 1999 Grade 2 is obtained from Exhibit 1 as 631.5 - 585. As with Exhibits 1-4 the charter students show irregular improvement in the upper grades, and it's important to keep in mind that a small number of schools are contributing those students.
Perhaps of most use are the "create one large cohort" comparisons; these include students in grades 2-6 in 1999 and grades 4-8 in 2001. The improvement horse race yields the pattern of results seen previously. For all students, the charter cohort improvement of 41.7 is less than the non-charter improvement of 45.02, and for the SD students the charter cohort

Charter Schools, D Rogosa 5/02
improvement of 44.83 is less than non-charter improvement of 49.57. But as I cautioned previously, a 3 or 5 point differential is not that large (even though SKK made strong assertions based on smaller differentials).

Charter Schools, D Rogosa 5/02
Exhibit 1 All Students in Charter and Non-charter Schools
Grade-by-Grade 1999-2001 Improvement TableGrade Charter Students Non-charter students 2 64.75 57.75 3 67.88 69.25 4 58.62 62.62 5 41.62 50.62 6 27.5 42.12 7 -2.38 33.5 8 -5. 25.62 9 19.75 23.38 10 32.75 14.12 11 14. 12.88
Create One Large School TableGrades Included 1999 API 2001 API '99-01 improvement2-6 Charter Students 587.92 641.28 53.36 Non-charter students 620.27 676.71 56.44 2-8 Charter Students 597.42 637.42 40. Non-charter students 622.41 671.52 49.11 9-11 Charter Students 596.63 618.93 22.3 Non-charter students 617.32 634.48 17.16 2-11 Charter Students 597.28 633.98 36.7 Non-charter students 621.13 661.89 40.76
Complete Grade-by-Grade DisplayCharter Students: API Grade-by-Grade Number of StudentsGrade API_99 API_2k API_01 N_99 N_2k N_012 585 645 649.75 5319 4788 5271 3 590.75 624.625 658.625 5482 5091 5198 4 572.875 612 631.5 5224 5250 5382 5 577.75 609.875 619.375 5065 4828 5207 6 621.5 641.75 649 3877 3876 4125 7 629.75 643.75 627.375 3850 3139 3891 8 627.375 642.125 622.375 3762 3194 3864 9 592.625 631.5 612.375 2655 2358 3041 10 575.5 584.875 608.25 2672 2365 2517 11 628.625 630.625 642.625 2098 1955 1976 Non-Charter Students: API Grade-by-Grade Number of Students Grade API_99 API_2k API_01 N_99 N_2k N_01 2 627 673.25 684.75 390590 368007 3818783 619.625 665.625 688.875 404587 381499 3802804 606.125 646.25 668.75 385580 385589 3882455 609.375 639 660 381846 370207 3948226 640 666.375 682.125 367052 358948 3677267 625.125 646.625 658.625 355534 349187 3629528 631.125 650 656.75 363705 347953 3551879 618.375 637.875 641.75 298473 321195 33510810 594.125 605.125 608.25 320822 310990 31828011 643.375 654.25 656.25 273481 269394 271594

Charter Schools, D Rogosa 5/02
Exhibit 2 SD Students in Charter and Non-charter Schools
Grade-by-Grade 1999-2001 Improvement TableGrade Charter Students Non-charter students 2 81.38 73.5 3 74.88 85.69 4 74.69 77.62 5 57.12 62.06 6 30.5 51. 7 -1.12 40.75 8 -23.25 32.06 9 24.06 24.5 10 38. 13.5 11 18.62 12.62 Create One Large School TableGrades Included 1999 API 2001 API '99-01 improvement2-6 Charter Students 479.12 545.14 66.02 Non-charter students 506.14 576.43 70.3 2-8 Charter Students 484.92 537.17 52.25 Non-charter students 505.73 567.94 62.21 9-11 Charter Students 485.69 512.38 26.69 Non-charter students 494.4 512.57 18.17 2-11 Charter Students 485.02 533.95 48.92 Non-charter students 503.56 557.23 53.67
Complete Grade-by-Grade DisplaySD Charter Students: API Grade-by-Grade Number of SD Students Grade API_99 API_2k API_01 N_99 N_2k N_01 2 480 546.875 561.375 2775 2817 32613 487.5 520.875 562.375 2813 3051 30154 454.563 501.5 529.25 2608 3138 31255 466.125 489.375 523.25 2532 2769 30686 520.25 535.5 550.75 1724 1972 21207 510.563 530.375 509.438 1341 1369 18108 519 517.625 495.75 1111 1210 15939 486.188 527.375 510.25 970 955 136710 458.625 473.563 496.625 787 719 800 11 523.25 519.875 541.875 554 538 526 SD Non-Charter Students: API Grade-by-Grade Number of SD Students Grade API_99 API_2k API_01 N_99 N_2k N_01 2 521 574.25 594.5 191365 212006 2258183 508.813 565.5 594.5 195846 218405 2177064 487 534.25 564.625 183265 214564 2197955 490.813 524.5 552.875 178866 200340 2163826 523.75 552.875 574.75 163475 186470 1909547 501.5 526.375 542.25 144698 170407 1758218 507.438 529.5 539.5 138461 157050 1610849 505.75 527.25 530.25 105026 132388 13454610 462.813 474.5 476.313 100232 113797 11390511 519.625 532.75 532.25 78228 89274 89002

Charter Schools, D Rogosa 5/02
Exhibit 3 SD Students in High SD Charter and Non-charter Schools
Grade-by-Grade 1999-2001 Improvement TableGrade Charter Students Non-charter students 2 82.12 75.75 3 83.12 89.12 4 83.5 80.06 5 63.25 63.25 6 45.81 49.88 7 -5.12 40.25 8 -40.69 31.44 9 3.62 24.5 10 -0.56 14.94 11 -29.56 13.19 Create One Large School TableGrades Included 1999 API 2001 API '99-01 improvement2-6 Charter Students 452.97 526.67 73.69 Non-charter students 484.58 556.9 72.31 2-8 Charter Students 458.27 517.37 59.1 Non-charter students 483.67 548.08 64.4 9-11 Charter Students 453.36 450.78 -2.58 Non-charter students 475.5 494.25 18.75 2-11 Charter Students 457.77 511.14 53.37 Non-charter students 482.48 540.28 57.81 Complete Grade-by-Grade Display SD Charter Students in High SD schools Grade API_99 API_2k API_01 N_99 N_2k N_01 2 459.875 527.25 542 2355 2423 27953 463.625 505 546.75 2338 2630 25964 431.5 479.625 515 2151 2562 26435 439 474.188 502.25 2054 2272 25586 479.813 507.375 525.625 1257 1421 16127 482.125 501.375 477 934 855 13008 502.563 488.563 461.875 712 702 10989 459.938 463.875 463.563 637 585 854 10 413.875 428.125 413.313 418 415 389 11 494.125 465.875 464.563 302 308 265 SD Non-Charter Students in High SD schoolsGrade API_99 API_2k API_01 N_99 N_2k N_01 2 502.375 554.875 578.125 158764 174449 1882393 488.125 545.375 577.25 162226 178742 1789274 463.813 511.25 543.875 150265 174966 1801855 469.25 502 532.5 146826 162233 1767466 500.25 527.75 550.125 125908 141190 1447237 476.375 498.688 516.625 102984 120236 1250798 484.438 504.5 515.875 99355 111274 1157099 484.625 505.75 509.125 62033 74248 76229 10 443.188 451.438 458.125 56681 62333 62930 11 504.438 515 517.625 43732 47811 48761

Charter Schools, D Rogosa 5/02
Exhibit 4 All Students in High SD Charter and Non-charter Schools
Grade-by-Grade 1999-2001 Improvement TableGrade Charter Students Non-charter students 2 80.81 68.12 3 85.75 82. 4 79.69 74. 5 63. 57.5 6 31. 46.88 7 -17.69 38.12 8 -32.12 27.5 9 -9.19 24.69 10 -0.25 15.31 11 -27.44 11.88
Create One Large School TableGrades Included 1999 API 2001 API '99-01 improvement2-6 Charter Students 478.97 549.3 70.33 Non-charter students 521.17 587.26 66.09 2-8 Charter Students 486.91 540.28 53.36 Non-charter students 520.77 579.07 58.31 9-11 Charter Students 459.87 449.83 -10.04 Non-charter students 505.08 523.23 18.15 2-11 Charter Students 483.88 531.03 47.14 Non-charter students 518.31 570.2 51.88
Complete Grade-by-Grade Display Charter Students in High SD schools Grade API_99 API_2k API_01 N_99 N_2k N_01 2 478.688 548.625 559.5 3132 2860 31703 483.625 524.25 569.375 3127 3057 30444 456.688 503.75 536.375 2887 2996 30955 462.625 503.188 525.625 2794 2700 30336 527 548.75 558 2006 1995 2116 7 520.125 531.125 502.438 1507 1260 17218 531.875 530.875 499.75 1350 1191 16149 470.563 459.75 461.375 969 741 103110 413 421.375 412.75 637 606 562 11 497.875 464.375 470.438 513 462 434 Non-Charter Students in High SD schools Grade API_99 API_2k API_01 N_99 N_2k N_01 2 536.75 586 604.875 226063 213110 2268413 523.875 576.375 605.875 231727 218744 2187284 501.75 546 575.75 216061 216739 2211435 507.75 538.25 565.25 212194 204129 2200556 536.75 563.75 583.625 186026 180892 1856467 513.75 536.625 551.875 159056 159069 1665618 525 543 552.5 161030 154269 1600529 509.063 532 533.75 94763 100939 10390010 474.813 483.25 490.125 90642 88329 89421 11 537.625 548 549.5 72725 70467 71079

1999 2000 2001Y
500
550
600
650
700API Grades 2−11 Big School API Scores
SD students
All students
Figure 1. Charter (red) and non-Charter (black) API scores for All Students, SD Students, and SD Students in High SD Schools
SD in High SD

Charter Schools, D Rogosa 5/02
Table 1: Cohort Summaries Students from Exhibit 1 (all students) Grade-by-Grade 1999-2001 Cohort Improvement Table 1999 Grade Charter Students Non-charter students 2 46.5 57.75 3 28.62 69.25 4 76.12 62.62 5 49.62 50.62 6 0.88 42.12 7 -17.38 33.5 8 -19.12 25.62 9 50. 23.38
Create One Large School Cohort, 1999 Grades 2-6
Year Charter Students Non-charter students 1999 587.92 620.27 2000 624.13 652.79 2001 629.62 665.29
Students from Exhibit 2 (SD students) Grade-by-Grade 1999-2001 Cohort Improvement Table 1999 Grade Charter Students Non-charter students 2 49.25 73.5 3 35.75 85.69 4 96.19 77.62 5 43.31 62.06 6 -24.5 51. 7 -0.31 40.75 8 -22.38 32.06 9 55.69 24.5
Create One Large School Cohort, 1999 Grades 2-6
Year Charter Students Non-charter students 1999 479.12 506.14 2000 512.24 541.32 2001 523.95 555.71
Charter Schools, D Rogosa 5/02
4. Reconsidering the SKK Analyses and Results
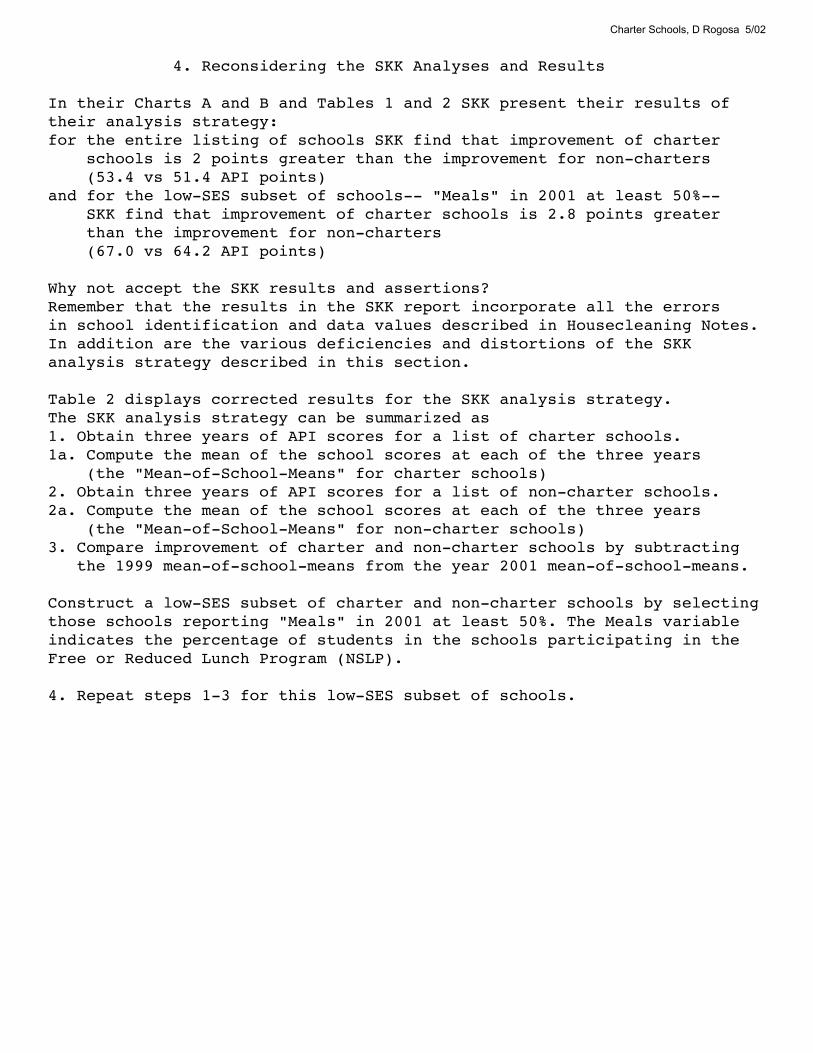
In their Charts A and B and Tables 1 and 2 SKK present their results of their analysis strategy: for the entire listing of schools SKK find that improvement of charter schools is 2 points greater than the improvement for non-charters (53.4 vs 51.4 API points) and for the low-SES subset of schools-- "Meals" in 2001 at least 50%-- SKK find that improvement of charter schools is 2.8 points greater than the improvement for non-charters (67.0 vs 64.2 API points) Why not accept the SKK results and assertions?Remember that the results in the SKK report incorporate all the errors in school identification and data values described in Housecleaning Notes.In addition are the various deficiencies and distortions of the SKK analysis strategy described in this section.
Table 2 displays corrected results for the SKK analysis strategy.The SKK analysis strategy can be summarized as1. Obtain three years of API scores for a list of charter schools.1a. Compute the mean of the school scores at each of the three years (the "Mean-of-School-Means" for charter schools)2. Obtain three years of API scores for a list of non-charter schools. 2a. Compute the mean of the school scores at each of the three years (the "Mean-of-School-Means" for non-charter schools)3. Compare improvement of charter and non-charter schools by subtracting the 1999 mean-of-school-means from the year 2001 mean-of-school-means.
Construct a low-SES subset of charter and non-charter schools by selecting those schools reporting "Meals" in 2001 at least 50%. The Meals variable indicates the percentage of students in the schools participating in the Free or Reduced Lunch Program (NSLP).
4. Repeat steps 1-3 for this low-SES subset of schools.

Charter Schools, D Rogosa 5/02
Table 2 SKK-style Mean-of-School-Means Tables All Schools SKK88 non-Charter DRR93 API API API (n) (n) (n) 1999 610.3 631.17 609.9 (88) (6592) (93) 2000 643.2 665.1 644.0 (84) (6515) (88) 2001 661.6 681.07 658.9 (88) (6592) (93) 1999-2001 Increase in Mean-of-School-Means 51.3 49.9 49.0
Schools with Meals in 2001 at least 50%
SKK88 non-Charter DRR93 API API API (n) (n) (n) 1999 493.6 530.67 494.5 (42) (3131) (45) 2000 537.6 570.50 538.4 (41) (3070) (43) 2001 560.3 592.40 556.4 (42) (3131) (45) 1999-2001 Increase in Mean-of-School-Means 66.70 61.73 61.90
Table 2 notes n is number of non-missing schools SKK88 is the corrected list of charter schools used by SKK deleting inappropriate data and correcting mistakes DRR93 is our best charter list (the corrected SKK88 plus the 5 additional charters subsequently identified)---------------------------------------------------------------------------

Charter Schools, D Rogosa 5/02
The mean-of-school-means analysis for the complete set of charter schoolsis basically a draw for the corrected data--improvement for the non-Charterschools is within a point of the DRR93 set of charter schools.
Table 2 corrects the following problems with the SKK analysis and report.
1. Data errors etc for the Charter School data from Housecleaning Notes.
2. Identification of non-charter schools in 2001. For their 2001 non- Charter mean-of-school-means, SKK include a number of schools not included in the 1999 mean-of-school-means. Consistency would dictate that the requirements for the Charter schools of having data for the 1999-2001 period also be imposed to the non-charter group. The Table 2 mean-of-school-means includes only schools having data for the 1999- 2001 period. This peculiar action by SKK, which results in about a 3 point inflation of their year 2001 non-charter mean-of-school means is "justified" by a footnote following their Table 1 which seems to indicate that SKK were unable to merge data files over the 3-year period, instead using piecewise 2-year links.
3. Exaggerated interpretation of small differences and distortions of "percent growth". SKK go further astray in reexpressing the charter vs non-charter improvement horse race in terms of "percent growth", computed as 100*(API_01 - API_99)/API_99. The SKK rationale appears to be that charter schools have a lower mean-of-school-means than non-charter. But, SKK misunderstand or overlook one of the most important features of California API data--that improvement is greatest for the lower-scoring schools. Refer to the Year 2000 or to Year 2001 Growth Interpretive Notes reports to see this pattern is ubiquitous. In part, this pattern is a (deliberate) result of the construction of the API index. Thus a lower-scoring collection of schools (chosen at random) would be expected to achieve larger improvement. Consequently the SKK percent growth further distorts (rather than improves) the comparison by moving the numbers in the wrong direction. (One cannot resist noting the exaggerated nature of SKK graphical displays, as in their Chart B; never has the difference between 11.9 and 13.1 loomed so large.)
But, and it is a big "but", my Table 2 still does not represent a good analysis, mainly because of the mean-of-school-means strategy and the inadequate school-level SES breakdown using Meals in 2001. Among thedeficiencies not mended in Table 2:
1. Differences in School Sizes.In a mean-of-school-means analysis students in smaller schools contribute more to the result than students in larger schools. For the collection of Charter Schools, the displays of school size below indicates the range of school sizes are a factor of 20 or more. Consequently, one student in the smallest schools contributes as much to the mean-of-school-means result as a classroom of students in the largest schools.

Charter Schools, D Rogosa 5/02
-----------------------------------------------------------------Descriptive Statistics: N_99, N_01 for 93 Charter Schools Variable N Median Q1 Q3 Minimum Maximum N_99 93 351.0 205.0 488.0 100.0 1920.0 N_01 93 361.0 190.5 527.5 58.0 1799.0 -----------------------------------------------------------------Dotplot: N_99, N_01 for 93 Charter Schools in DRR93 : : : : : : . :.:::. : : : :::::: : :::... ::::::.::::::::: .. . . . .. . . . +---------+---------+---------+---------+---------+-------N_99 . ::. : . ::::.. ::: : ::::::: ::: :. .:::::::::::::::.. . . . . . . ... . +---------+---------+---------+---------+---------+-------N_01 0 350 700 1050 1400 1750-----------------------------------------------------------------
2. School type and grade level distribution.
A related distortion of results from using intact schools in the mean-of-school-means analysis results from a larger API improvement for the lower grade levels (see Interpretive Notes series Year 2000 Update and Year 2001 Growth reports). Thus a sample of schools with the lower grades over represented will tend to show more improvement than a statewide census. That's one reason to break student data down into grade levels as in done in my Exhibits 1-4 or to compare equivalent collections of grade levels (as in the Create One Large School tables). To illustrate that this concern is relevant in these data, refer to the display below. For this collection of Charter schools, their students are over-represented in the lower grades and under- represented in the upper-grades relative to the (large) non-Charter students.-------------------------------------------------------------------------- Proportion of Students at Each Grade LevelGrade Charter 1999 Charter 2001 Non-Charter 1999 Non-Charter 2001 2 0.133 0.130 0.110 0.107 3 0.137 0.128 0.114 0.107 4 0.131 0.133 0.109 0.109 5 0.127 0.129 0.108 0.111 6 0.097 0.101 0.104 0.103 7 0.096 0.096 0.100 0.102 8 0.094 0.095 0.103 0.010 9 0.066 0.075 0.084 0.094 10 0.067 0.062 0.091 0.089 11 0.052 0.049 0.077 0.076 -------------------------------------------------------------------------- This difference between the grade distributions will also affect a summary such as my grade 2-11 big school, and this motivates the narrower collections of grades, such as the grades 2-6 or grades 2-8 summaries shown
Charter Schools, D Rogosa 5/02
in Exhibits 1-3.
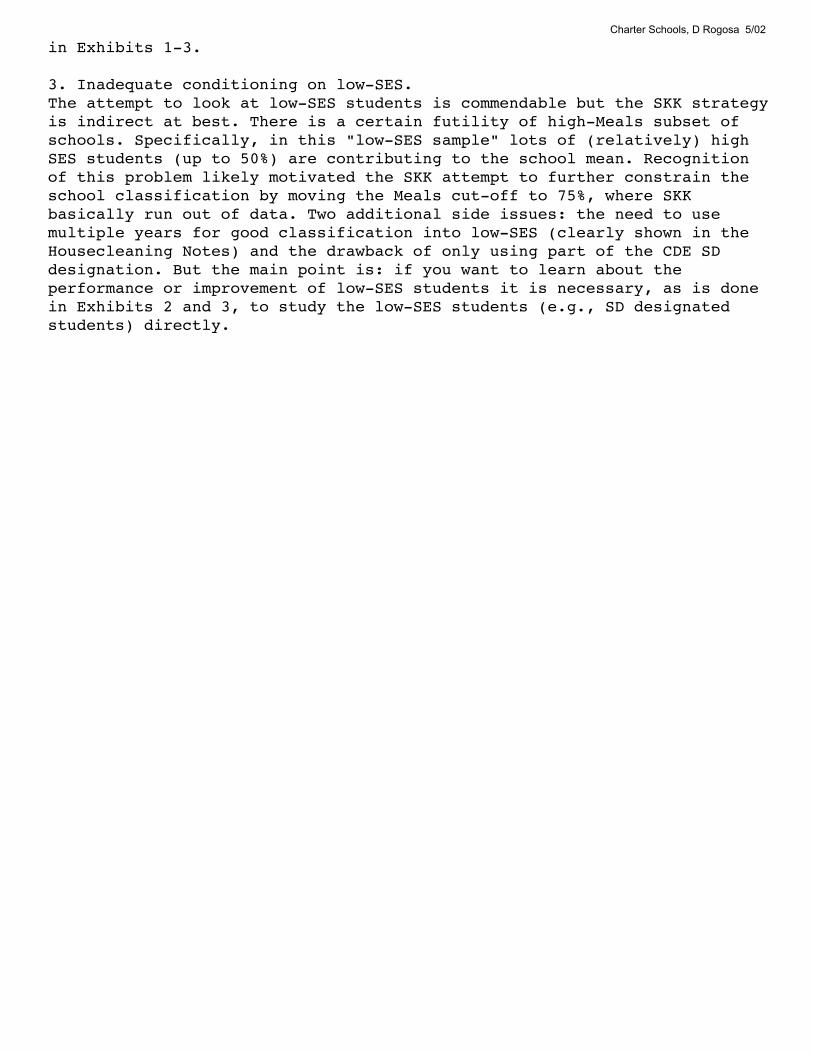
3. Inadequate conditioning on low-SES. The attempt to look at low-SES students is commendable but the SKK strategy is indirect at best. There is a certain futility of high-Meals subset of schools. Specifically, in this "low-SES sample" lots of (relatively) high SES students (up to 50%) are contributing to the school mean. Recognition of this problem likely motivated the SKK attempt to further constrain the school classification by moving the Meals cut-off to 75%, where SKK basically run out of data. Two additional side issues: the need to use multiple years for good classification into low-SES (clearly shown in the Housecleaning Notes) and the drawback of only using part of the CDE SD designation. But the main point is: if you want to learn about the performance or improvement of low-SES students it is necessary, as is done in Exhibits 2 and 3, to study the low-SES students (e.g., SD designated students) directly.
Charter Schools, D Rogosa 5/02
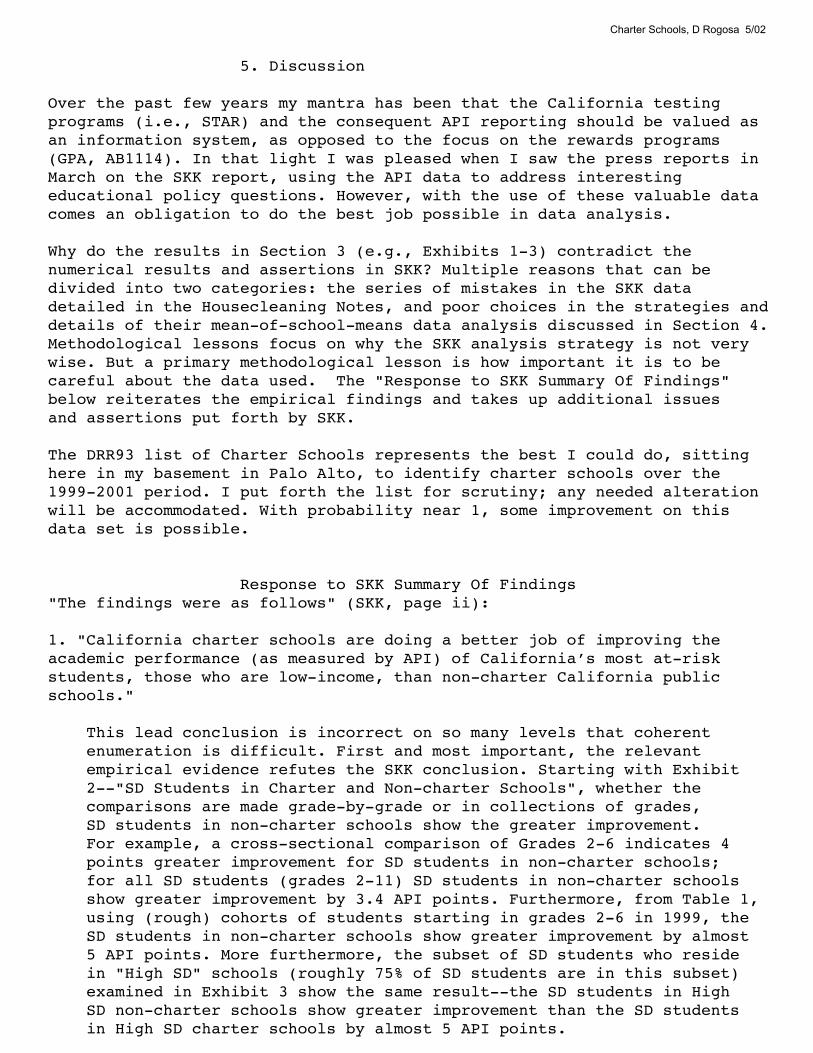
5. Discussion
Over the past few years my mantra has been that the California testing programs (i.e., STAR) and the consequent API reporting should be valued as an information system, as opposed to the focus on the rewards programs (GPA, AB1114). In that light I was pleased when I saw the press reports in March on the SKK report, using the API data to address interesting educational policy questions. However, with the use of these valuable data comes an obligation to do the best job possible in data analysis.
Why do the results in Section 3 (e.g., Exhibits 1-3) contradict the numerical results and assertions in SKK? Multiple reasons that can be divided into two categories: the series of mistakes in the SKK data detailed in the Housecleaning Notes, and poor choices in the strategies and details of their mean-of-school-means data analysis discussed in Section 4.Methodological lessons focus on why the SKK analysis strategy is not very wise. But a primary methodological lesson is how important it is to be careful about the data used. The "Response to SKK Summary Of Findings"below reiterates the empirical findings and takes up additional issuesand assertions put forth by SKK.
The DRR93 list of Charter Schools represents the best I could do, sitting here in my basement in Palo Alto, to identify charter schools over the 1999-2001 period. I put forth the list for scrutiny; any needed alteration will be accommodated. With probability near 1, some improvement on this data set is possible.
Response to SKK Summary Of Findings"The findings were as follows" (SKK, page ii):
1. "California charter schools are doing a better job of improving the academic performance (as measured by API) of California’s most at-risk students, those who are low-income, than non-charter California public schools."
This lead conclusion is incorrect on so many levels that coherent enumeration is difficult. First and most important, the relevant empirical evidence refutes the SKK conclusion. Starting with Exhibit 2--"SD Students in Charter and Non-charter Schools", whether the comparisons are made grade-by-grade or in collections of grades, SD students in non-charter schools show the greater improvement. For example, a cross-sectional comparison of Grades 2-6 indicates 4 points greater improvement for SD students in non-charter schools; for all SD students (grades 2-11) SD students in non-charter schools show greater improvement by 3.4 API points. Furthermore, from Table 1, using (rough) cohorts of students starting in grades 2-6 in 1999, the SD students in non-charter schools show greater improvement by almost 5 API points. More furthermore, the subset of SD students who reside in "High SD" schools (roughly 75% of SD students are in this subset) examined in Exhibit 3 show the same result--the SD students in High SD non-charter schools show greater improvement than the SD students in High SD charter schools by almost 5 API points.
Charter Schools, D Rogosa 5/02
The main methodological message in this context is that in order to make assertions about the progress of SD students (as is done in SKK #1) it's necessary to do an analysis of SD students. SKK only have indirect evidence on SD students through their selection of all students in high Meals schools. Plus the SKK analyses suffer from the distortion of the mean-of-school-means data analysis and the flaws in the SKK data set. Thirdly, as indicated previously, it's important too keep in perspective the educational (practical) significance of the observed differences between charter and non-charter. I reiterate my cautions about making too much of a fuss about a 4-point differential (roughly equivalent to every other student obtaining one additional item correct on each Stanford 9 test). But in order to counter the SKK assertions, as in "charter schools are doing a better job", it's necessary to shout a bit that the SKK horse race between charter and non-charter is actually won by the non-charter schools.
2. "Student achievement (as measured by API) in California’s low-income charter schools is, on average, improving at a faster rate than in similar non-charter schools."
This assertion (#2) differs from #1 above in referring to all students (SD or non-SD) who attend a school classified by SKK as disadvantaged (using the Meals variable in 2001). The analysis most closely corresponding to this indirect SKK attempt to "adjust for SES" is summarized in Exhibit 4. Exhibit 4 shows results for students in High SD schools (at least half of students SD in two or more years). Overall (students in grades 2-11), once again the result is that students in High SD non-charter schools show greater improvement than the students in High SD charter schools by a margin of almost 5 API points. However, Exhibit 4 also shows stronger improvement for charter students in the lower grades (an effect not seen with all students or with the SD students in Exhibits 1 and 2).
This may be a good spot to try to establish some balance in the discussion. As part of their Assertion #2 SKK comment that "It appears that charter schools are doing an effective job of improving the academic performance of low-income students." That statement is also consistent with the empirical evidence presented here. In fact SKK, by making a fuss about rather small differences in scores based on flawed data and poor analyses, may well harm the image of charter schools, as the reversal of their results may create an overreaction by interested parties. Succinctly stated, don't confuse bad research with bad schools.
3. "Charter schools are serving a greater concentration of low-income students."
This is an interesting small descriptive item. The empirical evidence is obtained from Exhibits 1 and 2--simply compute the proportion of SD students in the charter and non-charter schools. Over grades 2-11 the
Charter Schools, D Rogosa 5/02
proportion of students in charter schools classified as SD is .511 and the proportion of students in non-charter schools classified as SD is .491. Not a large difference, amounting to approximately 800 students out of the charter group of 40472 students in the 2001 data. Broken down by grade, the proportion of SD students is: ------------------------------------------- Proportion SD Students Grade Charter 2001 Non-Charter 2001 2 0.619 0.591 3 0.580 0.572 4 0.581 0.566 5 0.589 0.548 6 0.514 0.519 7 0.465 0.484 8 0.412 0.454 9 0.450 0.402 10 0.318 0.358 11 0.266 0.328 ------------------------------------------ "Concentration" can be interpreted in various ways. and SKK offer different empirical evidence, based on their flawed school-level data. Actually, making the SKK-style comparison produces the opposite result; with the corrected data a greater proportion of non-charter schools (.484) are classified as High SD than charter schools (.441). 4. "Smaller schools tend to outperform larger schools in terms of student achievement growth. In other words, size matters."
This Assertion #4 provides an opportunity to make a number of comments about school size and API performance. In the "Year 2000 Update: Interpretive Notes for the Academic Performance Index" Section 3A carefully examines the supposed relation between school size and API scores, using the Year 2000 API scores. (Here school size is the number of students included in the API, which is less than total enrollment.) Table 18 of that document gives descriptive statistics for school size at each state decile. For example, California High Schools scoring in the ninth decile (rather high) have median size 1083 whereas the High Schools scoring in the second decile (rather low) have median size 1061. Elementary Schools scoring in the tenth decile (top) have median size 348, whereas Elementary Schools scoring in the fourth decile have median size 350. This Section 3A also presents the scatterplots--API plotted against school size for each school type, Elementary, Middle, and High. From those plots one wouldn't conclude a notable relationship between school size and API. What can be seen in each plot is that a few very large schools (10 or less) are very low scoring schools with the remaining schools showing little dependence of API on school size.
So why do SKK make claims for a strong constant effect of school size? The basic blunder--combining across school types--is not unique to SKK. Another example of a poor analysis which received considerable press attention was from the California Budget Project ("What do the 2000 API results tell us about California's schools?" CPB, March 2001). The CBP assertion "school size increases API scores decrease" is discussed in the Year 2000 Interpretive Notes. In California, Middle

Charter Schools, D Rogosa 5/02
Schools have about twice the number of API students as Elementary Schools and High Schools have about three times the number as Elementary Schools. Also Elementary Schools have the highest scores and High Schools the lowest. For reference the table below, excerpted from "Year 2001 Growth Update: Interpretive Notes for the Academic Performance Index", shows that for year 2001 (used by SKK) the median score of Elementary Schools is 25 points higher than for Middle Schools which in turn is 30 points higher than High Schools. But these score differences are due to a number of factors such as grade level of students, curricular match of the Stanford 9 tests etc, etc. Median School API Scores 1999-2001 Elementary Middle High School API_99 631.75 633.25 620.375 API_2k 674.125 655.062 638.375 API_01 693.5 668.375 635.75
Combining school types will induce a (false) relation between API scores and school size. In technical talk, size serves as a proxy for school type (omitted variable) and distortions ensue. Moreover, the use of the multiple regression coefficients by SKK to form their assertions about school size is without merit; I believe that most elementary statistics students are forcefully taught not to interpret fit coefficients in this manner. One additional note: even though the SKK Assertion #4 is phrased in terms of "student growth" all their analyses and discussion appear to be in terms of the static year 2001 API score, so that's the focus here.
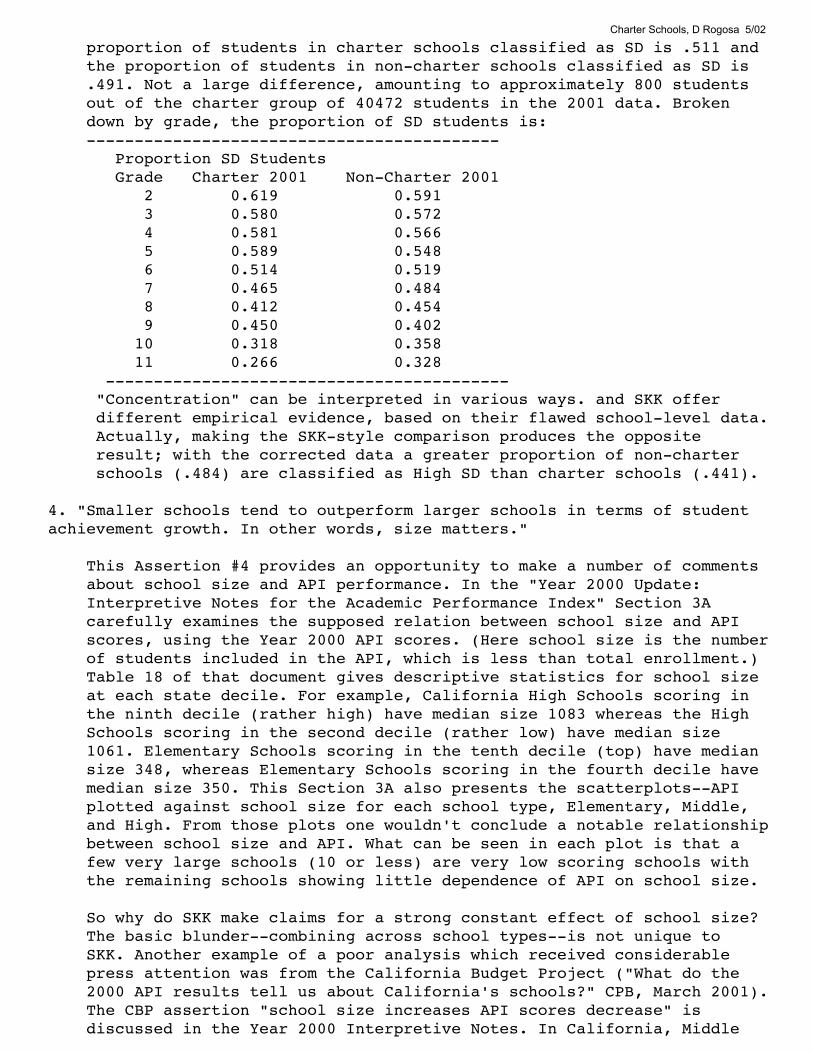
Also, it's useful to look at API and school size for the set of 93 charter schools; here we have 68 Elementary Schools, 11 Middle Schools, 10 High Schools (plus 4 schools with a "small" designation). The plot of API versus school size on the next page uses the RGB color coding (Red = Elementary, Green = Middle, Blue = High). It's very hard to discern the effect of school size claimed by SKK, especially when school type is properly distinguished. Bottom line is that size doesn't matter much at all, but it is easy to fool a regression equation into pronouncing that size matters by combining across school types. 5. "Socioeconomic status continues to influence student performance on standardized tests."
This is perhaps the most vexing and unfortunate item in the entire SKK report. SKK attempt to establish that charter schools do a better job with SD students than non-charter schools; in reality, there is no such evidence. Based on totally inappropriate interpretations of school-level regression coefficients (p.8, especially the comparison of coefficients on p.10) SKK assert (p.10): "the finding in this study that charter schools are doing a better job of serving low-SES students". Exhibit 2 shows that SD students are making (slightly) larger improvement in non-charter schools. And Exhibit 3 confirms that differential in favor of non-charter schools for SD students in the subset of schools designated as High SD. Again, nothing here

250 500 750 1000 1250 1500 1750N_01
500
600
700
800
900
API_01 API versus School Size
Figure 2. P
lot of AP
I versus school size (Red = E
lementary, G
reen = Middle, B
lue = High)

Charter Schools, D Rogosa 5/02
indicates that charter schools are doing a poor job; please don't confuse poor research with poor schools. The relationship between demographic factors and student performance is an important and controversial issue. Section 3 of the "Interpretive Notes for the Academic Performance Index" and Section 3 of the "Year 2001 Growth Update: Interpretive Notes for the Academic Performance Index" present data analyses for the API which demonstrate that demographics are far from deterministic, and that "schools with similar demographics have wide ranges of performance, even when compared to the differences in performance between the most demographically advantaged and disadvantaged schools" (p.43, Year 2001 Growth Update). Certainly, schools considered to be advantaged rarely score poorly and schools considered to be disadvantaged very rarely exceed the scores of the advantaged schools. Therefore, one can detect a trend. But the important feature of the API data is the wide range of scores for schools of similar demographics. And this feature is not subtle. Visual inspection of the scatterplots of school API scores and the SCI (the "School Characteristics Index", "a composite of the school's demographic characteristics" computed by CDE) shown in the "Interpretive Notes" reports will suffice. Also, for what it's worth, the school-level correlation between API and SCI is essentially the same for these charter schools as it is for the entire state. To provide some quantification, consider the "Range of Similar Schools API" for year 2000 API data. The table shown below indicates that half the Elementary Schools show a range of their Similar Schools API scores of at least 257 points, and 75 percent of elementary schools have a range of their Similar Schools API scores of at least 222 points. A good way to calibrate these numbers is to note that for elementary schools the statewide decile categories typically span 45 API points. Thus 223 points represents a span of about 5 statewide deciles, and the median range 257 represents a span of 6 statewide deciles. For the group of charter schools in this report the corresponding numbers are shown below the statewide numbers.
-------------------------------------------------------------------------- Range Similar School API, All California Variable N Mean Median Q1 Q3 Minimum Maximum Elem 4775 268.88 257.00 222.00 308.00 125.00 435.00Middle 1125 224.26 212.00 178.00 238.00 131.00 414.00High 853 258.77 255.00 227.00 314.00 121.00 398.00--------------------------------------------------------------------------- Range Similar School API, 93 charter schoolsYear N Mean Median Q1 Q3 Minimum Maximum1999 86 277.59 262.00 223.25 303.50 182.00 522.00 2000 83 277.72 257.00 228.00 328.00 138.00 426.00 ----------------------------------------------------------------------------
Charter Schools, D Rogosa 5/02
Acknowledgements
Thanks to Eric Crane and David Day of CDE for school identification and data verification, to Simeon P. Slovacek, Antony J. Kunnan, and Hae-Jin Kim for providing the listing of charter schools used in their report, and to Ghassan Ghandour for the usual computing wizardry.
The work reported herein was supported under the Educational Research and Development Centers Program, PR/Award Number R305B60002 and Award Number R305B960002-01 as administered by the Office of Educational Research and Improvement, U.S. Department of Education. The findings and opinions expressed in this report do not reflect the positions or policies of the National Institute on Student Achievement, Curriculum, and Assessment, the Office of Educational Research and Improvement, or the U.S. Department of Education.

Appendix A Listing of the 93 Charter Schools CDS SType01 SType99 34674476034508 E E 36750773630837 E H 33670586031959 E E 34674396033799 E E 37680236037956 E E 37680236111322 E E 37683386039457 E E 37680236037980 E E 37680236109771 E E 31669516085252 E E 28662666026900 E E 28662666026934 E E 21654176113229 E E 24657716025654 E E 28662666026983 E E 30103063030632 E H 30736356030183 E E 29664156111413 E E 29664156113138 E E 37683386040018 E E 44697996049829 E E 49709536111678 E E 42692786045918 E E 44697996049720 E E 49753586052369 E E 50711346113286 E E 50712176052922 E E 50710926112965 E E 50711006112627 E E 41690216112213 E E 41689996044333 E M 41689996114953 E E 37683386114961 E E 38684786040935 E E 41690056044473 E E 41690216044754 E E 41690216044788 E E 41690216044721 E E 41690216044739 E E 19650946023527 E E 19647336018063 E E 19647336017701 E E 19647336017677 E E 19647336015929 E E 19647336019145 E E 19647336018634 E E 19647336018204 E E 19647336017040 E E 19647336017016 E E 19647336016810 E E 19647336016570 E E 19647336017156 E E

19647336017057 E E 19647336016323 E E 19647336019236 E E 19647336019905 E E 19647336019939 E E 19647336019715 E E 19647336019806 E E 19647336097927 E E 19647336112536 E E 10621666088942 E E 10101086085112 E E 10622406006712 E M 16639336010466 E E 16639906010557 E E 19647336019525 E E 10622406006704 E E 38684783830411 H H 19647331995836 H H 48705734830113 H E 19647331932128 H H 34752833430659 H H 36679343630761 H H 31669513134657 H H 31669513130168 H H 37681303732732 H H 37681063731023 H H 10622406108328 M M 19647336058267 M M 19647336061394 M M 30666216085328 M M 01612596111660 M M 34674056112643 M M 37683386061956 M M 37683386061964 M M 16639906110233 M M 19647256113146 M M 19647331931070 M H 10619946005730 S E 31669516031363 S E 31669443130226 S E 10621661030642 S H