using surveys social-emotional learning and school...
TRANSCRIPT

Using Surveysof Students’Social-Emotional Learning and School Climate for Accountability and Continuous Improvement
March 2017
Heather HoughDemetra KalogridesSusanna Loeb

EDPOLICYINCA.ORG
Heather Hough, Demetra Kalogrides, & Susanna Loeb | 1
Using Surveys of Students’ Social-Emotional Learning
and School Climate for Accountability and Continuous Improvement
Heather Hough, Demetra Kalogrides, & Susanna Loeb
Summary and Policy Implications
Policy makers, educators, and the broader public increasingly agree that students’ development of social-emotional skills is important for success in academic and life outcomes. Research provides evidence that schools can facilitate the development of these skills, both directly and through the implementation of policies and practices that improve a school’s culture and climate and promote positive relationships.
Growing confidence that schools can contribute to students’ social-emotional development has led some districts and states nationwide to consider including measures of of socialemotional learning (SEL) and school culture and climate (CC) in systems of school accountability and continuous improvement.
This policy brief summarizes our recent research using data from the CORE districts— districts serving nearly one million students who have embraced systematic measurement of SEL and CC—to provide guidance for state and local policy makers about the suitability of SEL and CC surveys as school performance indicators and how they can be used in a broader set of measures.
We find that the CORE measures of SEL and CC demonstrate validity and reliability, distinguish between schools, are related to other academic and non-academic measures, and illuminate dimensions of student achievement that go beyond traditional indicators, all initial indications of the measures’ promise for informing school improvement.
Our results also demonstrate the importance of reporting SEL and CC measures by subgroup, as African American and Hispanic/Latino students report lower SEL and CC compared to peers even within the same schools.
While the measures of SEL and CC provide new information for school improvement, given remaining questions about the measures’ sensitivity to change over time, the effect of schools on improving SEL and CC outcomes, and the potential for measures to be gamed, further research is needed to understand the advantages and disadvantages of incorporating them into higher stakes accountability systems.

2 | Using SEL and CC for Accountability and Continuous Improvement
Introduction
Policy makers, educators, and the broader public increasingly agree that students’ development of social-emotional skills is important for success in academic and life outcomes (Almlund, Duckworth, Heckman, & Kautz, 2011; Casner-Lotto, Barrington, & Wright, 2006; Conard, 2006; de Ridder, Lensvelt-Mulders, Finkenauer, Stok, & Baumeister, 2012; Duckworth & Carlson, 2013; Duckworth, Tsukayama, & May, 2010; Fitzsimons & Finkel, 2011; Heckman, Pinto, & Savelyev, 2013; Nagaoka, Farrington, Ehrlich, & Heath, 2015). Research provides evidence that schools can facilitate the development of these skills, both directly (Allensworth & Easton, 2007; Durlak, Weissberg, Dymnicki, Taylor, & Schellinger, 2011) and through the implementation of policies and practices that improve a school’s culture and climate and promote positive relationships (Battistich, Schaps, & Wilson, 2004; Berkowitz, Moore, Astor, & Benbenishty, 2016; Blum, Libbey, Bishop, & Bishop, 2004; Hamre & Pianta, 2006; Jennings & Greenberg, 2009; McCormick, Cappella, O’Connor, & McClowry, 2015).
Due to this growing understanding that schools can contribute to students’ social-emotional development, some districts and states nationwide are considering the use of student reports of social-emotional learning and school culture and climate for use in systems of school accountability and continuous improvement. Growing interest in local measurement is fueled in part by federal and state policy, both of which expand the range of measures that must be collected to support a more comprehensive understanding of school performance. The Every Student Succeeds Act (ESSA) of 2015 requires states to measure at least one indicator of “School Quality or Student Success,” defined broadly to include measures of student engagement, educator engagement, student access to and completion of advanced coursework, post-secondary readiness, or school climate and safety. Similarly, under California’s Local Control Funding Formula (LCFF) and the supporting Local Control Accountability Plan (LCAP), districts are expected to develop and report indicators representing a wide range of educational goals, and to use these measures to “identify their strengths, areas where support is needed, and where support is available within the greater ecosystem of peer learning” (California Department of Education, 2016).
Given the novelty of collecting measures of social-emotional learning (SEL) and school culture and climate (CC) at scale, research provides little evidence about how such measures can be used in accountability and continuous improvement measurement systems. Despite some early research on SEL measurement (West, Kraft, et al., 2016; West et al., 2015) and a growing body of work on school culture/climate and its effect on students (e.g., Berkowitz et al., 2016), we do not know how measures of SEL and CC are related to one another, whether measures differ across schools, or whether schools cause any of the differences that might exist. Furthermore, existing research provides little guidance about how SEL and CC measures are related to other school performance indicators, and how they could be used to support school improvement.
Given the interest in measuring SEL and CC for accountability and continuous improvement, there is much to learn from California’s CORE districts about how such measures could be used to understand and improve school performance. The CORE districts are best known for the “waiver” they received from the U.S. Department of Education that freed them from some of their federal obligations under No Child Left Behind. Under the terms of the waiver, six districts
EDPOLICYINCA.ORG
Heather Hough, Demetra Kalogrides, & Susanna Loeb | 3
(Fresno, Long Beach, Los Angeles, Oakland, San Francisco, and Santa Ana1) developed and are currently implementing an innovative accountability system focused on improving both academic and non-academic outcomes for students. CORE’s systematic measurement of school and student performance on SEL and CC is unparalleled and has generated widespread national interest in the field of education and in the popular press (Blad, 2015; Bornstein, 2015; Zernike, 2016).
In this paper, we analyze SEL and CC data to better understand differences across schools, comparing these measures to a broader set of school performance indicators. First, we review the statistical properties of school indicators of SEL and CC. Then, we assess the extent to which school performance on the new SEL measures is similar to school performance on the CC measures. Here we look both at schools overall and at student subgroups within schools. Finally, we describe how schools’ SEL and CC performance corresponds to other accountability metrics, and how the addition of the SEL and CC surveys changes the overall picture of school performance based on the other measures.
CORE’s Data
The CORE districts together represent over one million students, nearly 20 percent of the students served in California. CORE’s measurement system focuses on academic outcomes alongside non-academic measures of student success, including chronic absenteeism, suspension/expulsion, students’ social-emotional learning, and school culture/climate. The CORE districts first reported on new school performance measures in the 2014–15 school year.2 In the analyses featured in this paper, we use three data sources: (a) CORE’s surveys of social-emotional learning and school culture/climate in 2014–15, (b) administrative data from each district including student and school characteristics, and (c) CORE-developed indicators of school performance that were created under the waiver.
Surveys of Social-Emotional Learning and School Culture/Climate
Student-reported SEL and CC measures come from surveys of students in Grades 5–12.3 The districts also administer CC surveys to all parents and school staff. The culture/climate surveys draw heavily from the California school climate surveys, which have been used extensively across California.4 The surveys in the CORE districts include the following constructs:5
1 The additional CORE districts are Sacramento City and Garden Grove Unified School Districts. 2 See Krachman, Arnold, and LaRocca (2016) for more information about the development of CORE’s accountability system and Marsh, Bush-Mecenas and Hough (2016) for a study of the first year of implementation. 3 In 2014–15, all of the CORE districts surveyed Grades 5–12, and some schools/districts surveyed Grades 3–4 additionally. 2015–16 and future years, all districts will survey students in Grades 4–12. For consistency across schools, we retain only student responses in Grades 5–12 in the analyses featured in this paper. 4 For further detail on reliability and validity of the California surveys: California Healthy Kids Survey (http://chks.wested.org/), California School Climate Survey (http://cscs.wested.org/), California School Staff Survey (http://csss.wested.org/), and California School Parent Survey (http://csps.wested.org/). 5 For more detail on the SEL constructs selected for inclusion, rationale for inclusion, and full survey instruments, see http://www.transformingeducation.org/measuringmesh/. For full CC instruments, see http://coredistricts.org/core-index/.

4 | Using SEL and CC for Accountability and Continuous Improvement
Social-emotional learning Self-management is the ability to regulate one’s emotions, thoughts, and behaviors
effectively in different situations. This measure includes managing stress, delaying gratification, motivating oneself, and setting and working toward personal and academic goals.
Growth mindset is the belief that one’s intelligence is malleable and can grow with effort. Students with a growth mindset see effort as necessary for success, embrace challenges, learn from criticism, and persist in the face of setbacks.
Self-efficacy is the belief in one’s own ability to succeed in achieving an outcome or reaching a goal. Self-efficacy reflects confidence in the ability to exert control over one’s motivation, behavior, and environment.
Social awareness is the ability to take the perspective of and empathize with others from diverse backgrounds and cultures, to understand social and ethical norms for behavior, and to recognize family, school, and community resources and supports.
School culture/climate Support for academic learning: High scores on this construct indicate that survey
respondents feel that the climate is conducive to learning and that teachers use supportive practices, such as encouragement and constructive feedback, varied opportunities to demonstrate knowledge and skills, support for risk-taking and independent thinking. Respondents report that the atmosphere is conducive to dialog and questioning, academic challenge, and individual attention to support differentiated learning.
Sense of belonging and school connectedness: High scores on this construct indicate that survey respondents report a positive sense of being accepted, valued, and included, by others (teacher and peers) in all school settings. Students and parents report feeling welcome at the school.
Knowledge and perceived fairness of discipline rules and norms: This construct measures the extent to which survey respondents report clearly communicated rules and expectations about student and adult behavior—especially regarding physical violence, verbal abuse or harassment, and teasing—clear and consistent enforcement, and norms for adult intervention.
Safety: This construct measures the extent to which students and adults report feeling safe at school and around school, including feeling safe from verbal abuse, teasing, or exclusion by others in the school.
For school-level analyses, we create school-level indicators of each of the SEL and CC measures following the method that the CORE districts developed for use in their measurement system. Student responses on the SEL and CC surveys are translated into the percentage of positive responses in each school; for example, a school with a score of “80” would indicate that 80 percent of the survey questions were answered positively by students.6 For student-level analyses, scores are averaged for each construct and then standardized by grade across all districts.
6 The CORE districts report each of the SEL constructs separately and aggregated for CC across respondent groups. For the purposes of this analysis, we report an aggregated version of SEL as well.
EDPOLICYINCA.ORG
Heather Hough, Demetra Kalogrides, & Susanna Loeb | 5
The surveys are linked to student data from each districts’ administrative files, including student demographic information such as race/ethnicity, gender, and free lunch receipt, and student test scores. In the analysis featured in this paper, we are interested in comparing school ratings, so we retained only schools with traditional grade spans to allow for straightforward comparisons, a total of 1,030 schools. In these schools, 286,277 students took the SEL survey, and 293,703 students, 186,971 parents, and 43,225 staff took the CC surveys.
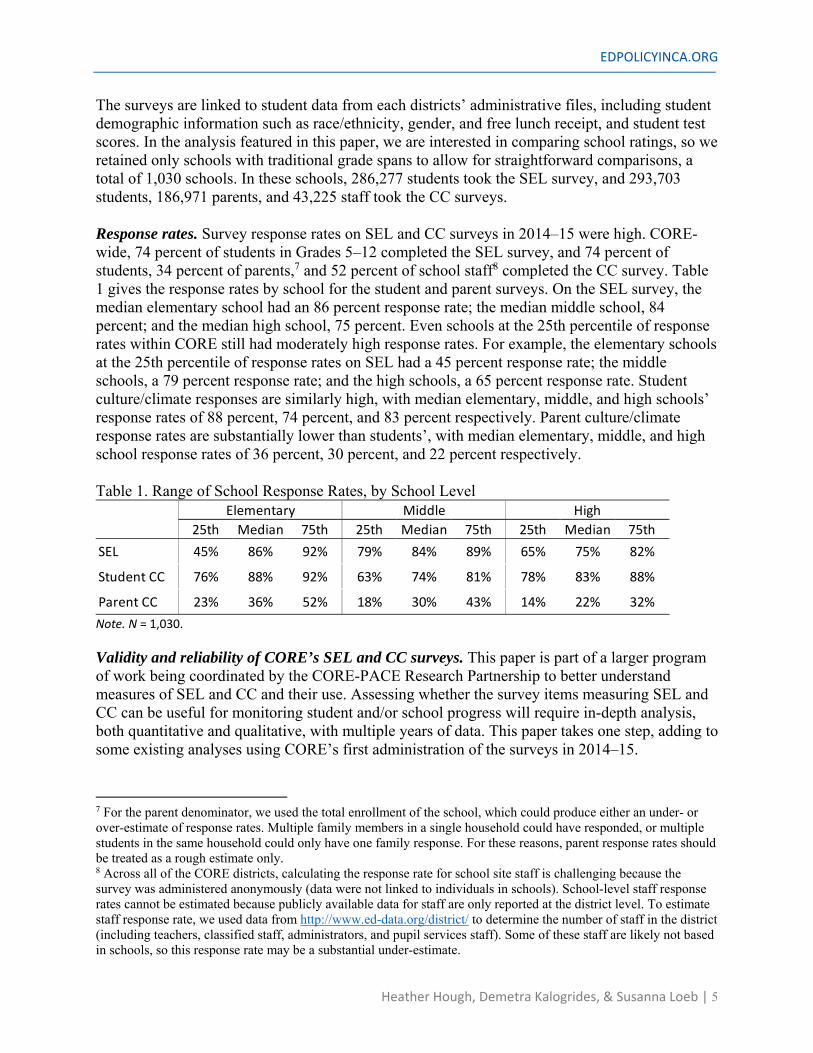
Response rates. Survey response rates on SEL and CC surveys in 2014–15 were high. CORE-wide, 74 percent of students in Grades 5–12 completed the SEL survey, and 74 percent of students, 34 percent of parents,7 and 52 percent of school staff8 completed the CC survey. Table 1 gives the response rates by school for the student and parent surveys. On the SEL survey, the median elementary school had an 86 percent response rate; the median middle school, 84 percent; and the median high school, 75 percent. Even schools at the 25th percentile of response rates within CORE still had moderately high response rates. For example, the elementary schools at the 25th percentile of response rates on SEL had a 45 percent response rate; the middle schools, a 79 percent response rate; and the high schools, a 65 percent response rate. Student culture/climate responses are similarly high, with median elementary, middle, and high schools’ response rates of 88 percent, 74 percent, and 83 percent respectively. Parent culture/climate response rates are substantially lower than students’, with median elementary, middle, and high school response rates of 36 percent, 30 percent, and 22 percent respectively.
Table 1. Range of School Response Rates, by School Level
Note. N = 1,030. Validity and reliability of CORE’s SEL and CC surveys. This paper is part of a larger program of work being coordinated by the CORE-PACE Research Partnership to better understand measures of SEL and CC and their use. Assessing whether the survey items measuring SEL and CC can be useful for monitoring student and/or school progress will require in-depth analysis, both quantitative and qualitative, with multiple years of data. This paper takes one step, adding to some existing analyses using CORE’s first administration of the surveys in 2014–15.
7 For the parent denominator, we used the total enrollment of the school, which could produce either an under- or over-estimate of response rates. Multiple family members in a single household could have responded, or multiple students in the same household could only have one family response. For these reasons, parent response rates should be treated as a rough estimate only. 8 Across all of the CORE districts, calculating the response rate for school site staff is challenging because the survey was administered anonymously (data were not linked to individuals in schools). School-level staff response rates cannot be estimated because publicly available data for staff are only reported at the district level. To estimate staff response rate, we used data from http://www.ed-data.org/district/ to determine the number of staff in the district (including teachers, classified staff, administrators, and pupil services staff). Some of these staff are likely not based in schools, so this response rate may be a substantial under-estimate.
25th Median 75th 25th Median 75th 25th Median 75thSEL 45% 86% 92% 79% 84% 89% 65% 75% 82%
Student CC 76% 88% 92% 63% 74% 81% 78% 83% 88%
Parent CC 23% 36% 52% 18% 30% 43% 14% 22% 32%
HighElementary Middle

6 | Using SEL and CC for Accountability and Continuous Improvement
Prior work has assessed the validity and reliability of the SEL and CC measures at the student level. West, Scherer, and Dow (2016) show that student-reported SEL and teacher reports on the same students are highly correlated, providing validation that the student SEL self-reports are measuring the intended construct. Additionally, West and colleagues have shown that student reports within schools are similar to reports across schools, suggesting that reference bias may not be an important phenomenon for the SEL measures. As shown in Table 2, the scale reliabilities are high on SEL and CC constructs (close to 1.0), which indicates that the items that make up the scales are strongly correlated with one another and measure the same underlying construct. West and colleagues (2016) also show that reliability on the SEL scales is consistent across respondent groups.
Table 2. Scale Reliabilities on SEL and CC Surveys, by Respondent Group
In-depth qualitative studies can also shed light on the validity of the measures. In a study completed in the 2016–17 school year, researchers explored the implementation and use of CORE’s measurement system (Marsh et al., 2016) assessing whether survey questions were answered honestly and administered fairly, and whether educators or students were manipulating, or “gaming,” them (for more on this concern, see Duckworth & Yeager, 2015). The study found broad support for SEL and CC measures and no evidence of distortive practice, though the measures were not widely used in practice.
Other School-Level Indicators from CORE’s Measurement System
We compare the SEL and CC measures to CORE’s other school-level indicators of school performance, including:9
Academic performance is measured as the percentage of students testing proficient in mathematics, based on Smarter Balanced Assessment Consortium (SBAC) test scores.10
Academic growth is measured as the extent to which students in a given school have improved their performance math tests from one year to the next relative to demographically
9 For more detail on CORE’s published measures in 2014–15, see http://coredistricts.org/wp-content/uploads/2016/02/CORE-Index-Technical-Guide-SY-2014-15-updated-2.1.16.pdf. 10 Note: In the analyses featured in this paper, we only use math test score, rather than reporting both math and English Language Arts (ELA). Results for ELA were similar in every analyses, so we eliminated reporting for simplicity.
Student Parent StaffSupportive Learning 0.88 0.83 0.91Connectedness 0.84 0.93 0.89Discipline 0.77 0.77 0.94Safety 0.81 0.81 0.86N 293,703 186,971 43,225Self-Management 0.85 -- --Growth Mindset 0.71 -- --Self-Efficacy 0.87 -- --Social Awareness 0.80 -- --N 286,277 -- --
CCSE
L

EDPOLICYINCA.ORG
Heather Hough, Demetra Kalogrides, & Susanna Loeb | 7
similar students who started the school year with similar prior achievement.11 The result is a growth percentile (rank from 0–100) comparing schools’ contribution to student growth on test scores.
Graduation is reported as the percentage of students who graduate in a 4-year cohort compared with the number of students enrolled in the school (accounting for students who transfer into and out of the school).12
High school readiness is the percentage of all eighth-grade students who meet the following criteria: (a) eighth-grade GPA of 2.5 or higher, (b) attendance of 96 percent or higher, (c) no grades of D or F in ELA or math in the final course grade, and (d) not suspended in eighth grade. These performance thresholds were determined based on analysis of outcomes of students in the CORE districts.
English Learner (EL) redesignation is represented as the percentage of students who are reclassified from English language learner status to “fluent English proficient” out of all reclassified English learners at a school site in the current year plus all those English learners who, after five years, were not reclassified at that school.
Chronic absence is measured as the percentage of students who have an attendance rate at or below 90 percent within a given school year.
Suspension/expulsion is measured as the percentage of students who are suspended and/or expelled at least once in a given school year.
Most schools in the CORE districts have data for every indicator, though there are some exceptions. First, a school does not report an EL redesignation score if it has fewer than 20 English learners. As shown in Table 3, as a result, only 71 percent of elementary schools report this indicator. Second, the proportion of elementary schools with SEL and CC indicators is lower than for middle and high schools; on the SEL and CC surveys, the indicator is only reported if a school has 20 or more responses in total (we report all responses for the parent and staff surveys), and elementary schools have lower enrollments and thus lower sample sizes. For example, only 79 percent of elementary schools report an SEL measure, compared to 100 percent of middle schools and 99 percent of high schools.
11 The growth indicator used in 2014–15 was a preliminary version generated comparing change from CST in 2012–13 to SBAC in 2014–15 given the testing constraints in that time period. CORE’s final/implemented growth model uses SBAC comparisons from 2014–15 to 2015–16. 12 CORE also reports a 5- and 6-year cohort graduation rate.

8 | Using SEL and CC for Accountability and Continuous Improvement
Table 3. Percentage of Schools With Data for Each Indicator
For each metric, schools are ranked by grade level on a scale from 1–10 in comparison to all other CORE schools, and these same cut points are applied to subgroup scores. CORE reports these ranks as below average (levels 1–3), average (levels 4–7), and above average (levels 8–10).13 CORE uses the full set of indicators to create a summative score, which was a requirement under the NCLB waiver. Academic measures account for 60 percent of this summative score, and the non-academic measures (e.g., attendance, suspension, SEL and CC surveys) account for 40 percent.14 For most metrics (except EL redesignation), index points are divided between the all-student group and four subgroup categories (lowest performing racial/ethnic group, English learners, students with disabilities, and disadvantaged students), meaning that half of a school’s final score is based on performance of all students in the school, and half is based on the performance of their subgroups.
Results—Understanding School-Level Differences in SEL and CC
In order to better understand differences across schools in SEL and CC and the implications of these differences for the use of the measures in practice, we address four research questions:
1. To what extent do schools vary in SEL and CC? 2. To what extent do SEL and CC reports vary within schools between constructs,
respondent groups (i.e., student groups, parents, staff), and subgroups? 3. How do school-level SEL and CC compare to other academic and non-academic
measures at the school level? 4. How does the inclusion of SEL and CC into a school accountability system change
school rank and the identification of the lowest performing schools?
13 For most indicators, the levels were set based on 2013–14 data and applied to 2014–15 data; for this reason, not all indicators have 10 percent of schools in each level. Academic growth, social-emotional learning, and school culture/climate levels were set based on 2014–15 data, as that was the first year they were measured. 14 For more detail on the construction of the summative score, see Appendix Figure A1.
Elementary Middle HighAcademic Performance - Math 100% 100% 99%Academic Growth - Math 99% 100% --Graduation -- -- 99%High School Readiness -- 99% --EL Redesignation 71% 96% 90%Chronic Absence 100% 99% 99%Suspension 100% 99% 100%SEL 79% 100% 99%Student CC 92% 100% 99%Parent CC 65% 90% 94%Staff CC 100% 100% 100%Number of schools 729 152 149
EDPOLICYINCA.ORG
Heather Hough, Demetra Kalogrides, & Susanna Loeb | 9
The answers to these questions will provide information useful for understanding the potential of these measures to benefit school assessment systems.
1. School Differences in SEL and CC
In order to be useful for accountability and continuous improvement, school-level measures need to differ across schools, and schools need to be able to influence their scores. In this section, we explore how much schools contribute to differences in student scores and how much schools vary in their SEL and CC performance.
Differences between schools relative to differences within schools. An initial step in assessing whether schools contribute to SEL or CC as measured on the surveys is simply to assess whether the scores on the measures differ systematically across schools. If schools do differ, the variation between schools in these measures could be caused by either or both of two factors. First, some schools might be doing a better job of helping students enhance social-emotional learning and of developing positive culture and climate. Second, schools may enroll students with different social-emotional skills to start with, as these skills may be learned in the home and the neighborhood, not just in schools. Similarly, schools may enroll students or hire educators with different propensities to report positive CC, and thus difference in these measures may be due to initial differences instead of school effects. Thus, if we find differences across schools, these differences could then be due either to the causal effects of schools or to sorting. However, if we find no systematic variation between schools then these measures are unlikely to be capturing differences in school performance related to SEL or the development of positive CC.
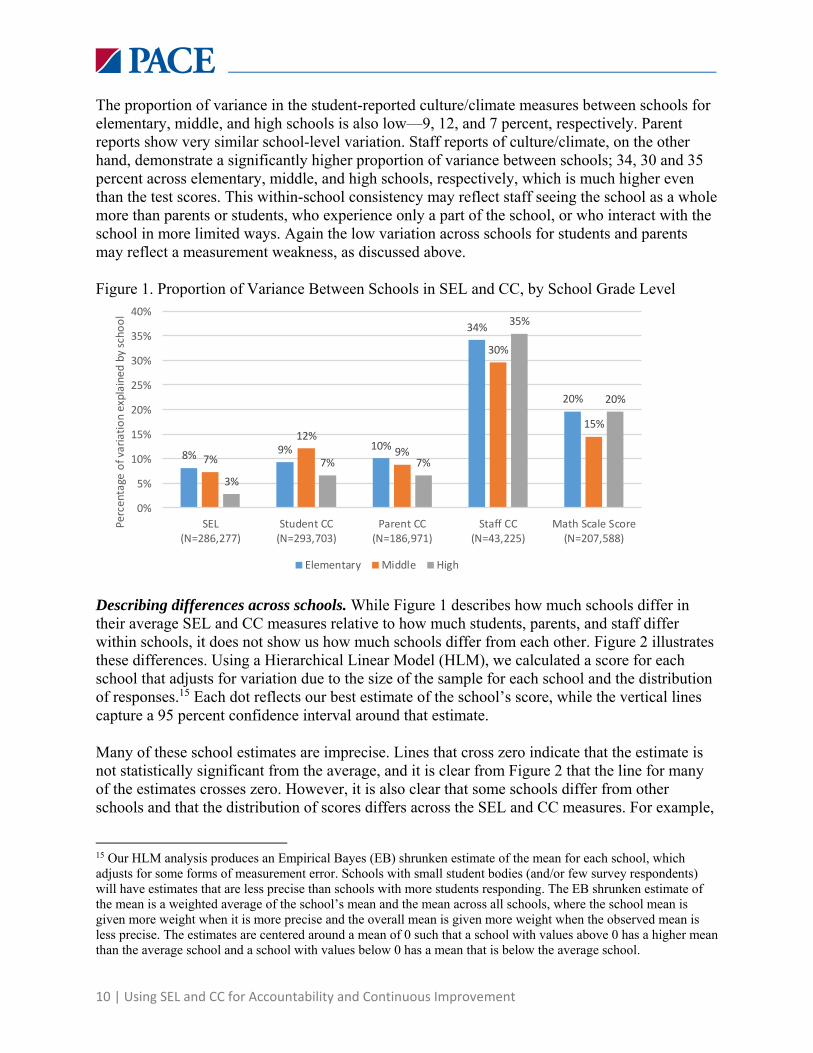
We begin by computing the intraclass correlation for the SEL and CC measures, which tells us the proportion of the variance in these measures that is between and within schools. Figure 1 shows the proportion of variance in these measures that is between schools by school grade level, including test scores in mathematics as a comparison.
We see that little of the variation in the SEL measure is between schools—8 percent for elementary schools, 7 percent for middle schools, and 3 percent for high schools. Most differences in SEL are among students attending the same schools rather than among students attending different schools. The SEL variances explained by schools is substantially lower than that for math test scores, for which 20 percent of the variance is between schools in elementary and high school, and 15 percent in middle school. These results are not necessarily surprising, as research shows that students’ development of social-emotional skills begins in infancy, and is influenced by a range of family and neighborhood contexts (Berliner, 2009; Nucci, 2016). Additionally, our results could indicate that a student’s individual experience may be driven more by their classroom context, peers in the same grade, or groups of friends than by school-wide programs or policies. Or, students and parents may report similar experiences differently based on differences in their perceptions or prior experiences, calling into question the validity of the measures (Aronson, Cohen, & McColskey, 2009; Duckworth & Yeager, 2015; West et al., 2015). Alternatively, the low variation across schools could signal a problem with the SEL measures themselves. If they contain substantial error, then that error reduces our ability to find true differences across schools even if those differences exist.
10 | Using SEL and CC for Accountability and Continuous Improvement
The proportion of variance in the student-reported culture/climate measures between schools for elementary, middle, and high schools is also low—9, 12, and 7 percent, respectively. Parent reports show very similar school-level variation. Staff reports of culture/climate, on the other hand, demonstrate a significantly higher proportion of variance between schools; 34, 30 and 35 percent across elementary, middle, and high schools, respectively, which is much higher even than the test scores. This within-school consistency may reflect staff seeing the school as a whole more than parents or students, who experience only a part of the school, or who interact with the school in more limited ways. Again the low variation across schools for students and parents may reflect a measurement weakness, as discussed above.
Figure 1. Proportion of Variance Between Schools in SEL and CC, by School Grade Level
Describing differences across schools. While Figure 1 describes how much schools differ in their average SEL and CC measures relative to how much students, parents, and staff differ within schools, it does not show us how much schools differ from each other. Figure 2 illustrates these differences. Using a Hierarchical Linear Model (HLM), we calculated a score for each school that adjusts for variation due to the size of the sample for each school and the distribution of responses.15 Each dot reflects our best estimate of the school’s score, while the vertical lines capture a 95 percent confidence interval around that estimate.
Many of these school estimates are imprecise. Lines that cross zero indicate that the estimate is not statistically significant from the average, and it is clear from Figure 2 that the line for many of the estimates crosses zero. However, it is also clear that some schools differ from other schools and that the distribution of scores differs across the SEL and CC measures. For example,
15 Our HLM analysis produces an Empirical Bayes (EB) shrunken estimate of the mean for each school, which adjusts for some forms of measurement error. Schools with small student bodies (and/or few survey respondents) will have estimates that are less precise than schools with more students responding. The EB shrunken estimate of the mean is a weighted average of the school’s mean and the mean across all schools, where the school mean is given more weight when it is more precise and the overall mean is given more weight when the observed mean is less precise. The estimates are centered around a mean of 0 such that a school with values above 0 has a higher mean than the average school and a school with values below 0 has a mean that is below the average school.
8% 9% 10%
34%
20%
7%
12%9%
30%
15%
3%7% 7%
35%
20%
0%
5%
10%
15%
20%
25%
30%
35%
40%
SEL(N=286,277)
Student CC(N=293,703)
Parent CC(N=186,971)
Staff CC(N=43,225)
Math Scale Score(N=207,588)
Perc
enta
ge o
f var
iatio
n ex
plai
ned
by sc
hool
Elementary Middle High

EDPOLICYINCA.ORG
Heather Hough, Demetra Kalogrides, & Susanna Loeb | 11
SEL has the tightest distribution, with ranges from 0.65 standard deviations below the mean to 0.91 above. In keeping with the results in Figure 1, the differences across schools for CC, especially for staff, show greater distinction (1.88 standard deviations below the mean to 1.31 above). This variation affects the proportion of schools on each measure that is statistically different from 0. For example, only 50 percent of the schools have SEL indicators different from average, whereas 70 percent of schools have staff CC indicators different from average.
Figure 2. Distribution of SEL and CC Scores, by Respondent Group
Consistent with West, Scherer, and Dow’s analysis (2016), we find that the imprecision of the estimates for each school make a more fine-grained 1–10 ranking system inaccurate. For example, 84 percent of schools identified as level 1 on student SEL have errors around the estimates indicating that their true score could be in level 2. These analyses demonstrate that school indicators based on the SEL and CC surveys can distinguish a number of schools that are above and below the average, even if they are less precise at highlighting nuanced differences.
As noted earlier, CORE ranks all of the responses from 1–10 and then identifies levels 1–3 as “below average” and schools in levels 8–10 as “above average.” Given the analyses in this section, we recommend the use of this three-level metric and utilize it in our own reporting as well, as it distinguishes between schools more accurately than comparing schools at more specific levels of performance.16
16 In this paper, we use CORE’s indicator definition for two important reasons. First, the CORE-PACE Research Partnership is designed in large part to support the CORE districts in continuous improvement, so it is beneficial for district leaders to have analysis in the context of the measures they actually see and use. Additionally, this kind of
12 | Using SEL and CC for Accountability and Continuous Improvement
2. Consistency Within Schools
The CORE districts have measured SEL and CC across multiple respondent groups because of the idea that the constructs in these domains are related; building a positive school culture/climate is one way that schools can support their students’ social-emotional learning. For this reason, it is important to understand whether and how these two sets of measures are related, and how schools perform on one dimension compared to another. In this section, we explore the extent to which SEL and CC reports vary within schools between constructs, how schools are performing with student subgroups within schools, and how school indicators of SEL and CC reports vary by respondent groups (i.e., students, parents, staff).
Comparing school performance on student-reported SEL and CC. We first explore how student reports of SEL and CC are related to one another. We would expect the two sets of measures to be correlated, since CC is one way schools can help develop SEL within students. However, CC is not the same construct as SEL, and, thus, the two measures should also demonstrate differences. To assess their similarities and differences, we estimate the relationships among the domains that make up SEL and CC. We begin with correlations of the continuous school-level indicators in student-reported SEL and CC, as shown in Table 4, with shades of green reflecting stronger correlations.
We see that the strongest correlations are in the CC constructs. For example, in high schools where students report a “supportive learning” environment, students are also more likely to report that they feel connected (.89 correlation) and understand the rules and norms around school discipline (.78 correlation). We also find relatively high correlations in the SEL constructs. For example, in elementary schools where students report high self-management skills, they are also more likely to report high growth mindset (.48 correlation), self-efficacy (.69 correlation), and social awareness (.70 correlation). The domains are less related to one another between SEL and CC than within SEL or within CC, yet there are still moderately high correlations between constructs.
simple metric is something that practitioners often use in measurement systems, because of the ease of interpretation and transparency, so this kind of analysis will be useful in data systems beyond the CORE districts as well.

EDPOLICYINCA.ORG
Heather Hough, Demetra Kalogrides, & Susanna Loeb | 13
Table 4. Correlations in School Indicators of Student-Reported SEL and CC, by School Level
Note. N = 975.
Differences in subgroup reports of SEL and CC. New measures present new opportunities to understand how schools are serving diverse students and can prompt educators and stakeholders to have honest conversations about how to develop inclusive, equitable school environments. It is for this reason that both ESSA and LCFF require disaggregation of results by subgroup. As such, understanding the extent to which subgroups differ across and within schools is as important as understanding how average performance differs across schools.
To unpack school performance with subgroups, we first investigate how demographic characteristics are related to SEL and CC performance. We find that students in special education, African American students, and Hispanic/Latino students report the lowest levels of SEL, and that differences between these groups persist even within schools.17 Figure 3 shows how the scores of student groups vary within schools compared to overall differences in the SEL average score. The gaps become smaller when we compare subgroups within schools to the 17 See Appendix Tables A1 and A2 for full regression results by SEL and CC construct. To compare overall versus within school differences, we estimate regression models with and without school fixed effects, which essentially compares all students to the average student in the school.
Self-Mgmt
Growth Mindset
Self-Efficacy
Social Awareness
SEL Average
Supportive Learning
Connect-edness Discipline Safety
Student CC
AverageSelf-Mgmt 1.00Growth Mindset 0.48 1.00Self-Efficacy 0.69 0.49 1.00Social Awareness 0.70 0.36 0.62 1.00SEL Average 0.91 0.62 0.83 0.86 1.00Supportive Learning 0.22 0.28 0.29 0.47 0.38 1.00Connectedness 0.40 0.32 0.38 0.62 0.54 0.78 1.00Discipline 0.07 0.18 0.12 0.33 0.20 0.74 0.62 1.00Safety 0.44 0.44 0.25 0.49 0.48 0.36 0.49 0.36 1.00Student CC Average 0.34 0.37 0.31 0.58 0.48 0.88 0.88 0.84 0.68 1.00Self-Mgmt 1.00Growth Mindset 0.62 1.00Self-Efficacy 0.59 0.52 1.00Social Awareness 0.87 0.47 0.44 1.00SEL Average 0.97 0.70 0.68 0.91 1.00Supportive Learning 0.39 0.24 0.34 0.40 0.41 1.00Connectedness 0.60 0.37 0.47 0.59 0.62 0.87 1.00Discipline 0.49 0.44 0.38 0.48 0.53 0.88 0.85 1.00Safety 0.12 0.22 -0.04 0.12 0.10 0.47 0.46 0.44 1.00Student CC Average 0.49 0.37 0.36 0.48 0.50 0.94 0.94 0.93 0.64 1.00Self-Mgmt 1.00Growth Mindset 0.52 1.00Self-Efficacy 0.14 0.16 1.00Social Awareness 0.87 0.50 0.23 1.00SEL Average 0.93 0.68 0.36 0.92 1.00Supportive Learning 0.28 0.21 0.30 0.39 0.39 1.00Connectedness 0.33 0.19 0.38 0.51 0.45 0.89 1.00Discipline 0.49 0.35 0.15 0.52 0.54 0.78 0.74 1.00Safety 0.38 0.22 0.07 0.33 0.34 0.54 0.53 0.53 1.00Student CC Average 0.42 0.28 0.28 0.52 0.50 0.94 0.93 0.90 0.67 1.00
Social-Emotional Learning School Culture/ClimateSE
LCC
High
Mid
dle
Elem
enta
ry
SEL
CCSE
LCC
14 | Using SEL and CC for Accountability and Continuous Improvement
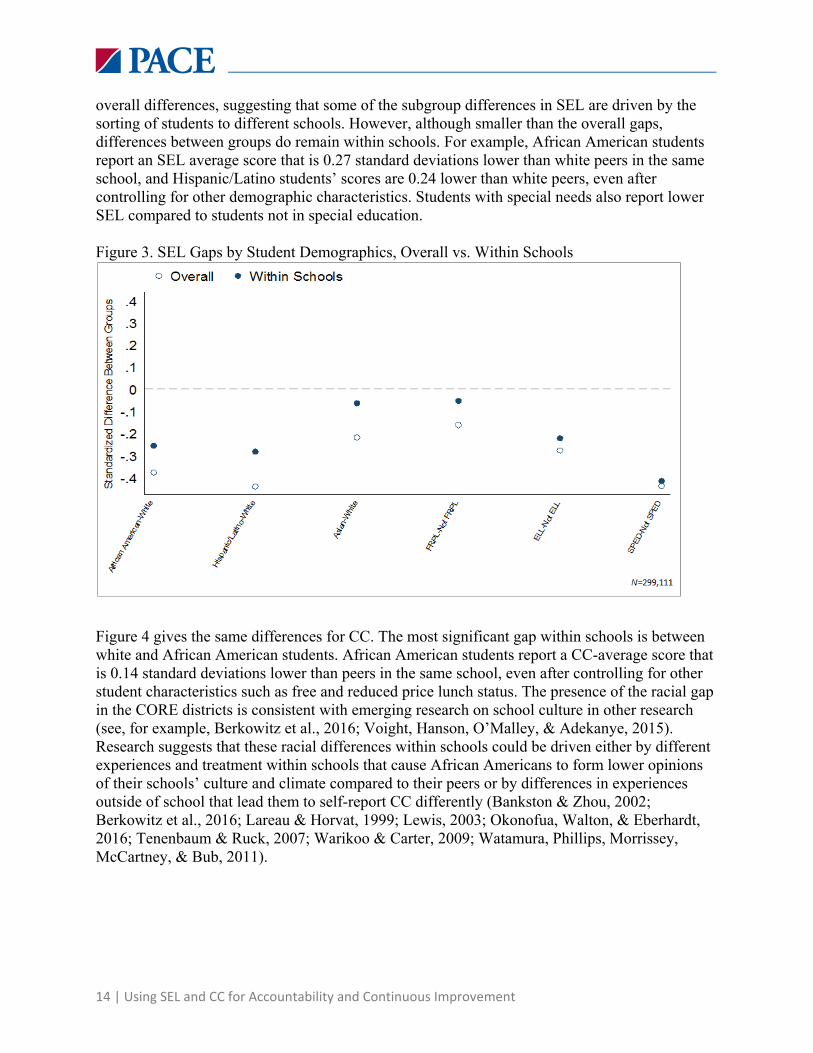
overall differences, suggesting that some of the subgroup differences in SEL are driven by the sorting of students to different schools. However, although smaller than the overall gaps, differences between groups do remain within schools. For example, African American students report an SEL average score that is 0.27 standard deviations lower than white peers in the same school, and Hispanic/Latino students’ scores are 0.24 lower than white peers, even after controlling for other demographic characteristics. Students with special needs also report lower SEL compared to students not in special education.
Figure 3. SEL Gaps by Student Demographics, Overall vs. Within Schools
Figure 4 gives the same differences for CC. The most significant gap within schools is between white and African American students. African American students report a CC-average score that is 0.14 standard deviations lower than peers in the same school, even after controlling for other student characteristics such as free and reduced price lunch status. The presence of the racial gap in the CORE districts is consistent with emerging research on school culture in other research (see, for example, Berkowitz et al., 2016; Voight, Hanson, O’Malley, & Adekanye, 2015). Research suggests that these racial differences within schools could be driven either by different experiences and treatment within schools that cause African Americans to form lower opinions of their schools’ culture and climate compared to their peers or by differences in experiences outside of school that lead them to self-report CC differently (Bankston & Zhou, 2002; Berkowitz et al., 2016; Lareau & Horvat, 1999; Lewis, 2003; Okonofua, Walton, & Eberhardt, 2016; Tenenbaum & Ruck, 2007; Warikoo & Carter, 2009; Watamura, Phillips, Morrissey, McCartney, & Bub, 2011).

EDPOLICYINCA.ORG
Heather Hough, Demetra Kalogrides, & Susanna Loeb | 15
Figure 4. Student CC Gaps by Student Demographics, Overall vs. Within Schools
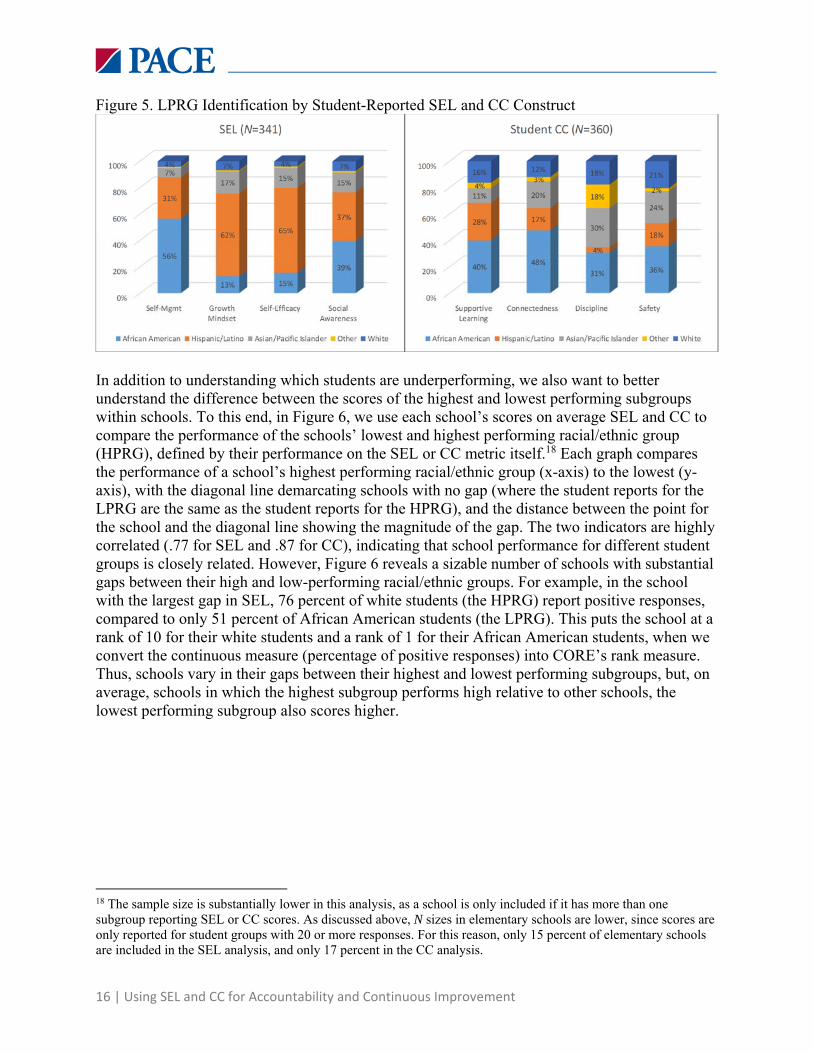
In the above section, we showed large gaps in SEL and CC by student demographics. In this section, we further investigate the racial/ethnic gaps within schools. To do so, we use CORE’s definition of the “lowest performing racial/ethnic group” (LPRG). LPRG is determined on each indicator, such that white students might be the lowest group on test scores but Hispanic/Latino students might be the lowest group on chronic absence. The LPRG on each student-reported SEL and CC construct is shown below in Figure 5. We find that the racial-ethnic group identified on each construct varies, revealing that different subgroups perform differently on the constructs. For example, African American students are most often identified as the LPRG for self-management (in 56 percent of the schools), but on growth mindset, the LPRG is most frequently Hispanic/Latino students (62 percent). Importantly, across all CC constructs, the African American subgroup is the most frequent LPRG, indicating these students feel less supported, less connected, have less understanding of discipline and norms, and feel less safe compared to other students in the same schools.
16 | Using SEL and CC for Accountability and Continuous Improvement
Figure 5. LPRG Identification by Student-Reported SEL and CC Construct
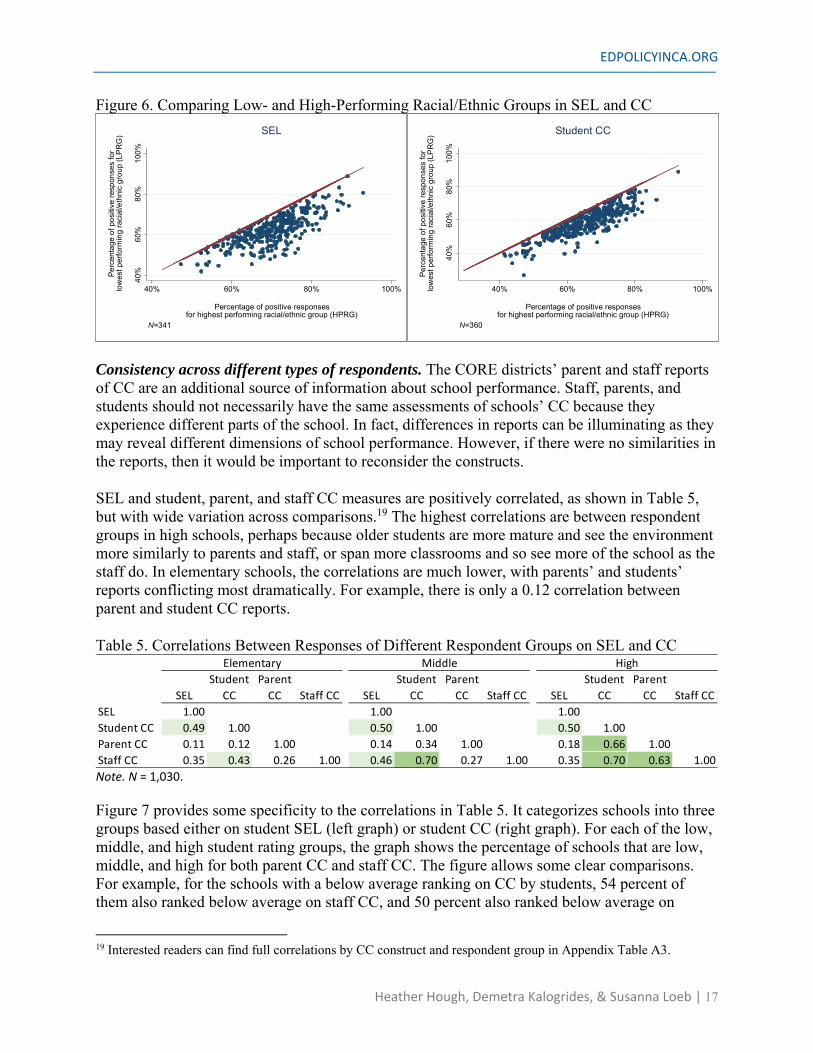
In addition to understanding which students are underperforming, we also want to better understand the difference between the scores of the highest and lowest performing subgroups within schools. To this end, in Figure 6, we use each school’s scores on average SEL and CC to compare the performance of the schools’ lowest and highest performing racial/ethnic group (HPRG), defined by their performance on the SEL or CC metric itself.18 Each graph compares the performance of a school’s highest performing racial/ethnic group (x-axis) to the lowest (y-axis), with the diagonal line demarcating schools with no gap (where the student reports for the LPRG are the same as the student reports for the HPRG), and the distance between the point for the school and the diagonal line showing the magnitude of the gap. The two indicators are highly correlated (.77 for SEL and .87 for CC), indicating that school performance for different student groups is closely related. However, Figure 6 reveals a sizable number of schools with substantial gaps between their high and low-performing racial/ethnic groups. For example, in the school with the largest gap in SEL, 76 percent of white students (the HPRG) report positive responses, compared to only 51 percent of African American students (the LPRG). This puts the school at a rank of 10 for their white students and a rank of 1 for their African American students, when we convert the continuous measure (percentage of positive responses) into CORE’s rank measure. Thus, schools vary in their gaps between their highest and lowest performing subgroups, but, on average, schools in which the highest subgroup performs high relative to other schools, the lowest performing subgroup also scores higher.
18 The sample size is substantially lower in this analysis, as a school is only included if it has more than one subgroup reporting SEL or CC scores. As discussed above, N sizes in elementary schools are lower, since scores are only reported for student groups with 20 or more responses. For this reason, only 15 percent of elementary schools are included in the SEL analysis, and only 17 percent in the CC analysis.
EDPOLICYINCA.ORG
Heather Hough, Demetra Kalogrides, & Susanna Loeb | 17
Figure 6. Comparing Low- and High-Performing Racial/Ethnic Groups in SEL and CC
Consistency across different types of respondents. The CORE districts’ parent and staff reports of CC are an additional source of information about school performance. Staff, parents, and students should not necessarily have the same assessments of schools’ CC because they experience different parts of the school. In fact, differences in reports can be illuminating as they may reveal different dimensions of school performance. However, if there were no similarities in the reports, then it would be important to reconsider the constructs.
SEL and student, parent, and staff CC measures are positively correlated, as shown in Table 5, but with wide variation across comparisons.19 The highest correlations are between respondent groups in high schools, perhaps because older students are more mature and see the environment more similarly to parents and staff, or span more classrooms and so see more of the school as the staff do. In elementary schools, the correlations are much lower, with parents’ and students’ reports conflicting most dramatically. For example, there is only a 0.12 correlation between parent and student CC reports.
Table 5. Correlations Between Responses of Different Respondent Groups on SEL and CC
Note. N = 1,030. Figure 7 provides some specificity to the correlations in Table 5. It categorizes schools into three groups based either on student SEL (left graph) or student CC (right graph). For each of the low, middle, and high student rating groups, the graph shows the percentage of schools that are low, middle, and high for both parent CC and staff CC. The figure allows some clear comparisons. For example, for the schools with a below average ranking on CC by students, 54 percent of them also ranked below average on staff CC, and 50 percent also ranked below average on
19 Interested readers can find full correlations by CC construct and respondent group in Appendix Table A3.
40%
60%
80%
100%
Perc
enta
ge o
f pos
itive
resp
onse
s fo
rlo
wes
t per
form
ing
raci
al/e
thni
c gr
oup
(LPR
G)
40% 60% 80% 100%
Percentage of positive responsesfor highest performing racial/ethnic group (HPRG)
N=360
Student CC
40%
60%
80%
100%
Perc
enta
ge o
f pos
itive
resp
onse
s fo
rlo
wes
t per
form
ing
raci
al/e
thni
c gr
oup
(LPR
G)
40% 60% 80% 100%
Percentage of positive responsesfor highest performing racial/ethnic group (HPRG)
N=341
SEL
SELStudent
CCParent
CC Staff CC SELStudent
CCParent
CC Staff CC SELStudent
CCParent
CC Staff CCSEL 1.00 1.00 1.00Student CC 0.49 1.00 0.50 1.00 0.50 1.00Parent CC 0.11 0.12 1.00 0.14 0.34 1.00 0.18 0.66 1.00Staff CC 0.35 0.43 0.26 1.00 0.46 0.70 0.27 1.00 0.35 0.70 0.63 1.00
Elementary Middle High

18 | Using SEL and CC for Accountability and Continuous Improvement
parent CC. As a comparison, among schools with an above average ranking on CC by students, 13 percent are below average on staff CC and 15 percent are below average on parent CC. While it is easy to see that the reports by the different respondent groups tend to move in the same direction, the differences between respondent groups can be revealing when used for continuous improvement. For example, what kinds of support are needed if students feel connected to a school but their parents do not?
Figure 7. School Indicators of Student-Reported SEL and CC Compared to Staff and Parent CC
While differences in SEL and CC reports by respondent groups can highlight areas for improvement, when these data are used to direct precious resources to struggling schools, it may be more beneficial to use the set of SEL and CC indicators together. For example, a district might want to identify schools that are doing poorly on all SEL and CC reports rather than just on some. To explore this idea, we summed up schools’ scores (below average = 1, average = 2, above average = 3) across all of the SEL and CC responses.20 A school with a total score of 4 is “below average” on all four SEL and CC indicators (SEL, student-, parent-, and staff-reported CC), and a school with a total score of 12 is “above average” on all of the indicators, with scores in between indicating that schools are high or average on some and low or average on others.
Figure 8 shows that 9 percent of schools score below average (a score of 4) on all four reports; these are likely schools with a significant problem of culture/climate that may be negatively impacting the social-emotional learning of their students. Schools with a score of 12 (above average on all indicators) may be places to investigate for evidence of excellent practice or strong leadership—ideas that can be spread to help struggling schools. Eight percent of schools fall into this category. The rest of the schools have either average scores from all respondents or conflicting reports by respondents. Overall, most schools fall in the middle of the distribution with scores of 7, 8, or 9; but meaningful numbers of schools are either low across indicators with scores of 4, 5, or 6 or high across measures with scores of 10, 11, or 12. (Distribution is similar by school level.)
20 The scores are adjusted to a scale of 12, even if a school has less than 4 indicators.
50% 43%27% 27% 15% 23%
34%30%
48% 48%
35%40%
15% 27% 25% 25%49% 38%
0%10%20%30%40%50%60%70%80%90%
100%
Staff Parent Staff Parent Staff Parent
Below averagestudent SEL
Averagestudent SEL
Above averagestudent SEL
Perc
enta
ge o
f sch
ools
SEL vs. Staff and Parent CC (N=874)
Below Average Average Above average
54% 50%24% 24% 13% 15%
33% 29%51% 51%
33%43%
14% 21% 26% 26%54% 43%
0%10%20%30%40%50%60%70%80%90%
100%
Staff Parent Staff Parent Staff Parent
Below averagestudent CC
Averagestudent CC
Above averagestudent CC
Perc
enta
ge o
f sch
ools
Student CC vs. Staff and Parent CC (N=974)
Below average Average Above average

EDPOLICYINCA.ORG
Heather Hough, Demetra Kalogrides, & Susanna Loeb | 19
Figure 8. School Total Scores on SEL and CC Measures as Reported by Students, Parents, and Staff
Note. N = 1,030.
3. Relationship Between School Indicators of SEL and CC and Other School Performance Indicators
The CORE districts aim to use the SEL and CC indicators for accountability and continuous improvement. To support these efforts, we explore how student-reported SEL and CC measures fit into a multiple-measure data system. First, we assess how SEL and CC measures are related individually to other indicators of school quality. Second, we ask whether the SEL and CC measures predict academic outcomes, not only on their own but also once we control for all other school measures in the administrative data. The goal of this second analysis is to assess the extent to which the SEL and CC measures provide information that goes beyond what the other non-academic measures provide. While SEL and CC may be important regardless of whether or not they predict academic outcomes, if they also predict academic outcomes above and beyond other measures, they are important as a predictor as well as on their own.
The relationships between SEL/CC and other measures. The CORE districts will use SEL and CC in conjunction with other measures of school performance, not solely on their own. As a result, it is useful to understand how similar SEL and CC are to CORE’s other measures of school performance. To explore the relationships, first we compute correlations in the school level metrics, again with shades of green reflecting stronger correlations (see Table 6). Consistent with Hough, Penner, and Witte’s recent analysis (2016), we see that the school level indicators generally do not show very high correlations, indicating that each of the measures reveals different aspects of school performance. Across the SEL and CC respondent groups, we see that the strongest correlations in elementary schools are between SEL and math scores (.48) and parent CC reports and a school’s EL redesignation rate (.40). In middle schools, there are moderate to strong correlations between SEL and math performance (.78), high school readiness (.61), chronic absence (.42), and suspension (.38), with similar correlations in high schools.
9% 9%7%
17% 17%
15%
9%10%
8%
0%2%4%6%8%
10%12%14%16%18%20%
4 5 6 7 8 9 10 11 12
Perc
enta
ge o
f sch
ools
Combined score on SEL & student/parent/staff CC
High on all SEL/CC reports
Low on all SEL/CC reports
20 | Using SEL and CC for Accountability and Continuous Improvement
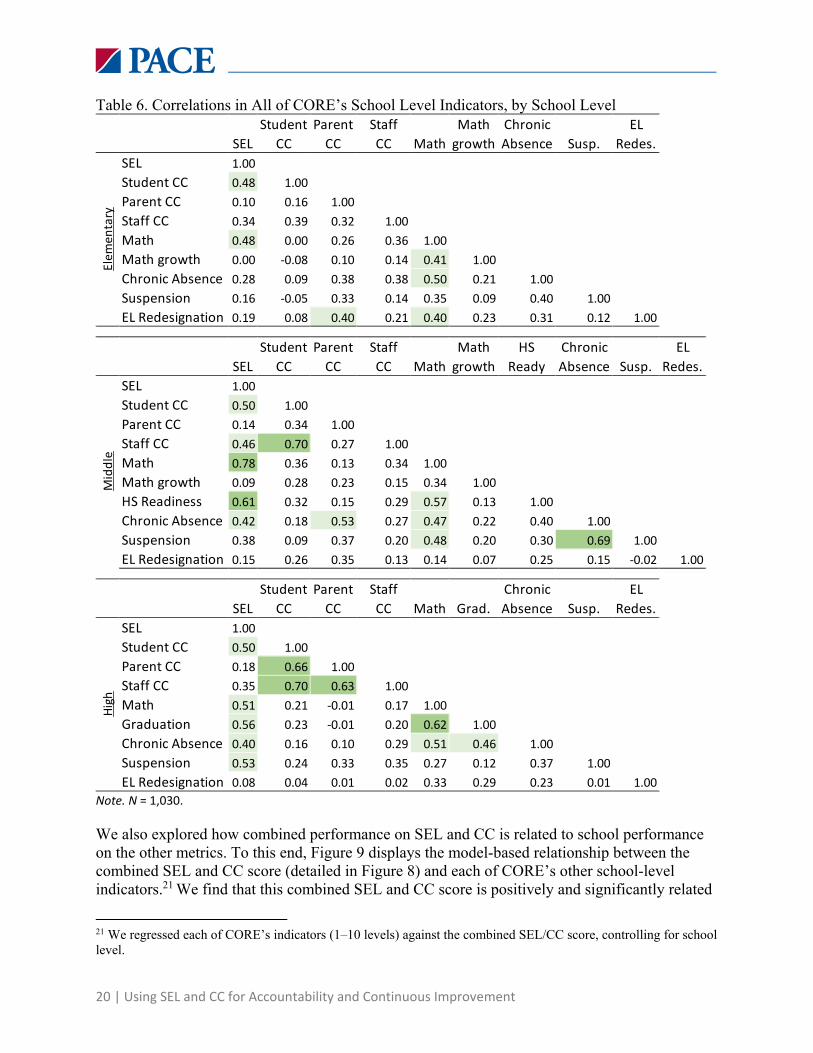
Table 6. Correlations in All of CORE’s School Level Indicators, by School Level
Note. N = 1,030. We also explored how combined performance on SEL and CC is related to school performance on the other metrics. To this end, Figure 9 displays the model-based relationship between the combined SEL and CC score (detailed in Figure 8) and each of CORE’s other school-level indicators.21 We find that this combined SEL and CC score is positively and significantly related
21 We regressed each of CORE’s indicators (1–10 levels) against the combined SEL/CC score, controlling for school level.
SELStudent
CCParent
CCStaff CC Math
Math growth
Chronic Absence Susp.
EL Redes.
SEL 1.00Student CC 0.48 1.00Parent CC 0.10 0.16 1.00Staff CC 0.34 0.39 0.32 1.00Math 0.48 0.00 0.26 0.36 1.00Math growth 0.00 -0.08 0.10 0.14 0.41 1.00Chronic Absence 0.28 0.09 0.38 0.38 0.50 0.21 1.00Suspension 0.16 -0.05 0.33 0.14 0.35 0.09 0.40 1.00EL Redesignation 0.19 0.08 0.40 0.21 0.40 0.23 0.31 0.12 1.00
SELStudent
CCParent
CCStaff CC Math
Math growth
HS Ready
Chronic Absence Susp.
EL Redes.
SEL 1.00Student CC 0.50 1.00Parent CC 0.14 0.34 1.00Staff CC 0.46 0.70 0.27 1.00Math 0.78 0.36 0.13 0.34 1.00Math growth 0.09 0.28 0.23 0.15 0.34 1.00HS Readiness 0.61 0.32 0.15 0.29 0.57 0.13 1.00Chronic Absence 0.42 0.18 0.53 0.27 0.47 0.22 0.40 1.00Suspension 0.38 0.09 0.37 0.20 0.48 0.20 0.30 0.69 1.00EL Redesignation 0.15 0.26 0.35 0.13 0.14 0.07 0.25 0.15 -0.02 1.00
SELStudent
CCParent
CCStaff CC Math Grad.
Chronic Absence Susp.
EL Redes.
SEL 1.00Student CC 0.50 1.00Parent CC 0.18 0.66 1.00Staff CC 0.35 0.70 0.63 1.00Math 0.51 0.21 -0.01 0.17 1.00Graduation 0.56 0.23 -0.01 0.20 0.62 1.00Chronic Absence 0.40 0.16 0.10 0.29 0.51 0.46 1.00Suspension 0.53 0.24 0.33 0.35 0.27 0.12 0.37 1.00EL Redesignation 0.08 0.04 0.01 0.02 0.33 0.29 0.23 0.01 1.00
Elem
enta
ryM
iddl
eHi
gh

EDPOLICYINCA.ORG
Heather Hough, Demetra Kalogrides, & Susanna Loeb | 21
to all of the other indicators in CORE’s measurement system, with the strongest relationships to math test scores and chronic absence. For example, a school at the lowest performance level on combined SEL/CC has a predicted chronic absence rank score of 3.9, and schools at the highest level of performance on SEL/CC have a rank score of 7.8. Other relationships are more variable. Suspension rates and math growth are least related to SEL and CC reports. Figure 9. Relationship Between Combined SEL and CC Score and Other School Indicators of School Performance
Note. N = 1,030. Predicting academic outcomes with SEL and CC surveys. The SEL and CC measures derived from the surveys provide the CORE districts with information about non-academic outcomes in schools. While recent policy, such as ESSA, encourages the use of such measures, it also requires that any such measures of “School Quality and Student Success” are related to key academic outcomes. Here we show that the SEL and CC measures are predictive of proficiency on math tests, academic growth in mathematics, graduation rate, and EL redesignation rate.22 In Figure 10, we show the percentage of variation explained in each of these academic outcomes by all four of the SEL and CC surveys (student-reported SEL, and student-, parent-, and staff-reported CC). We find that across all grade levels, the SEL and CC surveys are most predictive of math scores (54 percent of variation explained in elementary schools, 68 percent in middle schools, and 29 percent in high schools). There is substantially less variation in math growth score explained by SEL and CC (7 percent for elementary schools and 8 percent for middle schools), with graduation and EL redesignation in between. This analysis provides an indication
22 These are the academic measures required under ESSA, although CORE’s measures are not completely aligned with new requirements. For example, CORE’s measure of EL proficiency is slightly different than what is specified in ESSA. Rather than using only test score results to determine progress on English proficiency, the CORE Districts chose to report reclassification rates, which are a combination of language proficiency scores and academic performance (Carranza, 2015).
3
4
5
6
7
8
9
10
4 5 6 7 8 9 10 11 12
Pred
icted
rank
scor
e on
oth
er C
ORE
mea
sure
s,fo
r sch
ools
at e
ach
SEL/
CC co
mbi
ned
scor
e
Combined score on SEL & student/parent/staff CC
Math Math growth HS Readiness Graduation Chronic Absence Suspension EL Redesignation
Low on all SEL/CC reports
High on all SEL/CC reports

22 | Using SEL and CC for Accountability and Continuous Improvement
that SEL and CC surveys are useful as predictors of academic achievement in addition to being useful indicators on their own of a different dimension of school performance.
Figure 10. Percentage of Variation in Academic Outcomes Explained by SEL and CC Surveys
Note. N = 1,030. However, because of the additional costs associated with survey administration, it is worth asking whether the survey measures provide information about schools that the administrative records do not. District and state administrative records can also provide measures of non-academic outcomes such as absenteeism and disciplinary incidents. If the surveys are predictive above these other more easily collected measures, then they add value to our understanding of school performance; however, if they are not, then administering the surveys might not be worth the cost. One way of partially answering this question is to see whether the survey measures are predictive of academic measures not only on their own but also on top of the information provided by administrative data. Of course, prediction of academic measures is not the only use of these measures—even if they do not predict academic outcomes on top of the other measures, they might serve other important purposes. Nonetheless, the estimates in Figure 11 show that they are predictive.
In Figure 11 we show the proportion of variation in academic outcomes that is explained by the four separate SEL and CC indicators, after controlling for student demographics (percentage of students who are African American, Hispanic/Latino, EL, eligible for free/reduced lunch, and enrolled in special education) and CORE’s existing non-academic measures (chronic absence, suspension rates, and high school readiness in middle schools). We find that the SEL and CC surveys are predictive of each of the academic outcomes above available measures, although the percentage of variation explained is small and variable across indicators. When predicting math scores, SEL and CC survey measures combined predict 4 percent of the variation in elementary schools, 4 percent of the variation in middle schools, and 2 percent of the variation in high schools. SEL and CC survey measures similarly predict math growth and graduation. Even after controlling for student demographics and other available indicators, SEL and CC surveys are still
54%
68%
29%
7% 8%
23% 21%13% 1%
0%
10%
20%
30%
40%
50%
60%
70%
80%
ES MS HS ES MS HS ES MS HS
Math Math Growth Graduation EL Redesignation
Perc
enta
ge o
f var
iatio
n ex
plai
ned
in
acad
emic
outc
omes

EDPOLICYINCA.ORG
Heather Hough, Demetra Kalogrides, & Susanna Loeb | 23
slightly more predictive for EL redesignation; 13 percent of the variance is explained for elementary schools, 7 percent for middle schools, and 3 percent for high schools.
Figure 11. Percentage of Variation in Academic Outcomes Explained by SEL and CC Surveys, Controlling for School Demographics and Other School Quality Indicators
Note. N = 1,030. These results provide evidence that the survey-based SEL and CC measures do indeed provide information about test score performance above and beyond the information provided by the non-academic measures available in administrative records. While not within the scope of this report, these measures may well give insights into the processes by which schools improve their academic performance as well as how they contribute to student development in dimensions outside of the typical academic measures. When considering whether or not to include the surveys in a system of school performance measurement, however, leaders will need to consider whether the benefits outweigh the costs. This determination may depend on how equipped system actors are to respond to the new information provided by the surveys.23
4. Incorporating SEL and CC into School Performance Rank
One use of school quality measures is for the identification of schools in need of support and improvement. ESSA, for example, requires that the bottom 5 percent of schools be identified for this purpose. One way to select schools is through some form of school ranking.24 If the SEL and
23 In a recent PACE report, we showed that there is overwhelming support within the districts for measuring SEL and CC, because the measures better reflect the goals of educators in the CORE districts. However, district administrators and principals that we interviewed also expressed concerns that they do not yet know how to respond to the information provided by the indicators, which will ultimately limit the usefulness of the survey reports if that capacity is not built quickly (Marsh et al., 2016). 24 In a recent analysis, Hough et al. (2016) explore the tradeoffs in different ways of identifying schools in the bottom 5 percent. In this paper, the authors show that the use of a single summative score to identify schools is problematic because schools are rarely high or low on all measures, but rather the multiple measures illuminate
4% 4%
2%
5%6%
11%
13% 7%
3%
0%
10%
20%
30%
40%
50%
60%
70%
80%
90%
ES MS HS ES MS HS ES MS HS
Math Math Growth Graduation EL Redesignation
Perc
enta
ge o
f var
iatio
n ex
plai
ned
in
acad
emic
outc
omes
Student demographics Non-academic indicators SEL and CC surveys
24 | Using SEL and CC for Accountability and Continuous Improvement
CC surveys provide useful and different information about school performance, we should expect some change in how schools are ranked when integrating these measures into a comprehensive school measurement system.
To explore whether SEL and CC measures would change school rankings and categorization as low-performing, we created school rankings based on CORE’s summative score with and without including the SEL and CC survey-based measures. We find that the two instantiations of the CORE summative score are correlated at 0.98, which is extraordinarily high (1.00 is the maximum). This high correlation indicates that, across the schools, the inclusion of SEL and CC surveys would not dramatically change the rank of schools.
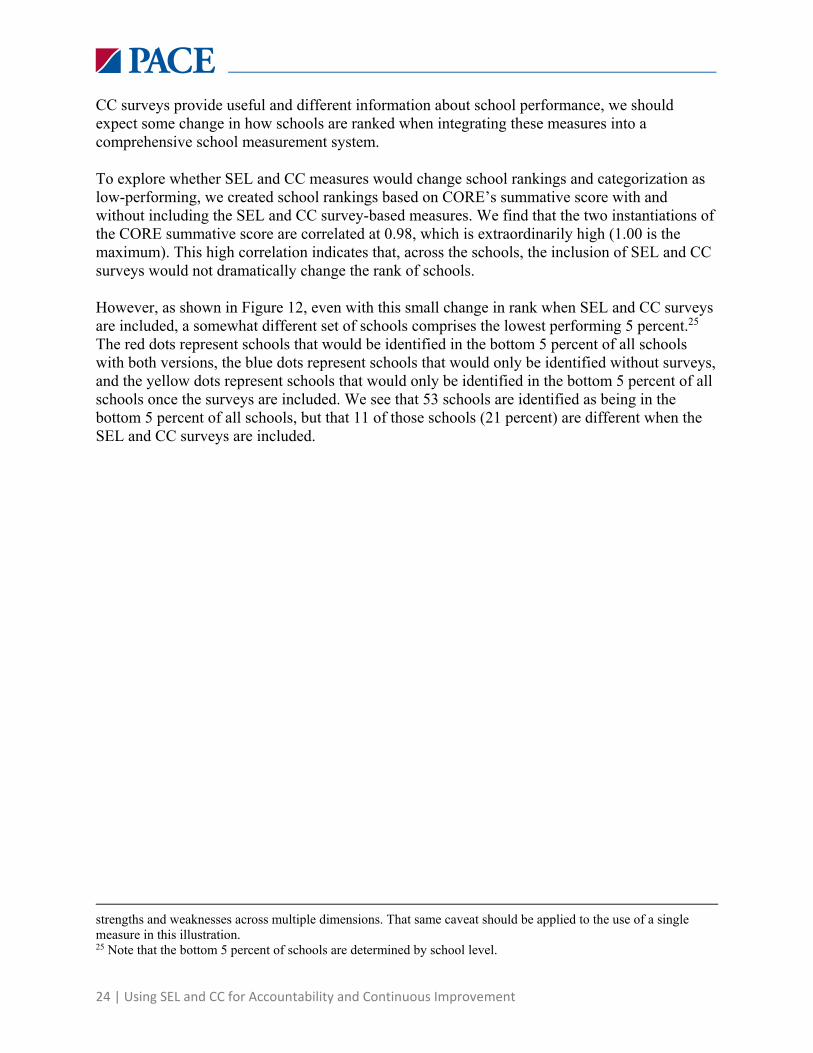
However, as shown in Figure 12, even with this small change in rank when SEL and CC surveys are included, a somewhat different set of schools comprises the lowest performing 5 percent.25 The red dots represent schools that would be identified in the bottom 5 percent of all schools with both versions, the blue dots represent schools that would only be identified without surveys, and the yellow dots represent schools that would only be identified in the bottom 5 percent of all schools once the surveys are included. We see that 53 schools are identified as being in the bottom 5 percent of all schools, but that 11 of those schools (21 percent) are different when the SEL and CC surveys are included.
strengths and weaknesses across multiple dimensions. That same caveat should be applied to the use of a single measure in this illustration. 25 Note that the bottom 5 percent of schools are determined by school level.

EDPOLICYINCA.ORG
Heather Hough, Demetra Kalogrides, & Susanna Loeb | 25
Figure 12. The Relationship Between CORE’s Measures With and Without SEL and CC Surveys
Note. N = 1,030. The sensitivity of the classification of schools to the bottom 5 percent is important to keep in mind. Even though the SEL and CC surveys combined account for only 16 percent of the total score, different schools fall into the lowest pool when these measures are included than when they are not. The schools that are included with one measure but not with the other measure are all low performing on both measures, just not quite in the lowest 5 percent. This phenomenon of instability when classifying schools is typical and points to the usefulness of considering the needs of a broad set of schools with low performance and not just the specific set of schools that fall into the bottom 5 percent on a single measure.
Discussion
Across the country, interest is growing in using measures of students’ social-emotional learning (SEL) and school culture/climate (CC) in school performance measurement systems. In this paper, we use data on such measures from the CORE districts to assess how they could be utilized in systems of accountability and continuous improvement. In particular, we assess the extent to which the measures vary across schools and the extent to which they vary across groups and between respondents within schools. We also compare the SEL and CC measures to other school-level measures of students’ academic and non-academic performance in order to better
26 | Using SEL and CC for Accountability and Continuous Improvement
understand whether the survey-based measures will add additional information to our collective understanding of school performance. We find that:
CORE’s SEL and CC measures distinguish between schools “above” and “below” average, but more fine-grained comparisons are less reliable.
In order for school-level measures to provide information about school performance, they must actually differ across schools. We find that schools do vary in both their SEL and CC reports, but that they do not vary as much in these dimensions as they do in academic achievement. As a result, while SEL and CC can distinguish the group of schools that are well above the mean from those that are well below the mean, they are not measured precisely enough to distinguish more than these blunt categories. For instance, if schools were grouped into 10 categories based on their SEL and CC, the schools in one category would not be statistically different from schools in the adjacent category.
The smaller school-level variation in SEL and CC could provide an indication of a limited “school effect” on the underlying constructs of social-emotional learning and school culture and climate, or it could indicate that the measures themselves are imprecise or in other ways problematic. The role of schools in developing SEL, in particular, needs further investigation. Even if schools are not currently contributing to students’ development of SEL at scale, research suggests that schools are capable of having a strong impact in this domain through implementation of school-based interventions (e.g., Durlak et al., 2011). Schools may not currently play a large role in students’ social-emotional development, though they could if more emphasis were put on the development of these skills at scale. However, the measurement of SEL and the supporting focus at the district level is new in CORE and to the national discussion of effective schools.
Schools with higher SEL also tend to have higher CC but the measures also demonstrate independence.
Schools that have higher SEL reports also tend to have higher CC reports, not only from students but also from teachers and parents. These positive relationships are evident across elementary, middle, and high schools. This consistency in reports supports the potential role of schools in developing SEL and CC, and reinforces the idea that school culture/climate contributes to students’ social-emotional learning.
However, while schools with higher SEL reports also often have higher CC reports, many schools are high on some indicators and low on others. This variation points to benefits of using the set of indicators to better understand how schools are performing on the SEL and CC domain rather than in an individual indicator. School performance across domains or respondent groups can provide information on useful avenues for improvement.
By better understanding why some schools are doing well on the social-emotional dimension, we will be in a better position to support schools that are struggling in these dimensions. We may also be better positioned for school improvement more generally, as these data paint a more comprehensive picture of schools’ challenges and successes. Moreover, by identifying schools
EDPOLICYINCA.ORG
Heather Hough, Demetra Kalogrides, & Susanna Loeb | 27
with particularly weak SEL or CC reports, we may be able to target resources for improvement where these resources are most needed and could be most effective.
SEL and CC data highlight performance gaps within schools.
On the SEL and CC measures, we find that there are significant gaps between student groups even within schools, highlighting the need for schools to understand these disparities and work to eliminate them. African American students report particularly low levels of self-management and social awareness. Hispanic students report particularly low levels of growth mindset and self-efficacy. African American students report lower levels of CC across all measures—supportive learning environment, connectedness, discipline, and safety. We find that these differences between groups of students persist even within schools, which demonstrates the importance of reporting SEL and CC measures by subgroup, and points to the importance of closing these within-school gaps.
These results also raise important questions about why schools are seeing these disparities. Some of these gaps may be outside of the school’s direct control, as we know that students’ development of social-emotional skills begins in infancy and is influenced by a range of family and neighborhood contexts, including poverty and trauma, which may also vary significantly across racial/ethnic groups (Berliner, 2009; Nucci, 2016). However, there is a vast body of research showing that students’ experiences within school differ by race/ethnicity, including well documented disparities in disciplinary practices and expectations for success (Bankston & Zhou, 2002; Gregory, Skiba, & Noguera, 2010; Lareau & Horvat, 1999; Lewis, 2003; Okonofua et al., 2016; Tenenbaum & Ruck, 2007; Warikoo & Carter, 2009; Watamura et al., 2011). These different experiences and treatment within schools could explain why African American students assess their schools’ culture and climate differently from their white peers, or why Hispanic/Latino students and students with disabilities report feeling less efficacious and less confident about success. Solving the problems revealed by these data will require a hard look at the systemic bias within schools, as well as a comprehensive approach to mediating the outside-of-school factors that may be contributing to gaps by subgroup.
SEL and CC measures are related to other academic and non-academic outcomes, but they add information that is not available in the commonly used administrative measures.
SEL and CC measures based on the surveys correlate with non-academic outcomes derived from administrative data (chronic absence, suspension rates, and high school readiness), and they predict schools’ academic outcomes (proficiency on math tests, academic growth in mathematics, graduation rate, and EL redesignation rate) on their own and after controlling for student demographics and the other non-academic measures. While SEL and CC indicators may be important regardless of whether or not they predict academic outcomes, this result indicates that they are important as a predictor, or perhaps leading indicator of school improvement, as well as on their own.
Since SEL and CC tend to show similar trends as both other non-academic measures and academic outcomes, school rankings based on CORE’s index measure are very similar whether or not survey-based SEL and CC measures are included. While the rankings are strikingly similar, the identification of the bottom 5 percent of schools is sensitive even to small changes.

28 | Using SEL and CC for Accountability and Continuous Improvement
As a result, the inclusion or exclusion of these survey measures affects which schools are identified in this lowest performing group. This result further points to the sensitivity of this classification and the potential benefit of considering a wider range of measures when identifying schools in need of improvement.
Additional research could further illuminate the advantages and disadvantages of including survey-based SEL and CC measures in systems of accountability and continuous improvement.
As Duckworth and Yeager (2015) have argued, measures derived from survey responses can be imprecise and subject to manipulation if included in an accountability system. Schools with only moderately different scores on these measures may not actually differ in their true score. Moreover, true differences in SEL and CC across schools may not be the result of school actions but of differences in the context or people in the schools.
With these caveats in mind, the patterns in the data suggest that the survey measures are providing some information about differences across schools that were likely invisible in data systems until now. When used together with other measures, the new SEL and CC measures may inform a broader understanding of a school’s strengths and weaknesses and prompt action on a new dimension.
The results presented in this paper are just a starting point for understanding survey-based measures of SEL and CC and how these measures might be used in systems of school improvement. Several important dimensions of these new indicators are yet unexplored. First, we lack an understanding of students’ cognitive process when answering this kind of survey question. Without this understanding, we cannot eliminate the possibility that the subgroup gaps in SEL and CC are due to reference bias or cultural bias, which are common concerns when measuring self-reports of experiences, perceptions, or behaviors (DiPerna & Elliott, 1999; Malecki & Elliot, 2002; Wentzel, 1994). Second, we lack an understanding of how students’ in-school experiences, including which teachers they have and which other students are in their classrooms, affect SEL and CC reports and the improvement of SEL and CC over time. Third, while our analyses have shown a correlation between SEL and CC and academic outcomes, we do not yet know whether changes in CC lead to changes in SEL, or whether SEL and CC reports lead to changes in academic outcomes. Furthermore, more research is needed on the role schools play in the development of these mindsets, habits, and skills at scale. Fourth, because the measures have not been used for high-stakes decision-making, we do not know the extent to which educators will counterproductively game the measures in such a setting. As a clear example, if teachers were rewarded for positive reports of CC, they would likely give more positive reports of CC as their own survey responses. School leaders would be unlikely to set up such clear incentives to game survey responses but even less obvious incentives could reduce the validity of the survey measures. Finally, if SEL and CC measures are to be used to support authentic continuous improvement, schools and districts must have clear guidance about what to do to improve the measured outcomes, which requires the collaboration of researchers and practitioners in schools, districts, and beyond.

EDPOLICYINCA.ORG
Heather Hough, Demetra Kalogrides, & Susanna Loeb | 29
References
Allensworth, E. M., & Easton, J. Q. (2007). What Matters for Staying On-Track and Graduating in Chicago Public High Schools: A Close Look at Course Grades, Failures, and Attendance in the Freshman Year. Research Report. Consortium on Chicago School Research.
Almlund, M., Duckworth, A. L., Heckman, J. J., & Kautz, T. D. (2011). Personality psychology and economics. National Bureau of Economic Research. Retrieved from http://www.nber.org/papers/w16822.
Aronson, J., Cohen, G., & McColskey, W. (2009). Reducing Stereotype Threat in Classrooms: A Review of Social-Psychological Intervention Studies on Improving the Achievement of Black Students. Issues & Answers. REL 2009-076. Regional Educational Laboratory Southeast.
Bankston, C. L., & Zhou, M. (2002). Being Well vs. Doing Well: Self‐Esteem and School Performance Among Immigrant and Nonimmigrant Racial and Ethnic Groups. International Migration Review, 36(2), 389–415.
Battistich, V., Schaps, E., & Wilson, N. (2004). Effects of an elementary school intervention on students' “connectedness” to school and social adjustment during middle school. Journal of Primary Prevention, 24(3), 243–262.
Berkowitz, R., Moore, H., Astor, R. A., & Benbenishty, R. (2016). A Research Synthesis of the Associations Between Socioeconomic Background, Inequality, School Climate, and Academic Achievement. Review of Educational Research. doi:0034654316669821.
Berliner, D. C. (2009). Poverty and potential: Out-of-school factors and school success. Education Policy Research Unit.
Blad, E. (2015, December 10). CORE Districts to Share Social-Emotional Measures to Inform Accountability Plans. Education Week. Retrieved from http://blogs.edweek.org/edweek/rulesforengagement/2015/12/core_districts__social-emotional_measures_to_inform_accountability_essa.html
Blum, R. W., Libbey, H. P., Bishop, J. H., & Bishop, M. (2004). School connectedness–strengthening health and education outcomes for teenagers. Journal of School Health, 74(7), 231–235.
Bornstein, D. (2015). Teaching social skills to improve grades and lives. Retrieved from http://opinionator.blogs.nytimes.com/2015/07/24/building-social-skills-to-do-well-in-math/?_r=0.
California Department of Education. (2016). Preparing All Students for College, Career, Life, and Leadership in the 21st Century. Sacramento, CA.
Carranza, R. (2015) How best to measure success with English learners. Ed Source. Retrieved from https://edsource.org/2015/holding-school-districts-accountable-for-success-with-english-learners/87121.
Casner-Lotto, J., Barrington, L., & Wright, M. (2006). Are they really ready to work? Employers’ perspectives on the basic knowledge and applied skills of new entrants to the 21st Century U.S. workforce. Retrieved from http://www.p21.org/storage/documents/FINAL_REPORT_PDF09-29-06.pdf
30 | Using SEL and CC for Accountability and Continuous Improvement
Conard, M. A. (2006). Aptitude is not enough: How personality and behavior predict academic performance. Journal of Research in Personality, 40(3), 339–346.
de Ridder, D. T., Lensvelt-Mulders, G., Finkenauer, C., Stok, F. M., & Baumeister, R. F. (2012). Taking stock of self-control: a meta-analysis of how trait self-control relates to a wide range of behaviors. Personality and Social Psychology Review, 16(1), 76–99.
DiPerna, J. C., & Elliott, S. N. (1999). Development and validation of the academic competence evaluation scales. Journal of Psychoeducational Assessment, 17(3), 207–225.
Duckworth, A., & Yeager, D. S. (2015). Measurement matters: assessing personal qualities other than cognitive ability for educational purposes. Educational Researcher, 44(4), 237–251.
Duckworth, A., & Carlson, S. M. (2013). Self-regulation and school success. Self-regulation and autonomy: Social and developmental dimensions of human conduct, 40, 208.
Duckworth, A., Tsukayama, E., & May, H. (2010). Establishing causality using longitudinal hierarchical linear modeling: An illustration predicting achievement from self-control. Social psychological and personality science.
Durlak, J. A., Weissberg, R. P., Dymnicki, A. B., Taylor, R. D., & Schellinger, K. B. (2011). The impact of enhancing students’ social and emotional learning: A meta‐analysis of school‐based universal interventions. Child development, 82(1), 405–432.
Fitzsimons, G. M., & Finkel, E. J. (2011). The effects of self-regulation on social relationships. Handbook of self-regulation: Research, theory, and applications, 407–421.
Gregory, A., Skiba, R. J., & Noguera, P. A. (2010). The achievement gap and the discipline gap two sides of the same coin? Educational Researcher, 39(1), 59–68.
Hamre, B. K., & Pianta, R. C. (2006). Student–Teacher Relationships.
Heckman, J., Pinto, R., & Savelyev, P. (2013). Understanding the mechanisms through which an influential early childhood program boosted adult outcomes. The American Economic Review, 103(6), 2052–2086.
Hough, H. J., Penner, E., & Witte, J. (2016). Identity Crisis: Multiple Measures and the Identification of Schools under ESSA. Policy Analysis for California Education. Retrieved from http://www.edpolicyinca.org/publications/identity-crisis-multiple-measures-and-identification-schools-under-essa.
Jennings, P. A., & Greenberg, M. T. (2009). The prosocial classroom: Teacher social and emotional competence in relation to student and classroom outcomes. Review of Educational Research, 79(1), 491–525.
Krachman, S. B., Arnold, R., & LaRocca, R. (2016). Expanding the definition of student success: A case study of the CORE Districts. Retrieved from http://www.transformingeducation.org/core-toolkit/
Lareau, A., & Horvat, E. M. (1999). Moments of social inclusion and exclusion: Race, class, and cultural capital in family–school relationships. Sociology of Education, 37–53.

EDPOLICYINCA.ORG
Heather Hough, Demetra Kalogrides, & Susanna Loeb | 31
Lewis, A. (2003). Race in the schoolyard: Negotiating the color line in classrooms and communities: Rutgers University Press.
Malecki, C. K., & Elliot, S. N. (2002). Children's social behaviors as predictors of academic achievement: A longitudinal analysis. School Psychology Quarterly, 17(1), 1.
Marsh, J., Bush-Mecenas, S., & Hough, H. J. (2016). At the Forefront of the New Accountability Era: Early Implementation Findings from California’s CORE Districts. Policy Analysis for California Education. Retrieved from http://www.edpolicyinca.org/publications/at-the-forefront.
McCormick, M. P., Cappella, E., O’Connor, E. E., & McClowry, S. G. (2015). Context matters for social-emotional learning: Examining variation in program impact by dimensions of school climate. American journal of community psychology, 56(1-2), 101–119.
Nagaoka, J., Farrington, C. A., Ehrlich, S. B., & Heath, R. D. (2015). Foundations for Young Adult Success: A Developmental Framework. Concept Paper for Research and Practice. University of Chicago Consortium on Chicago School Research.
Nucci, L. (2016). Character: A Multi-faceted Developmental System. Paper presented at the Workshop on Character Education, Washington, D.C. http://sites.nationalacademies.org/cs/groups/dbassesite/documents/webpage/dbasse_173496.pdf
Okonofua, J. A., Walton, G. M., & Eberhardt, J. L. (2016). A Vicious Cycle: A Social–Psychological Account of Extreme Racial Disparities in School Discipline. Perspectives on Psychological Science, 11(3), 381–398.
Tenenbaum, H. R., & Ruck, M. D. (2007). Are teachers' expectations different for racial minority than for European American students? A meta-analysis. Journal of Educational Psychology, 99(2), 253.
Voight, A., Hanson, T., O’Malley, M., & Adekanye, L. (2015). The Racial School Climate Gap: Within‐School Disparities in Students’ Experiences of Safety, Support, and Connectedness. American Journal of Community Psychology, 56(3-4), 252–267.
Warikoo, N., & Carter, P. (2009). Cultural explanations for racial and ethnic stratification in academic achievement: A call for a new and improved theory. Review of Educational Research, 79(1), 366–394.
Watamura, S. E., Phillips, D. A., Morrissey, T. W., McCartney, K., & Bub, K. (2011). Double jeopardy: Poorer social‐emotional outcomes for children in the NICHD SECCYD experiencing home and child‐care environments that confer risk. Child development, 82(1), 48–65.
Wentzel, K. R. (1994). Relations of social goal pursuit to social acceptance, classroom behavior, and perceived social support. Journal of Educational Psychology, 86(2), 173.
West, M. R. (2016) Should non-cognitive skills be included in school accountability systems? Preliminary evidence from California’s CORE districts. Vol. 29. Evidence Speaks. Brookings Institution. Retrieved from https://www.brookings.edu/research/should-non-cognitive-skills-be-included-in-school-accountability-systems-preliminary-evidence-from-californias-core-districts/
West, M. R., Kraft, M., Dow, A. W., Scherer, E., Gabrieli, C. F., & Gabrieli, J. D. (2016). Re-thinking high school readiness: The relationship between cognitive and non-cognitive skills, high school

32 | Using SEL and CC for Accountability and Continuous Improvement
performance, and on-time graduation. Paper presented at the Association for Education Finance and Policy, Denver, CO.
West, M. R., Kraft, M. A., Finn, A. S., Martin, R. E., Duckworth, A. L., Gabrieli, C. F., & Gabrieli, J. D. (2015). Promise and Paradox: Measuring Students’ Non-Cognitive Skills and the Impact of Schooling. Educational Evaluation and Policy Analysis, doi:0162373715597298.
West, M. R., Scherer, E., & Dow, A. W. (2016). Measuring social-emotional skills at scale: Evidence from California’s CORE districts. Paper presented at the Association of Education Finance and Policy, Denver, CO.
Zernike, K. (2016, February 29). Testing for joy and grit: Schools nationwide push to measure students' emotional skills. The New York Times. Retrieved from http://www.nytimes.com/2016/03/01/us/testing-for-joy-and-grit-schools-nationwide-push-to-measure-students-emotional-skills.html
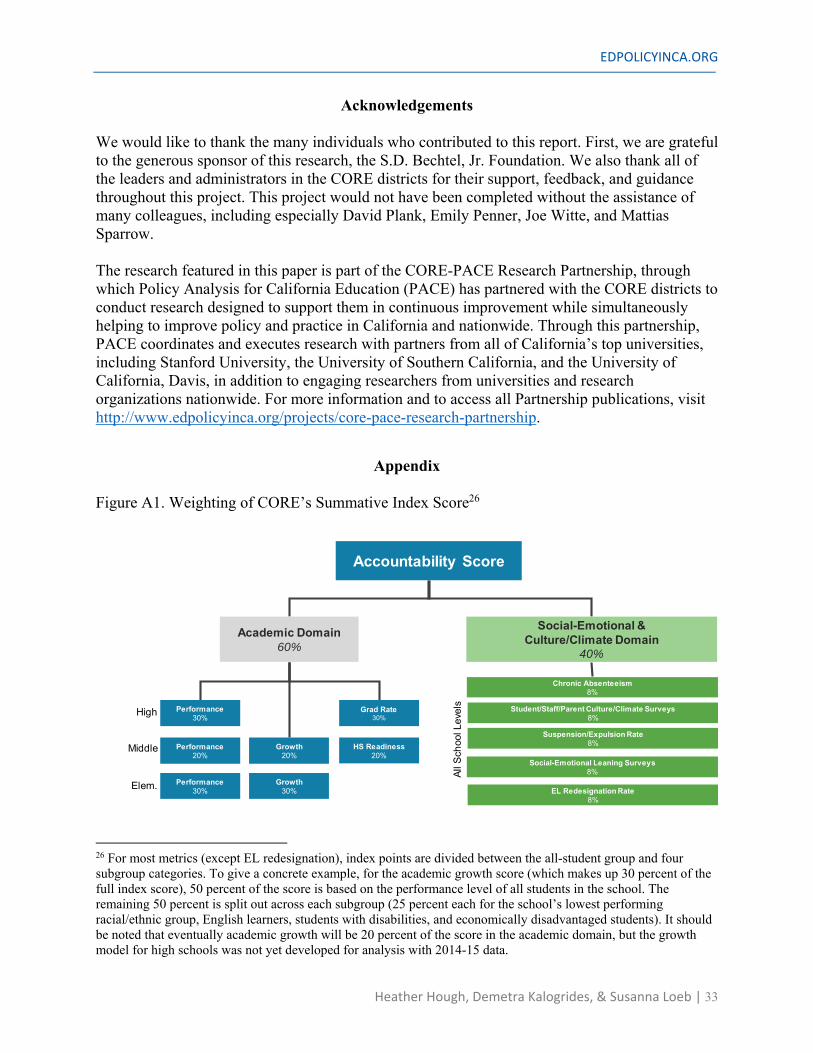
EDPOLICYINCA.ORG
Heather Hough, Demetra Kalogrides, & Susanna Loeb | 33
Acknowledgements
We would like to thank the many individuals who contributed to this report. First, we are grateful to the generous sponsor of this research, the S.D. Bechtel, Jr. Foundation. We also thank all of the leaders and administrators in the CORE districts for their support, feedback, and guidance throughout this project. This project would not have been completed without the assistance of many colleagues, including especially David Plank, Emily Penner, Joe Witte, and Mattias Sparrow. The research featured in this paper is part of the CORE-PACE Research Partnership, through which Policy Analysis for California Education (PACE) has partnered with the CORE districts to conduct research designed to support them in continuous improvement while simultaneously helping to improve policy and practice in California and nationwide. Through this partnership, PACE coordinates and executes research with partners from all of California’s top universities, including Stanford University, the University of Southern California, and the University of California, Davis, in addition to engaging researchers from universities and research organizations nationwide. For more information and to access all Partnership publications, visit http://www.edpolicyinca.org/projects/core-pace-research-partnership.
Appendix
Figure A1. Weighting of CORE’s Summative Index Score26
26 For most metrics (except EL redesignation), index points are divided between the all-student group and four subgroup categories. To give a concrete example, for the academic growth score (which makes up 30 percent of the full index score), 50 percent of the score is based on the performance level of all students in the school. The remaining 50 percent is split out across each subgroup (25 percent each for the school’s lowest performing racial/ethnic group, English learners, students with disabilities, and economically disadvantaged students). It should be noted that eventually academic growth will be 20 percent of the score in the academic domain, but the growth model for high schools was not yet developed for analysis with 2014-15 data.
Accountability Score
Social-Emotional & Culture/Climate Domain
40%
High
Middle
Elem.
Academic Domain60%
Performance30%
Grad Rate30%
All S
choo
l Lev
els
Performance20%
Growth20%
Performance30%
Growth30%
HS Readiness 20%
Chronic Absenteeism8%
Suspension/Expulsion Rate8%
Social-Emotional Leaning Surveys8%
Student/Staff/Parent Culture/Climate Surveys8%
EL Redesignation Rate8%
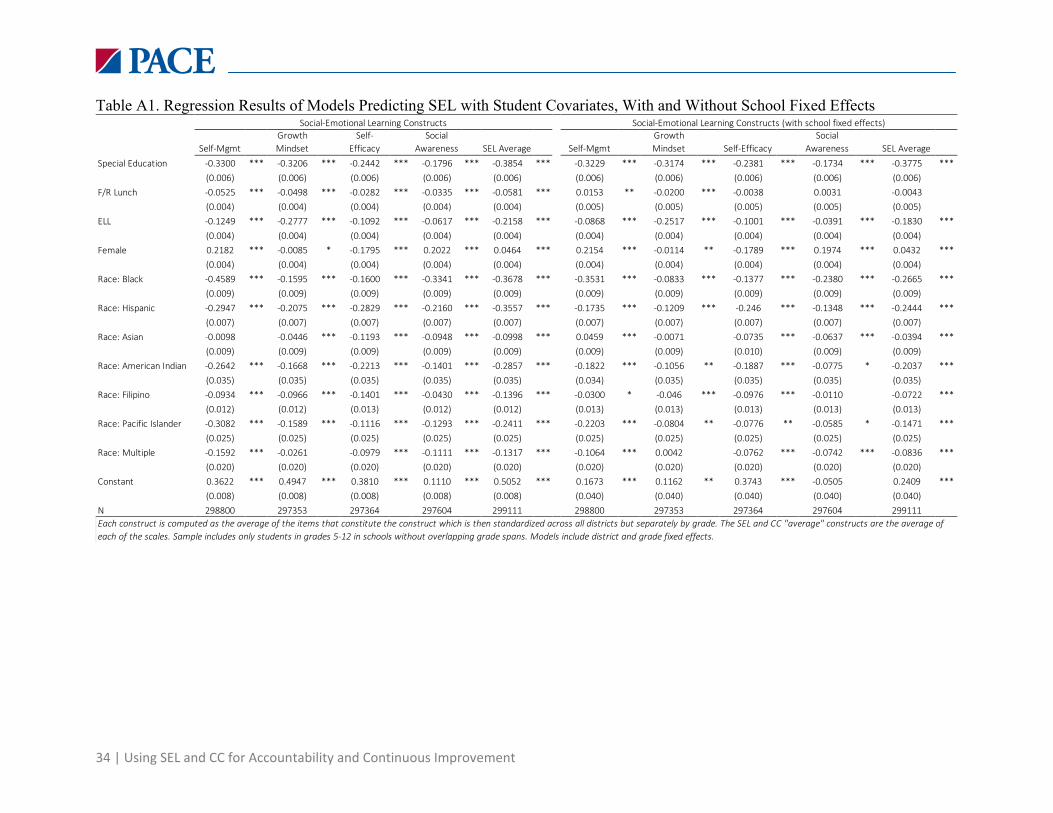
34 | Using SEL and CC for Accountability and Continuous Improvement
Table A1. Regression Results of Models Predicting SEL with Student Covariates, With and Without School Fixed Effects
Self-MgmtGrowth Mindset
Self-Efficacy
Social Awareness SEL Average Self-Mgmt
Growth Mindset Self-Efficacy
Social Awareness SEL Average
Special Education -0.3300 *** -0.3206 *** -0.2442 *** -0.1796 *** -0.3854 *** -0.3229 *** -0.3174 *** -0.2381 *** -0.1734 *** -0.3775 *** (0.006) (0.006) (0.006) (0.006) (0.006) (0.006) (0.006) (0.006) (0.006) (0.006)F/R Lunch -0.0525 *** -0.0498 *** -0.0282 *** -0.0335 *** -0.0581 *** 0.0153 ** -0.0200 *** -0.0038 0.0031 -0.0043 (0.004) (0.004) (0.004) (0.004) (0.004) (0.005) (0.005) (0.005) (0.005) (0.005)ELL -0.1249 *** -0.2777 *** -0.1092 *** -0.0617 *** -0.2158 *** -0.0868 *** -0.2517 *** -0.1001 *** -0.0391 *** -0.1830 *** (0.004) (0.004) (0.004) (0.004) (0.004) (0.004) (0.004) (0.004) (0.004) (0.004)Female 0.2182 *** -0.0085 * -0.1795 *** 0.2022 *** 0.0464 *** 0.2154 *** -0.0114 ** -0.1789 *** 0.1974 *** 0.0432 *** (0.004) (0.004) (0.004) (0.004) (0.004) (0.004) (0.004) (0.004) (0.004) (0.004)Race: Black -0.4589 *** -0.1595 *** -0.1600 *** -0.3341 *** -0.3678 *** -0.3531 *** -0.0833 *** -0.1377 *** -0.2380 *** -0.2665 *** (0.009) (0.009) (0.009) (0.009) (0.009) (0.009) (0.009) (0.009) (0.009) (0.009)Race: Hispanic -0.2947 *** -0.2075 *** -0.2829 *** -0.2160 *** -0.3557 *** -0.1735 *** -0.1209 *** -0.246 *** -0.1348 *** -0.2444 *** (0.007) (0.007) (0.007) (0.007) (0.007) (0.007) (0.007) (0.007) (0.007) (0.007)Race: Asian -0.0098 -0.0446 *** -0.1193 *** -0.0948 *** -0.0998 *** 0.0459 *** -0.0071 -0.0735 *** -0.0637 *** -0.0394 *** (0.009) (0.009) (0.009) (0.009) (0.009) (0.009) (0.009) (0.010) (0.009) (0.009)Race: American Indian -0.2642 *** -0.1668 *** -0.2213 *** -0.1401 *** -0.2857 *** -0.1822 *** -0.1056 ** -0.1887 *** -0.0775 * -0.2037 *** (0.035) (0.035) (0.035) (0.035) (0.035) (0.034) (0.035) (0.035) (0.035) (0.035)Race: Filipino -0.0934 *** -0.0966 *** -0.1401 *** -0.0430 *** -0.1396 *** -0.0300 * -0.046 *** -0.0976 *** -0.0110 -0.0722 *** (0.012) (0.012) (0.013) (0.012) (0.012) (0.013) (0.013) (0.013) (0.013) (0.013)Race: Pacific Islander -0.3082 *** -0.1589 *** -0.1116 *** -0.1293 *** -0.2411 *** -0.2203 *** -0.0804 ** -0.0776 ** -0.0585 * -0.1471 *** (0.025) (0.025) (0.025) (0.025) (0.025) (0.025) (0.025) (0.025) (0.025) (0.025)Race: Multiple -0.1592 *** -0.0261 -0.0979 *** -0.1111 *** -0.1317 *** -0.1064 *** 0.0042 -0.0762 *** -0.0742 *** -0.0836 *** (0.020) (0.020) (0.020) (0.020) (0.020) (0.020) (0.020) (0.020) (0.020) (0.020)Constant 0.3622 *** 0.4947 *** 0.3810 *** 0.1110 *** 0.5052 *** 0.1673 *** 0.1162 ** 0.3743 *** -0.0505 0.2409 *** (0.008) (0.008) (0.008) (0.008) (0.008) (0.040) (0.040) (0.040) (0.040) (0.040)N 298800 297353 297364 297604 299111 298800 297353 297364 297604 299111
Social-Emotional Learning Constructs Social-Emotional Learning Constructs (with school fixed effects)
Each construct is computed as the average of the items that constitute the construct which is then standardized across all districts but separately by grade. The SEL and CC "average" constructs are the average of each of the scales. Sample includes only students in grades 5-12 in schools without overlapping grade spans. Models include district and grade fixed effects.

EDPOLICYINCA.ORG
Heather Hough, Demetra Kalogrides, & Susanna Loeb | 35
Table A2. Regression Results of Models Predicting CC with Student Covariates, With and Without School Fixed Effects
Supportive
LearningConnected-
ness Discipine SafetyStudent CC
AverageSupportive
LearningConnected-
ness Discipine SafetyStudent CC
AverageSpecial Education -0.0424 *** -0.0186 ** -0.0208 *** -0.1779 *** -0.0845 *** -0.0323 *** -0.0118 + -0.0105 + -0.1738 *** -0.0746 *** (0.006) (0.006) (0.006) (0.006) (0.006) (0.006) (0.006) (0.006) (0.006) (0.006)F/R Lunch 0.0380 *** -0.0169 *** 0.0207 *** -0.0197 *** 0.0057 0.0354 *** 0.0202 *** 0.0370 *** -0.0015 0.0296 *** (0.004) (0.004) (0.004) (0.004) (0.004) (0.005) (0.005) (0.005) (0.005) (0.005)ELL 0.0305 *** 0.0375 *** 0.0630 *** -0.0440 *** 0.0245 *** 0.0355 *** 0.0624 *** 0.0837 *** -0.0282 *** 0.0472 *** (0.004) (0.004) (0.004) (0.004) (0.004) (0.004) (0.004) (0.004) (0.004) (0.004)Female 0.0550 *** -0.0052 0.0552 *** 0.0394 *** 0.0453 *** 0.0528 *** -0.0101 ** 0.0505 *** 0.0374 *** 0.0407 *** (0.004) (0.004) (0.004) (0.004) (0.004) (0.004) (0.004) (0.004) (0.004) (0.004)Race: Black -0.1410 *** -0.3405 *** -0.2245 *** -0.1312 *** -0.2796 *** -0.0818 *** -0.1972 *** -0.1109 *** -0.0430 *** -0.1440 *** (0.009) (0.009) (0.009) (0.009) (0.009) (0.010) (0.009) (0.009) (0.009) (0.009)Race: Hispanic 0.0019 -0.0966 *** 0.0037 0.0997 *** -0.0059 0.0140 + -0.0187 * 0.0458 *** 0.1544 *** 0.0576 *** (0.007) (0.007) (0.007) (0.007) (0.007) (0.007) (0.007) (0.007) (0.007) (0.007)Race: Asian 0.0900 *** -0.0418 *** 0.0620 *** 0.1220 *** 0.0661 *** 0.0963 *** -0.0242 * 0.0649 *** 0.1318 *** 0.0793 *** (0.009) (0.009) (0.009) (0.009) (0.009) (0.010) (0.010) (0.009) (0.009) (0.009)Race: American Indian -0.0197 -0.1224 *** -0.0558 -0.0164 -0.0709 * 0.0092 -0.0477 -0.0026 0.0361 0.0006 (0.037) (0.037) (0.036) (0.035) (0.036) (0.036) (0.036) (0.035) (0.035) (0.035)Race: Filipino 0.1830 *** 0.0378 ** 0.0826 *** -0.0091 0.0898 *** 0.1816 *** 0.0670 *** 0.0866 *** 0.0275 * 0.1147 *** (0.013) (0.013) (0.013) (0.012) (0.013) (0.013) (0.013) (0.013) (0.013) (0.013)Race: Pacific Islander 0.1735 *** 0.0120 0.0436 + 0.0228 0.0730 ** 0.2020 *** 0.1011 *** 0.1058 *** 0.0935 *** 0.1576 *** (0.026) (0.026) (0.026) (0.025) (0.025) (0.026) (0.025) (0.025) (0.025) (0.025)Race: Multiple 0.0010 -0.1045 *** -0.0577 ** 0.0141 -0.0489 * 0.0050 -0.0812 *** -0.0461 * 0.0266 -0.0314 (0.021) (0.021) (0.020) (0.020) (0.020) (0.020) (0.020) (0.020) (0.020) (0.020)Constant -0.0969 *** -0.0127 -0.1393 *** 0.1201 *** -0.0176 * 0.5933 *** 0.4953 *** 0.4964 *** 0.1016 ** 0.5820 *** (0.008) (0.008) (0.008) (0.008) (0.008) (0.040) (0.040) (0.039) (0.039) (0.039)N 287475 286678 295464 294555 298094 287475 286678 295464 294555 298094
Culture/Climate Constructs Culture/Climate Constructs (with school fixed effects)
Each construct is computed as the average of the items that constitute the construct which is then standardized across all districts but separately by grade. The SEL and CC "average" constructs are the average of each of the scales. Sample includes only students in grades 5-12 in schools without overlapping grade spans. Models include district and grade fixed effects.

36 | Using SEL and CC for Accountability and Continuous Improvement
Table A3. Full Correlations in CC Respondent Groups, by Construct
Note. N = 1,030.
Supp
ortiv
e Le
arni
ng
Conn
ecte
dnes
s
Disc
iplin
e
Safe
ty
Supp
ortiv
e Le
arni
ng
Conn
ecte
dnes
s
Disc
iplin
e
Safe
ty
Supp
ortiv
e Le
arni
ng
Conn
ecte
dnes
s
Disc
iplin
e
Safe
ty
Supportive Learning 1.00Connectedness 0.78 1.00Discipline 0.74 0.62 1.00Safety 0.36 0.49 0.36 1.00Supportive Learning 0.06 0.23 0.12 0.24 1.00Connectedness -0.02 0.12 0.05 0.13 0.87 1.00Discipline 0.15 0.24 0.25 0.23 0.87 0.82 1.00Safety -0.07 0.18 -0.06 0.22 0.75 0.70 0.61 1.00Supportive Learning 0.14 0.20 0.18 0.30 0.18 0.11 0.14 0.17 1.00Connectedness 0.17 0.25 0.16 0.25 0.23 0.21 0.21 0.21 0.55 1.00Discipline 0.21 0.27 0.27 0.37 0.19 0.12 0.24 0.19 0.62 0.58 1.00Safety 0.21 0.42 0.20 0.48 0.37 0.25 0.29 0.43 0.49 0.48 0.58 1.00Supportive Learning 1.00Connectedness 0.87 1.00Discipline 0.88 0.85 1.00Safety 0.47 0.46 0.44 1.00Supportive Learning 0.25 0.33 0.30 0.48 1.00Connectedness 0.03 0.10 0.01 0.32 0.84 1.00Discipline 0.15 0.23 0.23 0.43 0.93 0.87 1.00Safety 0.24 0.51 0.35 0.26 0.63 0.57 0.57 1.00Supportive Learning 0.51 0.56 0.58 0.37 0.29 0.05 0.27 0.27 1.00Connectedness 0.44 0.45 0.41 0.37 0.15 0.03 0.11 0.16 0.62 1.00Discipline 0.53 0.55 0.61 0.44 0.17 -0.04 0.16 0.22 0.73 0.71 1.00Safety 0.56 0.72 0.70 0.43 0.36 0.09 0.29 0.53 0.67 0.51 0.69 1.00Supportive Learning 1.00Connectedness 0.89 1.00Discipline 0.78 0.74 1.00Safety 0.54 0.53 0.53 1.00Supportive Learning 0.64 0.58 0.61 0.46 1.00Connectedness 0.55 0.47 0.42 0.35 0.79 1.00Discipline 0.57 0.45 0.60 0.45 0.85 0.86 1.00Safety 0.44 0.58 0.49 0.43 0.56 0.52 0.54 1.00Supportive Learning 0.41 0.40 0.53 0.33 0.43 0.26 0.43 0.30 1.00Connectedness 0.62 0.56 0.57 0.27 0.55 0.56 0.60 0.42 0.67 1.00Discipline 0.44 0.44 0.69 0.32 0.45 0.35 0.53 0.39 0.73 0.66 1.00Safety 0.58 0.63 0.71 0.43 0.53 0.37 0.49 0.62 0.57 0.53 0.66 1.00
Stud
ent
Pare
ntSt
aff
Stud
ent
Pare
ntSt
aff
Student Parent StaffSt
uden
tPa
rent
Staf
f
Elem
enta
ryM
iddl
eHi
gh

http://edpolicyinca.org