using six sigma tools in a lean environment - aimcal.org shainin (september 26, 1914 – january 7,...
TRANSCRIPT

Problem-solving Techniques for Use in a Lean EnvironmentUsing Six Sigma Tools in a Lean Environment
© ABBA Roller, LLC, 2012—Presented at AIMCAL 2012 Technical Conference

Agenda
11 Introduction
77 Validation
2.12.1 Multi-Variable Analysis
55 Variable Search
22 Clue Generation
66 Full Factorial Analysis
2.22.2 Concentration Chart
2.32.3 Component Search
2.42.4 Paired Comparison
2.52.5 Product/Process Search

IntroductionThe Lean “Wall”
© ABBA Roller, LLC, 2012—Presented at AIMCAL 2012 Technical Conference
Your Lean Journey is well underway

IntroductionThe Lean “Wall”
© ABBA Roller, LLC, 2012—Presented at AIMCAL 2012 Technical Conference
5S Is Complete
Start Sort Set in Order Shine Standardize Sustain

IntroductionThe Lean “Wall”
© ABBA Roller, LLC, 2012—Presented at AIMCAL 2012 Technical Conference
All Waste Sources Identified

IntroductionThe Lean “Wall”
© ABBA Roller, LLC, 2012—Presented at AIMCAL 2012 Technical Conference
Current and Future State Value Stream Maps CompleteVSMCurrentState.igx
State Street Assembly
12000 L6400 RTray = 20 pieces2 Shifts
200 T
STAMPING
C/T = 1 secs.C/O = 1 hoursUptime = 85%27600 secs. avail.EPE = 2 weeks
1
5 days
1 seconds
7.61 days
39 seconds
1.85 days
46 seconds
2.66 days
62 seconds
2 days
40 seconds
4.5 days lead time = 23.6 days
VA/T = 188 secondsTraveled = 38.3 yards
8.33 yards 20 yards 1.67 yards 6.67 yards 1.67 yardsTravel
S. WELD #1
C/T = 39 secs.C/O = 10 minutesUptime = 100%2 Shifts27600 secs. avail.
1
S. WELD #2
C/T = 46 secs.C/O = 10 minutesUptime = 80%2 Shifts27600 secs. avail.
1
ASSEMBLY #1
C/T = 62 secs.C/O = 0 secs.Uptime = 100%2 Shifts27600 secs. avail.
1
ASSEMBLY #2
C/T = 40 secs.C/O = 0 secs.Uptime = 100%2 Shifts27600 secs. avail.
1Staging
SHIPPING
4600 L2400 R
1100 L600 R
1600 L850 R
1200 L640 R
2700 L1440 R
MRP
Production Control
Michigan Steel Co.
500 ft coils
6 weekForecast
WeeklyFax
90/60/30 dayForecasts
DailyOrder
Daily ShipSchedule
5 daysCoils
Tues. + Thurs.
1xDaily
Weekly Schedule
This diagram is provided with permission from the Lean Enterprise Institute, Inc. publication "Learning to See". Customer Demand:18400 pieces per Month(Takt Time 60 seconds)
VSMFutureState.igx
State Street Assembly
Tray = 20 pieces2 Shif ts
STAMPING
EPE = 1 Shif tC/O = 10 mins.
1.5 day s
1 seconds
1.5 day s
165 seconds
2 day s Production Lead Time = 5 day s
Processing Time = 166 seconds
WELD + ASSY.
Takt = 60 secs.C/T = 55 secs.C/O = 0 secs.Uptime = 100%2 Shif ts
3
Staging
SHIPPING
Production Control
Michigan Steel Co.
6 weekForecast
WeeklyFax
90/60/30 dayForecasts
DailyOrder
Bin
Coil
20
20
20
20
Coi
l
Changeov er
Weld
changeover
Welder uptime
Total work <= 165 sec
1.5 day s
Coils
(at the press)1.5 day s
L
R
2 day s
20
Batch
1x Daily
Daily(Milk Run)
This diagram is prov ided with permission f rom the Lean Enterprise Institute, Inc. publication "Learning to See".Customer Demand:
18400 pieces per Month(Takt Time 60 seconds)
Pacemaker
Finished Goods StrategyTAKT
Pitch
Flow & FIFO
Interval
Pull

IntroductionThe Lean “Wall”
© ABBA Roller, LLC, 2012—Presented at AIMCAL 2012 Technical Conference
This Is Where the Lean Methodology Leaves You Hanging

IntroductionThe Lean “Wall”
© ABBA Roller, LLC, 2012—Presented at AIMCAL 2012 Technical Conference
• Rigorous structure requires higher skill sets
• Typically implemented by Engineering
• Too much guessing—rarely consult Production
For Problem Solving…Deploy Six Sigma Toolset

IntroductionThe Lean “Wall”
© ABBA Roller, LLC, 2012—Presented at AIMCAL 2012 Technical Conference
Most Significant Improvements Realized With Production Involvement• Toolset must be easy to understand, deploy and use• Statistical significance must be maintained

© ABBA Roller, LLC, 2012—Presented at AIMCAL 2012 Technical Conference
Introduction
Dorian Shainin (September 26, 1914 – January 7, 2000) was an influential American quality consultant, aeronautics engineer, author, and college professor most notable for his contributions in the fields of industrial problem solving, product reliability, and quality engineering, particularly the creation and development of the “Red X” concept.
Responsible for the development of over 20 statistical engineering techniques that have become the core of the “Shainin System” for quality and reliability improvement.
Shainin Methodology
Without Demming, the U.S. would not have a quality policy;without Juran, it would not have a quality direction;
without Shainin, it would not have solved quality problems.

© ABBA Roller, LLC, 2012—Presented at AIMCAL 2012 Technical Conference
Introduction
• Define and Measure Green Y– What is being measured?– Can it be measured reliably?
• Generate Clues– Develop list of candidate variables (factors)– Red X—Primary factor– Pink X—Secondary factor
• Perform Full Factorial DOE– Quantify the importance of the candidate variables and all
interactions
Overview of Shainin Methodology

© ABBA Roller, LLC, 2012—Presented at AIMCAL 2012 Technical Conference
Introduction
• Validation Run– Can the problem be turn on and off?
• Optimization Run– What are the optimum levels of the variables
Overview of Shainin Methodology

© ABBA Roller, LLC, 2012—Presented at AIMCAL 2012 Technical Conference
Clue Generation
• Understand type of variation– Positional—variation within-unit– Cyclical—unit-to-unit variation– Temporal—time-to-time variation
• Define measurement scale– Variable data—2 to 4 samples– Attribute data (pass/fail)—20 to 50 samples– Likert scale (1=worst, 10=best)—5 to 10 samples
Overview

© ABBA Roller, LLC, 2012—Presented at AIMCAL 2012 Technical Conference
Clue Generation
• Conduct investigation– Multi-Variable Analysis—Type of variation unknown– Concentration Chart—Positional variation– Component Search—Cyclical variation– Paired Comparison—Cyclical variation– Product/Process Search—Temporal variation
Overview

Clue GenerationMulti-Variable Analysis
11
22
33
44
55
66
88
On each wafer, five dice are measured
Sampling is performed over three consecutive weeks
Wafers are selected from three locations in the batch
Each batch takes two hours to process (4 batches/shift)
Three wafers are sampled from each batch exiting the deposition process
Two deposition chambers are used
Samples are taken from two consecutive batches per on first and second shifts
77 Samples are taken on Monday thru Wednesday
Green Y:Wafer Thickness Variation
Temporal Variation Cyclical Variation Positional Variation
Weeks 3
Days 3
Shifts per Day 2
Batches per Shift 4
Wafers per Batch 3
Deposition Chambers 2
Locations per Batch 3
Positions per Wafer 5
Total Samples = 3 x 3 x 2 x 4 x 3 x 2 x 3 = 1,296
Total Readings = 1,296 x 5 = 6,480
Problem: Thickness in wafers exiting the semiconductor deposition process.
© ABBA Roller, LLC, 2012—Presented at AIMCAL 2012 Technical Conference

Clue GenerationMulti-Variable Analysis
Positional VariationPositional Variation Cyclical VariationCyclical Variation
Temporal VariationTemporal Variation
© ABBA Roller, LLC, 2012—Presented at AIMCAL 2012 Technical Conference

© ABBA Roller, LLC, 2012—Presented at AIMCAL 2012 Technical Conference
Concentration Charts
• Used with Positional Variations• Map location of defects
– Use part drawing– Generate grid on part
• Plot all defect types and counts on map• Focus investigation on high concentration areas
Overview

© ABBA Roller, LLC, 2012—Presented at AIMCAL 2012 Technical Conference
Component Search
• Used with Cyclical Variations• Units must be capable of assembly and disassembly
without changing Green Y• Use Paired Comparisons if assembly/disassembly
changes Green Y
Overview

© ABBA Roller, LLC, 2012—Presented at AIMCAL 2012 Technical Conference
Component Search
• Methodology—Develop baseline– Collect very good units—Best of Best (BOB)– Collect very bad units—Worst of Worst (WOW)– Disassemble and reassemble two times measuring Green Y
after each reassembly– Conduct Significance Test
Are the differences between BOBs and WOWs statistically significant?
– Calculate decision limitsDefine the expected range of values for BOBs and WOWs.
Methodology

© ABBA Roller, LLC, 2012—Presented at AIMCAL 2012 Technical Conference
Component Search
• Methodology—Conduct experiments– Rank-order list of candidate factors (A, B, C, …)– Swap one factor at a time between BOB and WOW– Measure Green Y after each swap– Any factor-swap that causes Green Y to fall outside decision
limits is important– Perform capping run with important factors at WOW level and all
others at BOB level
Methodology

© ABBA Roller, LLC, 2012—Presented at AIMCAL 2012 Technical Conference
Component Search
• Factors D and G are important• Capping Run of DWGWRB showed reversal
Example
BOB WOWInitial -40 0Disass'y 1 -35 -5Disass'y 2 -37 -7Factor A -40 -5Factor B -35 0Factor C -35 -5Factor D -20 -5Factor E -40 0Factor F -40 -5Factor G -20 -5Factor H -35 0Capping Run -1 -40

© ABBA Roller, LLC, 2012—Presented at AIMCAL 2012 Technical Conference
Paired Comparisons
• Used with Cyclical Variations when Component Search not valid
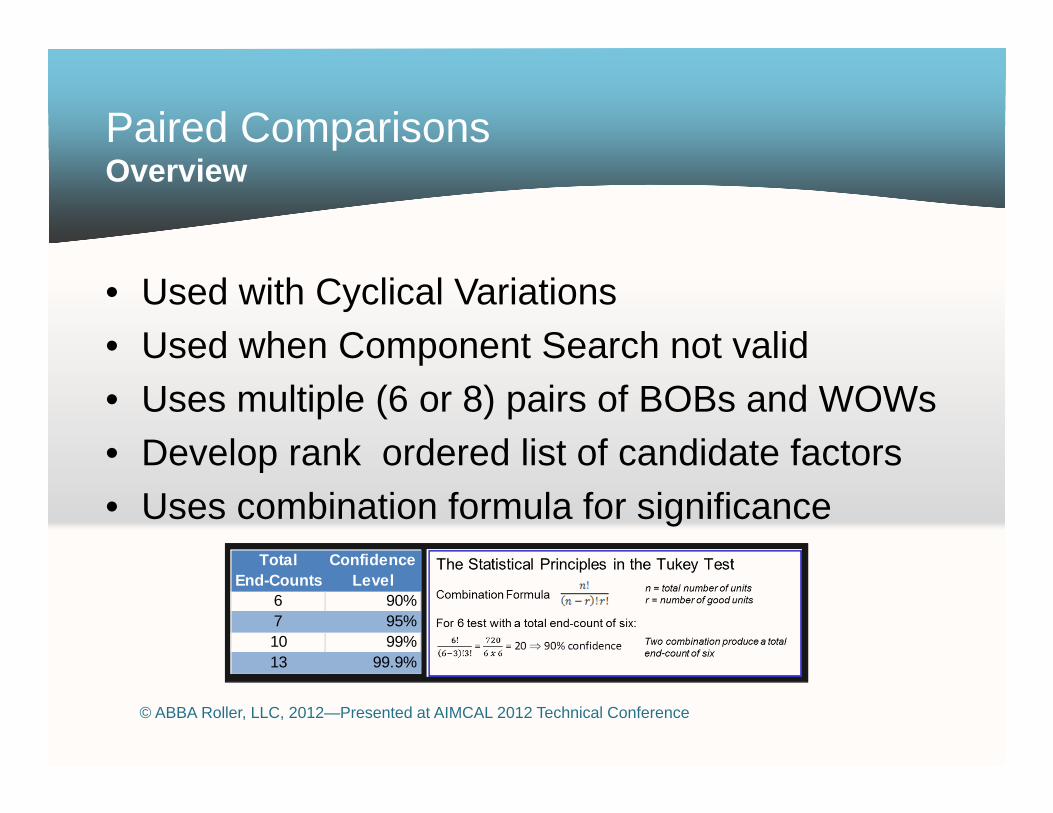
• Uses multiple (6 or 8) pairs of BOBs and WOWs• Develop rank ordered list of candidate factors• Uses combination formula for significance
Overview
TotalEnd-Counts
Confidence Level
6 90%7 95%10 99%13 99.9%

© ABBA Roller, LLC, 2012—Presented at AIMCAL 2012 Technical Conference
Paired Comparison
• Measure all factors for all units• Designate each reading as a BOB or WOW• Arrange in rank order from smallest to largest• Draw a line when BOB readings change to WOW
readings (top end-count)• Draw a line when WOW readings change to BOB
readings (bottom end-count)• Add top and bottom end counts
Procedure

ExamplePaired Comparison
Your own footer Your Logo
Rank Ordered DataRaw Data
Total End Count = 7
There is a 95% confidence thatthe BOBs are really better thanthe WOWs
Analysis
B = BOB, W = WOW
0.015 W0.018 W0.014 W0.022 W0.019 W0.018 B0.016 B0.023 B0.017 W0.019 W0.011 W0.007 W0.024 B0.023 B0.021 B0.017 B
0.007 W0.011 W0.014 W0.015 W0.016 B0.017 W0.017 B0.018 W0.018 B0.019 W0.019 W0.021 B0.022 W0.023 B0.023 B0.024 B
TotalEnd-Counts
Confidence Level
6 90%7 95%10 99%13 99.9%
}
}
4
3

© ABBA Roller, LLC, 2012—Presented at AIMCAL 2012 Technical Conference
Product/Process Search
• Used with Temporal Variations• Separates important process parameters that may shift,
drift or fluctuate with time• Uses same concepts as Paired Comparisons• Compares the process parameters associated with 6 or
8 BOB and WOW product pairs
Overview

© ABBA Roller, LLC, 2012—Presented at AIMCAL 2012 Technical Conference
Product/Process Search
• Record parameters for all samples– Parameters are measured directly, not by settings– BOBs and WOWs cannot be determined until after processing
• Select 6 or 8 BOB/WOW pairs• Run a Paired Comparison to identify important factors
Overview

© ABBA Roller, LLC, 2012—Presented at AIMCAL 2012 Technical Conference
Variable Search
• Objectives– Isolate important variables– Tighten tolerances of important variables– Loosen tolerances of unimportant variables
Overview
Technique focuses on variables associated with known significant factors.

© ABBA Roller, LLC, 2012—Presented at AIMCAL 2012 Technical Conference
Variable Search
• Methodology– Ball Park
Are correct variables and levels identified?– Separation of Factors
Separate important and unimportant variables– Capping Run
Validate the important variables as significant– Factorial analysis
Quantify the magnitude and desired levels of important variables
Overview

© ABBA Roller, LLC, 2012—Presented at AIMCAL 2012 Technical Conference
Variable Search
• Perform Full Factorial DOE on important variables– Further isolate those that
contribute most to the problem– Provide guidance variables
needing tighter tolerances
• Conduct Validation Run– Demonstrate ability to turn
problem on/off– Develop confidence solution is
permanent
Next Steps

© ABBA Roller, LLC, 2012—Presented at AIMCAL 2012 Technical Conference
Summary
• Deploy Six Sigma toolset when engaging in Lean Continuous Improvement
• Reduce number of required experiments by utilizing Shainin Methodology
• Involve Production personnel…not just Engineers

© ABBA Roller, LLC, 2012—Presented at AIMCAL 2012 Technical Conference
A Final Note
Citations• Dorian Shainin and Peter Shainin, Better Than Taguchi Orthogonal
Arrays (John Wiley & Sons, Ltd., 1988)• Richard D. Shainin, How Lean is Your Six Sigma Program?• Bhote and Bhote, World Class Quality (ANACOM, 2000)• Donald J. Wheeler, Understanding Industrial Experimentation (SPC
Press, Inc. 1988)• Tapping, Luyster and Shuker, Value Stream Management
(Productivity Press, 2002)

© ABBA Roller, LLC, 2012—Presented at AIMCAL 2012 Technical Conference
A Final Note
Contact InformationPeter KochABBA [email protected]

Backup Slides
Your Logo

Problem-solving Techniques for Use in a Lean EnvironmentUsing Six Sigma Tools in a Lean Environment
© ABBA Roller, LLC, 2012—Presented at AIMCAL 2012 Technical Conference

Agenda
Your Logo
11
22
33
44
55
66
77
Six Sigma Tools in a Lean Environment
Validation
Shainin Methodology
Variable Search
Design of Experiments Techniques
Clue Generation
Full Factorial Analysis

The DMAIC ProcessSix Sigma Tools in a Lean Environment
11Create current state Value Stream Map.Collect data for operations (TAKT, Manning, Setup , etc.)Identify Critical Elements (Bottlenecks, Inventory levels, etc.)
Define and Measure
22Create Future State VSM with key strategies(Push vs. Pull, Pacemaker, Finished Goods Strategy, etc.)
Analyze
33Generate CluesFormal Design of ExperimentsValidation and Optimization
Improve and Control
© ABBA Roller, LLC, 2012—Presented at AIMCAL 2012 Technical Conference

© ABBA Roller, LLC, 2012—Presented at AIMCAL 2012 Technical Conference
Design of Experiments Techniques
• Principles– Balance—all levels of all variables are tested– Replication—identify signal to noise ratio– Randomization—eliminate biases
• Goals– Separate and quantify main effects (factors) and
higher order interactions
Characteristics of DOEs

© ABBA Roller, LLC, 2012—Presented at AIMCAL 2012 Technical Conference
Design of Experiments Techniques
• Requires 2n Experiments– 2 variables = 4 experiments– 4 variables = 16 experiments– 10 variables = 1,024 experiments
Characteristics of DOEs
Eliminating As Many Variables As Possible Increases Efficiency and Reduces Cost

© ABBA Roller, LLC, 2012—Presented at AIMCAL 2012 Technical Conference Your Logo
Comparison of TechniquesDesign of Experiments Techniques
Full Factorial: 2n experimentsFractional Factorial: 2n-p experimentsHalf Factorial (p=1), Quarter (p=2)
Classical Methods
Fractional FactorialOrthogonal, Not BalancedAssumes interactions are negligable
Taguchi Method
Identify Candidate FactorsUse Full FactorialValidation to Confirm Uniqueness
Shainin Method
ContrastContrastBalanceBalance
Alias: Same contrast for different factors
Orthogonal: Equal number +’s and –’s in a contrast

© ABBA Roller, LLC, 2012—Presented at AIMCAL 2012 Technical Conference
Shainin Methodology
• Define and Measure Green Y– What is being measured?– Can it be measured reliably?
• Generate Clues– Develop list of candidate variables (factors)– Red X—Primary factor– Pink X—Secondary factor
Overview

© ABBA Roller, LLC, 2012—Presented at AIMCAL 2012 Technical Conference
Shainin Methodology
• Perform Full Factorial DOE– Quantify the importance of the candidate variables
and all interactions• Validation Run
– Can the problem be turn on and off?• Optimization Run
– What are the optimum levels of the variables
Overview

Weigh two groups of
3 balls
If equal: Select remaining 9 balls.
If unequal: Select heavier 9 balls
If equal: Select remaining 26 balls.
If unequal: Select heavier 27 balls
Weigh two groups of27 balls
Divide balls into three groups (27-27-26)
Factor Elimination ExampleShainin Methodology
© ABBA Roller, LLC, 2012—Presented at AIMCAL 2012 Technical Conference
Weigh two groups of
1 ball
Weigh two groups of
9 balls
If equal: Select remaining 3 balls.
If unequal: Select heavier 3 balls
If equal: Remaining ball is Red X
If unequal: Heavier ball is Red X
• Problem Statement– 80 steel balls.– All weigh the same
except one which is heavier.
• Equipment– Balance scale with
center mark.– Two pans (equal
weight).• Find the Red X ball in no
more than four tries on the scale.

© ABBA Roller, LLC, 2012—Presented at AIMCAL 2012 Technical Conference
Shainin Methodology
• Define the Green Y– Specific, Achievable, Realistic and Relevant
• Verify the measurement system– Accuracy 5X better than tolerance of Green Y– Within-instrument variation– Instrument-to-instrument variation– Operator-to-operator variation
Define and Measure Green Y

© ABBA Roller, LLC, 2012—Presented at AIMCAL 2012 Technical Conference
Shainin Methodology
• Quantify and measure Green Y– Quantify range of defects
• Investigate problem history– Out-of-box failures– Constant rate failures– Wear-out failures
Define and Measure Green Y
These Rules Are Used in All Investigations

© ABBA Roller, LLC, 2012—Presented at AIMCAL 2012 Technical Conference
Clue Generation
• Families of Variations– Positional—variation within-unit– Cyclical—unit-to-unit variation– Temporal—time-to-time variation
• Determine number of samples and frequency– Capture 80% of variation level
Overview

© ABBA Roller, LLC, 2012—Presented at AIMCAL 2012 Technical Conference
Clue Generation
• Conduct investigation– Multi-Variable Analysis—Family of variation unknown– Concentration Chart—Positional variation– Component Search—Cyclical variation– Paired Comparison—Cyclical variation– Product/Process Search—Temporal variation
• Standard Green Y Rules apply
Overview

Clue GenerationMulti-Variable Analysis
11
22
33
44
55
66
88
On each wafer, five dice are measured
Sampling is performed over three consecutive weeks
Wafers are selected from three locations in the batch
Each batch takes two hours to process (4 batches/shift)
Three wafers are sampled from each batch exiting the deposition process
Two deposition chambers are used
Samples are taken from two consecutive batches per on first and second shifts
77 Samples are taken on Monday thru Wednesday
Green Y:Wafer Thickness Variation
Temporal Variation Cyclical Variation Positional Variation
Weeks 3
Days 3
Shifts per Day 2
Batches per Shift 4
Wafers per Batch 3
Deposition Chambers 2
Locations per Batch 3
Positions per Wafer 5
Total Samples = 3 x 3 x 2 x 4 x 3 x 2 x 3 = 1,296
Total Readings = 1,296 x 5 = 6,480
Problem: Thickness in wafers exiting the semiconductor deposition process.
© ABBA Roller, LLC, 2012—Presented at AIMCAL 2012 Technical Conference

Clue GenerationMulti-Variable Analysis
Positional VariationPositional Variation Cyclical VariationCyclical Variation
Temporal VariationTemporal Variation
© ABBA Roller, LLC, 2012—Presented at AIMCAL 2012 Technical Conference

© ABBA Roller, LLC, 2012—Presented at AIMCAL 2012 Technical Conference
Concentration Charts
• Used with Positional Variations• Map location of defects
– Use part drawing– Generate grid on part
• Plot all defect types and counts on map• Focus investigation on high concentration areas
Overview
© ABBA Roller, LLC, 2012—Presented at AIMCAL 2012 Technical Conference
Component Search
• Used with Cyclical Variations• Units must be capable of assembly and
disassembly without changing Green Y• Use Paired Comparisons if
assembly/disassembly changes Green Y
Overview

© ABBA Roller, LLC, 2012—Presented at AIMCAL 2012 Technical Conference
Component Search
• Methodology– Collect very good units—Best of Best (BOB)– Collect very bad units—Worst of Worst (WOW)– Disassemble and reassemble two times measuring
Green Y after each reassembly– Conduct Significance Test—are the differences
between BOBs and WOWs statistically significant – Calculate decision limits– Rank-order list of candidate factors
Methodology

© ABBA Roller, LLC, 2012—Presented at AIMCAL 2012 Technical Conference
Component Search
• Methodology (cont.)– Swap one factor at a time between BOB and WOW– Measure Green Y after each swap– Any factor-swap that causes Green Y to fall outside
decision limits is important– Perform capping run with important factors at WOW
level and all others at BOB level– Perform DOE to separate magnitude and direction of
important factors
Methodology

© ABBA Roller, LLC, 2012—Presented at AIMCAL 2012 Technical Conference
Component Search
• Nomenclature– Assign letter to each candidate factor (e.g., A, B, C)– Subscript of letter indicates BOB or WOW level
• AB—the BOB level of factor A• CW—the WOW level of factor C
– The letter RB and RW refer to the balance of the factors at their BOB and WOW levels, respectively
Methodology

© ABBA Roller, LLC, 2012—Presented at AIMCAL 2012 Technical Conference
Component Search
• Significance Test– D = difference between median of BOB values and
median of WOW values– d = Average differences in the BOB and WOW
readings{(HighB-LowB) + (HighW-LowW)} / 2
– Calculate D/d ratio• >1.25—BOBs and WOWs are statistically significant.• <1.25—Keep looking…may be a process issue
Methodology
© ABBA Roller, LLC, 2012—Presented at AIMCAL 2012 Technical Conference
Component Search
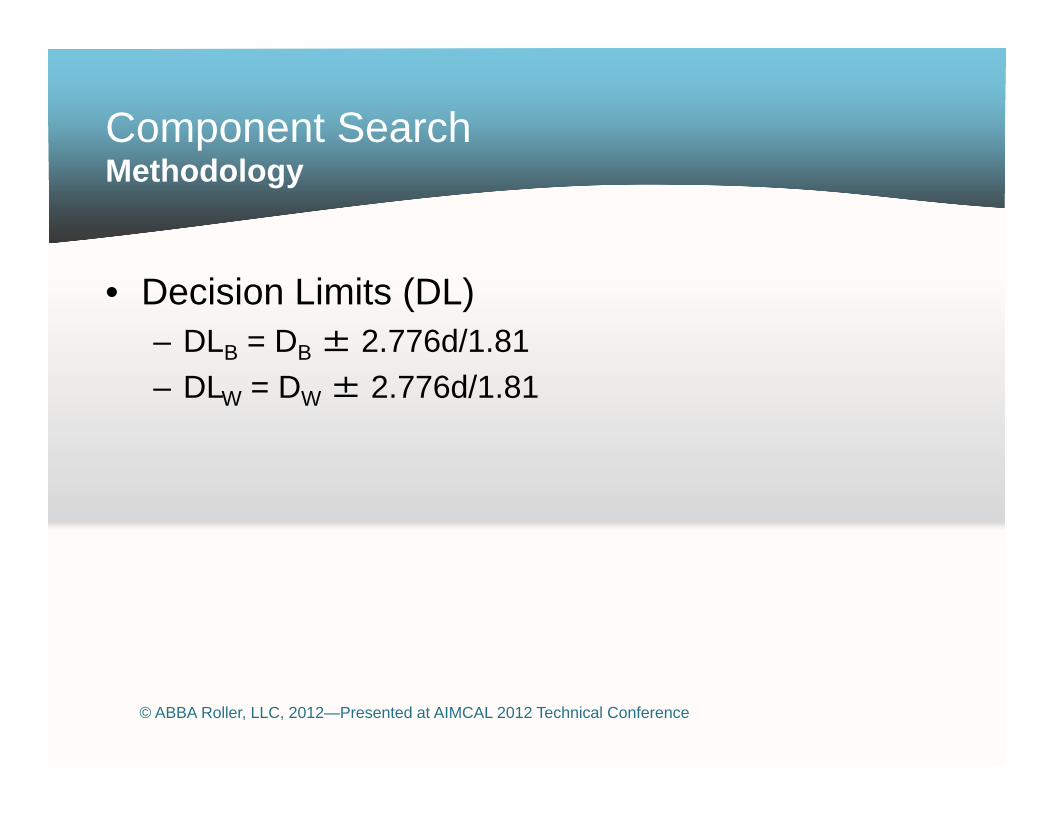
• Decision Limits (DL)– DLB = DB ± 2.776d/1.81– DLW = DW ± 2.776d/1.81
Methodology

© ABBA Roller, LLC, 2012—Presented at AIMCAL 2012 Technical Conference
Component Search
• Factors D and G are important• Capping Run of DWGWRB showed reversal
Example
BOB WOWInitial -40 0Disass'y 1 -35 -5Disass'y 2 -37 -7Factor A -40 -5Factor B -35 0Factor C -35 -5Factor D -20 -5Factor E -40 0Factor F -40 -5Factor G -20 -5Factor H -35 0Capping Run -1 -40
© ABBA Roller, LLC, 2012—Presented at AIMCAL 2012 Technical Conference
Paired Comparisons
• Used with Cyclical Variations• Used when Component Search not valid• Uses multiple (6 or 8) pairs of BOBs and WOWs• Develop rank ordered list of candidate factors• Uses combination formula for significance
Overview
TotalEnd-Counts
Confidence Level
6 90%7 95%10 99%13 99.9%

© ABBA Roller, LLC, 2012—Presented at AIMCAL 2012 Technical Conference
Paired Comparison
• Measure all factors for all units• Designate each reading as a BOB or WOW• Arrange in rank order from smallest to largest• Draw a line when BOB readings change to
WOW readings (top end-count)• Draw a line when WOW readings change to
BOB readings (bottom end-count)• Add top and bottom end counts
Procedure

ExamplePaired Comparison
Your own footer Your Logo
Rank Ordered DataRaw Data
Total End Count = 7
There is a 95% confidence thatthe BOBs are really better thanthe WOWs
Analysis
B = BOB, W = WOW
0.015 W0.018 W0.014 W0.022 W0.019 W0.018 B0.016 B0.023 B0.017 W0.019 W0.011 W0.007 W0.024 B0.023 B0.021 B0.017 B
0.007 W0.011 W0.014 W0.015 W0.016 B0.017 W0.017 B0.018 W0.018 B0.019 W0.019 W0.021 B0.022 W0.023 B0.023 B0.024 B
TotalEnd-Counts
Confidence Level
6 90%7 95%10 99%13 99.9%
}
}
4
3

© ABBA Roller, LLC, 2012—Presented at AIMCAL 2012 Technical Conference
Product/Process Search
• Used with Temporal Variations• Separates important process parameters that
may shift, drift or fluctuate with time• Uses same concepts as Paired Comparisons• Compares the process parameters associated
with 6 or 8 BOB and WOW product pairs
Overview

© ABBA Roller, LLC, 2012—Presented at AIMCAL 2012 Technical Conference
Product/Process Search
• Record parameters for all samples– Parameters are measured directly, not by settings– BOBs and WOWs cannot be determined until after
processing• Select 6 or 8 BOB/WOW pairs• Run a Paired Comparison to identify important
factors
Overview

© ABBA Roller, LLC, 2012—Presented at AIMCAL 2012 Technical Conference
Variable Search
• Objectives– Isolate important variables– Tighten tolerances of important variables– Loosen tolerances of unimportant variables
Overview
Technique focuses on variables associated with known significant factors.

© ABBA Roller, LLC, 2012—Presented at AIMCAL 2012 Technical Conference
Variable Search
• Methodology– Ball Park
Are correct variables and levels identified?– Separation of Factors
Separate important and unimportant variables– Capping Run
Validate the important variables as significant– Factorial analysis
Quantify the magnitude and desired levels of important variables
Overview

© ABBA Roller, LLC, 2012—Presented at AIMCAL 2012 Technical Conference
Variable Search
• Create rank ordered list of variables (A, B, C, etc.) in descending order
• Determine the Best (B) and Marginal (M) levels for each variable
• Determine sample size based on variable type• Run two initial experiments (RB and RM) to
determine Green Y separation
Ball Parking—Initial Experiment
Standard Green Y Rules Apply

© ABBA Roller, LLC, 2012—Presented at AIMCAL 2012 Technical Conference
Variable Search
• Evaluate results– Large difference between Green Y for RB and RM
indicates Red X is contained in the variable set.– Modest difference between Green Y for RB and RM
indicates Red X may not be contained in the variable set.
– Little to no difference: keep looking for correct variables.
Ball Parking—Evaluation of Experiment
If a DOE were run instead, the significance of the variables would not be known until multiple experiments are completed

© ABBA Roller, LLC, 2012—Presented at AIMCAL 2012 Technical Conference
Variable Search
• Repeat initial experiment two more times• Determine statistical significance
– All RB Green Y’s better than all RM Green Y’s with no overlap
– D/d > 1.25
Ball Parking—Replication of Experiment

© ABBA Roller, LLC, 2012—Presented at AIMCAL 2012 Technical Conference
Variable Search
• Run a pair of tests (AMRB and ABRM)• Calculate decision limits• Evaluate results
– If Green Y for AB and AM stay within their respective decision limits—A is unimportant
– If Green Y for AB and AM lies within opposite decision limits—A is Red X (important)
– If Green Y for AB and AM lies outside its decision limits—A is a Pink X (important)
Separation of Factors with Capping Run

© ABBA Roller, LLC, 2012—Presented at AIMCAL 2012 Technical Conference
Variable Search
• Repeat experiments varying other factors• Perform Capping Run with important variables
Separation of Factors with Capping Run

© ABBA Roller, LLC, 2012—Presented at AIMCAL 2012 Technical Conference
Variable Search
• Run a pair of tests (AMRB and ABRM)• Calculate decision limits• Repeat experiments varying other factors• Perform a Capping Run
– If complete reversal is not achieved, keep looking
Separation of Factors with Capping Run
RememberVariable Search is NOT looking for important factors. It is looking for the LEVELS of the factors identified during Clue Generation
that generate BOBs and WOWs

© ABBA Roller, LLC, 2012—Presented at AIMCAL 2012 Technical Conference
Variable Search
• If more than one important variable is identified, perform Full Factorial analysis– Balanced—All factors at all levels are tested– Replication—2 to 4 tests per level– Randomized—Eliminate biases
• Shift over time• Trend over time• Cyclical pattern over time
Factorial Analysis

Variable SearchFactorial Analysis
© ABBA Roller, LLC, 2012—Presented at AIMCAL 2012 Technical Conference
11
22
33
44
55
66
88
Select factors: A, B, C, D
Determine if “noise” is a factor
Construct factorial matrix showing all combinations
Run experiments for each combination (matrix cell)
Select two levels for each factor, (+) and (-)
Randomize sequence of testing
Repeat steps 4 and 5 as needed
77 Calculate averages of readings in each cell

Variable SearchFactorial Analysis
© ABBA Roller, LLC, 2012—Presented at AIMCAL 2012 Technical Conference
99 1010Calculate contribution of each factor Construct Analysis of Variance table and graphs

© ABBA Roller, LLC, 2012—Presented at AIMCAL 2012 Technical Conference
Variable Search
• Demonstrate ability to turn problem on and off
• Develop sufficient confidence solution is permanent
• Predict how much better one process is than the other with 90% confidence
Validation Run

© ABBA Roller, LLC, 2012—Presented at AIMCAL 2012 Technical Conference
A Final Note
Citations• Dorian Shainin and Peter Shainin, Better Than Taguchi Orthogonal
Arrays (John Wiley & Sons, Ltd., 1988)• Richard D. Shainin, How Lean is Your Six Sigma Program?• Bhote and Bhote, World Class Quality (ANACOM, 2000)• Donald J. Wheeler, Understanding Industrial Experimentation (SPC
Press, Inc. 1988)• Tapping, Luyster and Shuker, Value Stream Management
(Productivity Press, 2002)

© ABBA Roller, LLC, 2012—Presented at AIMCAL 2012 Technical Conference
A Final Note
Contact InformationPeter KochABBA [email protected]