using respirometry for energy optimization in a nitrifying ... · using respirometry for energy...
TRANSCRIPT
1
Using respirometry for energy optimization in a nitrifying
biological wastewater treatment system
Emilio Serrano
Surcis, S.L. (Spain) – www.surcis.com
ABSTRACT
Many wastewater treatment plants use more than 50% of their total energy budget in the aeration
basin and, when nutrient removal is included in the activated sludge process, it is very common that
the majority of oxygen uptake goes to the nitrification process. For that reason, in most wastewater
treatment plants, energy optimization is focused on nitrification management. This information can
be obtained in different ways, but perhaps the most direct way is based on the correct control of the
minimum dissolved oxygen (DOmin) and sludge retention time (SRT) without impairment of process
efficiency.
The present paper describes a relatively simple, fast procedure whereby the use of an advanced and
high sensitivity respirometry system, both parameters are obtained throughout a novel method to
accurately determine values of the half-saturation DO constant (KOA) and active nitrifier
concentration (XA) from the results of a single respirometry test.
The procedure and methods here described do not aim to be a scientific document. On the contrary,
one of its aims is to be accessible to any plant operator with access to a respirometer provided with
necessary features to quickly obtain information about critical parameters on which the nitrification
process can be calibrated so that it can be developed in the framework of its best energy optimization.
Keywords: respirometry, activated sludge process, dissolved oxygen, oxygen uptake rate, nitrfiers,
nitrification, nitrification rate, nitrification capacity, half-saturation coefficient, minimum oxygen,
sludge residence time, sludge age, energy optimization, respirometer, heterotrophic biomass,
autotrophic biomass.
1. INTRODUCTION
The influence of dissolved oxygen (DO) on nitrification is well known. Nitrification increases with
the DO concentration until reaching a limiting-DO (between 3 and 4 mg/L) where the maximum
nitrification rate is achieved (Figure 1).
It is understood that nitrification can take place within different DO ranges; but the approach of
many plant operators is to select the minimum DO range and operate within a sludge retention time
(SRT) to get the maximum energy optimization in the aeration tank corresponding to the process
temperature, pH and effluent ammonium requirements.

2
Figure 1. Effect of DO on the % maximum nitrification rate
Historically, the influence of dissolved oxygen on the nitrification rate has been controversial. One of
the main reasons comes from evidence that the half-saturation coefficient (KOA) applied in kinetic
parameters determination, despite being critical, is not a well-defined value. This is evidenced by
reported concentrations ranging between 0.15 and 2 mg/L O2.
Table 1 – Example of some reported half saturation values
Source KOA (mg/L)
Source KOA (mg/L)
USEPA
1.3 ASM1
0.4
IAW
0.4 ASM2
0.5
BioWin
0.25 ASM3
0.5
GPS-X
0.5 Henze et al. (2000) 0.5
Beccari et al. (1999) 0.83
Contreras et al. (2008) 0.75
According to Monod kinetics, the specific growth rate (µA) and the maximum nitrification rate
(AURo) for any nitrification limiting DO concentration is dependent on temperature, pH and DO. But
when those parameters are obtained under equivalent conditions of substrate, temperature, pH and
oxygen to the actual process, this correlation only relies on the DO and half-saturation coefficient
(KOA). Therefore, it is evident that KOA plays a critical role, but due to the variability in reported
ranges (see Table 1), in many cases it can be too risky to use the default values from bibliography or
simulation software. For that reason, it is more than justifiable to develop an affordable method that
could calculate the KOA value for a specific nitrification process.
The major nitrification driver is the SRT. This value can be obtained from the reciprocal value of the
actual autotrophic growth rate and is dependent on the nitrification rate (AUR) and active nitrifier
concentration (XA). Therefore, to determine the corresponding SRT it is necessary to determine the
XA beforehand; this is possible by taking advantage of the principle that the endogenous respiration
rate is directly proportional to the biomass concentration (James C. Young. 2004; Peter A.
Vanrolleghem. 2002).
3
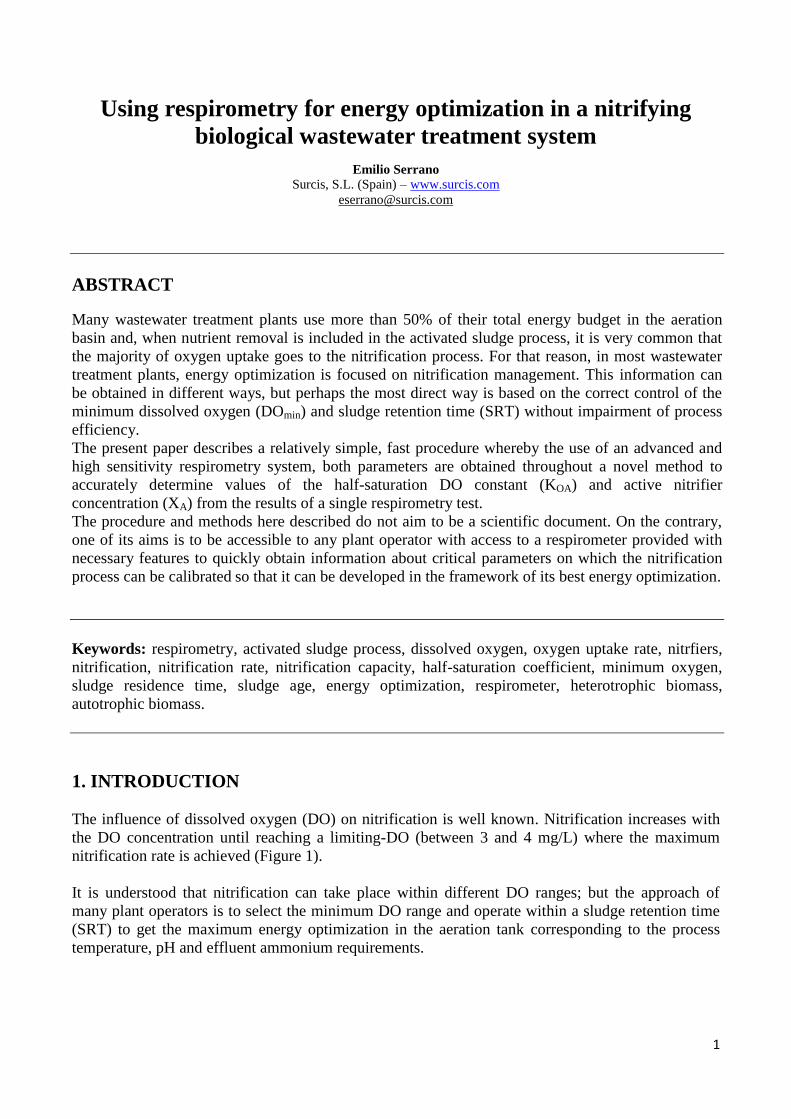
2. BM RESPIROMETER
The methods and case study described in this paper were carried out with parameters and
calculations resulting from a test performed using an advanced respirometer. This respirometer is
able to conduct tests within different ranges of temperature, pH and DO. It also gives the option to
change these variables, if required, during the test.
Figure 2. BM-Advance respirometry system
1. Stirring motor - 2. Oxygen & pH controller - 3. Oxygen & pH sensors - 4. Inlet & Outlet
recirculation tubes - 5. Peristaltic pump. 6. Stirring paddles - 7. Air diffuser - 8. Automatic cooling
& heating system - 9. Console display - 10. PC with BM software
The BM respirometer is programmed with three different operation modes: OUR, Cyclic OUR and
R; in the present study the operation mode utilized was R.
The R mode is based on a modified LFS batch respirometry type where the dissolved oxygen is
measured in liquid which is continuously aerated, stirred and recirculated. The respirometer is
already calibrated from the factory to run in R mode. The exclusive feature of this operation mode is
based on the fact that, when sludge under endogenous respiration is used, the stable resultant
dissolved oxygen of the sludge without adding any substrate is taken as base line. Then, when
substrate is added, the test actually begins and the software is able to calculate the exogenous
respiration rate directly related to the biological substrate removal for a maximum DO concentration
over time. In our case, the substrate is ammonium and therefore the exogenous respiration rate is
exclusively related to nitrification.
3. MAIN APPROACH AND OBJECTIVES
Approach:
1. Energy optimization by operating within minimum DO range and SRT.
Objectives:
1. Calculation of the specific KOA
2. Calculation of the minimum and maximum DO in which nitrification can operate in its actual
ammonium range.
3. Calculation of the SRT in which the process should operate.
The common condition for all of them is to get a short, simple and reliable method.
4
4. METHOD TO DETERMINE KOA, MINIMUM DO AND SRT BY
RESPIROMETRY
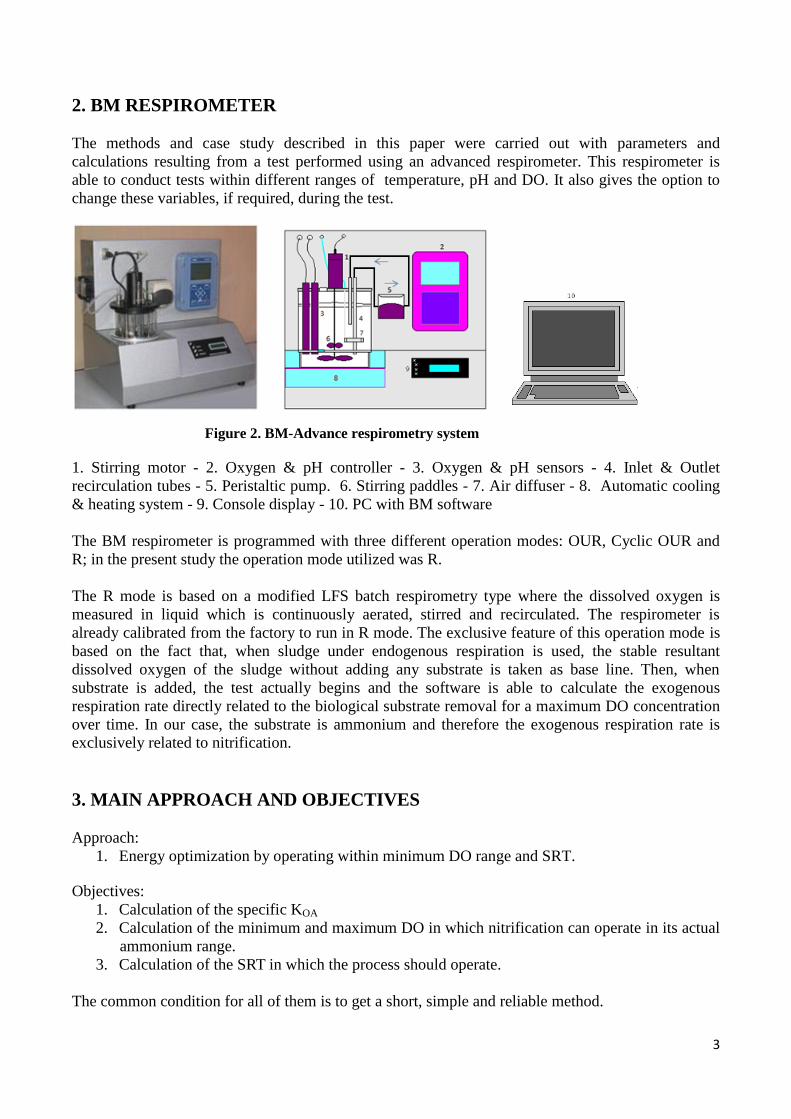
To get reliable results for any procedure related to nitrification, it is important to confirm that the
process is running within normal conditions and operating parameters (Table 2 and Figure 3).
Table 2. Normal conditions for nitrification
Nutrient ratio C/N/P - High & medium load
100/5/1
Nutrient ratio C/N/P - Low load
100/3/0.7
pH
7.3 to 8
T
> 15 to 28oC
DO
1 to 3 mg/L
SRT
5 to 35 days
No nitrification inhibitors in the wastewater
Sufficient HRT for nitrification
Respirometry test
The R test must be set at equivalent conditions to the actual process in regard to temperature and pH.
Begin by measuring the dissolved oxygen and its stability in the actual activated sludge under
endogenous respiration. Once the oxygen is enough stable the software stores it as a baseline and a
dose of ammonium chloride for equivalent ammonium substrate can be added. The test, remaining
continuously aerated, starts to directly measure the exogenous respiration rate that, in our case, is the
one provoked by the nitrification of the ammonium- nitrogen contained in the ammonium chloride
(Fig. 3).
Once the maximum oxygen uptake rate (OUR) is reached, a serial doses of allyl thiourea (ATU) are
added until the OUR starts to decrease. In that way, it is added the exact amount of ATU to avoid the
risk of inhibition of the heterotrophic biomass
Figure 3. Respirogram for the nitrification of ammonium chloride
and its inhibition after ATU addition
5
The test allows for the respiration rate to cross below the base line and, because of the nitrification
inhibition, this will display negative oxygen uptake.
Once the negative respiration rate has stabilized, the test can be stopped.
This negative respiration is that which corresponds to the absence of nitrifiers in the global biomass
and therefore it represents its endogenous respiration.
In this way, in the same test, the maximum oxygen uptake rate and the endogenous oxygen uptake
rate of the nitrifiers are obtained.
KOA
Ammonium to nitrify
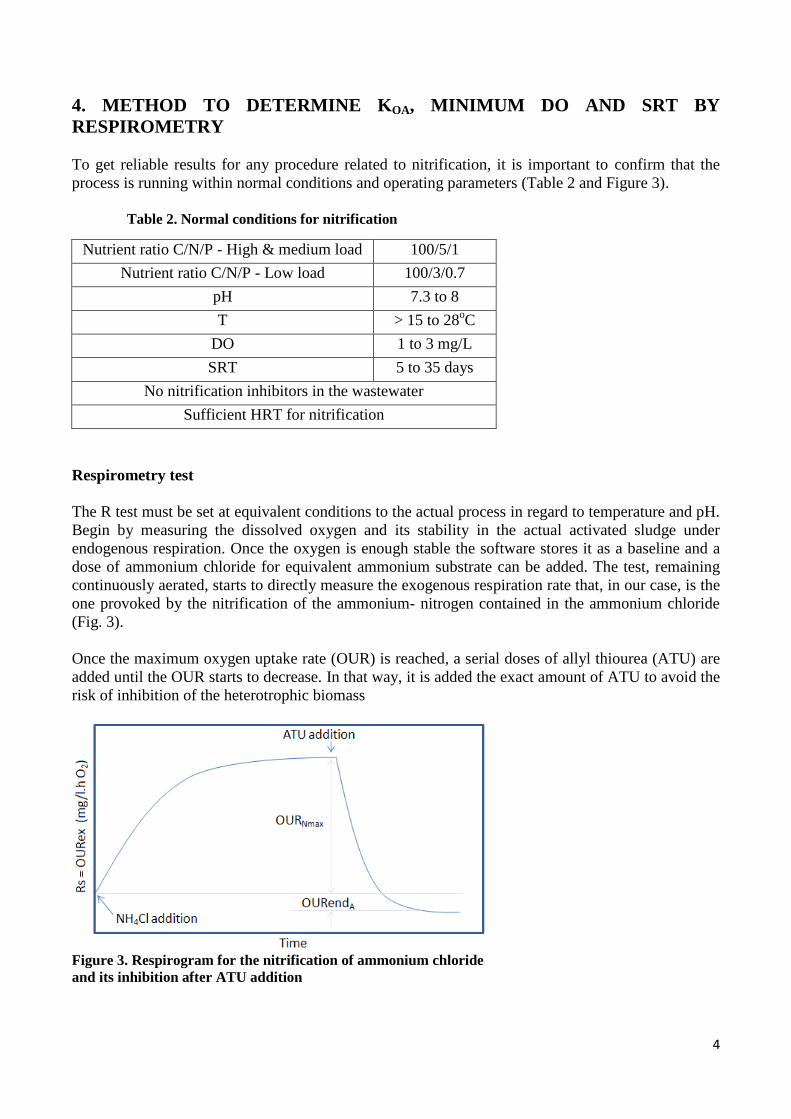
Because of the ammonification process, where part of the organic nitrogen is transformed into
ammonium (Figure 4), the effective ammonium to nitrify must be calculated from the eliminated
TKN from which we have to subtract the corresponding nitrogen directed to cell synthesis.
Figure 4. TKN in the nitrification
SN = TKNO - TKNe - Nsyn (1)
Where
SN: Typical ammonium concentration to nitrify (mg/L NH4-N)
TKNO: Influent TKN (mg/L N)
TKNe: Effluent soluble TKN (mg/L N)
Nsyn: Nitrogen directed to cell synthesis (mg/L N) ≈ 0.04 * BOD utilized
Actual ammonium uptake rate
The actual ammonium uptake rate is calculated by applying a mass balance equation from the data of
the actual process under current conditions and for its specific average DO value.
AUR = SN / HRT (2)
Where
AURact: Actual ammonium uptake rate (mg/L.h NH4-N)
HRT: Actual aerobic hydraulic retention time (h)
6
Ammonium uptake rate for maximum DO
This ammonium uptake rate is calculated from the maximum oxygen uptake rate in a respirometry
test performed under equivalent conditions but for a maximum DO oxygen:
AURo = OURNo / 4.57 (3)
where
AURo: Maximum ammonium uptake rate (mg/L.h NH4-N) for maximum DO.
OURNo: Maximum oxygen uptake rate due to nitrification for maximum DO, measured in the
respirometry R test (Figure 3)
4.57: mg of oxygen needed to nitrify 1 mg of ammonium-nitrogen
KOA calculation
With the AURo and AURact results, we use the equation below based on Monod kinetics.
AUR = AURo * [DO / (KOA + DO)] (4)
Then, from equation (4) the KOA coefficient can be calculated to get its actual value:
KOA = DO (AURo – AUR) / AUR (mg/L) (5)
Minimum DO range
Ammonium uptake rate for a set of different DO values
Once the KOA value is obtained for a set of different representative DO values at which the
nitrification process could operate, the equation (6) is performed to calculate the corresponding
ammonium uptake rate for each of them.
AURn = AURo * [DOn / (KOA + DOn)] (6)
Where
AURn: Ammonium uptake rate corresponding to DOn (mg/L.h NH4-N)
DOn: One of the DO values set at which the process could operate (mg/L)
Nitrification capacity
Using data on the actual hydraulic retention time for nitrification and the concentration of
ammonium to nitrify, the nitrification capacity can be obtained for each of the theoretical DO values.
NCn = AURn * HRT (7)
Where
NCn: Nitrification capacity corresponding to DOn (mg/L NH4-N)
7
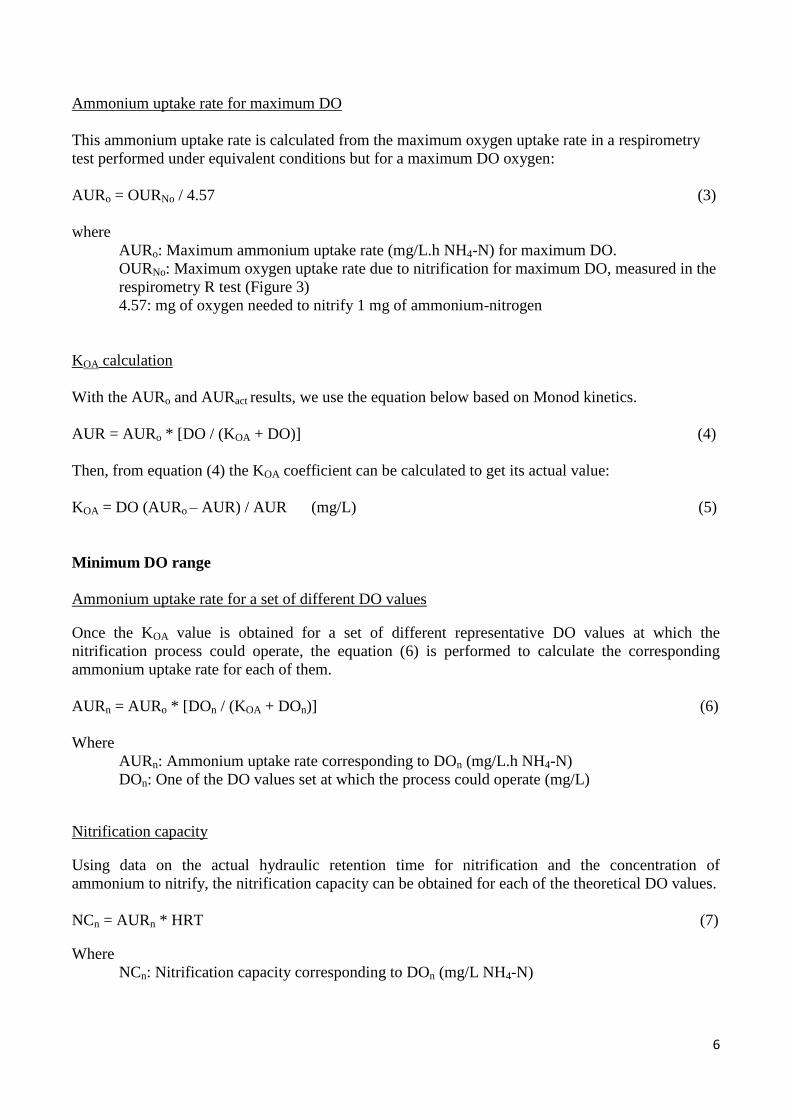
DO range to operate
Once we obtain the set of different values for NCn for each DOn, compare the results with the
concentration of ammonium range to nitrify (SN range) and then select the minimum DO which
corresponds to the NCn required to complete nitrification.
The concentration of the corresponding NCn must be equal to or higher than SN.
Figure 5. DO range vs SN range from NCn curve
Minimum SRT
Nitrifier biomass concentration
The nitrifier concentration is calculated based on two principles: 1) the endogenous respiration rate is
directly proportional to the total active biomass and 2) the maximum exogenous respiration rate due
to nitrification is directly proportional to the nitrifier concentration.
Research confirmed that the endogenous respiration rate has a direct proportionality with the active
biomass (Michael W. Barnett et al. 1998, Vanrolleghem & W. Verstraetet et al 1992) and, based on
the equation formulated by James C. Young (2004), a mathematical equation that links the active
nitrifier biomass with its endogenous respiration can be derived.
XA = 24 * OURendA / (fcv * bA,T) (8)
Where
XA: Active concentration of nitrifiers
OURendA: Endogenous OUR from nitrifiers (mg/L.h) from R test (Figure 3)
fcv: Oxygen uptake per unit of biomass = 1.48 (O2/X)
bA,T: Endogenous decay coefficient for nitrifiers at temperature T = 0.17 * 1.029T-20
(Melcer, 2003)
8
Autotrophic biomass growth rate
The autotrophic biomass growth rate is calculated from the actual AUR.
µA = YA * 24 * AUR / XA (9)
Where
YA: Autotrophic yield coefficient = 0.13 (estimated)
Sludge retention time
SRT = 1 / µA (10)
5. CASE STUDY: APPLICATION TO A REAL ACTIVATED SLUDGE
PROCESS
The procedures explained above were applied to an actual activated sludge process. The system
consisted of a two-lane parallel plug-flow activated sludge system. Currently, aeration is controlled
by an ammonium probe installed at the reactor outlet in combination with upper and lower DO set-
points.
Table 3. Process data
Parameter Average value
DO (mg/l O2)
1.5
Range: 0.5 – 2.5
pH
7.5
T (ºC)
23
F/M (BOD/SS.d)
0.17
SRT (d) 13
HRTN (h)
7
Qr/Qo
1
BODO (mg/L) to b. reactor
340
BODe (mg/L)
42
TKNO (mg/L N)
54
Range: 20 – 83
STKNe (mg/L N)
7
Range: 1.5 – 26
BOD / TKN
5.67
MLSS (mg/L)
3700
MLVSS (mg/L)
3145
By means of a BM respirometer, the R test is set to be performed on equivalent temperature and pH
conditions and the values of OURNmax and OURendA are obtained.

9
The R test is set to be able to record negative respiration rate readings.
Figure 6. Settings board for R test
The test starts when the dose of ammonium chloride is added to a volume of 1000 ml of endogenous
sludge. The test is carried out as described above. When it reaches the minimum respiration rate it is
stopped. At any time throughout the test it is possible to get the current results and analyze the
evolution of the ammonium reaction in the activated sludge.
Figure 7. Respirogram for the R test to get the OURNmax and OURendA
The results can be seen any time during the test at any point of the respirogram or by opening the
Details tab of the results.
10
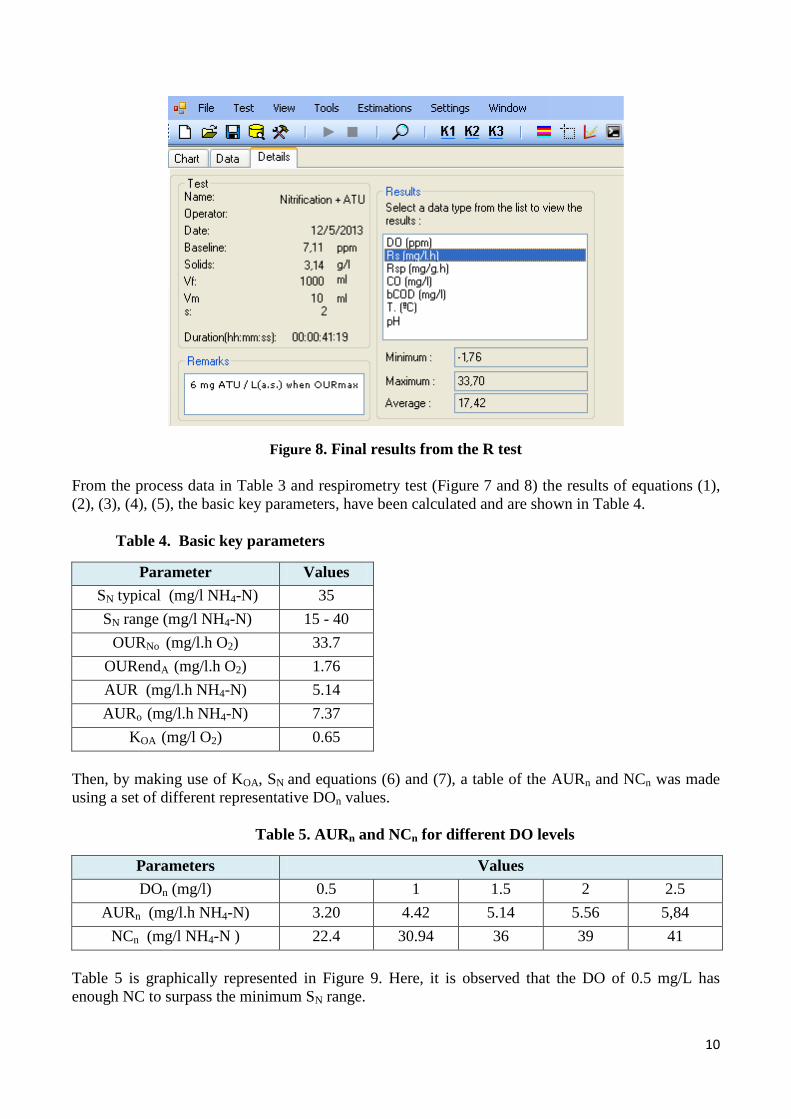
Figure 8. Final results from the R test
From the process data in Table 3 and respirometry test (Figure 7 and 8) the results of equations (1),
(2), (3), (4), (5), the basic key parameters, have been calculated and are shown in Table 4.
Table 4. Basic key parameters
Parameter
Values
SN typical (mg/l NH4-N)
35
SN range (mg/l NH4-N)
15 - 40
OURNo (mg/l.h O2)
33.7
OURendA (mg/l.h O2)
1.76
AUR (mg/l.h NH4-N)
5.14
AURo (mg/l.h NH4-N)
7.37
KOA (mg/l O2)
0.65
Then, by making use of KOA, SN and equations (6) and (7), a table of the AURn and NCn was made
using a set of different representative DOn values.
Table 5. AURn and NCn for different DO levels
Parameters
Values
DOn (mg/l)
0.5 1 1.5 2 2.5
AURn (mg/l.h NH4-N)
3.20 4.42 5.14 5.56 5,84
NCn (mg/l NH4-N )
22.4 30.94 36 39 41
Table 5 is graphically represented in Figure 9. Here, it is observed that the DO of 0.5 mg/L has
enough NC to surpass the minimum SN range.

11
However it is assumed that below this level the nitrification activity can decrease excessively and for
this reason the value of 0.5 has been established as the minimum DO.
Figure 9. DO range vs SN range – Minimum DO for SN reference
In Figure 9, the maximum value of the DO operating range is determined by simply drawing a
horizontal straight line from the maximum SN until reaching the NC curve and then, from this point,
down to the corresponding DO. In this way, the operational DO range is found to be between 0.5 and
2.2 mg/L O2. For the typical SN value, the typical DO is 1.3 mg/L O2.
The values of XA, µA, and SRT are calculated and presented in Table 6.
Table 6. Final results for XA, AUR and µA
Parameter
Value
XA (mg/L)
154
µA (d-1
)
0.10
SRT (d) 10
Finally, a summary of the calculated parameters on which the aeration and activated sludge control
can be based are presented in Table 7.
Table 7. Summary of parameters for energy optimization - Comparison vs current values
Parameter
Values from the study Current values in the process
Temperature ºC 23 23
DO operative range (mg/L O2)
0.5 - 2.2 0.5 - 2.5
DO typical (mg/L O2)
1.3 1.5
SRT (d) 10 13
Table 7 shows that results from the study are not very different from the current conditions at which
the process is currently operating. This means that the treatment process was running at operative
parameters and conditions approaching optimal energy optimization.
12
6. DISCUSSION
In the method here described, the key point is to create a diagram (Figures 5, 9) that links the DO
range with the nitrification capacity (NC) for a specific ammonium range to nitrify (SN). Once we
obtain this diagram, we will have a tool to control the nitrification process within the appropriate DO
range and minimum DO as a basis to optimize energy in the aeration control. The plant operator
could also make up a diagram for each representative daily average temperature and know the
corresponding minimum and DO range for each situation. In this way, permanent efficient process
operation within an energy optimization framework is possible.
Although it was not explained here, it is important to realize that this method could also be used for
modeling a new process. For this application, by taking advantage of the different operational modes
of the BM respirometer, we would make use of Cyclic OUR mode and equivalent ammonium
chloride concentration in a representative activated sludge to get a new AUR for the DO we expect
in the nitrification process and then follow the same steps as above.
In this novel method, we explain how to calculate the respiration rate for maximum DO (OURN.max)
and nitrifier endogenous respiration rate (OURendA) in the same test. Most importantly, both
parameters are directly calculated from the existing nitrifier biomass. For this reason, the procedure
to calculate the active nitrifier biomass concentration (XA) can be considered realistic and it could be
added to others described in the bibliography (Metcalf & Eddy, Eckenfelder, Dupont & Sinkjer, etc.)
which are indirect calculations depending on other parameters in the process.
Another important point in the respirometry test is the determination of the precise amount of Allyl
Thiourea (ATU) to be added to inhibit nitrification. This is because ATU kills autotrophic
microorganisms (nitrifying bacteria) because they are much more sensitive to toxic compounds than
heterotrophic microorganisms; but, if we add too much ATU to the activated sludge, we will also kill
part of the heterotrophic biomass and get an erroneous respiration result. However, in the method
here described, the progressive and controlled doses of ATU added upon the maximum respiration
rate provoked by the addition of ammonium chloride, are highly precise and avoid the risk of
affecting the heterotrophic microorganisms. In that way, we get a reliable result for the nitrifier
endogenous respiration rate and further calculations.
7. CONCLUSIONS
The use of an advanced multifunction respirometry system able to run a constantly aerated R test at
equivalent conditions of substrate concentration, pH, and temperature allows one to obtain the actual
maximum respiration rate and endogenous respiration rate due to nitrification.
By making use of those parameters obtained in the respirometry test, the method described in this
paper is able to calculate a diagram for the different values of nitrification capacity (NC)
corresponding to different representative oxygen levels and, from this curve, to determine the
minimum DO range and SRT in which the activated sludge process could operate.
These values of minimum DO, DO range and SRT can be used as the basis to implement an energy
efficient strategy of aeration and activated sludge control. In this way, when process conditions
allow, there is the real possibility to save energy without any detriment to treatment efficiency.
13
8. REFERENCES
MICHAEL W. BARNETT (1998)
Dynamics and Control of Wastewater Systems
W. WESLEY ECKENFELDER (1995)
Activated Sludge Treatment of Industrial Wastewater
WENTZEL MC & EKAMA GA (2006) Characterization of municipal wastewater.
JAMES C. YOUNG & ROBERT M. COWAN (2004)
Respirometry for environmental Science and Engineering
MELCER H (2003)
Methods of Wastewater Characterization in Activated Sludge Modelling.
ADRIANUS VAN HAADEL (2007)
Handbook biological wastewater treatment
HENZE M. HARREMOES (1997)
Wastewater Treatment, second edition
METCALF & EDDY, Inc. (1991)
Wastewater Engineering, Treatment, Disposal, and Reuse, third edition
EPA MANUAL (2003)
Biological Nitrogen Removal
RON SHARMAN (2003)
Water and Wastewater
GUOQIANG LIU (2012)
Nitrification Performance of Activated Sludge under Low Dissolved Oxygen Conditions (Article)
SURCIS, S.L. (2013)
BM Applications Manual