respirometry in activated sludge - wur
TRANSCRIPT

Respirometry in Activated Sludge
Hertri Spanjers
0000 0547 3893

Promotor: dr. L. Lijklema hoogleraar in het waterkwaliteitsbeheer
Co-promotor: dr. ir. A. Klapwijk universitair hoofddocent in de milieutechnologie
AJMO?20', Mfä
Henri Spanjers
Respirometry in Activated Sludge
WAGENINGEN
Proefschrift
ter verkrijging van de graad van
doctor in de landbouw- en milieuwetenschappen,
op gezag van de rector magnificus,
dr. C.M. Karssen,
in het openbaar te verdedigen
op 29 oktober 1993
des namiddags te vier uur in de aula
van de Landbouwuniversiteit te Wageningen
isn^iog

Abstract Spanjers H. (1993) Respirometry in Activated Sludge. Doctoral thesis, Wageningen Agricultural University, Wageningen, the Netherlands. 199 pages, 2 appendices.
The purpose of the study was (1) to develop a respiration meter capable of continuously measuring, using different procedures, the oxygen uptake rate of activated sludge and (2) to expand knowledge about respiration related characteristics of wastewater and activated sludge.
A newly-developed respiration meter is described. The meter consists of a closed, completely mixed respiration chamber of 0.5 to 1 litre through which activated sludge is continuously pumped. The characteristic feature of this meter is that the dissolved oxygen concentration in the sludge entering the chamber and in the sludge leaving the chamber is measured with one single probe, located at one opening. This is realised by changing the direction of the flow through the chamber. The respiration rate is calculated from the dissolved oxygen mass balance over the respiration chamber. Because the derivative of the mass balance is included in this calculation, the respiration rate can also be calculated during dynamic conditions. An improved method for calculating the respiration rate is described, which accounts for the time lag of the DO probe. An additional result of this improvement is that it yields the time constant of the probe response, which provides a diagnosis of the probe condition.
Experimental research was performed using a continuous pilot activated sludge plant with a completely mixed aeration tank of 0.4 aeration tank of 1.5 to 2 litres. ely mixed aeration tank of 0.475 m3, fed with domestic wastewater, and a batch reactor with an
A strategy is described for measuring four types of respiration rate of the same sludge under different conditions: endogenous, instantaneous, actual and maximum respiration rate. Emphasis is given to the actual respiration rate. The actual respiration rate is defined as the oxygen uptake rate of the sludge in the aeration tank. It is demonstrated that this rate is measured if the respiration chamber and the aeration tank are equally loaded with wastewater. An improved method is described which does not involve addition of wastewater to the respiration chamber. Instead, the transient respiration rate during two modes of operation which are alternately executed is used to calculate the actual respiration rate.
The measurement of the maximum respiration rate is discussed in some detail with emphasis on the partition of readily biodegradable matter into two components. The maximum respiration rate is measured if wastewater is continuously fed into the respiration chamber so that the loading exceeds a certain critical loading. Batch respirometric tests are used to verify the continuous measurement of this maximum rate. An application of the developed measurement is described in which the effect of the influent flow rate on the maximum respiration rate of nitrifying sludge was investigated.
Methods are described for continuous estimation of the short-term biochemical oxygen demand (BODst) of influent and effluent by using respirometry. BODst values of the influent are verified with batch measurements. The BODst of the examined wastewater appears to be mainly caused by ammonium being oxidized by nitrifiers.
Batch respiration measurements have been used for identifying a mathematical nitrification model. The investigation was focused on finding an optimal experimental design and a good model validation method.
Keywords: activated sludge, biochemical oxygen demand, process control, dissolved oxygen, dissolved oxygen probe, endogenous respiration rate, experimental design, fouling, kinetics, maximum respiration rate, modelling, monitoring, Monod, nitrification, nonlinear regression, oxygen uptake rate, respiration meter, respiration rate, respirometry, wastewater

^Mjöfe©/ ($82
Stellingen
1. De aanbeveling van de American Public Health Association om na de bemonstering van het aktiefslib uit de beluchtingtank de respiratiemeting zo snel mogelijk te beginnen impliceert dat de meting van de aktuele respiratiesnelheid op deze manier principieel onjuist is.
APHA (1989) Standard Methods for the Examination of Water and Wastewater, 17th edition.
American Public Health Association, Washington, D.C.
2. Sherrard cum suis konkluderen dat de respiratiesnelheid geen geschikte variabele is voor de regeling van het aktiefslibproces. Deze konklusie is niet gerechtvaardigd want zij is gebaseerd op foutieve metingen van de aktuele respiratiesnelheid.
Sherrard J.H. (1980) Communication: oxygen uptake rate as an activated sludge control
parameter. J. Wat. Pollut. Control Fed. 52, 2033.
3. Sollfrank en Gujer houden er bij de bestudering van de nitrifîkatiekinetiek ten onrechte geen rekening mee dat de vorming en oxidatie van nitriet een rol speelt.
Sollfrank U. and Gujer W. (1990) Simultaneous determination of oxygen uptake rate and
oxygen transfer coefficient in activated sludge methods by an on-line method. Wat. Res. 24,
725-732.
4. De bedenkelijke gewoonte om parameters van een niet-lineair model te schatten na een linearisatie kan worden afgeschaft nu programmatuur voor niet-lineaire regressie in ruime mate verkrijgbaar is.
5. De in de literatuur veel voorkomende gewoonte om een kinetiekvergelijking in een differentiaalvergelijking op te nemen is principieel fout omdat kinetiek een stationaire situatie veronderstelt.
6. Het opleidingsnivo van de moeder is de meest bepalende faktor voor de gebitsgezondheid van een kind.
7. De verspreiding van tuberculose via het huishoudelijke rioolwater is een reëel gevaar.

8. Het toepassen van echt rioolwater bij zuiveringstechnologisch onderzoek vergroot de kans op serendipiteuze vondsten.
9. Het noemen van het principe van een instrument in een wetenschappelijke publikatie moet worden beschouwd als het citeren van de bedenker van dat principe.
10. Door de overmaat aan wielerwedstrijden in Nederland op een kort en bochtig parcours (de zogenoemde 'rondjes rond de kerk') wordt het aanwezige wielertalent niet volledig ontwikkeld.
11. Als we in Nederland alle honden als varkens in stallen zouden huisvesten dan hadden we er een mestprobleem bij.
12. Om misverstanden over de goede werking van het zuiveringsproces te voorkomen verdient het aanbeveling de tussen-s in het woord "beluchtingstank" weg te laten.
Stellingen bij het proefschrift "Respirometry in activated sludge" van Henri Spanjers Wageningen, 29 oktober 1993

Contents
1. General introduction 1 1.1 Purpose of this study 1 1.2 Background of respiration 1 1.3 Measurement of the respiration rate 2 1.4 Newly-developed respiration meter 5 1.5 Different respiration rates 6 1.6 Short-term biochemical oxygen demand 10 1.7 Outline of this thesis 14 1.8 References 16
2. On-line meter for respiration rate and short-term biochemical oxygen demand in the control of the activated sludge process 25
25 26 28 32 33 34 39 40 41 41
3. Determining short-term biochemical oxygen demand and respiration rate in an aeration tank by using respirometry and estimation 43 3.1 Abstract 43 3.2 Introduction 44 3.3 Measurement of the respiration rate 46 3.4 Two modes of respiration measurement 48 3.5 Estimation of the BODst and the actual respiration rate 50 3.6 Materials and methods 54 3.7 Estimation of sa and ract from simulated data 56 3.8 Estimation of sa and ract from experimental data 60 3.9 Discussion 65 3.10 Conclusions 66 3.11 Notation 67 3.12 References 68
4. Determining influent short-term biochemical oxygen demand by combining respirometry and estimation 71 4.1 Abstract 71
2.1 2.2 2.3 2.4 2.5 2.6 2.7 2.8 2.9 2.10
Abstract Introduction Measurement of the respiration rate Calculation of the BODst
The experimental procedure Results Discussion Conclusions Notation References

4.2 Introduction 72 4.3 Principle of the measurement 74 4.4 Estimation of the influent BODs, 76 4.5 Materials and methods 79 4.6 Estimation of si from simulated measurements 82 4.7 Estimation of s; from experimental data 84 4.8 Discussion 88 4.9 Conclusions 90 4.10 Notation 90 4.11 References 91
5. Maximum respiration rate of activated sludge 93 5.1 Abstract 93 5.2 Introduction 94 5.3 Concept of maximum substrate respiration rate 98 5.4 Materials and methods 107 5.5 Results and discussion 110 5.6 General discussion 123 5.7 Conclusions 125 5.8 Notation 126 5.9 References 126
6. Modelling of the dissolved oxygen probe response in the improvement of the performance of a continuous respiration meter 129 6.1 6.2 6.3 6.4 6.5 6.6 6.7 6.8 6.9 6.10 6.11
Asses 7.1 7.2 7.3 7.4 7.5 7.6 7.7 7.8 7.9 7.10 7.11 7.12
Abstract Introduction Model of the DO probe response Estimation of DO concentration and probe Materials and methods Verification of the method Detection of probe fouling using the Discussion Conclusions Notation References
probe
response
response
time constant
time constant
»sment of a two-step nitrification model for activated sludge Abstract Introduction Materials and methods Nonlinear regression analysis The data set The experimental design Model calibration Model assessment Discussion Conclusions Notation References
129 130 132 134 136 138 145 148 149 149 150
153 153 154 156 156 157 161 165 167 173 178 178 178

Summary 181
Samenvatting 185
Appendix A: Calculation of the respiration rate 189
Appendix B: Condition for measurement of the actual respiration rate 194
Dankwoord 198
Curriculum vitae 199

Aan mijn vader

General introduction
1.1 Purpose of this study
Respirometry is the measurement and application of respiration rate, a key variable in the activated sludge process. The respiration rate can be used to increase our understanding of the process, which is essential for good control. The purpose of this study is to (1) develop a respiration meter capable of continuously measuring, using different procedures, the oxygen uptake rate of activated sludge and (2) expand knowledge about respiration related characteristics of wastewater and activated sludge.
1.2 Background of respiration
The activated sludge process is a widely used biological method of wastewater treatment. In this process the wastewater is brought in contact with an aerated suspension of activated sludge. Activated sludge is a flocculent mixture of an aerobic heterogenous population of micro-organisms and particulate organic .aterials. This sludge removes soluble and particulate matter from the wastewater. The activated sludge is separated from the treated wastewater by sedimentation and in this way retained in the system. Because the amount of sludge increases as a result of biomass growth and entrapment of particulate materials, surplus sludge is discharged from the system.
Although also non-biodegradable material is removed in the activated sludge process, this
study was restricted to the removal of biodegradable material. The biodégradation process
is performed by a mixed population of micro-organisms degrading multiple substrates along
2 Introduction
several reaction pathways. The incoming wastewater is characterised by a varying substrate composition and concentration and varying flow rate. This means that the properties of the biomass and the wastewater, and the kinetics of the activated sludge process are difficult to identify. There is clearly a need for measurement procedures that provide information about the wastewater and biomass properties and the process kinetics for two reasons:
First, the information can be used to extend fundamental knowledge, for instance by identifying mathematical models of the activated process. Second, the information is in the public interest because it can be used for monitoring and controlling the process, thereby saving energy costs.
In characterising the process, the biodegradable matter plays a dominant role. However, because of its heterogeneous constitution, the concentration of this material can only be expressed by a general variable. Oxidation is the main mechanism of removal of biodegradable matter. Therefore, the oxygen uptake per unit of volume and unit of time, or respiration rate, is the key variable that characterises the process and the associated removal and degradation of the biodegradable matter. Dold et al. (1980) identify the respiration rate as a most sensitive variable on the basis of which the activated sludge process theory can be validated.
1.3 Measurement of the respiration rate
Measurement of the respiration rate of activated sludge has been the subject of many studies.
Three methods can be distinguished:
- estimator method,
- exhaust gas method and - instrumental method.
The estimator method, based on a model of the dissolved oxygen (DO) dynamics in a completely mixed aeration tank, uses on-line measurements of the DO concentration and the air flow rate to calculate the respiration rate (Holmberg, 1982; Howell et al., 1984; Goto and Andrews, 1985; Howell and Sopido, 1985; Bocken et al., 1989; Hamamoto et al, 1990; Holmberg, 1990). The exhaust gas method is based on measuring the difference between the oxygen concentrations in the air entering and the air leaving the aeration tank (Kubota et al.,
1981; Redmon et al, 1983; Boyle et al, 1989; Stenstrom et al, 1989). The instrumental method uses a respiration chamber where the oxygen uptake takes place and some device
Measurement of the respiration rate 3
intended to measure the uptake of DO. This work deals with the latter category. The combination of respiration chamber and device for measuring the DO uptake is called respirometer or respiration meter.
Various respiration meters have been described in literature. They can be divided into two categories: manometric meters and meters using an electrochemical DO sensor (DO probe). The manometric technique measures the volume of oxygen used by the bacteria (Montgomery, 1967; Jenkins, 1960; Umbreit, 1972; Tebbut and Berkun, 1976; Huang and Cheng, 1984). A special version is a respiration meter which replenishes the oxygen used by the bacteria. This oxygen can be supplied from a tank (Cadena et al., 1989; Jacquez et al.,
1990) or can be generated by electrolysis (Clark, 1960; Hickey and Nagels, 1985; Tabak et
al., 1990; Hill, 1991). Most manometric respiration meters are primarily designed for determination of the biochemical oxygen demand (BOD) of wastewater or other substrates, although certain meters are capable of measuring the respiration rate itself as well (Therien and Ilhan, 1983; Huang and Cheng, 1984; Mueller and Stensel, 1990).
At present, most meters use a DO probe which measures the dissolved oxygen concentration. The respiration rate is then calculated from changes in the DO. The meter developed in this study is an example of this technique. Therefore, it will be considered further in this section. Two types of meters using a DO-probe can be distinguished: the batch respiration meter and the continuous flow-through respiration meter.
Batch meters can be either closed or open. The closed respiration meter is operated by withdrawing a sample of activated sludge from a plant, transferring it into a small vessel, aerating it, ceasing the aeration and then monitoring the decline of DO concentration with time. The respiration rate is derived from the slope of the DO decline (Lamb et al., 1964; Eye and Ritchie, 1966; Vernimmen et al., 1967; and others). One type of open respiration meter is operated in the same manner (Farkas, 1969; Takamatsu et al., 1981; Randall et al., 1991), however, this type requires prevention of the entry of oxygen from the air. Other open respiration meters are continuously aerated (Blok, 1974; Ros et al., 1988a; Vanrolleghem et al., 1990). They have the advantage that higher sludge concentrations can be used, because there is a continuous input of oxygen. Using this approach, the aeration coefficient and the saturation DO concentration under the operating condtions have to be known to calculate the respiration rate. This applies as well to a type of open batch respiration meter proposed by Ciaccio (1992). This meter consists of an aerated vessel with water and a closed reactor containing a microbial population on a carrier. It is evident that this meter cannot be used to determine the respiration rate of a particular activated sludge suspension. Although batch respiration meters are inherently discontinuous, they can be automated to operate in a semi-

4 Introduction
continuous way (Fujimoto et al., 1981; Takamatsu et al., 1981; Kanekocf al, 1985; Sekine et al., 1988a; Randall et al., 1991).
Continuous flow-through meters measure the DO concentration at the inlet and at the outlet of a closed respiration chamber through which sludge is pumped continuously. The respiration rate is calculated from the difference of the two DO measurements and the residence time. The device developed in this study is a flow-through meter of this type. Edeline et al.
(1978) described a respiration meter consisting of a coiled tube and two DO probes at both ends of the tube. Activated sludge is pumped through the tube and the respiration rate is calculated from the DO difference. This method is in fact a plug flow version of the closed batch respiration meter described above. Other meters use a completely mixed respiration chamber through which the sludge is continuously pumped (Reynolds, 1969; Clarke et al.,
1978; Chen et al., 1980; Hisset et al., 1982; Sollfrank and Gujer, 1990). In all these cases one DO probe is placed in the aeration basin while the other is located at the outlet of the respiration chamber. In the calculation of the respiration rate steady state with respect to the DO concentration is assumed. Heckershoff and Wiesmann (1986) suggested a method using two parallel respiration chambers with a closed aeration system, which are both supplied with activated sludge from an aeration tank. Additionally, one is fed with wastewater while the other is fed with tap water. The respiration rate is calculated from mass balances of oxygen over the chambers. The authors claim that this technique also allows the calculation of the wastewater BOD.
Some continuous flow-through respiration meters are not particularly designed for measuring the oxygen uptake rate. Siepmann and Teutscher (1984) proposed a meter restricted to the measurement of BOD. In this meter wastewater is continuously diluted with tap water and the mixture is led through a chamber with immobilised micro-organisms. The DO difference over the chamber is kept constant by manipulating the dilution ratio. After calibration with a standard of known BOD, this ratio is used as a measure for the wastewater BOD (Riegler, 1984; Kalte, 1990). Several continuous toxicity meters are based on the change in respiration rate but do not provide respiration rate values (Solyom et al., 1976; Pagga and Günther, 1981).
From the literature it was concluded that only a continuous flow-through respiration meter is capable of real-time monitoring the rate of oxygen uptake of activated sludge in an aeration tank. Only continuous flow-through meters can be useful for state estimation and control of the activated sludge process (Holmberg, 1982). Therefore, in this study the attention was restricted to the development of such a meter.

Newly-developed respiration meter 5
1.4 Newly-developed respiration meter
The respiration meter developed in this study consists of a closed, completely mixed chamber of 0.5 to one litre through which the activated sludge is continuously pumped (Figure 1). The characteristic feature of this meter is that the DO concentration in the sludge entering the chamber and in the sludge leaving the chamber is measured with one single probe, located at one opening. This is realised by changing the flow direction through the chamber. Initially, two probes were used and the flow direction was not changed (Spanjers, 1983; Spanjers and Klapwijk, 1987). This version, however, was unreliable, because when the probe sensitivities changed and there was a small difference between the two signals, relatively great errors resulted. The flow direction is changed using four solenoid valves excited, two by two.
DO probe
Figure 1: Design of the respiration meter.
Two problems are associated with this strategy. First, the DO concentration can only be measured when the signal of the DO meter, after changing the flow direction, has reached its end value. With the DO meter employed, it takes about 10 - 30 seconds to attain 95% of the full response. This means that the measuring frequency for the DO concentrations is limited by the response time of the DO meter. For accurate continuous measurement of the respiration rate this frequency must be increased. Therefore, a method is needed to find the end value, even when the full response has not been attained. Chapter 6 of this thesis describes a method for estimating the end value by fitting a response model of the probe to the DO measurements. The second problem is that at a specific time instant only one
6 Introduction
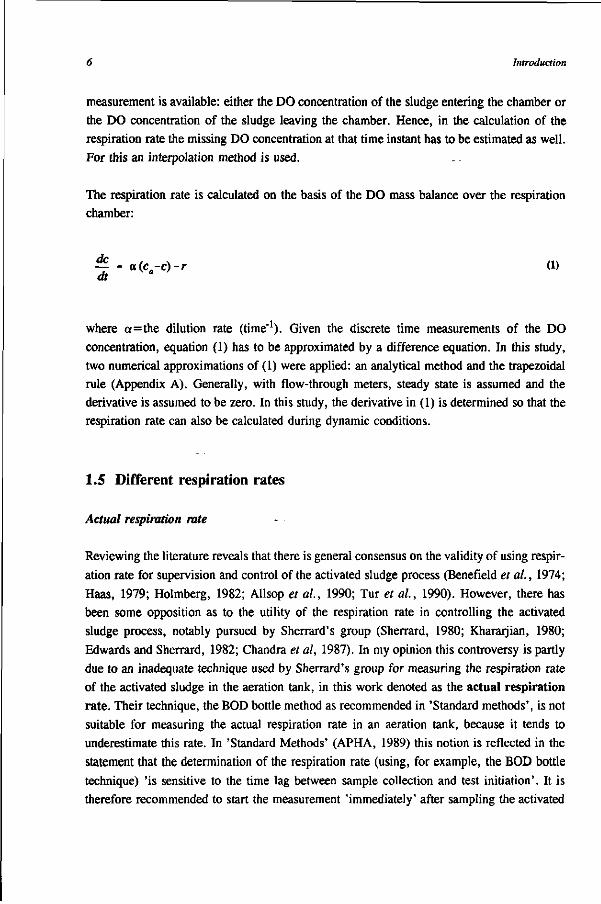
measurement is available: either the DO concentration of the sludge entering the chamber or the DO concentration of the sludge leaving the chamber. Hence, in the calculation of the respiration rate the missing DO concentration at that time instant has to be estimated as well. For this an interpolation method is used.
The respiration rate is calculated on the basis of the DO mass balance over the respiration chamber:
— - oc(c -c)-r (1) dt "
where a=the dilution rate (time"1). Given the discrete time measurements of the DO concentration, equation (1) has to be approximated by a difference equation. In this study, two numerical approximations of (1) were applied: an analytical method and the trapezoidal rule (Appendix A). Generally, with flow-through meters, steady state is assumed and the derivative is assumed to be zero. In this study, the derivative in (1) is determined so that the respiration rate can also be calculated during dynamic conditions.
1.5 Different respiration rates
Actual respiration rate
Reviewing the literature reveals that there is general consensus on the validity of using respiration rate for supervision and control of the activated sludge process (Benefield et al., 1974; Haas, 1979; Holmberg, 1982; Allsop et ai, 1990; Tur et ai, 1990). However, there has been some opposition as to the utility of the respiration rate in controlling the activated sludge process, notably pursued by Sherrard's group (Sherrard, 1980; Khararjian, 1980; Edwards and Sherrard, 1982; Chandra et al, 1987), In my opinion this controversy is partly due to an inadequate technique used by Sherrard's group for measuring the respiration rate of the activated sludge in the aeration tank, in this work denoted as the actual respiration rate. Their technique, the BOD bottle method as recommended in 'Standard methods', is not suitable for measuring the actual respiration rate in an aeration tank, because it tends to underestimate this rate. In 'Standard Methods' (APHA, 1989) this notion is reflected in the statement that the determination of the respiration rate (using, for example, the BOD bottle technique) 'is sensitive to the time lag between sample collection and test initiation'. It is therefore recommended to start the measurement 'immediately' after sampling the activated

Different respiration rates 7
sludge suspension. Moreover, it is stated that 'because test conditions are not necessarily identical to conditions at the sampling site, the observed measurement may not be identical with actual oxygen consumption rate'. Several workers reported this inaccuracy of the batch technique in determining the actual respiration rate (Allsop et al., 1990; Mueller and Boyle, 1990; Mueller and Stensel, 1990). Pfeffer et al. (1968) reported a significant decline in oxygen uptake of mixed liquor samples as the time lag between sampling and initiation of the measurement increases. Several workers using the batch technique were aware of this change in respiration rate and stated that the measurement should start as quickly as possible after sludge collection (Reinnarth and Rüffer, 1983; Suschka and Ferreira, 1986; Chandra et al., 1987; Tur et al, 1990). Yet some results are doubtful because of the delay between sampling and measurement (Duggan and Cleasby, 1976; Chandra et al., 1987). Duggan and Cleasby, for example, reported that there is a direct response of the DO concentration to load variations, while there is a dampening of the mixed liquor oxygen uptake response.
The actual respiration rate in the aeration tank (rac[) is a function of the concentration of biodegradable matter. The concentration of biodegradable matter in the aeration tank is the net result of the inflow of biodegradable compounds and the biodégradation and outflow of these compounds. When a sample of sludge is collected from the aeration basin, only the biodégradation continues, resulting in a decreasing concentration of biodegradable matter. Hence, the observed rate will be lower than raa. Sampling of sludge from the aeration tank is, in this regard, comparable to terminating the influent flow: Dold et al. (1980) observed a precipitous decrease in respiration rate at the instant of feed termination. Hence, the batch technique results in erroneous rac[ values, even when the measurement is started 'immediately' after sampling as stated in Standard Methods (APHA, 1989). The same holds for continuous flow techniques: the loading of biodegradable matter from the influent falls off when the sludge flows through the respiration chamber. The difference between the measured rate and ract depends on the kinetics and mean hydraulic residence time in the chamber.
In this work the condition is derived which makes it possible to measure ract in one completely mixed aeration tank, using a continuous flow respiration meter. To obtain a respiration rate in the chamber equal to the rate in the aeration tank, the chamber has to be loaded with the same wastewater. It is demonstrated (Appendix B) that the respiration rate in the chamber equals the actual rate in the aeration tank if simultaneously with the sludge, a sample of influent is continuously led into the chamber in such a way that the ratio of sample flow rate and chamber volume equals the ratio of influent flow and aeration tank volume.

8 Introduction
Endogenous respiration rate
The endogenous respiration rate (rend) has generated some interest as a variable for characterising the activated sludge process. It is considered to be a measure for the active biomass concentration (Brouzes, 1979; Arthur, 1982; Allsop et al., 1990; Young, 1981; J^rgensen et al, 1992). Weddle and Jenkins (1971) stated that rend divided by the volatile suspended solids concentration reflects the viable organisms content. Vandebroek (1986) used rend as an indicator for toxicity. Kappler and Gujer (1992) reported a coefficient for the production of inert COD, derived from rend. In order to determine the respiration rate due to the oxidation of soluble substrate, rend has to be subtracted from the measured rate (Dietrich and Bums, 1967; Hartmann, 1968). In some publications dealing with substrate respiration rate, the results can be questioned because rend was not subtracted (Takamatsu et
al., 1981; Huang et al, 1985; Chandra et al, 1987). Duggan and Cleasby (1976) reported that the endogenous respiration rate is not useful for monitoring the effect of influent loading, because it responds only gradually to changes in waste loading.
There is little consensus in literature as to the definition of the endogenous respiration rate. In microbiological literature rend is defined in terms of maintenance: endogenous respiration occurs when there is no observed substrate consumption and when maintenance ATP is obtained from biomass degradation (Herbert, 1958). One definition in the wastewater literature is: 'metabolic respiration of a living cell using the contents of the cell as a substrate; occurs usually when there is an absence of any other substrates' (Patry and Chapman, 1989). Another is: 'the amount of oxygen utilized per unit of MLVSS in the reactor in the absence of exogenous substrate' (Suschka & Ferreira, 1986). Bhatla et al.
(1966) stated that rend is related to the auto-oxidation of cell material and is not related to substrate from the wastewater. A residual substrate concentration remains that is due to the endogenous reaction in which end products of cell lysis become substrate again and are available for the synthesis of new cell material. However these definitions are not entirely satisfactorily because they do not clearly say what is meant with substrate in this context. Dold et al. (1980) formulated the 'death regeneration hypothesis' as opposed to the classical endogenous respiration concept. This hypothesis implies that maintenance energy per se (oxygen requirement for maintenance) is considered to be so small that it can be lumped with, and completely swamped by, the oxygen demand for the synthesis of new cell mass from the lysed substrate.
As a result of the different concepts of endogenous respiration, the opinions of how to measure rend are also different. Several workers observed that rend as measured is not constant (Suschka and Ferreira, 1986; Ros et al, 1988a) but depends on the loading

Different respiration rates 9
conditions (Bucksteeg, 1969) and on the sludge age (Holmberg and Ranta, 1982). Dietrich and Bums (1967) showed that rend does not necessarily stays constant when substrate is added to a seed, and concluded that the usual practice of subtracting the oxygen consumption of the seed from that of the test suspension may not always be valid.
Most workers reported that the respiration rate approaches a more or less constant value (rend), a certain aeration time after feed termination (continuous or batch). Authors reported various aeration times: 30 min (Mueller and Stensel, 1990; Stenstrom and Song, 1991), 1 hour (Cech et al, 1984; J^rgensen et al, 1992), 2 hours (Heckershoff and Wiesmann, 1986), 4 hours (Suschka and Ferreira, 1986), 5 hours (Dold et al, 1980). Sometimes the achievement of the endogenous respiration state was determined only qualitatively by observing a sharply decreasing rate followed by a more or less constant level (Bhatla et al, 1966; Lijklema, 1971; Therien and Ilhan, 1983; Vasel et al, 1991; Drtil et al, 1993). In case of continuous operation the respiration rate of return sludge (Arthur, 1982; Therien and Ilhan, 1983) or even, during low loading, of mixed liquor in the aeration tank (Brouzes, 1979; Stephenson et al, 1983) was considered to approach rend.
200 400 600 time (min)
800 1000
Figure 2: Respiration rate after sampling activated sludge from the aeration basin. Readily
biodegradable matter was still present in the sludge at the start of the measurement.
In this study the operational definition of rend is: the oxygen uptake per unit of volume and unit of time in the absence of readily biodegradable matter in the solution. It is assumed that the rate is associated with the oxidation of readily biodegradable matter produced by (1) hydrolysis of slowly biodegradable matter, (2) lysis of dead cells and, (3) the release of

10 Introduction
substrate for maintenance. In the next chapter the readily biodegradable matter will be specified further. In case of continuous operation the measurement of rend is realised by measuring the rate of sludge from an unfed bypass tank through which the sludge is continuously recirculated. In case of batch operation rend is measured by determining the rate after the sharp decrease which is typically observed as soon as the readily biodegradable matter has been oxidised. After this moment the respiration rate continues to decrease gradually. This is illustrated in Figure 2.
Maximum respiration rate
Measuring the maximum respiration rate can be useful for monitoring, control (Takamatsu etal., 1981), assessing toxicity (Temmink et al., 1993), estimation of biomass concentration and viability (Takamatsu et al., 1981; Huang et al., 1985; Vargas-Lopez, 1988) and determination of maximum aeration capacity (Huang et al., 1985). There is reasonable consensus that the maximum respiration rate is to be measured in the presence of excess substrate. However there seems to be limited understanding of the conditions under which an excess of substrate is attained. In this thesis the measurement of the maximum respiration rate is explicitly discussed in some detail with special emphasis on the partition of readily biodegradable matter into several components.
1.6 Short-term biochemical oxygen demand
History
The biochemical oxygen demand (BOD) is a widely used and important test in the measurement of organic pollution. Rather arbitrarily an incubation period of 5 days was adopted as the time required for oxidation of most of the organic material (Leblanc, 1974). Initially the BOD5 test was designed to assess the effect of pollutants on the oxygen content of receiving waters. Later its use was extended to the design and control of treatment plants. Because of its arbitrary character the BOD5 test represents a varying part of the ultimate BOD of different wastewaters. This observation and the fact that a period of five days is unsuitable for activated sludge process operation purposes have led to efforts to develop a quicker BOD test. In evaluating various rapid BOD test methods, Leblanc (1974) concluded that a short-term BOD test would be useful for controlling treatment plant operation. Vernimmen et al. (1967) introduced the concept of short-term biochemical oxygen demand. Short-term biochemical oxygen demand will be denoted as BODst in this work. Much

Short-term biochemical oxygen demand 11
attention has been payed to BODst in relation to process dynamics, modelling and control.
BODa as opposed to BOD5
Contrary to the BOD5 method, the BODst test uses the same micro-organisms and biomass concentration as those of the activated sludge plant under consideration. The BODst, therefore, shows better the effect of wastewater on an activated sludge plant. Moreover, the BODst represents the oxygen demand within the time limits of the process, so that it is more amenable to implementation in control strategies than the BOD5. The BOD5 test is known to give unreliable results. Könne et al. (1986), comparing BODst with the BOD5 method, concluded that the first has a better reproducibility.
Several authors tried to correlate BOD5 and a short-term BOD with varying success (Vernimmen, 1967; Arthur and Hursta, 1968; LeBlanc, 1974; Farkas, 1981; Therien and Ilhan, 1983; Arthur, 1984; Harita et al, 1985; Vandebroek, 1986; Suschka and Ferreira, 1986; Ciaccio, 1992). The goodness of correlation often appeared to be dependent on the type of wastewater. Vernimmen et al. (1967) admitted that their technique would be of doubtful value for accurate BOD prediction of wastes such as certain sewages, containing varying proportions of rapidly and slowly oxidizable substrates. Correlation was employed in the application of BOD-meters, such as the BOD probe, which thus need to be calibrated against standards with known BODst (Strand and Carlson, 1984; Riegler, 1984; Riedel et al,
1988; Lenk et al, 1990; Princz and Olah, 1990).
I do not consider it useful to investigate possible relationships between BOD5 and BODst,
because the BODst itself provides valuable information for the regulation of the activated
sludge process.
Definition and nature of BODu
In the literature there is inconsistency as to the definition of BODst. One definition is: amount of oxygen that is consumed until all the substrate of a waste sample is converted into bacterial mass (Farkas, 1981). Another is: total amount of oxygen utilized for the bio-oxidation of substrate (Suschka and Ferreira, 1986). Vernimmen et al. (1967) defined the BODst in operational terms as the amount of oxygen utilised in addition to the endogenous oxygen consumption after introduction of'a limited volume of a sample into a batch respiration meter containing activated sludge. The latter definition depends strongly on the

12 Introduction
endogenous respiration rate. However, the authors did not specify rend.
In this thesis BODst is defined in a similar operational way, but irrespective of the respiration meter: the BODst is the amount of oxygen utilised in addition to the endogenous oxygen consumption. Since in this thesis rend is defined as the oxygen uptake per unit of volume and unit of time in the absence of readily biodegradable matter, the BODst is due to the oxidation of readily biodegradable matter. In this study, nitrification, if occurring, is considered to be included in the BODst. Henze (1992) found that the readily biodegradable matter includes acetic acid (42%), higher volatile fatty acids, lower amino acids, simple carbohydrates (each 17%) and alcohols (8%). However, he excluded ammonium.
The definition given above is in agreement with the approach of Dold et al. (1980). The authors suggested to make a distinction, based on biological response, not on physical separation, between readily and slowly biodegradable organic matter. They hypothesized that readily biodegradable substrate consists of small simple soluble molecules that can pass through the cell wall. Slowly biodegradable substrate consists of larger complex molecules and particulate matter that cannot pass the cell wall but are adsorbed and hydrolysed into readily biodegradable substrate that passes directly to the organisms. The hydrolysis is slow and rate limiting.
Respirometric methods for the determination of BODa
In most cases batch BODst tests use the same biomass concentration as that of the activated sludge plant. Because the tests imply higher oxygen demands, there are special requirements for the oxygen supply and hence the BOD botlle technique generally does not satisfy. Respirometric BOD tests were reviewed by Jenkins (1960), Montgomery (1967), LeBlanc (1974) and Vasel et al. (1991). Because of inconsistency, as mentioned before, these tests do not yield comparable BOD values at all. In some cases a "rapidly determined BOD5" is meant, in other cases the BODst is considered to be an individual measure of waste concentration, in agreement with my own viewpoint.
Ekama et al. (1986) described three methods for estimating the readily biodegradable chemical oxygen demand. The first method involves feed termination in a flow-through activated sludge process and subsequent monitoring of the respiration rate. Knowledge of several stoichiometric constants is required to calculate the BODst. The second method consists of mixing wastewater and sludge and subsequently monitoring the respiration rate in a batch reactor. The readily biodegradable chemical oxygen demand is then calculated

Short-term biochemical oxygen demand 13
from the area between endogenous and substrate respiration rate. The third method, also described by Kristensen et al. (1992), is identical to the second except for the utilisation of nitrate as electron acceptor instead of oxygen.
The second method has been used by far most frequently (see section 'Measurement of the respiration rate') and it is also used in this work. Other methods are based on a continuous flow-through respiration meters and BOD probes as described above. Additionally, in this work, a method is developed for measuring on-line the influent BODst.
Wastewater utilised in this study
All results (except one) of this study are based on the operation with presettled domestic wastewater from the village of Bennekom and activated sludge grown on this wastewater. The major fraction of the wastewater is of domestic origin; a small portion (7%) originates from a hospital. Compared with the COD, the BODst of this wastewater is relatively high. This is illustrated in Table 1, where a comparison is made with data from literature. The oxygen needed for nitrification is responsible for the high ratio found in this study.
Table 1: Ratio of BOD^ to total wastewater COD (readily biodegradable matter expressed as a percentage of total COD). Data in this work represent averages of duplicate measurements. References refer to BODst tests with suppressed nitrification.
type of wastewater % BOD., reference
municipal
municipal and domestic
raw
primary
pre-precipitated
presettled domestic (nitrification included)
14
7-32
16-33
56
261
Sollfrank & Gujer (1991)
Henze (1992)
this work
562
!wet weather conditions: low COD (236 mg 1~') and N-Kjeldahl (28 mg l"1) 2average weather conditions: medium COD (312 mg l"1) and N-Kjeldahl (60 mg l"1)

14 Introduction
The BODst of the wastewater utilised in this study originates from soluble matter. This is illustrated in Figure 3, where the analysis results in relation to various filtrates of the wastewater are compared. The BODst turned out to be independent of filtration: the raw wastewater and the 0.45 ^m filtrate had equal BODst. Assuming that the 0.45 urn filtrate only contained dissolved matter (Gujer, 1980), it is concluded that the readily biodegradable matter in the wastewater used consisted of dissolved substrate. This is in agreement with the conclusions of others (Dold et ah, 1980, 1986; Henze et al, 1987).
300
200
O)
E
100
unfiltered Red Ribbon 1.2fim 0.45/xm BB BODst m COD ESS Nkj ca NH4
Figure 3: BODst (mgOJT1), COD (mgOj:1), N-Kjeldahl (mgNT1) and ammonium (mg NT1)
of various filtrates of the presented wastewater. Filters used (all Schleicher & Schuell): Red
Ribbon 589s, membrane ME 28 1.2 urn and membrane BA 85 0.45 \»m.
1.7 Outline of this thesis
The chapters in this thesis are all presented as publications (published or to be published),
each of which can be read independently. Necessarily this involves some repetition of
theories and methods. They do not follow the chronological order of the publications but are
arranged so that they form a systematic structure.
The experimental research described in chapters 2, 3, 4 and 5 was performed using a pilot plant with one single completely mixed aeration tank of 475 m3. Next to the experiments described in these chapters batch experiments were performed using an aerator of 1.5 to 2 litre. The batch reactor was used exclusively in the research described in chapters 6 and 7.

Outline of this thesis 15
Chapter 2 presents the respiration meter used along with measuring procedures for obtaining information on the activated sludge process in one single completely mixed tank. The procedures consist of on-line measurement of four types of respiration rate of the same sludge under different conditions: endogenous, instantaneous, actual and maximum respiration rate. A method is presented for monitoring the influent and effluent BODst. It uses three of the four rates mentioned above. The importance of nitrification as part of the BODst
is discussed. Control schemes, based on the different types of respiration rate, are suggested.
In chapter 3 an improved method for measuring the actual respiration rate is introduced. In contrast to the method in chapter 2, this method also makes it possible to measure the actual respiration rate in the second compartment of a plug flow reactor or further downstream. The method involves the measurement of the transient respiration rate during two different modes of operation of the measuring system, which are alternately executed. The BODst in the completely mixed aeration tank is estimated by choosing predetermined boundary conditions. The measured respiration rate and the estimated BODst in the respiration chamber are used to find the kinetic relationship between these two variables. Finally, this relationship is used to calculate the actual respiration rate. The result of this procedure is compared with the actual respiration rate as measured according to the method presented in chapter 2.
Chapter 4 describes mutatis mutandis a technique and estimation algorithm similar to those described in chapter 3, to estimate the influent BODst on-line. In order to verify the estimated values, the BODst is also independently determined in batch tests.
In chapter 5 the measurement of the maximum respiration rate as described in chapter 2 is explained in some detail. Especially the conditions under which this rate needs to be measured are discussed. An application of the measurement is described. It concerns the effect of the influent flow on the maximum respiration rate.
Chapter 6 describes an improvement of the evaluation of the respiration meter results which accounts for the time lag of the DO probe. The real DO concentration at the end of each response is estimated by fitting the DO measurements to a first-order response model of the probe. An additional result of this strategy is that it yields the time constant of the probe response, which provides a diagnosis of the probe condition.
Chapter 7 is an application of using the respiration rate for identifying a mathematical model of a subprocess in the activated sludge. Nitrification is chosen because there is need for a better model of this process including both nitrification steps (Grady, 1989). Since nitrification involves a high uptake of oxygen, respiration rate is a useful variable for

16 Introduction
identifying this process. Because an optimal experimental design and a good model validation method are needed, the investigation described in this chapter was focused on these items. The batch experimental procedure described in chapters 2, 4 and 5 was used in this investigation.
1.8 References
Allsop P.J., Moo-Young M. and Sullivan G.R. (1990) The dynamics and control of substrate
inhibition in activated sludge. Critical Reviews in Environmental Control 20, 115-167. APHA (1989) Standard Methods for the Examination of Water and Wastewater, 17th edition.
American Public Health Association, Washington, D.C. Arthur R.M. (1982) Activated sludge process control series. Volume 1: New concepts and
practices in activated sludge process control. Arthur Technology Inc. Arthur R.M. and Hursta W.N. (1968) Short term BOD using the automatic respirometer.
23th Purdue Ind. Waste Conf. Proc., 242-250. Arthur R.M. (1984) Twenty years of respirometry. 39th Purdue Ind. Waste Conf. Proc,
861-874. Arthur R.M. (1984) Discussion: measurement and validity of oxygen uptake rate as an
activated sludge control parameter. J. Wat. Pollut. Control Fed. 56, 1, 111. Benefield L.D., Randall C.W. and King P.H. (1974) Process control by oxygen uptake and
solids analysis. J. Wat. Pollut. Control Fed. 47, 2498. Bhatla M.N., Stack V.T. and Weston R.F. (1966) Design of wastewater treatment plants
from laboratory data. J. Wat. Pollut. Control Fed. 38, 601-613. Blok J. (1974) Respirometric measurements on activated sludge. Wat. Res 8, 11-18. Bocken S.M., Braae M. and Dold P.L. (1989) Dissolved oxygen control and oxygen
utilization rate estimation: extension of the Holmberg/Olsson method. Wat. Sei. Technol.
21, 1197-1208. Boyle W.C., Hellstrom B.G. and Ewing L. (1989) Oxygen transfer efficiency measurements
using off gas techniques. Wat. Sei. Technol. 21, 10/11, 1295-1300. Brouzes P.H. (1979) Monitoring and controlling activated sludge plants in connection with
aeration. Prog. Wat. Tech. 11, (3), 193-200. Bucksteeg W. (1969) Discussion of: Physical and biochemical aspects of B.O.D. kinetics
(Hartmann L. and Wilderer P.). 4th Int. Conf. on Water Pollut. Control Res., Prague. Adv. Water Pollut., 253-254.
Cadena F., Drohobyczer A., Beach M.I. and Barnes D. (1989) A novel approach to
simplified respirometric oxygen demand determinations. 43rd Purdue Ind. Waste Conf.
Proc, 459-467.

References 17
Cech J.S., Chudoba J. and Grau P. (1984) Determination of kinetic constants of activated sludge microorganisms. Wat. Sei. Technol. 17, 259-272.
Chandra S., Mines R.O. and Sherrard J.H. (1987) Evaluation of oxygen uptake rate as an
activated sludge control parameter. J. Wat. Pollut. Control Fed. 59, 1009-1016. Chen C.Y., Roth J.A. and Eckenfelder W.W. (1980) Response of dissolved oxygen to
changes in influent organic loading to activated sludge systems. Wat. Res. 14, 1449-1457. Ciaccio L.L. (1992) Instrumental determination of the energy oxygen and BOD5. Wat. Sei.
Technol. 26, No. 5-6, 1345-1353. Clark J.W. (1960) Wat. Sewage Wks 107, 140-145. Clarke A.N., Eckenfelder W.W. and McMullen E.D. (1978) Development of a continuous
respirometer. Wat. Res. 12, 799-804. Dietrich S.M.C. and Burns R.H. (1967) J. Bact. 93, 1467-1470. Dold P.L., Ekama G.A. and Marais G.v.R (1980) A general model for the activated sludge
process. Prog. Wat. Tech. 12, (6), 47-77. Dold P.L. and Marais G.v.R. (1986) Evaluation of the general activated sludge model
proposed by the IAWPRC Task Group. Wat. Sei. Technol. 18, 63-89. Drtil M., Németh P. and Bodfk I. (1993) Kinetic constants of nitrification. Wat. Res. 27,
35-39. Duggan J.B. and Cleasby J.L. (1976) Effect of variable loading on oxygen uptake. J. Wat.
Pollut. Control Fed. 48, 40-550. Edeline F., Lambert G. and Sueiras F. (1978) Un respiromètre continu simple pour le
contrôle des boues activées. La tribune du Cebedeau 414, 211-215. Edwards G.L. and Sherrard J.H. (1982) Measurement and validity of oxygen uptake rate as
an activated sludge process control parameter. J. Wat. Pollut. Control Fed. 54, 1546-1552.
Ekama G.A., Dold P.L. and Marais G.v.R. (1986) Procedures for determining influent COD
fractions and the maximum specific growth rate of heterotrophs in activated sludge systems. Wat. Sei. Technol. 18, (6), 91-114.
Eye J.C. and Ritchie C.C. (1966) Measuring BOD with a membrane electrode system. J.
Wat. Pollut. Control Fed. 38, 1430-1440. Farkas P. (1969) Method for measuring aerobic decomposition activity of activated sludge
in an open system. 4th Int. Conf. on Water Pollut. Control Res., Prague. Adv. Water
Pollut., 309-317. Farkas P.A. (1981) The use of respirography in biological treatment plant control. Wat. Sei.
Technol. 13, 125-131 (Munich). Fujimoto E., Iwahori K. and Sato N. (1981) Automatic measurement device of the respir
ation rate and experimental investigation on the constant DO control by using the device
for the activated sludge process. Wat. Sei. Technol. 13, 193-198 (Munich).
18 Introduction
Goto M. and Andrews J.F. (1985) On-line estimation of oxygen uptake rate in the activated
sludge process. In Proc. 4th IAWPRC Workshop on Instrumentation and Control of Water
and Wastewater Treatment and Transport Systems, 27 April - 4 May. Houston and Denver, U.S.A., pp. 465-472.
Grady, C.P.L. Jr. (1989) Dynamic modeling of suspended growth biological wastewater
treatment processes, in: Patry & Chapman (eds.) Dynamic Modeling and Expert Systems in Wastewater Engineering. Lewis Publishers, Inc. 1-38.
Gujer W. (1980) The effect of particulate organic material on activated sludge yield and oxygen requirement. Wat. Sei. Technol. 13 (1, Toronto), 79-95.
Haas C.N. (1979) Oxygen uptake rate as an activated sludge control parameter. J. Wat.
Pollut. Control Fed. 51, 938-943. Hamamoto Y., Ideshita Y. and Nonaka H. (1990) Application of a system with automatic
control of aeration time to the intermittent-aeration activated sludge process in an existing
wastewater treatment plant. In Proc. 4th IAWPRC Workshop on Instrumentation and
Control of Water and Wastewater Treatment and Transport Systems, 26 July - 3 August, Yokohama and Kyoto, Japan, pp. 103-112.
Harita K., Otani Y., Hikuma M. and Yasuda T. (1985) BOD quick estimating system utilizing a microbial electrode. In Proc. 4th IAWPRC Workshop on Instrumentation and
Control of Water and Wastewater Treatment and Transport Systems, 27 April - 4 May. Houston and Denver, U.S.A., pp. 529-532.
Hartmann L. (1968) Toxicity measurements in activated sludge. Journal San. Eng. Proc.
Am. Soc. Civil Engr. 94, SA2, 247. Heckershoff H. and Wiesmann U. (1986) Ein neues Meßgerät für die Betriebskontrolle und
Reglung von Belebtschlammanlagen. Teil 1: Messung der Substratkonzentration.
Korrespond. Abwass. 33, 6, 508-513. Heckershoff H. and Wiesmann U. (1986) Ein neues Meßgerät für die Betriebskontrolle und
Reglung von Belebtschlammanlagen. Teil 2: Messungen zur Atmungsaktivität von
Belebtschlämmen und zur reaktionskinetik. Korrespond. Abwass. 33, 7, 600-606. Henze M., Grady C.P.L. Jr., Gujer W., Marais G.v.R. and Matsuo T. (1987) IAWPRC
Task Group on Mathematical Modelling for Design and Operation of Biological
Wastewater Treatment. Activated Sludge Model No. I, Scientific and Technical Reports No. 1, IAWPRC, London, England.
Henze M. and Gujer W. (eds.) (1992) Interactions of wastewater, biomass and reactor
configurations in biological treatment plants. Wat. Sei. Technol. 25, No 6. Henze M. (1992) Characterization of wastewater for modelling of activated sludge processes.
Wat. Sei. Technol. 25, No 6, 1-15. Herbert D. (1958) Some principles of continuous culture. In Recent Progress in Microbiology
3, 381-396. G. Tunevall, Ed. (Almquist and Wiksell, Stockholm) VII Intern. Congr. for

References 19
Microbiology. Hickey C.W. and Nagels J.W. (1985) Modifications to electrolytic respirometer systems for
precise determination of BOD exertion kinetics in receiving waters. Wat. Res. 19, 463-470.
Hill J.B., Bleam R.D., Zitrides T.G. and McDowell CS . (1991) Advanced measurement cells for automated quantification of biodegradative microbial oxygen uptake in fluid,
semi-solid and solid media. 45th Purdue Ind. Waste Conf. Proc, 491-499. Hissett E., Deans A and Evans M.R. (1982) Oxygen consumption during batch aeration of
piggery slurry at temperatures between 5 and 50 C. Agricultural Wastes 4, 477-487. Holmberg A. (1982) Modelling of the activated sludge process for microprocessor-based state
estimation and control. Wat. Res. 16, 1233-1246. Holmberg A. and Ranta J. (1982) Procedures for parameter and state estimation of microbial
growth process models. Automatica 18, 181. Holmberg U. (1990) On identification of dissolved oxygen concentration dynamics. In Proc.
4th IAWPRC Workshop on Instrumentation and Control of Water and Wastewater
Treatment and Transport Systems, 26 July - 3 August, Yokohama and Kyoto, Japan, pp. 113-119.
Howell J.A., Yust L.J. and Reilly P.J. (1984) On-line measurement of respiration and mass transfer rates in an activated sludge aeration tank. J. Wat. Pollut. Control Fed. 56, 319-324.
Howell J.A. and Sopido B.O. (1985) On-line respirometry and estimation of aeration
efficiencies in an activated sludge aeration basin from dissolved oxygen measurements. IFAC symp. Modelling and Control of Biotechnological Processes, Noordwijk, The
Netherlands. Huang J.Y.C. and Cheng M.D. (1984) Measurement and new applications of oxygen uptake
rates in activated sludge processes. J. Wat. Pollut. Control Fed. 56, 259-265. Huang J.Y.C, Cheng M.D. and Mueller J.T. (1985) Oxygen uptake rates for determining
microbial activity and application. Wat. Res. 19, 373-381. Jacquez R.B., Cadena F., Prabhakar S. and Beach, M.I. (1990) 46. gas transfer limitations
in environmental respirometry. 44th Purdue Ind. Waste Conf. Proc, 425-433. Jenkins D. (1960) The use of manometric methods in the study of sewage and trade wastes.
Waste Treatment, Pergamon Press, New York, 99. J^rgensen P.E., Eriksen T. and Jensen B.K. (1992) Estimation of viable biomass in
wastewater and activated sludge by determination of ATP, oxygen utilization rate and FDA hydrolysis. Wat. Res. 26, 1495-1501.
Kalte P. (1990) The continuous measurement of short-time BOD. In Proc. 4th IAWPRC
Workshop on Instrumentation and Control of Water and Wastewater Treatment and
Transport Systems, 26 July - 3 August, Yokohama and Kyoto, Japan, pp. 59-65.

20 Introduction
Kaneko M., Kawachi K. and Matsumoto A. (1985) Evaluation of oxygen uptake rate analyzer in wastewater treatment plants. In Proc. 4th IAWPRC Workshop on
Instrumentation and Control of Water and Wastewater Treatment and Transport Systems,
27 April - 4 May. Houston and Denver, U.S.A., pp. 521-524. Kappeier J. and Gujer W. (1992) Estimation of kinetic parameters of heterotrophic biomass
under aerobic conditions and characterization of wastewater for activated sludge modelling. Wat. Sei. Technol. 25, No 6, 125-139.
Khararjian H.A. (1980) Communication: Oxygen uptake rate as a control parameter. J.
Water Pollut. Control Fed. 52, 823-824. Könne M., Siepmann F.W. and Te Heesen D. (1986) Der BSB5 und der kontinuierliche
Kurzzeit-BSB (BSB-M3) im Vergleich. Korrespond. Abwass. 33, 787-793. Kristensen G.H., Jorgensen P.E. and Henze M. (1992) Characterization of functional
microorganism groups and substrate in activated sludge and wastewater by AUR, NUR and OUR. Wat. Sei. Technol. 25, (6), 43-57.
Kubota H., Fujie K. and Kasakura T. (1981) Automatic monitoring of exhaust gas analysis
in activated sludge wastewater treatment process. Wat. Sei. Technol. 13, 159-164. Lamb J.C., Westgarth W.C., Rogers J.L. and Vernimmen A.P. (1964) A technique for
evaluating the biological treatability of industrial wastes. J. Wat. Pollut. Control Fed. 36, 1263-1284.
Leblanc P.J. (1974) Review of rapid BOD test methods. J. Wat. Pollut. Control Fed. 46, 2202-2208.
Lenk S., Peukert V. and Bier T. (1990) Prozeßanalyse und -Steuerung biologischer Reinigungsstufen mit einem Plateau-BSB-Meßgerät. Wasserwirtschaft Wassertechnik 40, 4-7.
Lijklema L. (1971) Factors affecting pH change in alkaline wastewater treatment - II Carbon
dioxide production. Wat. Res. 5, 123-142. Montgomery H.A.C. (1967) The determination of biochemical oxygen demand by
respirometric methods. Wat. Res. 1, 631-662. Mueller J.A. and Boyle W.C. (1988) Oxygen transfer under process conditions. J. Wat.
Pollut. Control Fed. 60, 332-341. Mueller J.S. and Stensel H.D. (1990) Biologically enhanced oxygen transfer in the activated
sludge process. J. Wat. Pollut. Control Fed. 62, 193-203. Pagga U. and Günthner W. (1981) The BASF toximeter - a helpful instrument to control and
monitor biological wastewater treatment plants. Wat. Sei. Technol. 13, 233-238. Patry G.G. and Chapman D. (eds.) (1989) Dynamic modelling and expert-systems in
wastewater engineering. Lewis Publishers, Inc. Pfeffer J.T. et al. (1968) Field evaluation of aerators in activated sludge systems. 23rd
Purdue Ind. Waste Conf. Proc, 183-194. Princz P. and Olah J. (1990) BOD measurement of non-toxic wastewaters with an improved

References 21
microbial probe. In Proc. 4th IAWPRC Workshop on Instrumentation and Control of Water
and Wastewater Treatment and Transport Systems, 26 July - 3 August, Yokohama and Kyoto, Japan, pp. 79-87.
Randall E.W., Wilkinson A. and Ekama G.A. (1991) An instrument for the direct
determination of oxygen uptake rate. Water SA 17, 11-18. Redmon D., Boyle W.C. and Ewing L. (1983) Oxygen transfer efficiency measurements in
mixed liquor using off gas techniques. J. Wat. Pollut. Control Fed. 55, 1338-. Reinnarth G. and Rüffer H. (1983) Bestimmung der Sauerstoffverbrauchsraten von
Belebtschlamm. Vom Wasser 60, 223-235. Reynolds L.F. (1969) Discussion: Farkas P., method for measuring aerobic decomposition
activity of activated sludge in an open system. 4th Int. Conf. on Water Pollut. Res.,
Prague. Adv. Water Pollut. Res. Riedel K., Renneberg R., Kühn M. and Scheller F. (1988) A fast estimation of biochemical
oxygen demand using microbial sensors. Appl. Microbiol. Biotechnol. 28, 316-318. Riegler G. (1984) Kontinuierliche Kurzzeit-BSB-Messung. Korrespond. Abwass 31,369-377. Ros M., Dular M. and Farkas P.A. (1988a) Measurement of respiration of activated sludge.
Wat. Res. 22, 1405-1411. Ros M., Dular M. and Farkas P. (1988b) An improved method using respirography for the
design of activated sludge aeration systems. Wat. Res. 22, 1483-1489. Sekine T., Sato S., Furuya N. and Sunuhara H. (1988a) Supervision and control of the
activated sludge process utilising the respiration rate activity. Env. Technol. Lett. 9, 1317-1327.
Sekine T., Tsugura H., Urushibara S., Furuya N. and Matsui S. (1988b) Evaluation of settleability and separation characteristics of activated sludge by a turbidity meter -incorporating SVI meter. Env. Technol. Lett. 9, 647-654.
Sherrard J.H. (1980) Communication: oxygen uptake rate as an activated sludge control
parameter. J. Wat. Pollut. Control Fed. 52, 2033. Siepmann F. and Teutscher M. (1984) Abschlußbericht zum F+E-Vorhaben 102--WA 161
Bau und Erprobung eines Meßgeräteprototyp zur kontinuierlichen Kurzzeit-BSB- und Toxizitätsmessung. BMFT Abt. Umweltforschung.
Sollfrank U. (1988) Bedeutung Organische Fraktionen in Kommunalem Abwasser im
Hinblick auf die mathematische Modellierung von Belebtschlammsystemen. Ph.D. Thesis, ETH, Zürich.
Sollfrank U. and Gujer W. (1990) Simultaneous determination of oxygen uptake rate and
oxygen transfer coefficient in activated sludge methods by an on-line method. Wat. Res.
24, 725-732. Sollfrank U. and Gujer W. (1991) Characterisation of domestic wastewater for mathematical
modelling of the activated sludge process. Wat. Sei. Technol. 23, 1057-1066.
22 Introduction
Solyom P., Boman B. and Bjorndal H. (1976) Continuous monitoring of acute - toxic
substances in wastewater. Prog. Wat. Tech. 8, 417-422. Spanjers H. (1983) Regelen van een aktiefslibinrichting d.m.v. een digitaal meet- en
regelsysteem. M.Sc. Thesis, Department Water Pollution Control, Wageningen Agricultural University, The Netherlands.
Spanjers H. and Klapwijk A. (1987) The Wazu-respiration meter. A breakthrough in automation and control of a wastewater treatment plant. 10th Symposium on Wastewater
treatment, November 1987, Montreal, Québec, Canada. Stenstrom M.K., Kido W., Shanks R.F. and Mulkerin M. (1989) Estimating oxygen transfer
capacity of a full-scale pure oxygen activated sludge plant. J. Wat. Pollut. Control Fed.
61, 208-220. Stenstrom M.K. and Song S.S. (1991) Effects of oxygen transport limitation on nitrification
in the activated sludge process. / . Wat. Pollut. Control Fed. 63, 208-219. Stephenson J.P., Monaghan B.A. and Yust L.J. (1983) Pilot scale investigation of
computerized control of the activated sludge process. Report SCAT-12, Environmental Protection Service, Environment Canada, O.
Strand S.E. and Carlson D.A. (1984) Rapid BOD measurement for municipal wastewater
samples using a biofilm electrode. J. Wat. Pollut. Control Fed. 56, 464-467. Suschka J. and Ferreira E. (1986) Activated sludge respirometric measurements. Wat. Res.
20, 137-144. Tabak H.H., Desai S. and Govind R. (1990) Determination of biodegradability kinetics of
RCRA compounds using respirometry for structure-activity relationships. 44th Purdue Ind.
Waste Conf. Proc, 405-423. Takamatsu T., Shioya S., Yokoyama K., Kurome Y. and Morisaki K. (1981) On-line
monitoring and control of biochemical reaction processes, proc. 8th IFAC World
Congress, Kyoto, Preprints Vol XXII, 146-151. Tebbut T.H.Y. and Berkun M. (1976) Respirometric determination of BOD. Wat. Res. 10,
613-617. Temmink H., Vanrolleghem P., Klapwijk A. and Verstraete W. (1993) Biological early
warning systems for toxicity based on activated sludge respirometry. Accepted for publication, 6th IAWQ Workshop on Instrumentation, Control and Automation of Water
& Wastewater Treatment and Transport Systems. June 17-25, Banff and Hamilton, Canada.
Therien N. and Ilhan F. (1983) Relating BOD5 with on-line oxygen uptake rate measurements using automatic respirometers in view of process monitoring and control. In:
Procedures and Practices in Activated Sludge Process Control (R.M. Arthur, ed.), Ann Arbor Science, Ann Arbor, MI, 113-129.
Tur M, Tseng L., Chou M., Fang H. and Hsia J. (1990) Application of oxygen uptake rate

References 23
in managing an activated sludge process for treating refinery wastewater. 44th Purdue Ind.
Waste Conf. Proc, 695-701. Umbreit W.W., Buris R.H. and Stauffer J.F. (1964) Manometric methods. 4th edition,
Bargess, Minneapolis. Vandebroek R. (1986) Study and development of a microcomputer controlled sensor for the
determination of the biodegradability and the toxicity of wastewaters: Ph.D. thesis, University of Ghent, Belgium.
Vanrolleghem P., Dries D. and Verstraete W. (1990) RODTOX: biosensor for rapid
determination of the biochemical oxygen demand and the on-line monitoring of the toxicity of wastewaters. In Proceedings Fifih European Congress on Biotechnology. 8-13 July, Copenhagen, Denmark, Vol 1, pp 161-164.
Vargas-Lopes CE. (1988) The relationship between respiration rate and microbial activity and kinetic modelling of the activated sludge extended aeration process. Ph.D. thesis, Department of Civil Engineering, The University of Leeds, England.
Vasel J.L., Warnier P., Jupsin H. and Schrobiltgen P. (1991) Automatisation et comparaison
de différentes méthodes respirométriques d'estimation rapide de la DBO. Revue des
Sciences de l'Eau 4, 415-435. Vernimmen A.P., Henken E.R. and Lamb J.C. (1967) A short-term biochemical oxygen
demand test. J. Wat. Pollut. Control Fed. 39, 1006-1020. Weddle C.L. and Jenkins D. (1971) The viability and activity of activated sludge. Wat. Res.
5, 621-640. Young J.C. (1981) Specific oxygen demand as an operating parameter for activated sludge
processes. Wat. Sei. Technol. 13, 397-403.

25
On-line meter for respiration rate and short-term biochemical oxygen demand in the control of the activated sludge process
2.1 Abstract
A meter, based on a novel principle, is described for monitoring of the respiration rate of activated sludge and, as a derivative, the short-term biochemical oxygen demand (BODst). Operational implications and reliability are discussed. A method is presented for measuring four respiration rates of the same sludge under different conditions. These rates are: the endogenous, the instantaneous, the actual and the maximum respiration rate. Theoretical and experimental conditions for the measurement of the different rates are discussed. It is shown that the BODst of both influent and effluent can be calculated from three of the four respiration rates. The method is applied to a completely mixed continuous-flow activated sludge pilot plant. Results from two experimental set-ups are shown and discussed. There is some evidence that the maximum respiration rate is dependent on the loading. It is concluded that the measurements provide relevant information on the activated sludge process and in addition that the influent and effluent BODst can also be calculated. The BODst of the examined wastewater appears to be predominantly caused by ammonium being oxidized by nitrifiers. The measurements can be used to control activated sludge plants with respect to sludge loading, dissolved oxygen concentration and sludge balance. Control schemes are suggested.
Published as: Spanjers H. and Klapwijk A. (1990) On-line meter for respiration rate and short-term biochemical oxygen demand in the control of the activated sludge process. In Advances in Water Pollution Control, Proc. 5th IAWPRC Workshop, 26 July-3 August, Yokohama and Kyoto, Japan.

26 On-line meter for respiration rate and BODsl
2.2 Introduction
The respiration rate of activated sludge and the short-term biochemical oxygen demand (BODst) are valuable variables for the control of activated sludge processes. In contrast with traditional variables like BOD5 and TOC, these variables are related to the biological process itself. The respiration rate is one of the few directly measurable variables. It provides information as to the loading to the plant (Holmberg, 1982) and it can also indicate toxic effects on the activated sludge (Vandebroek, 1986). The respiration rate can also be used as a quantity from which otherwise poorly accessible variables such as the biomass concentration can be estimated (Takamatsu et al., 1981). In the work described here we used the respiration rate to estimate the BODst of both the influent and the effluent. Such information can be used for effective control of the activated sludge process.
The respiration rate can be estimated in situ using the measurement of dissolved oxygen concentration in the aeration tank (Holmberg et al., 1989). Holmberg (1982) showed that a dynamic model of the activated sludge process can be used for on-line estimation of the influent BOD-loading and the effluent BOD.
Another approach is to use an on-line respiration meter. Such a meter is often operated by withdrawing a sample of activated sludge into a small vessel, aerating it, and then monitoring the decline in the dissolved oxygen concentration with time (Fujimoto et al.,
1981; Kaneko et al., 1985). The difficulty with this batch method is that at the actual time of measurement, the readily biodegradable compounds may have been oxidized already, resulting in the respiration rate being close to the endogenous rate. The state within the respiration meter would then differ substantially from that in the aeration tank itself.
Continuous flow-through meters which measure the oxygen concentration at the inflow and at the outflow of a respiration chamber do not have this problem (Edeline et al.,
1978; Sollfrank and Gujer, 1985). Flow-through meters with two oxygen probes may be subject to problems when the probe sensitivities change and a small difference between two signals exists.
Respiration measurements can be combined with measurement of the BOD. In batch procedures a sample of water is added to sludge which is either sampled from the aeration tank (Vernimmen et al., 1967) or has been grown separately (either fixed or not) (Vandebroek, 1985) and which has the endogenous respiration rate. The respiration rate is

Introduction 27
then monitored continuously until the endogenous level is reached again. The (short-term) BOD is the excess amount of oxygen additionally used to the endogenous oxygen consumption. The disadvantage of this method is that it is not continuous. In the case of separately grown sludge also the state of the sludge may differ substantially from that in the aeration tank. The measurements should be done under conditions as close as possible to those in the aeration tank.
In continuous procedures water is conducted to either a separate sludge system (Könne et
al., 1986) or is mixed with sludge from the aeration tank in an aerated reaction vessel (Heckershoff and Wiesmann, 1986). The last method is complicated, the measurement time of 1 up to 4 hours is lengthy and the calculation of the effluent BODst is not obvious.
In this chapter we describe a meter for monitoring the respiration rate of activated sludge from which the BODst can be derived. The device consists of a pump, a respiration chamber through which the sludge flows continuously, and one single oxygen probe. Contrary to other systems the same probe is used for measuring the oxygen concentration at the inlet and at the outlet of the respiration chamber.
In addition we propose a method for measuring four respiration rates of the same sludge under different conditions, at a continuous flow activated sludge plant, namely the endogenous respiration rate, the instantaneous respiration rate, the actual respiration rate and the maximum respiration rate.
Furthermore, we demonstrate that, at a continuous flow activated sludge plant, the BODst
can be calculated from three respiration rates: the endogenous, the instantaneous and the actual respiration rate. BODst mass balance equations for the respiration chamber are used for these calculations.
It is concluded that the measurements supply relevant information on the activated sludge process and that the influent and effluent BODst can also be calculated. The BODst of the examined wastewater appears to be predominantly caused by the oxidation of ammonium by nitrifiers.

28 On-line meter for respiration rate and BODst
2.3 Measurement of the respiration rate
Respiration meter
The respiration meter (Figure 1) is commercially available (Manotherm, The Netherlands) and consists of a closed, completely mixed respiration chamber of one litre through which the activated sludge is continuously pumped. Dissolved oxygen concentration is periodically measured with one and the same probe at the inlet as well as at the outlet of the respiration chamber. This is achieved by alternating the flow direction. In this design the varying flow direction has no impact on the process in the respiration chamber, hence the flow can be assumed to be continuous.
A b e ? " - - $ oxV9en Probe
valves
pumps (A)
to aeration tank
valves
wastewater sludge from sludge from aeration tank bypass tank
Figure 1: Respiration meter
For the completely mixed respiration chamber under continuous flow conditions the
dissolved oxygen mass balance is:
ds0(t)
dt !-(s01(t)-s0(t))-r(t) (1)
s0(t) = oxygen concentration at outlet at time t (kg m"3). s0](t) = oxygen concentration at inlet at time t (kg m"3).

Measurement of the respiration rate 29
qres = volumçtric flow through the respiration chamber (m3h"1). vres = volume of the respiration chamber (m3). r(t) = respiration rate at time t (kg m"3h_1).
For numerical analysis of the on-line measured oxygen concentration, equation (1) is
integrated over one sampling interval T. Assuming that s01(t)=s01(t-T) and r(t)=r(t-T):
r(t) =— l(l-e-'1)s0.(t-T)+e-'Ts0(t-1)-sJt)} (2) — ± - [(l-e-«)s01(t-T)+e-Ts0(t-T)-s0(t)] l-e"T L J
a - - ^ (3)
For accurate measurements, T should be as short as possible. The lower limit of the time interval T for the calculation of r(t) is set by the response time of the oxygen probe. Typical values of T are between 30 and 60 seconds. For increasing values of T the response time of the respiration measurement increases. Because the oxygen concentration is measured periodically in the inflow and in the outflow, s01 cannot be measured at time t-
T and must be calculated from s01(t-'AT) and s01(t-l'AT). The measuring uncertainty is less than 5% of the reading for respiration rates greater than 20 g m'3h_1.
The respiration meter is connected to a modular I/O processor which collects the oxygen
concentration data, calculates the respiration rate and controls the process flows.
Reliability of the respiration meter
The reliability of the respiration meter was tested by means of batch experiments. The meter was connected to a reactor of 1.5 litre containing activated sludge. Temperature and pH were kept constant. When the sludge was in the endogenous phase of respiration a certain amount of ammonium chloride was added which caused an increase in the respiration rate until the ammonium was oxidized. Figure 2a shows the response when the same dose was repeated four times.

30 On-line meter for respiration rate and BODsl
100
slope 4.36 intercept 0.25
time 10 20 30 40 after addition (min]
20 40 60 80 100 120 Time after addition (min)
4 8 12 16 20 g Nitrogen per m 3
Figure 2: Respiration rates after addition of ammonium chloride to activated sludge (pH
7.5, temperature 20 °C). (a) same dose repeated four times, (b) increasing amount of
ammonium: 1, 5, 7.5, 10 and 20 gram nitrogen per m'3 (sludge MLSS 3.34 kg m'3,
MLVSS 2.61 kg m'3) (c) calculated BODst versus amount of ammonium-nitrogen added.
It is concluded that the reproducibility is good. In Figure 2b the course of the respiration rate following the addition of increasing amounts of ammonium is presented. From the data, the total amount of oxygen additionally used to the endogenous oxygen consumption, defined as BODst, was calculated. In Figure 2c this BODst is plotted against the amount of ammonium-nitrogen. The slope of the regression line, representing the oxygen-nitrogen ratio, is 4.36 kg 0 2 per kg N, which is in accordance with the value cited in the literature (Sharma and Ahlert, 1977) and close to the stoichiometric oxygen demand.
Different respiration rates
For on-line monitoring activated sludge plants, we propose the use of the four different respiration rates mentioned before (Figure 3).
The endogenous respiration rate (rend) is defined as the oxygen uptake rate of activated sludge that has been aerated for two hours without feeding. The measurement is practically realised by measuring the rate of activated sludge from a completely mixed bypass tank of 0.028 m3 through which sludge from the aeration tank is continuously recirculated.
The instantaneous respiration rate (rins) is defined as the oxygen uptake rate of activated sludge flowing directly from the completely mixed aeration tank through the respiration chamber. This rate is lower than the oxygen uptake rate in the aeration tank: the actual

Measurement of the respiration rate 31
< B > —
(a) (b)
±~\^y~® iH^y^©
-®—
(c)
Figure 3: Measurement of four diffèrent respiration rates, (a) endogenous rate; (b)
instantaneous rate; (c) actual and maximum rate. AT = aeration tank, BT = bypass tank,
I = influent, R = respiration meter, S = secondary settler.
respiration rate. The absolute value of rins depends on the detention time in the respiration
chamber.
The actual respiration rate (ract) can be measured provided that the sludge loading in the respiration chamber equals the loading in the aeration tank. Therefore influent is continuously added to the sludge flowing into the respiration chamber in the proportion (Spanjers and Klapwijk, 1987):
(4)
"sam
Qin
= influent sample flow to respiration chamber (m3h"1)
= influent flow (m3h_1)
= volume respiration chamber (m3) = volume aeration tank (m3).
The maximum respiration rate {rrm^ is measured when an excess of influent is continuously added to the sludge flowing into the respiration chamber. It was established experimentally that under normal operating conditions, an excess of influent is guaranteed when the ratio of influent flow to sludge flow is at least 0.03.
In the study described here, we used only one respiration meter, which meant that the different respiration rates could only be measured sequentially.
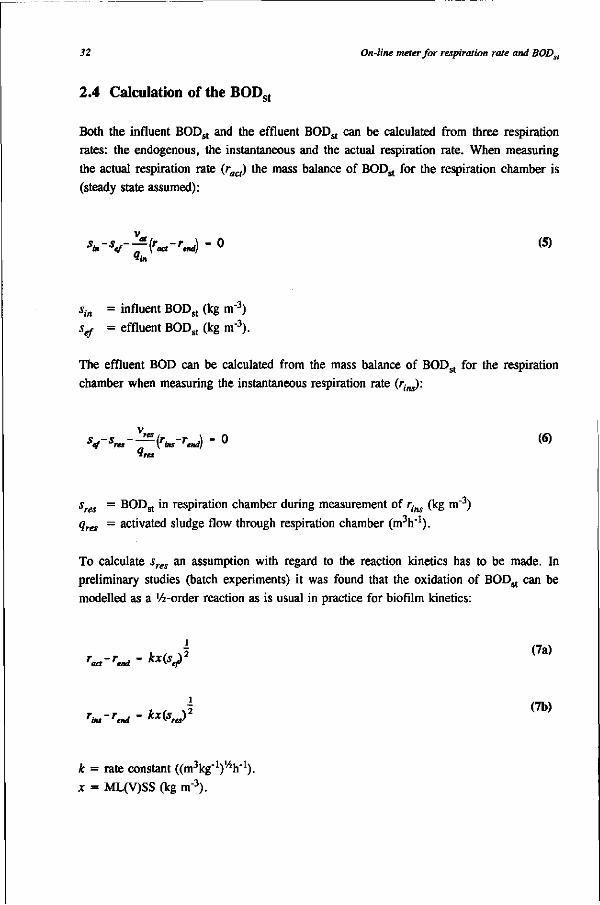
32 On-line meter for respiration rate and BODst
2.4 Calculation of the BODst
Both the influent BODst and the effluent BODst can be calculated from three respiration rates: the endogenous, the instantaneous and the actual respiration rate. When measuring the actual respiration rate (ract) the mass balance of BODst for the respiration chamber is (steady state assumed):
"in
sjn = influent BODst (kg m"3)
sef = effluent BODst (kg m"3).
The effluent BOD can be calculated from the mass balance of BODst for the respiration chamber when measuring the instantaneous respiration rate (/•• ):
V%-T= ( r*-- r - ) • ° (6)
sres = BODst in respiration chamber during measurement of rins (kg m"3)
qres = activated sludge flow through respiration chamber (m3h"1).
To calculate sres an assumption with regard to the reaction kinetics has to be made. In preliminary studies (batch experiments) it was found that the oxidation of BODst can be modelled as a %-order reaction as is usual in practice for biofilm kinetics:
' - " i - - **<ßf (?a)
r -r - kx(s )* ( 7b )
k = rate constant ((m3kg"1)V4lr1). x = ML(V)SS (kg m"3).
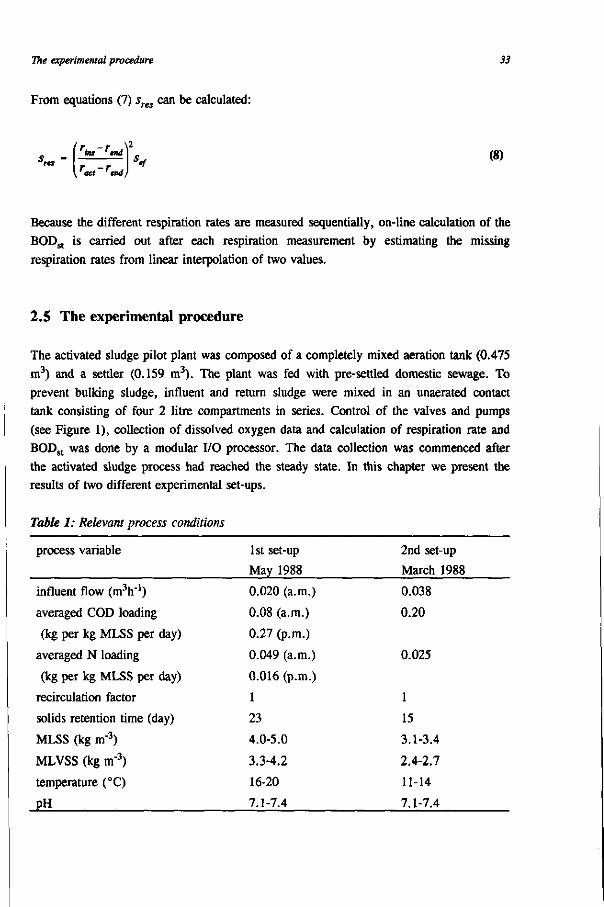
The experimental procedure 33
From equations (7) sres can be calculated:
r,..-r.. 2
s~-l-î=-^k, <«> •~ - _ , V
Because the different respiration rates are measured sequentially, on-line calculation of the BODst is carried out after each respiration measurement by estimating the missing respiration rates from linear interpolation of two values.
2.5 The experimental procedure
The activated sludge pilot plant was composed of a completely mixed aeration tank (0.475 m3) and a settler (0.159 m3). The plant was fed with pre-settled domestic sewage. To prevent bulking sludge, influent and return sludge were mixed in an unaerated contact tank consisting of four 2 litre compartments in series. Control of the valves and pumps (see Figure 1), collection of dissolved oxygen data and calculation of respiration rate and BODst was done by a modular I/O processor. The data collection was commenced after the activated sludge process had reached the steady state. In this chapter we present the results of two different experimental set-ups.
Table 1: Relevant process conditions
process variable 1st set-up 2nd set-up
May 1988 March 1988
influent flow (m3h"1)
averaged COD loading
(kg per kg MLSS per day)
averaged N loading
(kg per kg MLSS per day)
recirculation factor
solids retention time (day)
MLSS (kg m"3)
MLVSS (kg m"3)
temperature (°C)
PH
0.020 (a.m.)
0.08 (a.m.)
0.27 (p.m.)
0.049 (a.m.)
0.016 (p.m.)
1
23
4.0-5.0
3.3-4.2
16-20
7.1-7.4
0.038
0.20
0.025
1
15
3.1-3.4
2.4-2.7
11-14
7.1-7.4

34 On-line meter for respiration rate and BODst
During the first experiments the influent flow rate was varied according to a square wave pattern as follows: 0.020 m3h"1 during the morning and 0.060 m3h"1 during the afternoon. In the second set-up the influent flow rate was kept constant, but the influent was taken alternately from the sewer (during the morning) and a stock (during the afternoon). The stock was daily refilled with fresh wastewater. Table 1 summarizes the relevant process conditions.
2.6 Results
During the first experiments the greater part of the variation in loading was due to the varying influent flow rate (see Table 1) which dominated the natural variation in influent strength. Figure 4 shows the sludge loading during the first experimental period.
The course of the measured respiration rates can be seen in Figure 5. The endogenous respiration rate (rend), although relatively constant, shows a variation which depends on the loading. This is probably caused by the varying concentration of slowly biodegradable compounds resulting in a concomitant variation in oxidation.
0.30
•o en
"3> 0,
c CO
o 0.
20
10
COD-loading
Total-N-loadin
RH 11 12 13 14 15 16 17 18 19 20
day
Figure 4: COD and total nitrogen sludge load during the first experiments. COD, N and
MLSS are based on 24 and 72 hour averages.

Results 35
The instantaneous respiration rate (rins) is an indicator for the presence of readily
biodegradable compounds in the effluent: when rim is close to rend the concentration of
these compounds will be very low; when rins is close to the actual respiration rate (ract)
the concentration is likely to be high. In Figure 5 rins lies between these extremes.
11 12 13 14 15 16 17 18 19 20 day
Figure 5: Respiration rates during the first experiments.
ract depends strongly on the loading. The dip on 11 May was due to problems with the aeration: the oxygen concentration in the aeration tank decreased below 1 g m"3 during one hour and the nitrification ceased. The readily biodegradable compounds thus accumulated in the aeration tank and were subsequently oxidized in the bypass tank (Figure 1), resulting in a failure of the measurement of rend (peak in Figure 5).
The maximum rate for the oxidation of readily biodegradable compounds, rSmax, is calculated by subtracting rend from the maximum respiration rate rmax (Figure 5). Since the BODst of the used wastewater is chiefly caused by ammonium, rSmax mainly represents the nitrification rate. It was expected that rSmax would be relatively independent of short time variation in the loading. In Figure 5, however, it can be seen that this rate depends on the loading in an unexpected way: at high loading it tends to decrease and at a low loading it tends to increase. At present we are looking into this phenomenon.
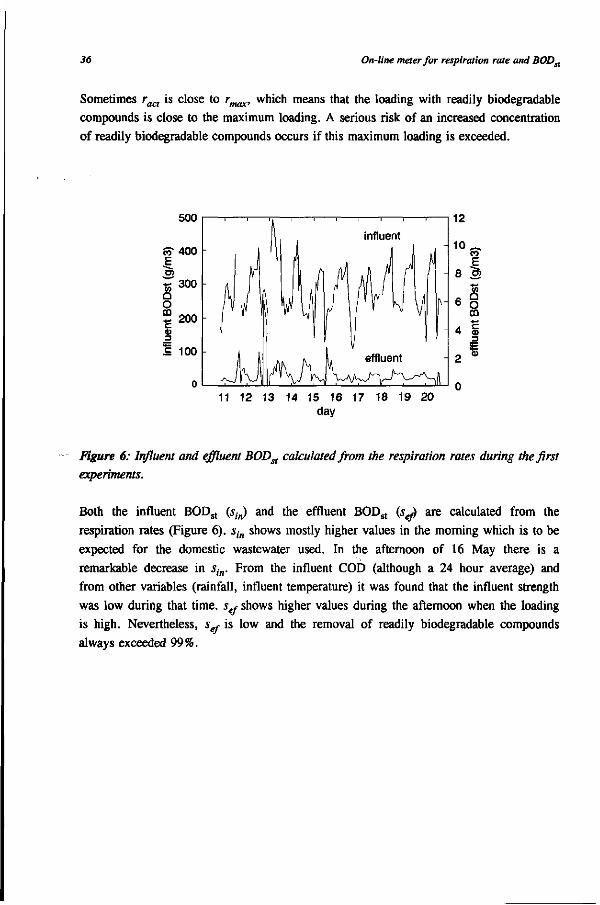
36 On-line meter for respiration rate and BODsl
Sometimes ract is close to rmax, which means that the loading with readily biodegradable compounds is close to the maximum loading. A serious risk of an increased concentration of readily biodegradable compounds occurs if this maximum loading is exceeded.
11 12 13 14 15 16 17 18 19 20 day
Figure 6: Influent and effluent BODst calculated from the respiration rates during the first experiments.
Both the influent BODst (sin) and the effluent BODst (seß are calculated from the respiration rates (Figure 6). sin shows mostly higher values in the morning which is to be expected for the domestic wastewater used. In the afternoon of 16 May there is a remarkable decrease in sin. From the influent COD (although a 24 hour average) and from other variables (rainfall, influent temperature) it was found that the influent strength was low during that time. sef shows higher values during the afternoon when the loading is high. Nevertheless, sef is low and the removal of readily biodegradable compounds always exceeded 99%.

Results 37
Figure 7: Influent BODst during the second experimental period.
It should be emphasized that the influent BODst, as measured by the method described here, must be independent of the loading. It is a measure of the concentration of readily biodegradable compounds in the influent. To check whether the measured BODst is constant while the plant is fed with influent of constant quality, the results of the second experimental period can be analyzed (Figure 7). During this period (see also Table 1), the measured BODst should be constant during the afternoon. The BODst indeed showed significantly less variation during the afternoon: 7% to 26% as compared with 8% to 90% during the morning, though the variation exceeded the measuring uncertainty for (batch) measurement (5 - 8%).
Two components in wastewater may contribute to the BODst: ammonium, which is oxidized by nitrifiers, and readily biodegradable organic compounds, which are oxidized by heterotrophic organisms. In Figure 8, the BODst of the second experimental period has been plotted against the influent ammonium concentration (both 12 hours averages).
Linear regression yields a slope of 4.42 kg 0 2 per kg nitrogen which is close to the value obtained in batch experiments (see section Reliability of the Respiration Meter). This suggests that ammonium contributes to a great extent to the BODst of the used wastewater. This corroborates results from batch experiments where wastewater was added to activated sludge without nitrifying organisms (Spanjers and Klapwijk, 1987) or with inhibited nitrification (Figure 9). Addition of wastewater induces only a limited increase in respiration rate during a short period.

38 On-line meter for respiration rate and BODst
300
CO
E ai 200
O O m c <D
100 slope 4.42 intercept-7.14 g nr3
10 20 30 40 50 60 g nitrogen per m3
Figure 8: Measured BODst against influent ammonium nitrogen concentration (both
averaged over 12 hours) in the second experimental period.
0 5 10 15 20 time after addition (min)
Figure 9: Effect of inhibition of nitrification. Conditions: batch experiment, dosage of 0.1
litre wastewater to 3.1 litres activated sludge with and without inhibition by 10 mg
thiourea per litre.

Discussion 39
2.7 Discussion
The respiration meter is capable of monitoring the respiration rate of activated sludge continuously and trouble free. Crucial factors determining the accuracy of the measurement are the oxygen measurement and the volumetric flow of activated sludge through the respiration chamber. During the experimental periods daily calibration of the sample pumps and the oxygen meter was sufficient. No interruption of the measurements was required for calibration of the pumps. Calibration of the oxygen meter caused an interruption for 2 - 5 minutes. At present we are considering the possibility of a less frequent calibration because the calculated respiration rate is less sensitive to calibration drift than the absolute oxygen concentration.
The shortest realizable response time of the respiration meter to a stepwise input is one up to two minutes for 95% of the reading. This is sufficiently short for monitoring and control purposes at a wastewater treatment plant and for most batch experiments. In the experiments we used one meter for sequentially measuring four different respiration rates. The measurement of one rate took at least 8 minutes when fulfilling the condition of steady state in the respiration chamber for calculation of the BODst. Consequently, the BODst could be calculated every 8 minutes. This will be sufficient for adequate control in most plants. Nevertheless the calculation method needs to be improved. The results of the second experimental period show that the accuracy of the BODst was not satisfactory, because the calculation method was susceptible to noise in the respiration rates. A dynamic estimation method for the BODst which does not require a steady state condition is a research topic at present.
When considering the control of an activated sludge plant one can envisage three aims: 1. sufficient degree of BOD (organics and nitrogen) removal; 2. production of sludge with good settling properties;
3. keeping energy costs at a minimum.
These aims can be achieved by controlling the sludge loading, the oxygen concentration and the sludge balance.
The reasons for controlling the loading are: maintenance of nitrification and good sludge quality, minimization of aeration costs and dealing with toxic inputs. The loading can be influenced by adjusting the sludge concentration and, if storage is available, the influent flow rate. The difference between ract and rend (substrate respiration rate) is a measure of the concentration of readily biodegradable compounds whereas the ratio of the substrate

40 On-line meter for respiration rate and BODsl
respiration rate to rend is a measure of the loading with these compounds. When rins is
close to ract and also ract is close to rmax, there is a risk of overloading the plant. A toxic
input may be recognized by a sudden decrease of rmax caused by an inhibition of nitri-
fiers.
The objectives for controlling the oxygen concentration are: saving of aeration costs, maintenance of nitrification and prevention of bulking sludge. The oxygen concentration can be controlled by adjusting the air flow rate. The concentration must be as low as possible to minimize aeration costs. On the other hand it must be high enough to maintain nitrification and to prevent bulking sludge (Hermanowicz, 1987). The oxygen concentration in the bulk fluid gives insufficient information on the activity of the sludge as does the respiration rate. Moreover, in a completely mixed reactor, the concentration varies with the depth, whereas the respiration rate does not. The oxygen transfer rate can be calculated continuously from the oxygen concentration and ract, and can be used as an indicator for clogging of air diffusors.
The reasons for controlling the sludge balance are: adjustment of loading, maintenance of the composition and quality of waste sludge, and cost saving. Control can be exerted on the return sludge flow rate and on the waste sludge flow rate. The sludge balance is mainly considered on the basis of ML(V)SS. This variable does not provide meaningful information on the active biomass concentration as rend and rmax do. Therefore control of the sludge balance ought to be based on these two variables. When rend is high in relation to ract a relatively large part of the oxygen is consumed for maintenance. As this is uneconomic the action of control would be to waste sludge.
2.8 Conclusions
The respiration meter is capable of continuous and trouble free monitoring of the respiration rate with satisfactory accuracy. The method for continuous measuring four different respiration rates at a completely mixed activated sludge plant provides relevant information on the process; furthermore the influent and effluent BODst can be calculated as well. The calculation algorithm for the BODst still needs to be improved. The respiration rates measured can be used as a basis for process control. The BODst of the examined wastewater appears to be predominantly caused by the oxidation of ammonium.

References 41
2.9 Notation
it rate constant ((m3kg"1)1/2h"1)
qin influent flow (m3h"1) qres volumetric flow through the respiration chamber (m3h"1)
qsam influent sample flow to respiration chamber (m3h_1)
r respiration rate (kg m"3h_1)
ract actual respiration rate (kg m ~3h"1)
rend endogenous respiration rate (kg m 3h"1) rins instantaneous respiration rate (kg m'-'h"1) nnax maximum respiration rate (kg m'3h_1) rSmax maximum rate for the oxidation of readily biodegradable compounds (kg m"3h_1) sef effluent BODst (kg m"3) sin influent BODst (kg m"3)
sres BODst in respiration chamber during measurement rins (kg m"3)
s0 oxygen concentration at outlet (kg m"3)
s01 oxygen concentration at intlet (kg m"3) T sampling interval (h)
vat volume aeration tank (m3) vres volume of the respiration chamber (m3)
x mixed liquor (volatile) suspended solids (kg m"3)
a = qrJvres dilution rate (h"1)
2.10 References
Edeline F., Lambert G. and Sueiras F. (1978). Un respiromètre continu simple pour le
contrôle des boues activées. Trib. Cebedeau 414, 211-215. Fujimoto E., Iwahori K. and Sato N. (1981). Automatic measurement device of the
respiration rate and experimental investigation on the constant DO control by using the device for the activated sludge process. Wat. Sei. Tech. 13 (9), 193-198.
Heckershoff H. and Wiesmann U. (1986). Ein neues Meßgerät für die Betriebskontrolle
und Reglung von Belebtschlammanlagen. Teil 1: Messung der Substratkonzentration.
Korrespondenz Abwasser 33, 508-513. Hermanowicz S.W. (1987). Dynamic changes in populations of the activated sludge
community: Effects of dissolved oxygen variations. Wat. Sei. Tech. 19 (5/6), 889-895. Holmberg A. (1982). Modelling of the activated sludge process for microprocessor-based
state estimation and control. Wat. Res. 16, 1233-1246.

42 On-line meter for respiration rate and BODsl
Holmberg U., Olsson G. and Andersson B. (1989). Simultaneous DO control and respiration estimation. Wat. Sei. Tech. 21 (10/11), 1185-1195.
Kaneko M., Kawachi K. and Matsumoto A. (1985). Evaluation of oxygen uptake rate analyzer in wastewater treatment plants. In Proc. 4th IAWPRC Workshop on
Instrumentation and Control of Water and Wastewater Treatment and Transport
Systems, Houston and Denver, U.S.A. 27 April - 4 May. 521-524. Könne M., Siepmann F.W. and te Heesen D. (1986). Der BSB5 und der kontinuierliche
Kurzzeit-BSB (BSB-M3) im Vergleich. Korrespondenz Abwasser 33, 787-793. Sharma B. and Ahlert R.C. (1977). Nitrification and nitrogen removal. Wat. Res. 11,
897-925. Sollfrank U. and Gujer W. (1985). Kontinuierliche Messung der Respiration im
Belebungsverfahren. GWF-Wasser /Abwasser 8, 397-405. Spanjers H. and Klapwijk A. (1987). The Wazu-respiration meter. A breakthrough in
automation and control for a wastewater treatment plant. 10th Symposium on
Wastewater Treatment, November 1987, Montreal, Québec, Canada. Takamatsu T., Shioya S., Yokoyama K., Kurome Y. and Morisaki K. (1981). On-line
monitoring and control of biochemical reaction processes. 8th IFAC World Congress,
Kyoto, Preprints Vol XXII, 146-151. Vandebroek R. (1986). Study and development of a microcomputer controlled sensor for
the determination of the biodegradability and the toxicity of wastewaters. Thesis, University of Ghent.
Vernimmen A.P., Henken E.R. and Lamb J.C. (1967). A short-term biochemical oxygen demand test. J. Wat. Pollut. Control Fed. 39, 1006-1020.

43
Determining short-term biochemical oxygen demand and respiration rate in an aeration tank by using respirometry and estimation
3.1 Abstract
For good control of the activated sludge process, accurate measurement of the short-term biochemical oxygen demand (BODst) in the aeration tank (s,) and the actual respiration rate of the activated sludge (ract) is required. A previously described measurement technique for these variables requires the measurement of three types of respiration rate of which one rate, the actual respiration rate, involves continuous addition of influent sample to a respiration chamber. The technique is only applicable to a plant with one single aeration tank or to the first compartment of a plug flow reactor.
In this chapter, a method is proposed for the estimation of sa and ract in a completely mixed aeration tank, no matter whether this is a single reactor or a compartment of a plug flow reactor. In contrast to the other technique, this method does not involve addition of influent sample to the respiration chamber. Instead, the transient respiration rate is measured during two modes of operation which are alternately executed. In one mode, sludge from the aeration tank flows through the respiration chamber, whereas in the other mode, sludge having the endogenous rate is directed through the chamber. The sa is obtained by integrating the mass balance equations for each cycle of two different modes. The measured respiration rate and the calculated BODst during each cycle of two modes are used to find the kinetic relationship in'order to calculate ract.
Accepted for publication in Water Research by: Spanjers H., Olsson G. and Klapwijk A.

44 BODst and respiration rate in an aeration tank
The proposed method has been verified using simulated and experimental data. The estimated sa and ract from experimental data are in agreement with the diurnal variation typical for the wastewater used. The pattern of r ^ is in agreement with the one obtained by the previously described method. There is, however, a significant difference between the average values of the two methods. A possible explanation for this bias is given. Compared to the previously described method, the proposed method is simpler to use in practice.
3.2 Introduction
The activated sludge process is aimed to achieve, at minimum energy costs, a sufficiently low concentration of biodegradable matter in the effluent, under conditions of variable loading, along with a low sludge production. Therefore, the process has to be controlled. For good control accurate measurement of process variables is required. Two of these variables are the short-term biochemical oxygen demand (BODst) of the mixed liquor in the aeration tank and the actual respiration rate.
The BODst includes readily biodegradable ammonium and organic matter which are oxidized within the operating time of the activated sludge process. Thus, it is closely related to the current reaction rates of the process. In dynamic modelling of the activated sludge process the bacteria are assumed to utilize only readily biodegradable matter (Henze et al, 1987). The BODst in relation to the readily biodegradable COD as used in the IAWPRC model (Henze, 1987) and the BOD5 is discussed elsewhere in this work. Since the BODst includes nitrification it is a good measure of the oxygen demand in a nitrifying activated sludge plant.
The actual respiration rate in the aeration tank is directly related to the biological activity and to the BODst. It provides information on the BOD-loading to the plant (Duggan and Cleasby, 1976; Chen et al, 1980) and on toxic effects (Temmink et al, 1993). In combination with other types of respiration rates it can be used to display the performance of the process (Spanjers and Klapwijk, 1990).
Few on-line monitoring techniques for the BODst in the aeration tank have hitherto been proposed. One application would be in using a microbial probe (Princz and Olâh, 1990). However, the use of such a probe for the BODst in the aeration tank has not been pursued. Spanjers and Klapwijk (1990) have shown that the BODst in a completely mixed aeration tank can be derived from the measurement of three types of respiration rate,

Introduction 45
including the actual rate.
Two methods for the measurement of the actual respiration rate in the aeration tank can be distinguished: the estimator method and the instrumental method. The estimator method, based on a model of the DO dynamics in the completely mixed aeration tank, estimates the respiration rate and the oxygen mass transfer coefficient. One variant of the method only uses the measurement of the DO concentration in the aeration tank and online measurements of the air flow rate (Hamamoto et al, 1990; Goto and Andrews, 1985). In another variant, the estimator is part of an adaptive controller for the DO concentration (Holmberg and Olsson, 1989; Howell and Sopido, 1985). In evaluating the estimator method, Bocken et al. (1989) proposed refinements to overcome offsets of the estimated respiration rate. Holmberg (1990) concludes that these offsets still remain; there is still an undetermined bias in both the respiration rate and the oxygen mass transfer coefficient, which is not identifiable.
The instrumental method uses a respiration chamber in which activated sludge from the aeration tank is sampled. In the discontinuous respiration meter, a sample is aerated, the aeration is stopped and the decline in the DO concentration is recorded (Duggan and Cleasby, 1976; Kaneko et al., 1985). The respiration rate is then calculated from the slope of the DO with time. The discontinuous respiration meter is incapable of measuring the actual respiration rate under normal operating conditions. The continuous flow-through meter measures the difference of the DO at the inflow and at the outflow of either the air (Heckershoff and Wiesmann, 1986) or the activated sludge (Sollfrank and Gujer, 1990; Spanjers and Klapwijk, 1990). Some continuous flow-through meters (Reynolds, 1969; Clarke et al, 1978; Chen et al, 1980), that just sample sludge from the aeration tank, do not directly measure the actual respiration rate in the aeration tank because, due to the detention time in the chamber, the concentration of readily biodegradable matter will have decreased. Hence, the respiration rate in the chamber will be lower than the actual rate in the aeration tank.
For the measurement of the actual respiration rate with a continuous flow-through meter it is crucial that the respiration chamber is loaded with wastewater in the same proportion as the aeration tank (Spanjers and Klapwijk, 1987, 1990; Sollfrank and Gujer, 1990). Then the concentration of readily biodegradable matter in the chamber equals that of the aeration tank. Therefore, simultaneously with the sludge, a sample of influent is introduced continuously into the respiration chamber such that the ratio of the sample flow and the chamber volume equals the ratio of the influent flow and the aeration tank volume. Hence, during operation, the influent sample flow has to be adjusted in relation

46 BODsl and respiration rate in an aeration tank
to the influent flow to the plant. A problem associated with this measurement technique is that the measurement of the actual respiration rate in subsequent compartments of a series of well-mixed tanks is not obvious.
In this chapter, we propose and test an alternative method for the determination of the BODst and the actual respiration rate in a completely mixed aeration tank, no matter whether this tank is a single reactor or a compartment of a plug-flow reactor. Furthermore, the method avoids the addition of influent to the respiration chamber for the measurement of the actual respiration rate. The method which is analogous to a method for the determination of the influent BODst (Spanjers et al., 1993), uses the transients between two modes of respiration measurement. To verify the ract, determined with the proposed method, (estimated ract), we also measure this variable (measured ract) according to the previously described method (Spanjers and Klapwijk, 1990).
It is concluded that the proposed method allows the estimation of the BODst and the actual respiration rate. However a significant bias exists between the measured and estimated actual respiration rate.
3.3 Measurement of the respiration rate
The principle of the respiration measurement (Spanjers and Klapwijk, 1990; Spanjers and Olsson, 1992) will be reviewed briefly here. The respiration meter consists of a closed, completely mixed chamber of 0.75 litre through which the activated sludge is continuously pumped. The DO concentrations at the inlet (ca) and at the outlet (c) of the chamber are measured by using one and the same probe. This is made possible by four valves that switch the flow through the chamber, typically every 30 seconds (the probe response period).
Figure 1 shows a typical recording from the respirometer DO probe, the signal oscillating between ca and c. The DO concentrations ca and c are calculated from each response (Spanjers and Olsson, 1992), resulting in two series of DO concentrations, one of the inlet and one of the outlet, with sampling interval h. These series are shifted 'Ah time units with respect to each other.

Measurement of the respiration rate 47
C a,k+V4
Time
Figure 1: Recording from the respirometer DO probe. The respiration rate is calculated
from the DO measurements. Dotted lines: real DO concentration at the inlet and at the
outlet, ca and c respectively. Solid line: measured DO concentration. Filled rounds:
known DO concentrations, necessary for the calculation of the respiration rate at time
instant tk. Open rounds: interpolated DO values. Probe response period 'Ah, typically 30
s. Calculation interval, h, for respiration rate, typically 60 s.
From the DO concentrations, the respiration rate can be calculated using a numerical approximation of the DO mass balance over the respiration chamber. In previous work an analytical method was used to calculate the respiration rate (Spanjers and Klapwijk, 1990). Here we apply numerical off-line calculation and use the trapezoidal rule.
dc . s
a(c-c) - r dt a
(1)
i[«(' w+c<*-- HKi - H)CH (2)
The respiration rate is calculated at each sampling time of ck, hence with a period of h. From Figure 1 it can be seen that ck_,A and ck+l/2 can be found by linear interpolation from two adjacent c values.

48 BODst and respiration rate in an aeration tank
3.4 Two modes of respiration measurement
In this work, two sludges of the same origin (the aeration tank) but with different respiration rates are measured consecutively such that we obtain two modes of operation (Figure 2). In the endogenous mode (e-mode), sludge having the endogenous respiration rate is pumped through the respiration chamber. This sludge is produced in a bypass tank. In the instantaneous mode of measurement (i-mode), sludge from the aeration tank directly flows through the respiration chamber. The measuring period for one mode is typically 10 or 15 minutes and is sufficiently long to let the respiration rate in the chamber converge to an ultimate value. Figure 3 shows an example of a part of an experimental run.
At the end of each i-mode, the measurement is changed to the e-mode and the sludge in the respiration chamber is gradually replaced by endogenous sludge. In the endogenous sludge the concentration of readily biodegradable matter is considered negligible, meaning that the BODst of the endogenous sludge is zero. Hence, in the e-mode, the BODst in the respiration chamber remaining from the i-mode will be washed out and the respiration rate will decrease. Thus, at the end of each e-mode the BODst in the respiration chamber is zero and thus the rate measured is the endogenous respiration rate.
.[n.?as.y_rinS_?y.?t?.rP. PJJP.lPJ^nt.
respiration DO probe chamber
valves to aeration
tank
sludge sample valve i PumP |—txw
/alve ö bypass
-%-
-&-
contact tank
influent sample influent
return sludge
Figure 2: Schematic of the pilot plant and the respiration measuring system. Valve i is
open in the i-mode, valve e in the e-mode.

Two modes of respiration measurement 49
E.
CO k_ c o '•s 'a. CO
£ 6 O O
20
32
30
28
26
24
22
20
(a)
"
*~*
-
-
i-mode
\
/ 1
f c A
J e-mode
^Ca
i-mode
1 1
r 1 r -
\ I e-mode \
40 60 80 100
-(b)
_
-
-
-
i-mode
e-mode [
i-mode
e-mode ƒ -I /
' I •
40 60
time (min)
80 100
Figure 3: Example of the measurement in the two consecutive modes of operation: e-mode
and i-mode. (a) Measured DO concentration from the respiration meter probe. Each point
corresponds to a point in Figure 1. (b) Respiration rate calculated using equation (2).
At the end of each e-mode, the measurement is changed to the i-mode and the sludge in the chamber is gradually replaced by sludge that comes directly from the aeration tank. This sludge contains a certain amount of readily biodegradable matter, in other words: this sludge has a finite BODst. This BODst (sa) is the driving force behind the increase of

50 BODs[ and respiration rate in an aeration tank
the BODst in the chamber. At the end of the i-mode, a steady state is reached with respect to the BODst and the respiration rate in the chamber. The resulting BODst is lower than sa
and is a function of the hydraulic retention time in the chamber and of the biological activity. Since the respiration rate is a function of the BODst, the rate measured at the end of an i-mode is lower than the actual respiration rate in the aeration tank.
In the next section we will show how the respiration rate measurement in the transients during the two modes can be used for the estimation of the BODst and the actual respiration rate in the aeration tank.
3.5 Estimation of the BODst and the actual respiration rate
The BODst in the aeration tank (s j and actual respiration rate (ract) are calculated from cycles of two successive modes: one i-mode and one e-mode, meaning that the calculation interval of these variables is typically 20 - 30 minutes. The estimation procedure involves five steps executed for each cycle:
(1) assessment of the endogenous respiration rate (rend); (2) calculation of the substrate respiration rate (rs); (3) calculation of the initial BODst in the e-mode (SQ); (4) calculation of the BODst in the aeration tank (sa); (5) calculation of the actual respiration rate in the aeration tank (ract).
We will now explain the estimation procedure according to these steps. Figure 4
schematically outlines the calculation procedure.
(1) Endogenous respiration rate
It is assumed that, at the end of each e-mode, the concentration of readily biodegradable matter is zero, so that the endogenous respiration rate (rend) is measured. It is further assumed that rend is constant during the whole cycle. To obtain an operational rend for the whole cycle, the last measured rates of the current and previous cycle are averaged (Figure 4a).

Estimation of the BODst and the actual respiration rate 51
i-mode e-mode
Time —
Figure 4: Schematic representation of calculations within a cycle of one i-mode and one
e-mode. (a) respiration rate measured (step 1); (b) substrate respiration rate (step 2); (c)
BOD^ (step 3 and 4).
(2) Substrate respiration rate
The rate of the oxidation of readily biodegradable matter, the substrate respiration rate (rj), can be calculated from each respiration measurement (r). This is done for both the i-mode and the e-mode (Figure 4b).
rsjc ~ rk rend (3)
where k = 1, 2, ... n (n typically 10 or 15).
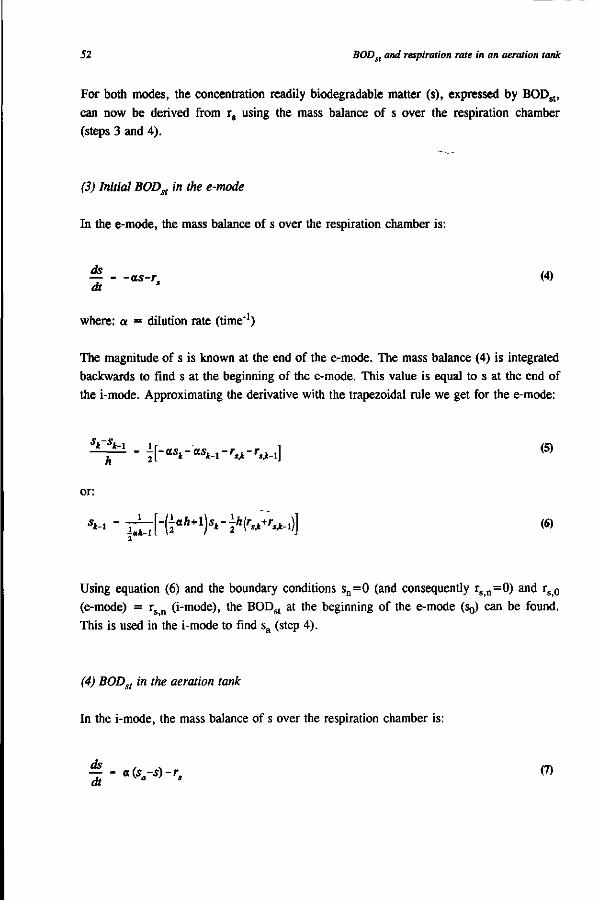
52 ^^®sr a"d respiration rate in an aeration tank
For both modes, the concentration readily biodegradable matter (s), expressed by BODst, can now be derived from rs using the mass balance of s over the respiration chamber (steps 3 and 4).
(3) Initial BOD^ in the e-mode
In the e-mode, the mass balance of s over the respiration chamber is:
^ - -as-r (4) dt
where: a = dilution rate (time"1)
The magnitude of s is known at the end of the e-mode. The mass balance (4) is integrated backwards to find s at the beginning of the e-mode. This value is equal to s at the end of the i-mode. Approximating the derivative with the trapezoidal rule we get for the e-mode:
^Sr1 " i[-«*-«*-i-'«*-r*-i] (5)
or:
s*-i - ^[-(ia*+ih4*(r*+r«^)] <©
Using equation (6) and the boundary conditions sn=0 (and consequently r s n=0) and r s 0
(e-mode) = rs n (i-mode), the BODst at the beginning of the e-mode (SQ) can be found. This is used in the i-mode to find sa (step 4).
(4) BODst in the aeration tank
In the i-mode, the mass balance of s over the respiration chamber is:
— - a(s -s)-r (7) dt "

Estimation of the BODsl and the actual respiration rate 53
The initial condition of the i-mode is already known: s=0. The end condition of the i-
mode was calculated in step 3, and is identical with the initial condition of the e-mode.
Using these conditions we can calculate the unknown sa. Approximating the derivative of
(7) with the trapezoidal rule we get for the i-mode:
h
or:
- ïP«.-«*-«t- i -»M-Vi] (8)
sk - T^;[-(iah-1)sk-i - ih{rsjc+rsjc-i)+ahs
a] (9)
Using equation (9) and the initial condition s0=0 (and consequently r s 0=0) the value sn
at the end of the i-phase can be calculated. The only unknown, sa, can be found explicitly from equation (9) so that sn (i-mode) = s0 (e-mode).
(5) Actual respiration rate in the aeration tank
Once the BODst in the aeration tank (sa) is known, the actual respiration rate in the
aeration tank (ract) can be calculated by using a kinetic model that describes the relation
between rs and s. In this work two models are tested, first-order model (10) and half-
order model (11):
rs - V <10>
b05s^ (ID
where bj and b 0 5 are kinetic constants. The first-order model is a reasonable approximation of Monod kinetics for small substrate concentrations. This is a common case in activated sludge systems. The half-order model has a theoretical basis in biofilm kinetics (Harremoës, 1977). The kinetic constants are found by fitting equations (10) and (11) to the [rsk,sk] values from both modes. The actual respiration rate, ract, can be calculated from:

54 BOD si a"d respiration rate in an aeration tank
rac - rend + blSa ( 12>
' - - rend+bQ,sa«> (13)
The procedure, to estimate sa and ract was verified using both simulated data and experimental data from a pilot plant.
3.6 Materials and methods
In simulations, executed with SIMNON (Elmqvist et al., 1986), measuring data were generated using a simple mathematical model of the pilot plant and the measuring system (Figure 2). This model simulates the respiration rate in the respiration chamber during the alternating modes (i-mode and e-mode) of operation. Noise, having uniform distribution with standard deviation 0.5 mg l^h"1, was added to the simulated respiration rate. First-order kinetics for BODst was employed. Linear regression was used to find the estimated first order kinetic constant. The values of the parameters and variables (Table 1) were in accordance with the experimental conditions in the pilot plant. The data generated with the simulation model were saved in a file to be processed according to the procedure proposed (equations (3)-(13)) in order to calculate sa and ract. These were compared with the original values.
In the experiments, the measurements were carried out at a pilot plant equipped with a
respiration measurement system (Figure 2). This system was capable of measuring
consecutively the respiration rate of sludge in the i-mode and in the e-mode.
The pilot plant, fed with presettled domestic sewage, was composed of an unaerated contact tank (four 2 litre compartments in series), a single compartment completely mixed aeration tank and a settling tank. The activated sludge was found to fully nitrify the ammonium in the influent. The air flow rate was maintained constant using a flow controller. Sludge with the endogenous respiration rate was produced in a bypass tank, consisting of five 5 litre aerated compartments in series, through which activated sludge from the aeration tank was continuously circulated. In previous research it was verified that, under normal conditions, the sludge in this tank was free of readily biodegradable matter.

Materials and methods 55
Table 1: Simulation and experimental conditions. Irrelevant condition indicated with
sampling interval ca, c and r(s)
duration one mode (min)
volume aeration tank (1)
influent flow (1 h"1)
return sludge flow (1 h"1)
waste sludge flow from aerat. tank (1 h"1)
air flow ( m V )
recirculation flow bypass tank (1 h"1)
volume respiration chamber (1)
flow through respiration chamber (1 h~')
influent sample flow (1 h"1)
influent BODst (mg l1)
MLSS (mg I"1)
MLVSS (mg I"1)
sludge volume index (ml l"1)
temperature sludge (CC)
PH
endogenous respiration rate (mg r'h~')
endogenous sludge BODst (mg l"1)
kinetics
simulation
60
15
475
40
-
-
-
-
0.731
21
0.0616
180 0<time<4 h
300 4<time<8 h
-
-
-
-
-
20
0
lst-order 10 h"1
experiment
run 1
60
10
475
36-40
39-40
1.43
2.4
22
0.731
21.45
0.0615-0.0616
200-300
2.8
2.20
320
16.5-17.5
7.2-7.3
19-23
assumed 0
unknown
run 2
60
15
475
36-40
39-40
1.43
2.4
22
0.731
21.70
0.0615-0.0616
200-300
2.4
1.89
355
16.5-17.5
7.2-7.3
19-23
assumed 0
unknown
The measuring system consisted of a respiration meter (prototype of RA1000, Manotherm) having a respiration chamber, an influent sample pump and two valves. To operate alternately in the i-mode and in the e-mode, two valves were used to select sludge from the aeration tank and the bypass respectively. To verify the estimated ract (see Introduction), this variable was also measured, at regular intervals, according to the method described by Spanjers and Klapwijk (1990). Therefore, in the i-mode, a predetermined sample of influent was continuously added to the sludge flowing through the respiration chamber. Table 1 lists the average process conditions during the measuring period.

56 BODst and respiration rate in an aeration tank
The control of valves and pumps, collection of data and the basic calculations were performed by a modular I/O processor (jtMac 6000, Analog Devices).
During the course of the measurements sludge samples were taken between 9:00 and 10:00 a.m. for the analysis of MLSS, MLVSS and sludge volume index (dutch standard NEN).
3.7 Estimation of s a and ract from simulated data
The procedure to estimate sa and ract was tested using simulated respiration measurements. The mode measuring period was 15 minutes and the sampling interval (h) was 1 minute. At t=4 hours there was a step increase of the influent BODst from 180 to 300 mg l"1. Figure 5 shows the estimated values along with the originally simulated values.
Figure 5 shows that the estimation procedure slightly overestimated sa and underestimated bj and ract. These biases apparently emanated from the differential approximation of the mass balances and from the boundary assumptions (see eqs. (6) and (9)).
Because the estimation procedure relies on rs, the sensitivity of sa, ract and bl to this variable was examined. It was found that especially the calculated initial BODst in the e-mode, s0, is quite sensitive to rs. This is shown in Figure 6a where the simulated and calculated s(t) in the e-mode are plotted. In this simulation, rs was given a noise with standard deviation of 0.5 mg l^h"1, a reasonably practical measurement error. The calculated values of s were higher than the originally simulated s, and s0 was overestimated with 12%. In addition, the standard deviation of SQ was unacceptable for practical situations because it was greater than the estimated SQ itself. The high variance of SQ results from the application of equation (6) to the very small or, because of the noise, even negative values of rs at the tail end of the e-mode. To avoid the build up of noise from the tail end of the e-mode, the calculation of SQ was repeated with another starting point for equation (6) (Figure 6b).

Estimation of sa and raclfrom simulated data 57
2 4 6 time (hours)
Figure 5: Verification, using simulations, of the procedure to estimate sa and racr At t=4
hours there is a stepwise increase of the influent BODst. Original values (lines) and
estimated values (points) of sa, ract and bj. Conditions: see Table 1.
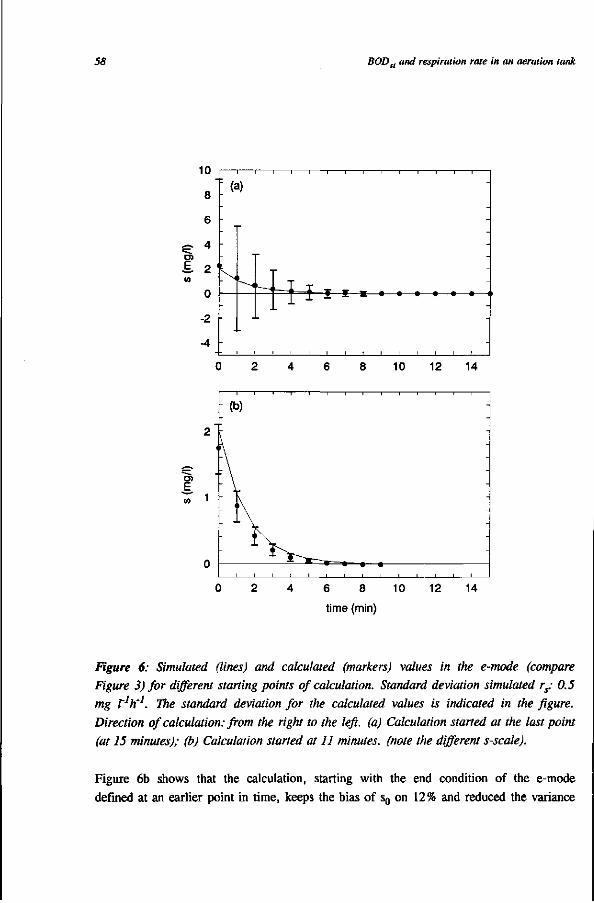
58 BODst and respiration rate in an aeration tank
8 10 12 14
E
6 8 10
time (min)
Figure 6: Simulated (lines) and calculated (markers) values in the e-mode (compare
Figure 3) for different starting points of calculation. Standard deviation simulated rs: 0.5
mg rJh']. The standard deviation for the calculated values is indicated in the figure.
Direction of calculation: from the right to the left, (a) Calculation started at the last point
(at 15 minutes); (b) Calculation started at 11 minutes, (note the different s-scale).
Figure 6b shows that the calculation, starting with the end condition of the e-mode
defined at an earlier point in time, keeps the bias of s0 on 12% and reduced the variance

Estimation of sa and ractfrom simulated data 59
though the latter was still high. The effect of the choice of the starting point on the
estimates of s,
(Figure 7). bj and ract was studied for the simulation of rs during the two modes
8
6
f 4
£ 2 CO 0
-2 -4
: ( a ) •
:
_ _ _ i I T —*-i I I X
r
•
"*" ;
11 13 15
5 7 9 11 time (min)
Figure 7: Effect of the choice of the starting point of the backward calculation in the e-
mode, for the calculation using equation (6), on (a) sa, (b) bl and (c) racr The starting
point in the calculation is displayed on the x-axis (15 minutes means that the calculation
is started at the end of the e-mode, meaning that all the points are involved). Original
value (line), calculated values (markers) and standard deviation of the calculated values is
indicated.

60 BODst and respiration rate in an aeration tank
Figure 7 demonstrates that, for the simulation, the best starting point (low variance and low bias) was found to be at 8 or 9 minutes. The figure also shows that the estimated values were more or less constant on a certain range of starting points. Finally, while sa
had a standard deviation of 260% in the worst case (when the calculation was started at the ultimate point, Figure 7a), the variability of ract was no more than 27%. When the calculation was started at 8 minutes, sa and ract deviated respectively -11% and 2.5% from the originally simulated value with standard deviations of respectively 10% and 2.3%.
It must be stressed that the precise shape of the graphs in Figure 7 depends on process conditions such as the magnitude of sa, the kinetic characteristics of the biological system and the hydraulic properties of the measuring system. For real measurements, the operational starting point has to be found experimentally. In this work the starting point was defined as, counting from the last measurement of the e-mode, the first point where rs exceeds the standard error of measurement (0.5 mg Hh"1). In the above simulation this occurred at 8 minutes (rs not shown in the figures).
From the simulations it was concluded that the proposed method allowed the estimation of sa and r ^ , although the estimated variables were quite sensitive to the respiration rate measured in the e-mode. However, when the backward calculation of SQ in the e-mode was started at a point earlier in the response, instead of at the last point, the variance and bias of the estimated variables could be reduced to a satisfactory level. In the next section, the ability of the method to estimate these variables will be investigated experimentally.
3.8 Estimation of s a and rxt from experimental data
At the pilot plant, during two experimental runs of 48 and 72 hours, the respiration rate was measured according to the strategy proposed in this chapter. The measuring period for one mode in these runs was 15 and 10 minutes respectively. Figure 8 shows a detail of the pattern of the respiration rate in the first measuring run (cf. Figure 3). In the figure it can be seen that the respiration rate was measured in consecutive modes of operation of the measuring system. From each cycle, of one i-mode and one e-mode, sa and ract were estimated according to the calculation procedure proposed. To verify the estimated ract, this variable was also measured, according to the previously described method, at regular intervals of five cycles.

Estimation of sa and raclfrom experimental data 61
/I 40
£" oi E, CD
5 30 -c o 'S w
5. co \
"~ 20 -
i i i i i i i i i i i fact
* /I /I -1 : i-mode
\ -
/\(\l\Af\ y/1/1/1 / ï/ i / i f in / l / i f l i l f l-i f f
•
-i
viuMuuvivuif^uuuvJUMUUUUUU^ e-mode i i i i i i i i i i i
4 6 8 time (hours)
10 12
Figure 8: Part of the respiration rate measurement of the first run. After five cycles of
one i-mode and one e-mode, one actual respiration rate is measured according to the
previously described method (Spanjers and Klapwijk, 1990; see also Introduction).
The estimated sa is plotted in Figure 9a. The starting point for the initial condition for the backward calculation in the e-mode for run 1 and 2 was at 5 and 8 minutes, respectively. sa showed a significant variation corresponding to a variation of the DO concentration in the aeration tank (Figure 9b). At the end of run 1 and the beginning of run 2, the influent to the aeration tank was obstructed due to troubles with the wastewater supply. sa
immediately dropped to a low value and the DO increased, likely because of the low oxygen demand in the aeration tank. During the interval 12 - 24 hours of run 2, no measurements were available because of a technical failure of the measuring system. During both runs sa clearly showed a diurnal peak around 12:00 h, corresponding with a dip in the DO concentration, because of a higher influent BODst concentration.
The substrate concentrations (s) and the corresponding substrate respiration rates (r„) of each cycle (not shown) were used to fit the kinetic models (9) and (10). On the whole, there was no significant difference in the goodness of fit for the two models. In examining the data points of a representative cycle (Figure 10) we found a hysteresis as there was a difference in sludge activities during the two modes. Therefore we decided to use, as a compromise, the first order model for the rest of this chapter.

62 BODs[ and respiration rate in an aeration tank
3
=•2 TO
E
II
' i
(a)
\-
run 1 i i i i i i i
ao » _fP • coo a** Dm
run 2
12 24 36
12 24 36 Time (hours)
48 0 12 24 36 48 60 72 Time (hours)
Figure 9: Result of two measuring runs, (a) Estimated sa and (b) measured DO in the
aeration tank.
15
10
5
n
m
m j
•
•
D
O
D
-
-
0 0.2 0.4 0.6 0.8 1 1.2 1.4 s (mg/l)
Figure 10: Kinetic relationship from a representative cycle of one i-mode and one e-mode (run 2 at 12:00 h). Filled markers indicate points of the e-mode. The first order regression line is also shown (b} = 11.4 h'1).

Estimation ofsa and raclfrom experimental data 63
The estimated bj during both runs is given in Figure 11. Taking into account the variance assessed in the simulation, it was found that bl remained relatively constant. The peaks which showed up in sa, did not have a counterpart in b1. It was expected that the kinetic properties of the sludge did not change substantially because of a relatively constant operation (except for the beginning of run 2) with respect to the influent flow and the MLSS of the pilot plant. Nevertheless, at 9 hours (run 2) there was a decrease of bj indicating a lower activity, possibly caused by the absence of influent during 6 hours and a decrease of the MLSS from 2.4 to 2.3 g l"1.
30
20
10
°„ a°é' ° . „ . " . ^ J „ut „ °°ff °D°°<P°° %0
12 24 time (h)
36 24 36 48 time (h)
Figure 11: Estimated first order kinetic constant.
The estimated ract along with the measured ract and rend are shown in Figure 12. There was a good agreement between the patterns of the estimated and measured ract. However, the estimated values were systematically lower than the measured ones. The simulation showed that, under the assumed conditions and with optimal choice of the starting point, ract was slightly underestimated with reasonable variance. This cannot explain the observed bias in the experiments. An explanation for the lower values for the estimated ract may be that rend does not represent the respiration rate in full absence of readily biodegradable matter. rs would then have been underestimated and so may ract. However, rend remained fairly constant during both experimental runs and was not significantly affected by the observed variation of sa (Figure 12). This supports the presumption that the concentration of readily biodegradable matter in the endogenous sludge was approximately zero.

64 BODst and respiration rate in an aeration tank
60
=i 50 E. "ST 40 IS
o 30
10
° ract measured ° ract estimated
- * fend •
• O D
[ j j n O t l D
' «
A o
&4^afe
9
O * *
J » 0 1 °
^ ^ w * * ^ ^ ,
• i i
*
a » -
D
V A ^ * - *
12 24 time (h)
36
i 1—i 1—r—i—i 1—i r • ract measured ° ract estimated
«té***
48 0 12 24 36 48 time (h)
ft
60 72
Figure 12: Estimated ract compared with measured ract. Measured rend is also shown.
A second explanation may be that the measured ract turns out too high. This would occur when the ratio of the influent sample flow into the respiration chamber and the flow into the aeration tank is greater than the ratio of the corresponding volumes. In the operation of the pilot plant the aim was to maintain the influent flow at 40 1 h"1. Therefore, the influent sample flow was fixed at 40-0.731/475 = 0.0616 1 h"1. This flow was daily verified and found to vary within an acceptable range (Table 1). However the influent flow varied between 36 and 40 1 h"1 due to clogging in the influent line. From the mass balances of s for the aeration tank and the measuring system, it can be estimated that an influent flow of 36 1 h"1 in combination with the applied influent sample flow would cause an overrating of the measured rsac t (=ract-rend) of about 5%.
Another circumstance that may have contributed to an overrating of the measured rsac t is the adoption of too small an aeration tank volume in the calculation of the wastewater sample flow to be employed. For instance, when the oxidation of readily biodegradable matter also occurs in the contact tank and in the settling tank, (a part of) the volumes of these tanks should also be included in the aeration tank volume (see Figure 2). From the mass balances of s for the aeration tank and the measuring system, it can be estimated that a true reactor volume of 642 litre in combination with the applied influent sample flow would cause an overestimate of the measured r t of about 11%. Hence, in the worst case the total overrating of the measured rsact would be about 16%. The correct rsact would then be about 0.16/1.16 or 14% lower than the measured value. This error of the measured rs act can explain the difference between the estimated and measured ract (or rs act) for most of the points in Figure 12.

Discussion 65
From the measurements it was concluded that the estimated sa and ract showed the typical diurnal variation usually found in the COD of the wastewater studied. A break in the influent supply was clearly reflected in a decrease of the two variables. The estimated ract
was significantly lower than the measured reference value. Accounting for the maximum (worst case) overrating of this measured ract, the estimated and measured values matched approximately.
3.9 Discussion
The purpose of this work was to develop a method for the measurement of the mixed liquor BODst (sa) and the actual respiration rate (ract) in a completely mixed aeration tank no matter whether this is a single reactor or a compartment of a series of well-mixed tanks. Contrary to another method developed earlier, this method does not involve continuous addition of influent sample to the respiration chamber. Instead, the transient respiration rate is measured during two modes of operation which are alternately executed. In the i-mode sludge from the aeration tank flows through the respiration chamber, whereas in the e-mode sludge having the endogenous rate is directed through the chamber. sa is obtained by integrating the mass balance equations holding for each cycle of both modes. In order to be able to do this, it is necessary to assume that the BODst in the respiration chamber is zero at the end of the e-mode. Finally, the measured respiration rate and the calculated BODst during each cycle of two modes are used to find the kinetic relationship in order to calculate ract.
From the simulation it was found that the calculated s in the e-mode was quite sensitive to the measured respiration rate, which led to considerable errors in the estimated sa and ract. This problem was solved for the greater part by starting the numerical calculation procedure in the e-mode at a point earlier than the end point of this mode. This point was chosen where rs exceeded the standard error of measurement for the respiration rate. For the experiments, this point was determined and fixed as an average optimum after examining the data. Another approach would be to find the best starting point for each individual e-mode. Instead of using the standard deviation of the respiration rate, the variables could also be found where they show minimum sensitivity to the choice of the starting point (Figure 7). Finally, an alternative numerical approximation could be tried to reduce the sensitivity of sa and ract.
In the procedure applied, the respiration rate was first calculated from the DO measurements (equation (2)). Next, the substrate respiration rate, rs, was calculated using

66 BODsl and respiration rate in an aeration tank
the endogenous respiration rate rend. Then, rs was used to solve the mass balances for s. An alternative procedure is to eliminate rs using equations (1), (3) and (4) or (7). This will allow to calculate sa directly employing the DO measurements carried out with the respiration meter. Applied to the simulated data as well as the measured data, this alternative procedure did not yield significant differences in the estimates compared to the procedure presented here. Nevertheless, for the calibration of the kinetic model, used to calculate ract, rs is needed after all.
In the evaluation of the measuring data to assess the kinetic order of the process, a hysteresis was observed in the kinetic relationship between rs and s, which complicated the choice of a kinetic model. A decline of the s-curve at the end of the i-mode (not shown) caused a scattering of the rs values at high s values (Figure 10). Therefore, the data were modelled with, as a compromise, a simple first order relationship. Since, for kinetic modelling, it is assumed that diffusion of substrate through the sludge floes is not limited, it may be useful to examine if this assumption is violated by the dynamic operation of the measuring system. One possibility would be to investigate the effect of different hydraulic retention times on the relationship between rs and s.
The measurements showed a good agreement between the pattern of the estimated ract and the one obtained from the previously described method (the measured ract). However the estimated values were significantly lower than the measured ones. A probable explanation is that the measured ract turned out too high because of too high an influent sample flow based on wrong assumptions on influent flow and reactor volume. One verification would be to use an influent with constant composition and known BODst so that the plant can be operated at steady state. This would allow to calculate sa from the mass balance for the aeration tank. Special attention should then be paid to the possible elimination of BODst
in the settling tank. Next, the estimated ract could be verified using information from separate kinetic experiments under plant condition.
For real time control, on-line monitoring of process variables is essential. In this chapter, the estimation the BODst and ract in the aerati« method is suitable for on-line implementation. the estimation the BODst and ract in the aeration tank was executed off-line. However the
3.10 Conclusions
The method proposed allows the estimation of the mixed liquor BODst (sa) and the actual respiration rate in the aeration tank (ract), provided that too large a build up of measuring

Notation 67
errors is avoided during the integration. This is achieved by choosing the starting point in the numerical integration at a point where the measured substrate respiration rate has not reached zero. The estimated variables from experimental data are in agreement with the diurnal variation typical for the wastewater used and r^, is in agreement with r ^ obtained by the previously described method. However a significant bias exists between the two results. This is possibly caused by an overrating of the traditionally measured r ^ . Compared to the previously described method for the measurement of sa and r^,, the proposed method is simpler in practice because the addition of influent sample to the respiration chamber is not necessary to assess ract and only two instead of three modes of respiration measurement are needed to find sa. Another advantage of the proposed method, in contrast with the other method, is that estimation of sa and ract is still possible, even if the influent supply would be interrupted. The method can function until sa
becomes too small.
3.11 Notation
BODst short-term biochemical oxygen demand
by first-order kinetic constant (time"1) b0 5 half-order kinetic constant (mass''* volume"' time"1) ca DO concentration at the inlet of the respiration chamber (mass volume"1) c DO concentration at the outlet of the respiration chamber (mass volume"1)
DO dissolved oxygen h sampling interval for c, ca and r (time) ML(V)SS mixed liquor (volatile) suspended solids
q activated sludge flow through respiration chamber (volume time"1)
r respiration rate in the respiration chamber (mass volume"1 time"1) rs r"rend = substrate respiration rate in the respiration chamber (mass volume"1
time"1) ract actual respiration rate (mass volume'1 time'1) rend endogenous respiration rate (mass volume"1 time"1)
s BO°st m t n e respiration chamber (mass volume"1) sa BODst in the aeration tank (mass volume"1) s0 initial BODst in the e-mode in the respiration chamber (mass volume"1) v volume respiration chamber (volume) a q/v = dilution rate (time"1)

68 BODst and respiration rate in an aeration tank
3.12 References
Bocken S.M., Braae M. and Dold P.L. (1989) Dissolved oxygen control and oxygen utilization rate estimation: extension of the Holmberg/Olsson method. Wat. Sei.
Technol. 21, 1197-1208. Chen C.Y., Roth J.A. and Eckenfelder W.W. (1980) Response of dissolved oxygen to
changes in influent organic loading to activated sludge systems. Wat. Res. 14, 1449-1457.
Clarke A.N., Eckenfelder W.W. and McMullen E.D. (1978) Development of a continuous respirometer. Wat. Res. 12, 799-804.
Duggan J.B. and Cleasby J.L. (1976) Effect of variable loading on oxygen uptake. J.
Water Pollut. Control Fed. 48, 40-550. Elmqvist H., Aström K.J., Schönthal T. and Wittenmark B. (1986) Simnon, User's
Guide for MS-DOS Computers. SSPA Systems, Sweden. Goto M. and Andrews J.F. (1985) On-line estimation of oxygen uptake rate in the
activated sludge process. In Advances in Water Pollution Control, Proc. 4th IAWPRC
Workshop 27 April - 4 May, Houston and Denver, U.S.A. pp. 465-472. Hamamoto Y., Ideshita Y. and Nonaka H. (1990) Application of a system with automatic
control of aeration time to the intermittent-aeration activated sludge process in an existing wastewater treatment plant. In Advances in Water Pollution Control, Proc. 5th
IAWPRC Workshop 26 July - 3 August, Yokohama and Kyoto, Japan, pp. 103-112. Harremoës P. (1977) Half-order reactions in biofilm and filter kinetics. Vatten 33, 122-
143. Heckershoff H. and Wiesmann U. (1986) Ein neues Meßgerät für die Betriebskontrolle
und Reglung von Belebtschlammanlagen. Teil 2: Messungen zur Atmungsaktivität von
Belebtschlämmen und zur Reaktionskinetik. Korrespondenz Abwasser 33, 600-606. Henze M., Grady C.P.L. Jr., Gujer W., Marais G.v.R. and Matsuo T. (1987) Activated
Sludge Model No. 1. IAWPRC Scientific and Technical Report No. 1, IAWPRC, London, England.
Holmberg U. and Olsson G. (1989) Simultaneous DO control and respiration estimation.
Wat. Sei. Technol. 21, Brighton, 1185-1195. Holmberg U. (1990) On identifiability of dissolved oxygen concentration dynamics. In
Advances in Water Pollution Control, Proc. 5th IAWPRC Workshop 26 July - 3 August, Yokohama and Kyoto, Japan.
Howell J.A. and Sopido B.O. (1985) On-line respirometry and estimation of aeration efficiencies in an activated sludge aeration basin from dissolved oxygen measurements.
1st IFAC symposium on Modelling and Control of Biotechnological Processes,
Noordwijkerhout, The Netherlands.

References 69
Kaneko M., Kawachi K. and Matsumoto A. (1985) Evaluation of oxygen uptake rate analyzer in wastewater treatment plants. In Advances in Water Pollution Control, Proc.
4th IAWPRC Workshop 27 April - 4 May, Houston and Denver, U.S.A., 521-524. Princz P. and Olâh J. (1990) BOD measurement of non-toxic wastewaters with an
improved microbial probe. In Advances in Water Pollution Control, Proc. 5th IAWPRC
Workshop 26 July - 3 August, Yokohama and Kyoto, Japan. Reynolds L.F. (1969) Discussion: Farkas P. 4th Int. Conf. on Water Pollut Control Res,
Prague. Jenkins (ed.) Adv. Water Pollut. Res. 309-317. Sollfrank U. and Gujer W. (1990) Simultaneous determination of oxygen uptake rate and
oxygen transfer coefficient in activated sludge systems by an on-line method. Wat. Res.
24, 725-734.
Spanjers H. and Klapwijk A. (1987) The Wazu-respirometer. A breakthrough in automation and control for a wastewater treatment plant. In 10th Symposium on
Wastewater Treatment, November 1987, Montréal, Québec, Canada.
Spanjers H. and Klapwijk A. (1990) On-line meter for respiration rate and short-term biochemical oxygen demand in the control of the activated sludge process. In Advances
in Water Pollution Control, Proc. 5th IAWPRC Workshop 26 July - 3 August, Yokohama and Kyoto, Japan, 67-77.
Spanjers H. and Olsson G. (1992) Modelling of the dissolved oxygen probe response in the improvement of the performance of a continuous respiration meter. Wat. Res., 26, 945-954.
Spanjers H., Olsson G. and Klapwijk A. (1993) Accepted for publication in Wat. Sei.
Technol., 6th IAWQ Workshop on Instrumentation, Control and Automation of Water & Wastewater Treatment and Transport Systems, June 17-25, Banff and Hamilton, Canada.
Temmink H., Vanrolleghem P., Klapwijk A. and Verstraete W. (1993) Accepted for publication in Wat. Sei. Technol., 6th IAWQ Workshop on Instrumentation, Control and Automation of Water & Wastewater Treatment and Transport Systems, June 17-
25, Banff and Hamilton, Canada.
71
Determining influent short-term biochemical oxygen demand by combining respirometry and estimation
4.1 Abstract
This chapter describes a method for the continuous estimation of the influent short-term biochemical oxygen demand (BODst) of a wastewater treatment plant. The method uses the dissolved oxygen (DO) concentration in the inlet and outlet of a closed, completely mixed respiration chamber during the transients between two modes of respiration measurement which are alternately executed. In one mode, sludge having the endogenous respiration rate is directed through the respiration chamber. In the other mode, sludge from the aeration tank directly flows through the respiration chamber and, in addition, a sample of influent is continuously introduced in the chamber. The influent BODst is estimated for each cycle of both modes by integrating the mass balances of BODst and DO over the respiration chamber. Knowledge of the degradation kinetics of readily biodegradable matter is not required. The proposed procedure is verified using both simulated and experimental data from a pilot plant. It is concluded that the procedure enables the estimation of the influent BODst with a relative error ranging from 2 - 6 % .
Accepted for publication: Spanjers H., Olsson G. and Klapwijk A. (1993) Determining influent short-term biochemical oxygen demand by combining respirometry and estimation. Wat. Sei. Tech., 6th IAWQ Workshop on Instrumentation, Control and Automation of Vv ater & Wastewater Treatment and Transport Systems, June 17-25, Banff and Hamilton, Canada.

72 Determining influent BODst
4.2 Introduction
Because activated sludge plants receive wastewater with varying flow and waste concentration, the process is seldom in steady-state. In order to operate the activated sludge process (have a sufficient degree of waste removal and production of sludge with good settling properties) control is needed. By measuring the influent waste concentration, useful information for control is obtained. Biochemical Oxygen Demand (BOD) is the most widely used measure of the waste concentration, because it is related to the biochemical process of the activated sludge itself.
Unfortunately, the BOD is unsuitable for control purposes, as it is mostly expressed in BOD5, which requires a five days analysis. This time span is too long for real-time control purposes. To overcome this problem other measures like chemical oxygen demand (COD) and total organic carbon (TOC) are used, however these do not predict how the activated sludge would respond to changes in the waste concentration. Another possibility is to seek a correlation between the BOD5 and variables, like influent flow, that can be measured continuously.
Considerable efforts have been spent to develop methods that enable continuous or batchwise measurement of the BOD for monitoring purposes. All these methods are based on a respirometric principle, using a low substrate to biomass ratio, and they yield a short-term BOD (BODst) that is not equivalent with the BOD5. Several authors correlated the BODst
with the conventional BOD5, with more or less success (Vernimmen et al., 1967; Riegler, 1984; Strand and Carlson, 1984; Vasel et al, 1991). However, the BODst is, in contrast to the BOD5, a more valuable variable for control purposes, because it represents the oxygen demand within the operating time of the activated sludge process and it is, in most cases, intimately related to the specific organisms of the activated sludge plant. The BOD5 is more appropriate to characterise the impact on the receiving water.
We propose to classify the methods for monitoring the BODst into three categories: state
estimation, BOD probe method and respirometer method.
Holmberg (1982) proposed a state estimation method to assess the influent BOD from a simplified model of the activated sludge process. In fact this method uses the aeration tank as a respiration chamber. No further experimental verification of the approach has been presented.
A BOD probe consists of immobilized living cells, a membrane and a dissolved oxygen

Introduction 73
electrode. The signal of the probe is a measure of the activity of the cells, which is, in turn, a measure of the substrate concentration in the water. Probes with both activated sludge organisms (Strand and Carlson, 1984; Princz and Olâh, 1990) and yeast cultures (Harita et
al., 1985; Riedel et al., 1988) are reported in the literature. The performance of the probe, calibrated in a certain solution, is dependent on the composition of wastewater. Another disadvantage is that the linear range of BOD probes is below the BODst of most wastewaters, so that samples have to be diluted, which is unsuitable for continuous measurement.
Respirometric BOD procedures can be divided into batch methods and continuous methods. Typical of batch methods is that the BOD is calculated from a respirogram obtained after the addition of a wastewater sample to a respirometer. Closed respirometers, which are not aerated, use a DO-probe or a manometer to record the respirogram (Vernimmen et al., 1967; Tebbutt and Berkun, 1976; Cadena et al., 1988). These meters are laborious to operate and unsuited for continuous measurement. Open aerated respirometers need either a calibration, using a substrate with known BOD (Farkas, 1981; Vanrolleghem et al, 1990), the aeration constants need to be known (Suschka and Ferreira, 1986; Ros et al., 1990; Ciaccio, 1992) or two DO measurements at a separated closed respiration chamber are needed (Spanjers and Klapwijk, 1990a). When applying a sampling device for sludge and wastewater, most batch methods can be automated to obtain a discontinuous monitor of the influent BOD.
In continuous respirometric BOD methods, the wastewater sample is continuously fed into a flow-through reactor having a volume of at most a few litres. Heckershoff and Wiesmann (1986) suggested a method which measures the difference of the oxygen consumption between two parallel reactors, both continuously fed with sludge. Additionally, one is fed with influent sample while the other is fed with tap water. The influent BOD is calculated from DO and BOD mass balances over the reactors. For this calculation it is necessary to assume that the BOD in the activated sludge supplied is equal to zero and that the DO concentrations in both reactors are equal. Riegler (1984) described a method which is based on calibration with a standard with known BOD. The sample is continuously diluted with tap water and the mixture is directed through a reactor with immobilized microorganisms. The DO concentration difference of the flow entering the reactor and the flow leaving the reactor is measured and kept constant by manipulating the dilution ratio. From the comparison with a standard with known BOD5, the BOD5 of the wastewater can be determined. In fact, the measurement uses the correlation between BODst and BOD5 so that the result is dependent on the type of wastewater. Moreover, since the bacteria are separately grown, the population of microorganisms in the reactor may not have the same properties as the activated sludge in the plant.

74 Determining influent BODst
Spanjers and Klapwijk (1990a) proposed a method to calculate the influent BODst from three types of respiration rate: the endogenous, the instantaneous and the actual rate. The endogenous respiration rate is the oxygen uptake rate of sludge free of readily biodegradable matter. The instantaneous rate is the oxygen uptake rate measured when sludge directly flows from the aeration tank through a respiration meter. The actual respiration rate, defined as the real oxygen uptake rate in the aeration tank, is measured if the respiration chamber is equally loaded with BODst as the aeration tank. The authors showed, using a mass balance over the respiration chamber, that the influent BOD can be calculated from these three rates. The model is based on the assumptions that the degradation of readily biodegradable matter can be described by half order kinetics and that steady state is attained during the respiration measurements.
In this chapter, we propose and test a procedure for the continuous estimation of the influent BODst. The method uses the DO concentration in the inlet and outlet of a closed respiration chamber during the transients between two modes of respiration measurement. Knowledge of the degradation kinetics of readily biodegradable matter is not required. Other advantages are that a BOD calibration is not needed and that the aeration constants need not to be known. The proposed procedure is verified using both simulated and experimental data from a pilot plant. It is concluded that the procedure enables the estimation of the influent BODst.
4.3 Principle of the measurement
For the continuous estimation of the influent BODst, a measuring system is developed which
is fed with sludge of the plant under consideration. This means that the measuring system is
closely linked to the activated sludge plant. Figure 1 shows a schematic diagram of the
measuring system along with the activated sludge plant.
The measuring system consists of a closed, completely mixed respiration chamber, a DO probe, sample pumps for activated sludge and influent and six solenoid valves. By using four valves that switch the flow through the respiration chamber, typically every 30 seconds, the DO concentration is successively measured in the inlet and outlet of the chamber. From the DO-concentrations, the respiration rate can be calculated using a numerical approximation of the mass balance over the respiration chamber (Spanjers and Klapwijk, 1990a).
In the present work, we calculate the respiration rate for the assessment of the endogenous
respiration rate. Furthermore, the influent BODst is estimated from the DO concentration in
the inlet and outlet of the respiration chamber during the transients between two modes of

Principle of the measurement 75
operation. In the endogenous mode (e-mode), sludge having the endogenous respiration rate is directed through the respiration chamber. This sludge is produced in an aerated bypass tank (Spanjers and Klapwijk, 1990a). In the mode where the actual respiration rate is measured (a-mode), sludge from the aeration tank directly flows through the respiration chamber and, in addition, a sample of influent is continuously introduced in the chamber. It can be demonstrated (Spanjers and Klapwijk, 1987; Sollfrank, 1988) that the BODst in the chamber equals the BODst in the aeration tank if the ratio of the influent sample flow to the chamber volume equals the ratio of the influent flow to the aeration tank volume. The measuring period for one mode is typically 15 minutes and is sufficiently long to let BODst
and respiration rate in the chamber converge to an ultimate value.
measuring system pjlot plant
effluent |
sludge sample valve
tt °°rbe T T r - ^ valve
/ a l v e s \ ^ valves " y ^ 1—0
to aeration i n f l u e n t s a m P l e P"mP tank
influent <
return sludge
Figure 1: Scheme of activated sludge plant and measuring system.
At the end of each a-mode, the measurement is changed to the e-mode and the sludge in the respiration chamber is gradually replaced by endogenous sludge. The endogenous sludge contains no readily biodegradable matter, so the BODst of the endogenous sludge is assumed to be zero. Hence, in the e-mode, the BODst in the respiration chamber remaining from the a-mode will be washed out and the respiration rate will decrease. At the end of each e-mode the BODst in the respiration chamber is, zero and the rate measured is the endogenous respiration rate.

76 Determining influent BODst
At the end of each e-mode, the measurement is changed to the a-mode and the sludge in the chamber is gradually replaced by sludge from the aeration tank, supplied with influent sample. Since, in the a-mode, the respiration chamber is equally loaded as the aeration tank, the BODst in the chamber will converge to a value equal to the BODst in the aeration tank
In the next section we shall show how the DO measurements in the inlet and outlet of the respiration chamber during the transients can be used to estimate the influent BODst.
4.4 Estimation of the influent BODst
The influent BODst (j,-) is calculated from cycles, each of them consisting of two successive modes: one a-mode and one e-mode. Because each mode takes 15 minutes, the calculation interval of st is typically 30 minutes. Figure 2 schematically illustrates the estimation procedure. This involves three steps, executed for each cycle:
1. assessment of the endogenous respiration rate (rend);
2. calculation of the BODst in the aeration tank (sa);
3. calculation of the influent BODst (st).
1. Endogenous respiration rate
It is assumed that, at the end of each e-mode, the BODst in the respiration chamber is zero, so that the endogenous respiration rate (rend) is measured. It is further assumed that rend is constant during the whole cycle of 30 minutes. To obtain an operational rend for the whole cycle, the last measured rates of the current and previous cycle are averaged (Figure 2b).
2. BODa in the aeration tank (sj
In the e-mode, the mass balances of DO and BODst over the respiration chamber are
respectively:

Estimation of the influent BODst 77
(a) a-mode e-mode
Figure 2: Schematic representation of the procedure for the estimation of st. One cycle,
consisting of one a-mode and one e-mode is shown, (a) Measured DO concentration at the
inlet, ca, and outlet, c, of the respiration chamber, (b) Respiration rate calculated from the
DO concentrations, (c) Pattern of the BODst in the respiration chamber, (d) Difference
between c and s.

78 Determining influent BODsl
de , n i - rtnd (1) "£ - *(c.-c)-r.-r.
4 - -*s-rt (2) dt
The BODst in the respiration chamber is known as being zero at the end of the e-mode (Figure 2c). The BODst during the e-mode can now be calculated directly from the DO concentrations. From the observation that rs can be eliminated from (1) and (2), we introduce a help variable p=c-s (Figure 2d):
* _ - / , _ „ x _ , (3) •% - *{<a-P)-rtnd
The variable p is known at the end of the e-mode, so that its value at the beginning of the e-mode can be calculated. Given the discrete time measurements, equation (3) has to be approximated by a difference equation. Approximating the derivative with the trapezoidal rule and solving for pk_j we get for the e-mode:
Pk-i - TTr["(iaA+1)/,*+ahc**-{-hre«d (4)
where k=\, 2,..., n (n typically 15).
Using the end condition sn=0, so thatpn=cn-sn=cn, p0 can be calculated. This value is used to find the influent BODst from the a-mode.
Knowing that s at the beginning of the e-mode is equal to s at the end of the a-mode, and
recalling that the BODst in the respiration chamber at the end of the a-mode is equal to sa,
the latter can be calculated as an intermediate:
sa - so - co~Po ( 5 )

Materials and methods 79
3. Influent BODa (s)
In the a-mode, the mass balances of DO and BODst over the respiration chamber are
respectively:
oc - o , c - r , - r . (6) j . a t s end
asn + a,sl-aTs-r. (7) dt a ' • r *
The BODst in the respiration chamber is known as being zero at the beginning of the a-mode.
Using the same help variable, p, to eliminate rs, we obtain:
dp _ „,„ _ .x_„ „ _ „ . _ , (8) — - alc-s\-awp-a,s,-r. it \ a af rr l I end
The variable p is known at the beginning of the a-mode, and its value at the end of the a-mode can be calculated. Approximating the derivative and solving for pk we get for the a-mode:
t r
(9)
Using the initial condition s0=0, so that p0=c0-s0=c0, pn can be calculated. Finally, si can
be found explicitly from equation (9) so that/?n (a-mode) = p0 (e-mode).
The procedure for the estimation of st was verified using both simulated data and
experimental data from a pilot plant.
4.5 Materials and methods
In the simulations, executed with SIMNON (Elmqvist et al., 1986), measuring data were generated using a model of the pilot plant and measuring system (Figure 1). This model simulates, for a known s{, the DO at the inlet and at the outlet of the respiration chamber during the alternating modes of operation (a-mode and e-mode). The DO was given a noise

80 Determining influent BODsl
having a normal distribution with a standard deviation of 0.005 mg l"1. The values of the parameters and variables (Table 1) were in accordance with the experimental conditions of the pilot plant. First order kinetics for BODst was employed. The DO measurements generated with the simulation model were saved in a file and processed according to the procedure proposed in this chapter to calculate st. The result was compared with the simulated, known sf.
In the experiments, the measurements were carried out at a pilot plant equipped with a respiration measuring system (Figure 1). This system was capable of measuring consecutively the respiration rate of sludge in the a-mode and in the e-mode. The control of valves and pumps, collection of data and the basic calculations were performed by a modular I/O processor (/xMac 6000, Analog Devices).
The pilot plant, fed with presettled domestic sewage, consisted of an unaerated contact tank (four 2 litre compartments in series), a completely mixed aeration tank and a settling tank. The air flow rate was maintained constant using a flow controller. Sludge with the endogenous respiration rate was produced in a bypass tank, consisting of five 5 litre aerated compartments in series, through which activated sludge from the aeration tank was continuously recirculated. It was verified that, under normal loading conditions, the sludge leaving this tank was free of readily biodegradable matter (Spanjers et al., 1993).
The measuring system consisted of a respiration meter (prototype of RA-1000, Manotherm) having a respiration chamber, an influent sample pump and six valves. To operate alternately in the a-mode and in the e-mode, two valves were used to select sludge from the aeration tank and the bypass, respectively. During the a-mode, a sample of influent was continuously added to the sludge flowing through the respiration chamber. Table 1 lists the average process conditions during the measuring period.
To verify the proposed estimation procedure, the following strategy was used. During the period 12:00 h to 24:00 h, the influent was taken from a slowly stirred 500 litre storage tank. Because the concentration of readily biodegradable matter of the stored wastewater was assumed constant, it was expected that the estimated s( during this period was constant. In addition, the BODst of the wastewater was independently determined using a batch respiration measurement system (Spanjers and Klapwijk, 1987, 1990b), equipped with a RA-1000 respiration meter. During the period 0:00 h to 12:00 h the storage tank was refilled with wastewater from the sewer while the reactor was simultaneously fed with the same water. During this period, there was a varying concentration of readily biodegradable matter in the influent and consequently st was expected to vary.

Materials and methods 81
Table 1: Conditions of simulations and experiments for estimation ofst. Irrelevant conditions
indicated with "- ".
sampling interval ca, c and r (s)
duration one mode (min)
volume aeration tank (1)
influent flow (1 h"1)
return sludge flow (1 h"1)
waste sludge flow from AT (1 h"1)
air flow (m3h_1)
volume bypass tank (1)
recirculation flow bypass (1 h"1)
volume respiration chamber (1)
sludge flow through resp. chamber (1 h"1)
influent sample flow (1 h"1)
influent BODst (mg 1_1)
influent ammonium-N on day 1 (mg l"1)
influent total nitrogen (mg l"1)
influent COD on day 1 (mg l"1)
MLSS (g l"1)
MLVSS (g l"1)
temperature sludge (°C)
pH
endogenous respiration rate (mg l^h"1)
endogenous sludge BODst (mg l"1)
biodégradation in settler
biomass growth
kinetics with respect to BODst
simulation
60
15
475
40
-
-
-
-
-
0.731
21
0.0616
100if0<time<6h
250if6<time<12h
-
-
-
-
-
-
-
20
0
none
none
lst-order 10 h"1
experiment
60
15
475
40-42
41-43
1.43
2.4
25
26
0.731
21.78
0.0616
100-350
23.5
34.5
243
2.42-2.52
1.92-1.99
17.8-19.2
7.2-7.3
17-21
assumed 0
assumed 0
unknown
unknown
For the batch experiments, a sludge sample from the aeration tank was transferred to the batch system and the respiration rate was recorded. When the rate reached the endogenous level, a known volume of wastewater from the storage tank was added. The rate was recorded until the endogenous level was reached again. The BODst of the wastewater sample

82 Determining influent BODsl
was calculated from the total amount of oxygen additionally used to the endogenous oxygen consumption. This procedure was repeated several times with another addition of the same water sample. During the batch experiments, pH and temperature were maintained at 7.5 and 20 °C.
4.6 Estimation of s{ from simulated measurements
To verify the proposed procedure and to examine the error in the estimated st, this variable was estimated from simulated DO data. These data were generated from a mathematical model which was given a known input step function of st. Normally distributed noise was added to the simulated DO. In this simulation, any deviation of the estimated values from the original ones resulted from the noise added to the DO and the assumptions associated with the estimation procedure. Figure 3 shows the original and estimated values. Since rend and sa, as intermediates in the estimation procedure, have an influence on st, these variables are also given in the figure.
As required by the method, the estimated rend did not depend on the influent BODst, was close to the original value of 20 mg \'\'x and showed a small standard deviation (Figure 3a). As dictated by the model, the simulated sa was a function of the influent BODst. The estimated sa (Figure 3b) also showed the step response. However, the average values of this variable (calculated from repeated simulations) deviated from the simulated ones. Moreover, the estimated sa showed a substantial standard deviation. Before the step increase, when the influent BODst was 100 mg l"1, the error was even greater than the estimated value itself. When the influent BODst was 250 mg l"1, considered to be a moderate value for the wastewater, the relative error was 53%.
Because of its large value the estimated st was much less sensitive to noise on the DO. The average s( before and after the step change, 99+3.8 mg l"1 and 250±3.4 mg l"1 respectively, were close to the simulated values.
The simulation leads to the conclusion that the procedure proposed here allows the estimation of the influent BODst (s,). The BODst in the aeration tank (sa), an intermediate in the estimation of st, shows a substantial relative error. This is due to the low value of sa.

Estimation of s t from simulated measurements 83
E
j >
21
20
19
(a)
V/y/////////V//////?///77?/. yyy/yyyyyyyy/yyyytfyyyjyyyy.
simulated estimated average
8 10 12
(b)
i wM^&mxm '////////////y\ simulated
estimated average
8 10 12 300
vf~ 200 O)
E. « 100
(c)
• - • •-,.+.*., ., •.. » .
-
simulated • estimated -
average
2 4 6 8 10 12 time (h)
Figure 3: Result of the estimation of (a) rend, (b) sa and (c) stfrom simulated DO measurements. The simulated st was given a step change from 100 mg t1 to 250 mg T1 at 6 h. Noise with standard deviation 0.005 mg V1 was added to the simulated DO. Solid lines: simulated value, points: estimated values; dotted lines: averaged estimate; dashed zones: standard deviation estimation.
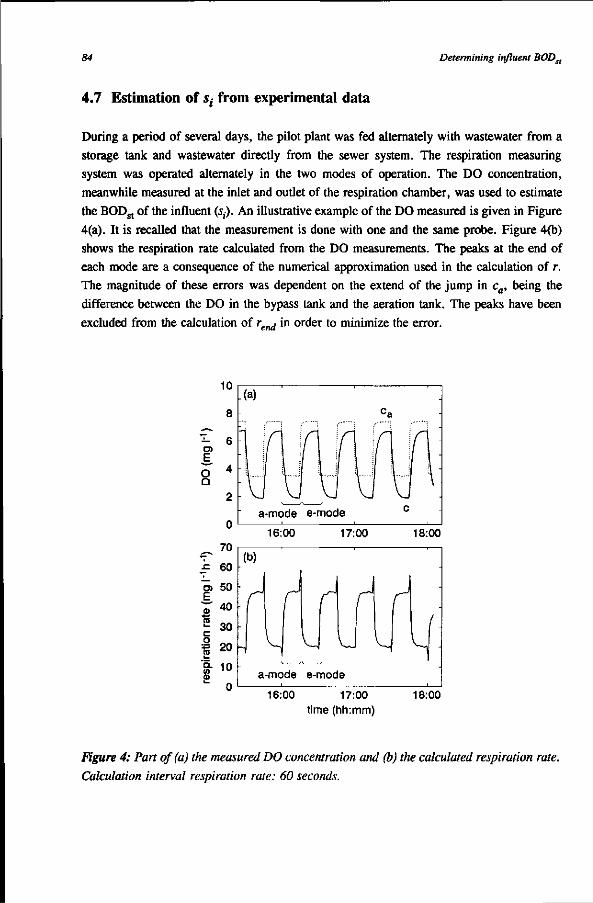
84 Determining influent BOD•
4.7 Estimation of s,- from experimental data
During a period of several days, the pilot plant was fed alternately with wastewater from a storage tank and wastewater directly from the sewer system. The respiration measuring system was operated alternately in the two modes of operation. The DO concentration, meanwhile measured at the inlet and outlet of the respiration chamber, was used to estimate the BODst of the influent (s{). An illustrative example of the DO measured is given in Figure 4(a). It is recalled that the measurement is done with one and the same probe. Figure 4(b) shows the respiration rate calculated from the DO measurements. The peaks at the end of each mode are a consequence of the numerical approximation used in the calculation of r. The magnitude of these errors was dependent on the extend of the jump in ca, being the difference between the DO in the bypass tank and the aeration tank. The peaks have been excluded from the calculation of rend in order to minimize the error.
70
60
50
40
30
20
10
16:00 17:00 18:00
(b)
•
m r
L H
L A I
-
4: a-mode e-mode
16:00 17:00 time (hh:mm)
18:00
Figure 4: Part of (a) the measured DO concentration and (b) the calculated respiration rate.
Calculation interval respiration rate: 60 seconds.

Estimation of st from experimental data 85
The estimated variables, for a measuring period of 53 hours, are given in Figure 5. rend,
having relatively little noise, shows a gradual variation, probably caused by varying activity and biomass concentration. The decrease in the night of day 2, is partly caused by a loss of biomass. The MLSS of grab samples of activated sludge, taken at about noon from the aeration tank was 2.50 g l"1 and 2.42 g l"1 on day 2 and 3, respectively.
As expected from the simulation, sa showed considerable relative variation (Figure 5b). Assuming that the real sa was constant during the periods with influent from the storage tank, the standard deviation of the estimated sa in these periods would be a indication of the estimation error. For the first and the second period we got 2.51 ±1.12 mg l"1 or +45% and 4.40±0.80 mg l"1 or ±18%, respectively.
Figure 5(c) shows that the estimated st was relatively constant during the periods with influent from the storage tank. For the first and second period, assuming constant BODst
during storage, we obtained for st: 104±6 mg l"1 or ±5.8% and 287±7 mg l"1 or ±2.6%, respectively. To verify the estimated st during the periods with influent from the storage tank, the BODst of samples of the stored water was also determined using the batch respirometric method. These BODst values are also shown in Figure 5(c).
Both methods matched reasonable well, indicating that the method proposed enables the estimation of st. Table 2 summarises the values of both methods. The wastewater usually shows a diurnal peak in the waste concentration at about noon (Spanjers and Klapwijk, 1991). A part of this peak can be seen in Figure 5(c), on day 2 at the end of the period with influent from the sewer system. On day 2, both methods indicated a decrease in the influent BODst during storage. An explanation is that there was biochemical oxidation in the storage tank. A higher biochemical activity during storage of the wastewater in the second period, compared with the first one, was not unlikely, because of higher wastewater temperature (1.0 to 1.5 °C) and waste concentration.

86 Determining influent BODst
30
25
O) 20
C
° 15
10
10
±- 6
« 4
(a)
*VV?*«
" W i • •
0:00 12:00
D j | D !
? • w w : °
0:00 12:00
2
0
400
300
200
100
(b)
O D
[?
a 0:00 12:00 0:
(c)
day 1 :- day 2
00 12 00
mil) a c ^
day 3 0:00 12:00 0:00 12:00
time (hh:mm)
Figure 5: Results of the estimation procedure applied on experimental measurements, (a) rend' (b) sa and (c) s(. Open markers: estimated values; dotted lines: average; dashed zones:
standard deviation; filled markers: BODst determined in batch experiments. Influent was
taken from the storage tank from 12:00 to 24:00 h.

Estimation of st front experimental data 87
Table 2: Influent BODsl from estimation procedure and batch experiments compared, avg =
averaged BODst, std = standard deviation ofBODst.
estimation batch
avg std time repeated avg measurements
day 1, 12:00 h - 24:00 h 104 6 15:00 94 82 80 85
day 2, 12:00 h - 24:00 h 287 7 13:00 303 317 - 310
16:00 310 298 311 306
day 3, 12:00 h - 17:00 h 264 11 12:30 319 313 318 317
16:00 300 294 293 296
Examples of respirograms obtained with the batch method are given in Figure 6. In agreement with earlier results (Spanjers and Klapwijk, 1990a), each respirogram shows an initial peak, a first shoulder and, at the end, a second shoulder. During these additions, the respiration rate at the baseline only decreased from 22 to 20 mg r'h"1 in 110 minutes, indicating that the endogenous respiration rate, as defined in this work, was reached. However this rate was still higher than rend measured at the pilot plant: 18.5 mg r'h"1. This is probably caused by the higher temperature in the batch experiments: 20 °C compared with 18.7 °C in the pilot plant.
Further experimental evidence, using ammonium concentration in the wastewater (Table 1),
has confirmed that the BODst of the wastewater considered is mainly caused by ammonium
being oxidised by nitrifiers.
From the experimental results it is concluded that the proposed method enables the estimation of the influent BODst. The BODst in the aeration tank, estimated as an intermediate variable, however, shows substantial lack of precision.
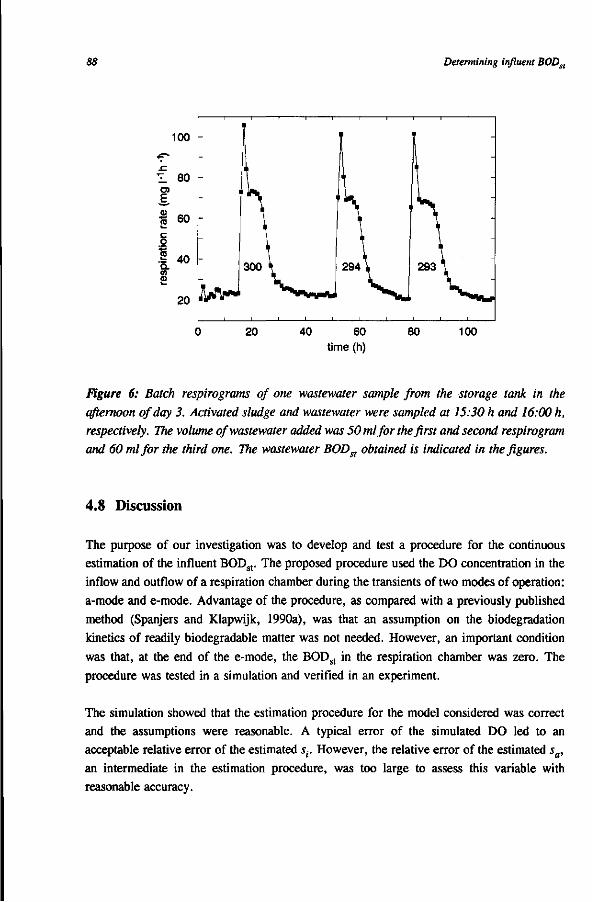
88 Determining influent BODsl
100
T 80 OÏ E
I 60 c o
resp
irât
o o
-
_
-
il W
I T T
\
^ \ 1 \
300 \
1 1
1 j0k 1 _
T 1 1
2 9 4 1 293 T
20 40 60
time (h)
80 100
Figure 6: Batch respirograms of one wastewater sample from the storage tank in the
afternoon of day 3. Activated sludge and wastewater were sampled at 15:30 h and 16:00 h,
respectively. The volume of wastewater added was 50 ml for the first and second respirogram
and 60 ml for the third one. The wastewater B0Dst obtained is indicated in the figures.
4.8 Discussion
The purpose of our investigation was to develop and test a procedure for the continuous estimation of the influent BODst. The proposed procedure used the DO concentration in the inflow and outflow of a respiration chamber during the transients of two modes of operation: a-mode and e-mode. Advantage of the procedure, as compared with a previously published method (Spanjers and Klapwijk, 1990a), was that an assumption on the biodégradation kinetics of readily biodegradable matter was not needed. However, an important condition was that, at the end of the e-mode, the BODst in the respiration chamber was zero. The procedure was tested in a simulation and verified in an experiment.
The simulation showed that the estimation procedure for the model considered was correct and the assumptions were reasonable. A typical error of the simulated DO led to an acceptable relative error of the estimated st. However, the relative error of the estimated sa,
an intermediate in the estimation procedure, was too large to assess this variable with reasonable accuracy.

Discussion 89
The measurements showed similar results with regard to the errors of the estimated variables.
Assuming that, during the periods with influent from the storage tank, sa and s( were
constant, their relative errors could be determined as being 20-45% and 2-6%, respectively.
Under the plant conditions in this work, sa was only 1.5 to 2.5% of s;, meaning that sa could
have been neglected in the estimation procedure. However, in a higher loaded plant, this may
not be allowed.
Because the calculation of sa started at the end of the e-mode, with the last c, the numerical integration was much affected by the inaccuracy of this DO value. This may be considered in the algorithm, and features can be added to the integration to minimize this sensitivity. One possibility would be to start the calculation where the slope of p (Figure 2d) becomes significantly different from zero. A critical part of the estimation is the filtering and integration of the measurement values. This may be subject for further investigations.
Because, in the proposed method, the respiration rate is measured as a function of a continuously varying BODst in the respiration chamber, the kinetic relationship between these variables may be determined for each cycle. Steady state with regard to the transport of substrate must then be assumed. From eqs. (1) and (6), rs can be calculated. Then, from eqs. (2) and (7), j is calculated using the boundary conditions s0=0 (a-mode) and £„=0 (e-mode). Finally, the kinetic relationship can be fitted on the corresponding points rs and s.
Our experience was that the proposed method was easily applicable in practice. Most attention had to be paid to correctly measuring the a-mode, since here it was necessary that the ratio of the influent sample flow rate to the chamber volume matched the ratio of the influent flow rate to the aeration tank volume. Since the influent flow was constant in the experiment described here, the sample flow could be fixed. A varying influent flow, common in full scale plants, would require an accurate control of the sample flowrate.
The experiments showed that the BODst, as defined in this work, is an important variable for characterising the dynamics of the oxygen demand in the activated sludge process. In this work the BODst was defined as the oxygen demand in excess of the demand for endogenous oxygen consumption. The endogenous respiration rate was practically defined as the oxygen uptake rate of sludge after a mean residence time of 1 hour in an aerated reactor consisting of five 5 litre compartments in series. The batch experiments clearly illustrated (Figure 6) that this was a reasonable definition since the rend level changed only slightly during a period of 2 hours after sampling and, after the addition of wastewater, the rate rapidly returned to this level. The endogenous rate includes the oxidation of slowly biodegradable matter. The gradual increase of rend on day 2 (Figure 5) partly indicates an enlarged oxygen uptake rate
90 Determining influent BODst
for the degradation of slowly biodegradable matter caused by the higher loading compared
to day 1.
4.9 Conclusions
The method proposed here allowed the estimation of the influent BODst. When it was
assumed that, during the measurement with influent from the storage tank, the concentration
of readily biodegradable matter was constant, the relative error of the estimated BODst could
be determined: 2 to 6 %. There was a reasonable agreement between the estimated BODst
and the BODst determined in batch experiments.
4.10 Notation
BODst short-term biochemical oxygen demand
c DO concentration in respiration chamber (mass volume"1)
ca DO concentration in aeration tank (mass volume"1)
DO dissolved oxygen
h sampling interval DO concentration (inlet or outlet) (time)
p = c-s help variable (mass volume"1)
q sludge flow through respiration chamber (volume time"1)
qi influent sample flow through respiration chamber (volume time"1)
r = rs+rend respiration rate (mass volume"1 time"1)
rend endogenous respiration rate (mass volume"1 time"1)
rs substrate respiration rate (mass volume"1 time"1)
s BODst in the respiration chamber (mass volume"1)
s0 BODst in the respiration chamber at the beginning of a measuring mode (mass
volume"1)
sa BODst in the aeration tank (mass volume"1)
S( BODst of the influent (mass volume"1)
sn BODst in the respiration chamber at the end of a measuring mode (mass volume"1)
v volume respiration chamber (volume)
a = q/v dilution rate (time"1) a i = Qjv dilution rate (time"1) ar = a+a ; dilution rate (time"1)

References 91
4.11 References
Cadena F., Drohobyczer A., Beach M.I. and Barnes D. (1988) A novel approach to
simplified respirometric oxygen demand determinations. 43rd Purdue Industrial Waste
Conference Proceedings, 459-467. Ciaccio L.L. (1992) Instrumental determination of the energy oxygen and BOD5. Wat. Sei.
Tech. 26, No. 5-6, 1345-1353. Elmqvist H., Äström K.J., Schönthal T. and Wittenmark B. (1986) Simnon, User's Guide
for MS-DOS Computers. SSPA Systems, Sweden. Farkas P.A. (1981) The use of respirography in biological treatment plant control. Wat. Sei.
Technol. 13, 125-131. Harita K., Otani Y., Hikuma M. and Yasuda T. (1985) BOD quick estimating system
utilizing a microbial electrode. In Advances in Water Pollution Control, Proc. 4th
IAWPRC Workshop on Instrumentation and Control of Water and Wastewater Treatment
and Transport Systems, 27 April- 4 May, Houston and Denver, U.S.A., pp. 529-532. Heckershoff H. and Wiesmann U. (1986) Ein neues Messgerät für die Betriebskontrolle und
Reglung von Belebtschlammanlagen. Teil 1: Messung der Substratkonzentration.
Korrespondenz Abwasser 33, 508-513. Holmberg A. (1982) Modelling of the activated sludge process for microprocessor-based state
estimation and control. Wat. Res. 16, 1233-1246. Kalte P. (1990) The continuous measurement of short-time BOD. In Advances in Water
Pollution Control, Proc. 5th IAWPRC Workshop on Instrumentation, Control and
Automation of Water and Wastewater Treatment and Transport Systems, 26 July - 3
August, Yokohama and Kyoto, Japan, pp. 59-65. Princz P. and Olâh J. (1990) BOD measurement of non-toxic wastewaters with an improved
microbial probe. In Advances in Water Pollution Control, Proc. 5th IAWPRC Workshop
on Instrumentation, Control and Automation of Water and Wastewater Treatment and
Transport Systems, 26 July - 3 August, Yokohama and Kyoto, Japan, pp. 79-87. Riedel K., Renneberg R., Kühn M. and Scheller F. (1988) A fast estimation of biochemical
oxygen demand using microbial sensors. Appl. Microbiol. Biotechnol. 28, 316-318. Riegler G. (1984) Kontinuierliche Kurzzeit-BSB-Messung. Korrespondenz Abwasser 5, 369-
377. Ros M., Zagorc-Koncan J., Dular M. and Pompe M. (1990) Respirometric determination
of wastewater biodégradation in a biological treatment plant. Z. Wasser,
Abwasserforschung 23, 236-240. Sollfrank U. (1988) Bedeutung organischer Fraktionen in kommunalem Abwasser im
Hinblick auf die mathematische Modellierung von Belebtschlammsystemen. Ph.D. thesis, Technical University, Zürich, Switzerland.

92 Determining influent BODsl
Spanjers H. and Klapwijk A. (1987) The Wazu-respiration meter. A breakthrough in automation and control for a wastewater treatment plant. In 10th Symposium on
Wastewater Treatment, November 1987, Montréal, Québec, Canada. Spanjers H. and Klapwijk A. (1990a) On-line meter for respiration rate and short-term
biochemical oxygen demand in the control of the activated sludge process. In Advances
in Water Pollution Control, Proc. 5th IAWPRC Workshop on Instrumentation, Control and
Automation of Water and Wastewater Treatment and Transport Systems, 26 July - 3 August, Yokohama and Kyoto, Japan, pp 67-77.
Spanjers H. and Klapwijk A. (1990b) Dynamiek van het zuurstofverbruik in aktief-slibsystemen gemeten met de Wazu-respiratiemeter. Report, Wageningen Agricultural University.
Spanjers H. and Klapwijk A. (1991) Continuous estimation of short term oxygen demand from respiration measurements. Wat. Sei. Tech. 24, 29-32.
Spanjers H., Temmink H., Lijklema L. and Klapwijk A. (1993) Maximum respiration rate
of activated sludge. To be published. Strand S.E. and Carlson D.A. (1984) Rapid BOD measurement for municipal wastewater
samples using a biofilm electrode. J. Wat. Pollut. Control Fed. 56, 464-467. Suschka J. and Ferreira E. (1986) Activated sludge respirometric measurements. Wat. Res.
20, 137-144. Tebbutt T.H.Y. and Berkun M. (1976) Respirometric determination of BOD. Wat. Res. 10,
613-617. Vanrolleghem P., Dries D. and Verstraete W. (1990) RODTOX: biosensor for rapid
determination of the biochemical oxygen demand and the on-line monitoring of the toxicity of wastewaters. In Proceedings Fifth European Congress on Biotechnology. 8-13 July, Copenhagen, Denmark, Vol. 1, pp 161-164.
Vasel J.L., Warnier P., Jupsin H. and Schrobiltgen P. (1991) Automatisation et comparaison
de différentes méthodes respirométriques d'estimation rapide de la DBO. Revue des
Sciences de l'Eau 4, 415-435. Vernimmen A.P., Henken E.R. and Lamb J.C. (1967) A short-term biochemical oxygen
demand test. J. Wat. Pollut. Control Fed. 39, 1006-1020.

93
Maximum respiration rate of activated sludge
5.1 Abstract
The maximum respiration rate (rmax), defined as the oxygen uptake rate when there is an excess of readily biodegradable substrate, is a variable that can be measured with a respiration meter. It is useful in operating the activated sludge process. Respiration is the result of the oxidation of multiple substrates by a heterogenous population of microorganisms. This implies that, theoretically, rmax can only be measured if all the individual substrates are present in excess.
This work discusses under which condition on-line measurement of rmax can take place. The discussion is restricted to nitrifying sludge fed with domestic wastewater from a particular source. The readily biodegradable part of this wastewater can be represented by two components. It is shown that rmax can be measured if wastewater is continuously fed into a respiration chamber, so that the loading exceeds a certain critical loading. This critical loading is a function of the kinetic parameters of the components and of the fractions in which the components occur in the wastewater concerned. It is shown that batch tests can be used to verify if the condition for on-line measurement of rmax, an excess of substrate, is met.
An application of the developed measurement is described: an investigation of the effect of the influent flow of a nitrifying activated sludge plant on rmax. It is concluded that, under the experimental conditions applied, there is no significant effect. The batch tests are useful for checking the on-line measurements. However, the results are not fully satisfactory. Suggestions for improvements are made.
To be published by: Spanjers H., Temmink H., Lijklema L. and Klapwijk A.

94 Maximum respiration rate of activated sludge
5.2 Introduction
In the activated sludge process, besides the conversion into cell material, oxidation is the main process for removal of biodegradable matter. Therefore, the oxygen uptake per unit of volume and unit of time, or respiration rate, is an important variable for monitoring and controlling the activated sludge process and performing kinetic studies .
Respiration rate has been proposed and used as a variable for monitoring the activated sludge process (Duggan and Cleasby, 1976); Brouzes 1979; Young, 1981; Spanjers and Klapwijk, 1990; Tur et al., (1990). Variables which cannot easily be measured like the biochemical oxygen demand, have also been derived from the respiration rate (Holmberg, 1982; Holmberg and Ranta, 1982; Therien and Ilhan, 1983; Spanjers et al, 1993).
Since the electrons available in a substrate undergoing oxidation all must be transferred to oxygen or incorporated into new biomass, the respiration rate can provide the same information as either substrate conversion or biomass growth (Grady et al., 1989). Also the IAWPRC task group (1986) proposed measurement of growth constants based on respiration rate rather than cell growth or substrate removal. In many studies, respiration rate values were used to obtain kinetic and growth parameters (Cech et al., 1984; Huang et al., 1985; Ekama et al., 1986; Vargas Lopez, 1988; Grady et al., 1989; Tabak et al., 1990; Ossenbruggen et al, 1991; Kappler and Gujer, 1992; Wentzel et al, 1992; Vanrolleghem, 1993).
In early papers the respiration rate was already considered to be a useful control variable
(Brouzes, 1969; Andrews, 1977; Haas, 1979). Subsequently, several control strategies based
on respiration rate were proposed (S^rensen, 1980; Addie, 1981; Stephenson et al., 1983;
Takamatsu, 1981; Allsop, 1990; Hamamoto, 1990).
The actual respiration rate of activated sludge is dependent on the substrate concentration and reflects the loading of the activated sludge plant. It ranges between the endogenous respiration rate (no readily biodegradable matter is present) and the maximum respiration rate (there is an excess of readily biodegradable substrate). The endogenous rate is a measure of the active biomass concentration (Brouzes, 1979; Allsop, 1990). However, endogenous rate has not often been used as such as it also depends on the duration of substrate depletion (Lijklema, 1971). The maximum respiration rate is independent of the substrate concentration. However, since it is the sum of the respiration rates resulting from the oxidation of several components, it is dependent on the substrate composition. For a given substrate composition the maximum respiration rate is also a measure of the active biomass concentration. In the literature, several applications of the maximum respiration rate are reported.

Introduction 95
Takamatsu et al. (1981) used the maximum respiration rate, as measured in batch operation, to estimate the mixed liquor suspended solids (MLSS) concentration and the substrate concentration in activated sludge. These variables were shown to be useful for the control of a treatment plant. The authors first determined the relationship between maximum respiration rate and MLSS concentration, which they assumed to be linear, and the relationship between maximum respiration rate and substrate concentration (expressed as COD). The unknown MLSS concentration and substrate concentration were then estimated on the basis of the respiration rate of an activated sludge sample of the plant. The endogenous respiration rate was not considered in this method. The authors claimed that the maximum respiration rate was measured after adding "some" extra wastewater. However, they did not present experimental evidence showing that saturation with respect to the substrate concentration had been achieved. Further, they did not address the effect of varying wastewater composition on the maximum respiration rate and how often the predetermined relationships had to be determined.
Huang et al. (1985) presented a method which uses the specific maximum respiration rate (maximum respiration rate divided by MLSS concentration), measured in batch operation, for estimating the microbial activity and viability. They stated that the viability determined in this way would represent realistically the activity of bacteria. They found a functional relationship between this specific maximum respiration rate and the mean solids retention time. They also concluded that the specific maximum respiration rate can be used to find the maximum aeration capacity requirement. In order to determine the maximum respiration rate, they added two types of substrate to a batch reactor with activated sludge and measured respiration rate and COD in relation to time. The maximum rate was then derived from these variables, using the Monod function. The method of Huang et al. easily leads to underestimation of the respiration rate because of the delay between sludge sampling and measurement. Furthermore, the endogenous respiration rate was not subtracted from the measured respiration rates, so they overestimated the maximum respiration rate. Because the substrates used were not representative for wastewater, the results cannot be related directly to plant conditions.
Vargas-Lopez (1988) used the method of Huang (1985) to derive the viability and active fraction of biomass from the maximum respiration rate. He developed a mathematical model of the activated sludge process, which considères the active fraction as opposed to the MLSS, and showed that MLSS is not appropriate to represent active biomass when using kinetic constants that truly reflect the observed phenomena in activated sludge. The maximum respiration rate was derived according to the method of Cech et al. (1984), which consists of injecting different doses of substrate into a closed respiration meter filled with activated

96 Maximum respiration rate of activated sludge
sludge and measuring the decline of the dissolved oxygen concentration. For each dose the respiration rate is calculated on the basis of the tangent to the initial DO decrease. The calculated initial substrate concentrations and the corresponding initial respiration rates are evaluated by using the Monod model in order to obtain the maximum respiration rate. A disadvantage of this method is that in determining the tangent the respiration rate is easily underestimated, particularly if a limiting substrate concentration is applied. Because, again, a specific substrate was used, conclusions based on the measured maximum respiration rate may not be valid for activated sludge fed with wastewater.
J^rgensen et al. (1992) related the maximum respiration rate to viable biomass concentration by means of a conversion factor assessed in exponentially growing cultures. This factor (300 mg 0 2 per g dry weight per h) was used for in situ determination of the viable biomass concentration in wastewater and activated sludge. According to their findings the biomass ranges from 67 to 177 mg dry weight per g suspended solids for activated sludge. They concluded that measurement of the maximum respiration rate provides a reliable method for assessing the viable biomass concentration in wastewater and activated sludge. In order to standardize the conditions for measuring the maximum respiration rate, a complex carbon source (mixture of sodium acetate and yeast extract) was added to all samples. Maximum respiration was assumed to occur during the period of exponential growth, and this period was defined as the time interval in which the optical density of the suspension increased linearly. The authors did not present evidence showing that the maximum respiration rate was attained with respect to all substrates in the complex medium.
Temmink et al. 1993 used the maximum respiration rate as an indicator of toxic wastewater
by monitoring the change in maximum respiration rate of activated sludge. For that purpose
a test vessel through which activated sludge was recirculated was continuously fed with
wastewater at a high loading. The critical loading above which the maximum respiration rate
was measured, was determined in preliminary experiments under treatment plant conditions.
Spanjers and Klapwijk (1990) suggested a control strategy for activated sludge plants, utilising the continuous measurement of different types of respiration rate of activated sludge from a completely mixed aeration tank, including endogenous respiration rate and maximum respiration rate. The endogenous rate was defined as the oxygen uptake rate in the absence of readily biodegradable matter. The maximum respiration rate was defined as the oxygen uptake rate in the presence of an excess of readily biodegradable matter. The latter was measured by continuously feeding wastewater into sludge flowing through a respiration chamber, while maintaining a wastewater to sludge ratio of at least 0.03. In their measurements it was observed that the maximum respiration rate was related to the influent

Introduction 97
flow in an unexpected way: at a high flow it decreased and at a low flow it increased. They found that this was not due to changes in MLSS concentration or temperature of the sludge. An explanation of this phenomenon is that at high organic load the nitrification was temporarily inhibited (Stover et al, 1976; Beck, 1982; Stenstrom and Song, 1991). This may be due to oxygen limitation within the activated sludge floes at high respiration rate. No evidence was presented showing that there was an excess of readily biodegradable matter and a constant influent composition during the measurements.
Literature shows that measuring the maximum respiration rate can be useful for monitoring, controlling, assessing toxicity, estimation of active biomass and determination of the needed aeration capacity. However, questions arise from the evaluation of the respiration rate measurements. In particular when the maximum respiration rate was assessed by measuring with an excess of substrate, it is not clear if there was an excess of substrate indeed in all cases. Furthermore, when in experiments of others the Monod-model was used to determine the maximum respiration rate, the endogenous respiration rate was not always accounted for. Finally, the effect of a varying substrate composition on the maximum respiration rate is not clear.
In this research we studied the experimental conditions under which on-line measurement of the maximum respiration rate of sludge from a completely mixed activated sludge tank fed with domestic wastewater from a particular source is possible. It was presumed that the wastewater consists of two biodegradable components. The ultimate objective of the measurements is to obtain a control variable which can be used to determine overloading of the activated sludge plant. Special emphasis was placed on the effect of the influent flow on the maximum respiration rate, observed in earlier research (Spanjers and Klapwijk, 1990). The results of a two weeks measuring period are presented. In this period the maximum respiration rate of sludge in a completely mixed pilot plant fed with domestic wastewater was measured. By means of batch respirometric experiments we checked if the condition for measuring the maximum respiration rate was met.
It will be shown that on-line measurement of the maximum respiration rate is indeed possible, provided that a certain critical loading of the respiration chamber is reached. However, an effect of the influent flow on the maximum respiration rate, as mentioned above, was not found.

98 Maximum respiration rate of activated sludge
5.3 Concept of maximum substrate respiration rate
Biological background
The respiration rate (r) of activated sludge is defined as the oxygen uptake in mass of dissolved oxygen per unit of volume mixed liquor and per unit of time. This variable can be considered to be the sum of the endogenous respiration rate (rend) and the substrate respiration rate (r^:
r - r^ + r. (1)
In this work we define the endogenous respiration rate as the oxygen uptake rate in the absence of readily biodegradable substrate. Contrary to the more biological definition, which states that the endogenous metabolism results from the degradation of endogenous reserves (Pirt, 1965), this definition is operational. The substrate respiration rate, rs, is the oxygen uptake rate due to the oxidation of readily biodegradable substrate. The total amount of oxygen needed for the degradation of all the readily biodegradable substrate is the short-term biochemical oxygen demand (BODst). This BODst is equivalent with the concentration of readily biodegradable substrate.
If we express the substrate concentration (s) in terms of BODst, we can represent the relationship between substrate respiration rate and substrate removal rate as follows:
. * (2) dt
The substrate removal rate is related to the growth of micro-organisms as follows:
* - - £ü (3) dt y
In contrast to the customary use, here y represents the amount of biomass synthesised per mg of oxygen used for the oxidation of readily biodegradable matter. Combining (2) and (3) results in:

Concept of maximum substrate respiration rate 99
r. - £H (4)
Thus the substrate respiration rate is a function of the biomass concentration (x), the biomass yield coefficient (y) and the specific growth rate (/x). The specific growth rate is a function of the substrate concentration. A number of models have been formulated to describe the kinetics of microbial growth. There is general agreement that the growth rate is dependent on s under substrate-limited conditions and practically independent of it under substrate-saturated conditions. To describe the kinetics under both conditions, the model should make a transition between these conditions. In this chapter we consider a combined first-order / zero-order model to substantiate the concept of maximum respiration rate:
if s<sc ( 5 ) Sc
» - Urn« '7 S*S,
Using equation (4) we get:
* *«c (6)
if szsc
i mods
r smax
A (6):
XVm* (7)
Hence, rsmax is dependent on the biomass characteristics represented by /tmax and y, and the biomass concentration. The dependency of micro-organisms on temperature and toxicity is included in /imax. From the above it follows that rs reaches its maximum value, rsmax, if s exceeds the critical concentration. It means that in practice sufficient influent sample should be fed into the sludge. In the following the consequence of multiple substrates for the

100 Maximum respiration rate of activated sludge
measurement of rsmax will be discussed.
Multiple substrates
In the activated sludge process rs is the overall result of the oxidation of multiple substrates by a heterogenous population of micro-organisms. We assume that the individual substrates are independently oxidised (Argaman, 1991). This means that theoretically rsmax can only be measured when all the individual substrates are present in excess. In previous investigations we found that the readily biodegradable part of the wastewater under consideration can be represented by two components. This is illustrated in Figure 1, where two batch respirograms are compared. The first one shows the result of adding a sample of wastewater to nitrifying activated sludge and the second one shows the result of adding a mixture of ammonium chloride and sodium acetate to the same sludge. The initial peak in the latter corresponds with the oxidation of acetate. The figure shows that the main features of the readily biodegradable part of the wastewater are reasonably represented by such a mixture of acetate and ammonium.
80
acetate/ammonium
10 20 30 time (min)
50
Figure 1: Respirograms of wastewater (initial BODst: 14.7 mg T1) and a synthetic medium
consisting of two readily biodegradable compounds (initial concentrations: 3.2 mg NH4-N V1
and 6.0 mg acetate per litre). The MLSS concentration in the measurement with synthetic
medium was lower than with the wastewater.

Concept of maximum substrate respiration rate 101
In the following we assume that the total BODst (s) of the wastewater can be divided into two
components with a BODst of sl and one of s2 so that:
s - s1+s2 W
and
si - fxs A s2 - f2 s (9)
where fx and f2 are fractions of the total BODst. The total substrate respiration rate is the
sum of the individual rates:
(10)
The condition for measuring rsmax of the wastewater is met if both components are present
in excess. It can be shown that rsmax is only attained if s>s c or:
s £ max(scl+s2 , sl+sc2) (11)
Equation (11) implies that sc is governed by the critical BODst of one component and the actual BODst of the other. The values of Sj and s2 depend on fj and f2, on the kinetic characteristics of the components and on the process conditions. (In the next section we will go into details concerning the process conditions.)
Figure 1 suggests that both components represent quite different fractions of the total BODst. This is better illustrated in Figure 2a, where a respirogram is shown which was recorded after equal volumes of wastewater and activated sludge were mixed. The surface under the curve and above the endogenous respiration rate represents the total BODst of the wastewater. The surfaces 1 and 2, representing the two components, constitute fractions of 0.09 and 0.91 respectively of the total BODst of 314 mg l"1.
From the values in the respirogram the remaining BODst in the activated sludge can be calculated (see further eq. 19). This variable is plotted against time for the first component and for the tail-end of the second component (Figure 2b). The figure suggests sc values of about 0.8 and 3.5 mg l"1 for component 1 and 2 respectively. Component 1 seems to follow

102 Maximum respiration rate of activated sludge
more closely a zero order kinetic above sc than component 2. From the slope of the substrate depletion curves (Figure 2b and 2c) the maximum substrate respiration rates of component 1 and 2 were derived: 18 and 23 mg r'h"1 respectively.
ou
~ 70 x:
leo
55 50
resp
iratio
n CO
-6
.
o
O
20
10 C
tV*] -
1
-
)
10
ai 8
£ 6 O * co 2
y
üo 10
rend
, 100
component 1
20 30 Time (min)
2
200 Time (min)
(b) 12
10 8 6 4 2
-
40 50 330
i
300
component 2
340 350 360 Time (min)
(a)
-
-
_
-
-
4C
(c).
370
Figure 2: (a) Respirogram after mixing equal volumes of activated sludge (MLSS=2.8 g V1) and wastewater. Surfaces 1 and 2 represent the two readily biodegradable fractions of the wastewater, (b) BODst in the activated sludge. Only the end part of the oxidation of component 2 is shown.
Using a model of the measuring system, equations (8-10), the assumption that both components follow combined first/zero-order kinetics (eq. (6)) and the parameter values found in Figure 2, the relationship between rs and s can be simulated (Figure 3). Figure 3b demonstrates that the condition for the measurement of rsmax is particulary sensitive to the kinetic parameters of component 1, because this component is found in an inferior fraction of the total BODst. In case of the example discussed here, the lower boundary for equation (11) is set by the value of sc l+s2 .

Concept of maximum substrate respiration rate 103
50
TO E . a> TS i_ c o
40
30
Q. </> CD
CO
13
20
£ 10
CO
(a) comp
f rsmax Sc
/ /
- //
1 2
0.09 0.91 18 23 0.8 3.5
I I I
rs ^ —
rs,2
-
r s , i ^ ^ ^ ^
0 2 4 6 8 10 12 14 16 18 20
CO
14
12
10
8
6
4
-(b) comp
f rsmax s c
" Sc,2
- • ,
/
1 2
0.09 0.91 18 23 0.8 3.5
Sc,1 i
/
/
S 2 /
-
-SI -
/ • • - — , — i — i — i — i — ; — ; ; \
8 10 12 14 16 18 20 s (mg/l)
Figure 3: Simulation of substrate respiration rate as a function of the BODs[ for critical
substrate concentrations found in Figure 2, and for scl equal to sc2.
In reality the kinetic parameters are not exactly known. For the measurement of rsmax it would be favourable, in this particular case (with component 1 as an inferior fraction), if sci< <s c 2 because component 2 would then be expected to govern sc. On the other hand, if scl > > sc2 then the s needed to achieve saturation with respect to component 1 is beyond the span which can be realised. The rate measured will be the rsmax of component 1 plus a

104 Maximum respiration rate of activated sludge
contribution of component 2. If s lc is large enough, this contribution may be negligible, meaning that a reasonable variation in s would not lead to significant changes in the rsmax
measured.
From the foregoing it can be concluded that initial assumptions on the wastewater composition and kinetic coefficients must be critically reevaluated each time a change in the measured rsmax is observed. In the next section we will outline the conditions for the measurement of rsmax at an activated sludge plant and subsequently we will describe the use of batch tests to check the on-line measurement of rsmax.
On-line measurement of rsmax at the plant
The respiration measurements should be done with a continuous flow-through respiration meter. To determine rsmax, the variables rend and rmax have to be measured continuously (eq. 1). The endogenous rate, rend, is measured while activated sludge from a small aerated bypass tank flows through the respiration chamber (Figure 4). The residence time in this tank is long enough to allow all the readily biodegradable matter to be oxidised. rmax is measured while activated sludge from the aeration tank flows through the respiration meter. Meanwhile an excess of readily biodegradable matter is maintained in the respiration chamber; this is achieved by sufficiently loading the respiration chamber with wastewater.
During the measurement of the respiration rate, the mass balance of BODst for component
1 over the respiration chamber is as follows (steady state is assumed):
«,/is»-taw+9«)si-vr*i - ° ( 12 )
In equation (12) the BODst in the sludge from the aeration tank is neglected, because it has
only little bearing on the mass balance. According to equation (6) the substrate respiration
rate (rj is a function of s. Using the condition
r. „ - .„ , if s. zs. (13)
and equation (12), we obtain:

Concept of maximum substrate respiration rate 105
1yJlSw Vrsma,\
a +fl (14)
or:
<?wSw * (<* . + 0**l + Vrsmax,l)j- (15)
For component 2 we can formulate a similar equation. The required loading is governed by only one component. Hence, in a way analogous to equation (11) the condition for the measurement of rsmax can now be formulated as follows:
((la + ^Sc,l+Vrsm,x,l)ji > (tia + lJScl + Vrsmaidj] < 1 6 > qwsw z max
Equation (16) demonstrates that the critical loading of the respiration chamber depends on the individual kinetic parameters (rsmax and sc) and fractions (f) and on process constants (v, qa and qw). Because rsmax is a ftmction of x (eq. 7), the critical loading is also a function of the activated sludge concentration. Using the parameters given in Figure 3 and the process constants of the measuring system, the critical loading may be calculated. However, because of uncertainty about the values of f, sc and rsmax, the critical loading was determined experimentally in this study. Equation (16) was used a posteriori to verify the measurements.
Batch tests
In a batch test a known volume of influent sample, or another solution, is added to activated sludge and the respiration rate is recorded. Contrary to the continuous measurement where substrate is supplied continuously, the substrate concentration will decrease until all the substrate is entirely depleted. Provided that the initial concentration is high enough, the kinetic parameters can be derived from a batch test. The initial concentration expressed in terms of BODst is the total amount of oxygen used for the oxidation of the readily biodegradable matter:
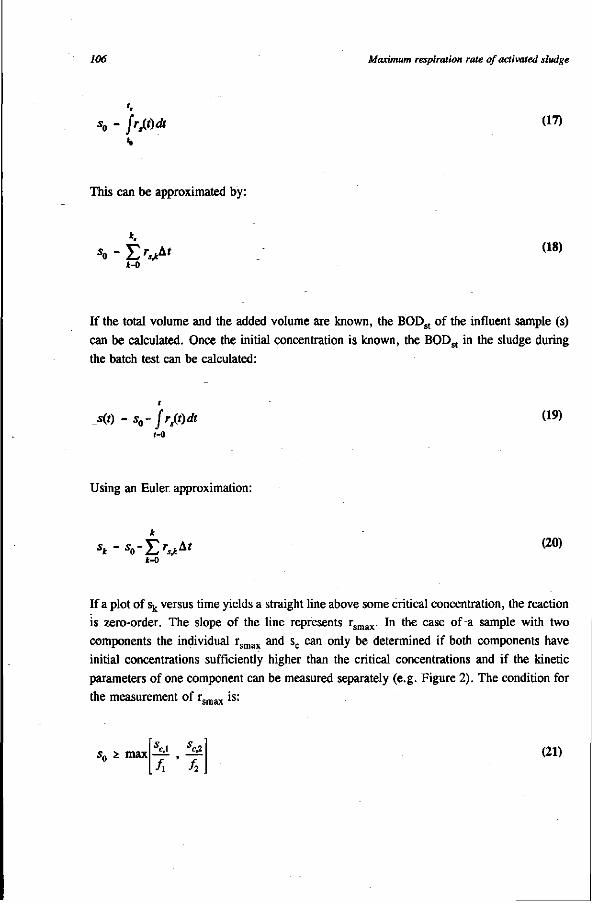
106 Maximum respiration rate of activated sludge
- [rß)dt (17)
This can be approximated by:
Jt-0
(18)
If the total volume and the added volume are known, the BODst of the influent sample (s) can be calculated. Once the initial concentration is known, the BODst in the sludge during the batch test can be calculated:
s(f) - s0- frß)dt (19) f-0
Using an Euler approximation:
Jt-0
(20)
If a plot of sk versus time yields a straight line above some critical concentration, the reaction is zero-order. The slope of the line represents rsmax. In the case of a sample with two components the individual rsmax and sc can only be determined if both components have initial concentrations sufficiently higher than the critical concentrations and if the kinetic parameters of one component can be measured separately (e.g. Figure 2). The condition for the measurement of rsmax is:
c,l
/2
(21)

Materials and methods 107
In practise s0 must be sufficiently greater than the minimum value, because the concentrations of both components decrease immediately after addition. Equation (21) illustrates that if one component occurs in a relatively small fraction, the initial total concentration needs to be relatively high. Provided that the batch test is conducted at an identical temperature and biomass, the total rsmax should be equal to the on-line measured value at the pilot plant.
5.4 Materials and methods
Activated sludge pilot plant
The activated sludge pilot plant (Figure 4) consisted of an unaerated contact tank including four 2 litre compartments in series, a completely mixed aeration tank (0.475 m3) and a cylindric settler (0.159 m3). The air flow to the aeration tank was set to a fixed value (2.4 m3h_1, later 3 m3h"1) using a Brooks mass flow controller (series 245191/1E). The DO concentration in the aeration tank was maintained above 2.5 mg l"1. The pH was maintained at 7.5 using a WTW pH-191 pH meter and a hydroxide dosing pump. The temperature of the sludge was monitored and was found to vary between 15 and 18 °C. Sludge with endogenous respiration was produced in an aerated bypass tank, with a total volume of 24 litre, consisting of five compartments in series through which sludge from the aeration tank was continuously recirculated at a rate of 28.01 h"1). In batch experiments it was checked if this bypass tank produced endogenous sludge indeed.
Respiration measuring system
The respiration meter (prototype of RA1000, Manotherm) consisted of a closed, completely mixed respiration chamber of 0.731 litre through which activated sludge was continuously pumped at a rate of 21.5 1 h"1. The respiration rate was measured with an interval of 1 minute (Spanjers and Klapwijk, 1990).
The measuring system was connected to the pilot plant as shown in Figure 4. To measure alternately rend and rmax, two valves were used to select sludge from the bypass tank and the aeration tank respectively. For the measurement of rmax influent sample was continuously fed into the sludge flowing into the respiration chamber. The influent sample loading required was determined experimentally and verified using equation (16). The measuring period for one type of respiration rate was 15 minutes which is sufficiently long to attain steady state.

108 Maximum respiration rate of activated sludge
sample valve i pump ,—[><-•
respiration chamber
to aeration tank
Figure 4: Scheme of the pilot activated sludge plant.
The respiration rate was calculated as the average of the last three values. The control of
valves and pumps, collection of data and the primary calculations were done by means of a
modular I/O processor (jtiMac 6000, Analog Devices).
Influent
The plant was fed with presettled domestic wastewater. To study the effect of the influent flow on rsmax, the influent flow to the aeration tank was varied according to a square wave pattern as follows: 571 h"1 from 6:00 h to 18:00 h and 161 h"1 from 18:00 h to 24:00 h. The recycle ratio was maintained at one. To exclude the possibility that a change in influent quality would affect rsmax, wastewater with constant quality was used. Constant quality was ensured by taking water from a slowly stirred storage tank of 500 litres. Because of the limited capacity of this tank it could only serve as an influent source from 12:00 h to 24:00 h. The period from 0:00 h to 12:00 h was used to refill the tank with wastewater while the plant was simultaneously fed with the same water.

Materials and methods 109
To check if the wastewater quality remained constant during storage, samples were taken at irregular intervals and analyzed for BODst, COD and ammonium concentration. As these variables did not change significantly during the first 6 hours of the storage period and the shape of the respirogram remained the same, we assumed that this also applied to the second half of the storage period.
To examine the effect of an absence of varying concentration of slowly biodegradable matter on rsmax, we only varied the loading with readily biodegradable matter during two days. Therefore, in addition to a constant wastewater flow of 23 1 h"1 from the storage tank, a varying flow (zero from 18:00 h to 6:00 h and 35 1 h"1 from 6:00 to 18:00 h) of a solution containing 53 mg of ammonium nitrogen and 50 mg of acetate per litre was fed into the plant. During this phase the influent sample for measuring rsmax was taken from the storage tank.
Batch tests
To check the measurements at the pilot plant, batch experiments were performed using sludge from the aeration tank. The sludge (1.5 litres) was transferred to an aerator which was connected with a respiration meter (Manotherm RA1000). The pH was kept constant at 7.5 using a WTW pH 96 meter and a dosing unit for 0.2 M HCl or 0.2 M NaOH. The temperature was maintained at the value of the temperature of the sludge in the pilot plant, averaged over the last six hours, using a Braun Thermomix 1441 / Frigomix 1496 water batru. Wastewater samples or other solutions were added to the sludge when the respiration rate had reached the endogenous level.
Measuring programme
Before the measurements were started, the plant was run 2 weeks to bring about steady state with respect to the endogenous respiration rate and the MLSS concentration.
First, it was determined experimentally what influent sample loading to the respiration chamber was needed to ensure maximum respiration rate under normal operating conditions. For this purpose a stepwise increasing flow of influent sample was applied to the respiration chamber after measuring the endogenous respiration rate. The influent was taken from a reservoir with wastewater. The BODst of this water was determined in a batch test. After each step the respiration rate was measured at steady state. Is was assumed that during this

110 Maximum respiration rate of activated sludge
experiment there would be no significant change in endogenous respiration rate, MLSS concentration and wastewater characteristics. The critical loading was defined as the loading above which no increase in respiration rate would be observed.
During the measuring period of 2 weeks rmax and rend were monitored on-line, while the influent flow to the plant was varied according to a square wave pattern. In addition, the influent was alternately taken from the storage tank and the sewer. During the last three days the flow was varied only by adding a solution of readily biodegradable matter composed of ammonium and acetate.
From time to time, when influent was withdrawn from the storage tank, samples of sludge were taken from the aeration tank and transferred to the batch system to check the on-line measurements. rend, the wastewater BODst, the fractions and the kinetic parameters (rsmax
and sc) of the two components were assessed. For comparison also ammonium and acetate/ammonium mixtures were added now and then.
During the measuring period sludge samples were frequently taken from the aeration tank for MLSS analysis (Dutch standard NEN 3235 4.1). One reason for this analysis was to check if the MLSS concentration remained constant after a change in influent flow rate. At irregular time intervals influent and effluent grab samples were taken for the analysis of COD, Kjeldahl nitrogen, ammonium, nitrite and nitrate (NEN 6472, 6474 and 6440 respectively, adapted by Skalar).
5.5 Results and discussion
Influent sample loading required for maximum respiration
The influent sample loading to the respiration chamber needed to ensure maximum respiration rate under normal operating conditions was determined. For this purpose an increasing influent sample flow was applied to the respiration chamber, after measuring the endogenous respiration rate. Further, the respiration rate was measured at steady state. Figure 5 shows the substrate respiration rate (r^, calculated using equation (1), as a function of the influent sample loading applied.

Results and discussion 111
40
35
30
25
^ 20
^ 15
10
5
comp
f rsmax
s c
1
0.09 14 0.3
2
0.91 19 1.8
critical loading
20 40 60 80 100 120 140 160 180 200 220 qw
sw(m9/h)
Figure 5: Substrate respiration rate as a function of the influent sample loading. Influent
BODst=295 mg V1, MLSS=2.0 g V1. Dotted line: model fit.
The figure also shows a fit of the model based on equations (6) and (12), using values of fjand f2 obtained in the batch test of Figure 2. The kinetic parameters obtained are also listed in the figure. The critical loading found in this way is 160 mg h"1. Because under normal operating conditions the BODst of the wastewater used is higher than 145 mg l"1 in 90% of the cases, the influent sample flow rate (qw) was fixed at 1.1 1 h"1 during the entire measuring period of two weeks.
The experiment described above was repeated several times during another measuring period. It was found that the individual curves did not always show two distinct break points corresponding with the achievement of saturation with one of the components.
Therefore, the statement that the BODst of the wastewater utilised typically can be represented by two components was not always confirmed by these experiments. However, a critical influent sample loading, where rs approached rsmax could be determined in most cases.

112 Maximum respiration rate of activated sludge
Effect of the influent flow on rsmax
During a period of two weeks the maximum respiration rate (rmax) and the endogenous respiration rate (rend) were measured while the influent flow to the plant varied according to a square wave pattern with a period of 24 hours. The objective of these measurements was to investigate the effect of the influent flow on rsmax during the phases with constant influent quality. Figure 6 represents typical results of three consecutive days of measurement. Figure 7 shows a summary of the measurements performed during the phases with influent from the storage tank, rsmax and rend for the whole measuring period. The maximum substrate respiration rate, rsmax, was calculated according to equation (1). Table 1 lists the relevant process conditions.
Table 1: Process conditions of the pilot plant. The influent characteristics refer to the stored
wastewater; the effluent data are from grab samples taken at 15:00 h. Activated sludge
samples for MLSS were taken between 9:00 h and 19:00 h. BODst and O/N (mg of oxygen
needed for the oxidation of 1 mg NH4-N) were determined in batch tests.
day
1
2
3
4
7
8
9
10
11
12
14
BODst
(mg Ï1)
-
1721
89
-
-
217
295
-
309
382
-
COD
(mgl-
306
276
192
285
-
463
474
471
471
590
-
influent
NKj
) (mgN I"1)
57.1
48.1
31.6
42.0
-
88.3
72.9
68.3
63.8
81.0
-
NH4
(mgN l"1)
39.0
32.6
22.1
30.7
-
51.0
75.9
63.4
65.3
-
-
COD
(mgT
53
36
43
42
-
73
68
55
27
34
-
effluent
NH4
') (mgN I"1)
0
0.32
0
1.5
-
2.8
1.5
1.1
1.3
-
-
act.
MLSS
(g l'1)
2.38
2.26
2.23
2.29
2.42
2.39
2.34
2.09
2.3
2.26
2.05
sludge
O/N
-
4.3
3.7
-
-
-
4.4
-
4.4
4.3
-
1 standard deviation (n=5): 5 mg l"1
2 2.43 mgN l"1 at 19h00
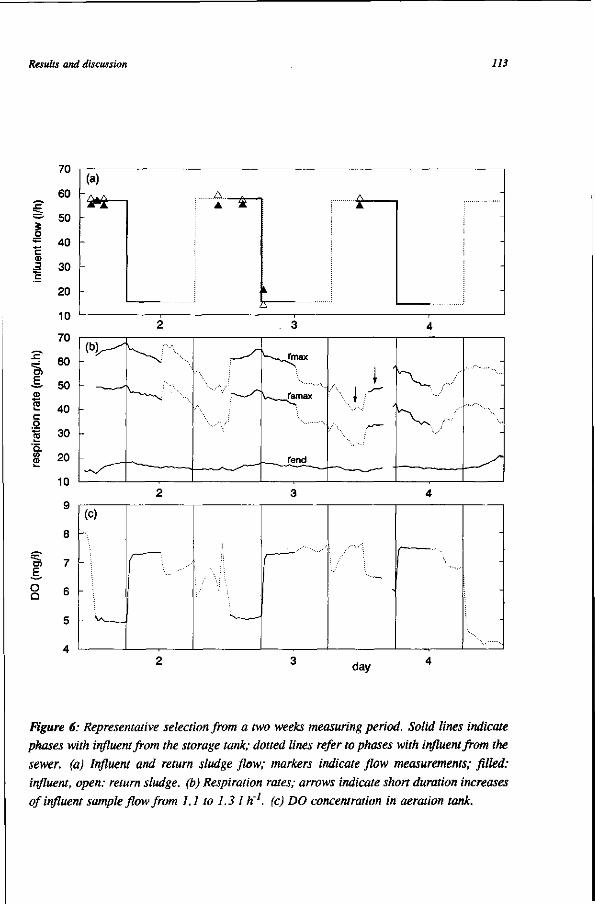
Results and discussion 113
o
c 3
E, CD TO c g fo 'a. CO
at E, O Q
70
60
50
40
30
20
10
70
60
50
40
30
20
10
9
8
7
6
5
4
(C)
(a) A A • *
k
A •
-
( b ^
- ^ _
2 3
^ ^ T m a x
\ , Tsmax
~—^-SHS*
'x I 1 J
-^ >
4
k/
3 day 4
Figure 6: Representative selection from a two weeks measuring period. Solid lines indicate
phases with influent from the storage tank; dotted lines refer to phases with influent from the
sewer, (a) Influent and return sludge flow; markers indicate flow measurements; filled:
influent, open: return sludge, (b) Respiration rates; arrows indicate short duration increases
of influent sample flow from 1.1 to 1.3 I h'1. (c) DO concentration in aeration tank.

114 Maximum respiration rate of activated sludge
12 24h00
Time 12
24h00
Figure 7: (a) rsmax and (b) rend during the phases of wastewater feeding from the storage tank. Day numbers indicated in the figure.
Is was verified that the MLSS concentration in the aeration tank did not change significantly in the period from 8:00 h to 12:00 h (not shown in Table 1). Figures 6b and 7 show that, when the influent flow was abruptly changed from a high value to a low value, there was no

Results and discussion 115
instantaneous change in rsmax. This was expected for a variable being only dependent on wastewater composition and sludge properties. The DO concentration in the aeration tank, which is a function of the actual respiration rate, immediately responded to the change of influent flow (Figure 6c). When the plant was fed with wastewater from the storage tank, rsmax an^ rend (Figure 6b and 7) slightly increased at high influent flow and decreased at low influent flow, whereas the DO concentration remained constant (Figure 6c). The variation of rend was probably due to changes in the concentration of slowly biodegradable matter and in active biomass concentration. When the influent was taken directly from the sewer, both rsmax d DO varied considerably (Figure 6b and 6c).
During the last four days, starting on day 11 at 9:00 h, a high influent flow was applied with a solution of readily biodegradable matter (ammonium and acetate) instead of wastewater, while a small influent flow from the storage tank was maintained. On day 11 rsmax was still measured while introducing influent into the respiration chamber. This strategy would make it possible to reduce a possible effect on rsmax caused by slowly biodegradable matter. Unfortunately during the period of high loading with acetate and ammonium the DO concentration in the respiration chamber dropped below 1.5 mg l"1, being obviously a limiting value for the oxidation process. Therefore, the respiration rate measured during this period could .not be used. Figure 7a shows that after this period, when a low influent flow was applied and when no DO limitation occurred, rsmax did not change significantly.
On the days 12 to 14 rsmax was measured by introducing a solution of ammonium chloride instead of influent sample into the respiration chamber, in order to measure rsmax due to nitrification. Figure 8 shows the respiration rates when no DO limitation occurred.
During both periods of low influent flow rsmax decreased significantly (12 mg l^h"1 in 12 hours) after termination of the acetate/ammonium supply. Although a reliable rsmax could not be monitored during the periods with acetate/ammonium supply, it was obvious that its value increased. From the moment the feeding with a acetate/ammonium mixture was started, rend
gradually decreased from 26 mg Vlh~l on day 11 to a constant value of 17 mg r'h"1 on day 14. This is partly visible in Figure 8.

116 Maximum respiration rate of activated sludge
6 24h00 Time (hour)
12 6h00
Figure 8: Respiration rates during periods with low influent flow after high loading with an acetate/ammonium mixture. rsmax (measured during addition of ammonium) represents the nitrification.
Batch tests
A sample of activated sludge from the aeration tank was transferred to the batch system. After the endogenous respiration was reached, a known volume of wastewater from the storage tank was added and the respiration rate was recorded until the endogenous rate was reached again. Addition was repeated with another sample of wastewater and, in most cases, with an ammonium solution and an acetate/ammonium mixture. The aim of the batch tests was to verify the on-line measured rsmax. For this purpose the following information was derived from the respirograms: rend, wastewater BODst, fractions (f) and kinetic parameters (rsmax and sc) of the two components.
In all the respirograms obtained two components could be detected: one being a minor fraction (component 1), the other (component 2) being a major fraction of the total BODst. This is illustrated for the batch tests on day 12 (Figure 9). Figure 9 also shows respirograms obtained after the addition of ammonium and acetate/ammonium mixture to the same activated sludge. These respirograms will be discussed later in this section.

Results and discussion 117
120 160 Time (min)
200 280
Figure 9: Batch tests on day 12. Respirograms of: wastewater (twice), ammonium chloride
(1 gN V1) and (twice) a mixture of acetate (1.95 g of acetate per litre) and ammonium (1.05
g N V1). Initial volume of activated sludge 1.5 litre. The volume of additions is indicated in
the figure.
The BODst of the wastewater samples is listed in Table 1 and reproduced in Table 2. Since the influent sample flow rate during the continuous measurement was 1.11 h"1, the minimum influent BODst needed to achieve the critical loading of 160 mg h"1, was 145 mg l"1. This condition was not met on day 3 (Table 2).
Using equation (21) and the values 0.09 and 0.8 for ix and sc l respectively (Figure 2), we obtain the minimum initial concentration required for the measurement of rsmax in the batch tests: s0>8.8 mg l"1. According to Table 2 this condition was not met in the batch tests of days 2 and 3. The other tests were used to assess f, rsmax and sc (Table 2).
The fractions were calculated by using equation (18) for the individual components in the respirogram. Due to the low quantity of component 1 in all the additions (cf. Figure 9) together with the limited measuring frequency of the respiration meter, the precision of the calculated fraction was low and fj was probably underestimated. The value of rsmax was derived from the peak height in the respirograms. Although the precision was low for the reason mentioned above, the duplicate values did not differ more than 4%. The value of rsmax 2
w a s derived from the slope of s (eq. 20) as a function of time. An example of this
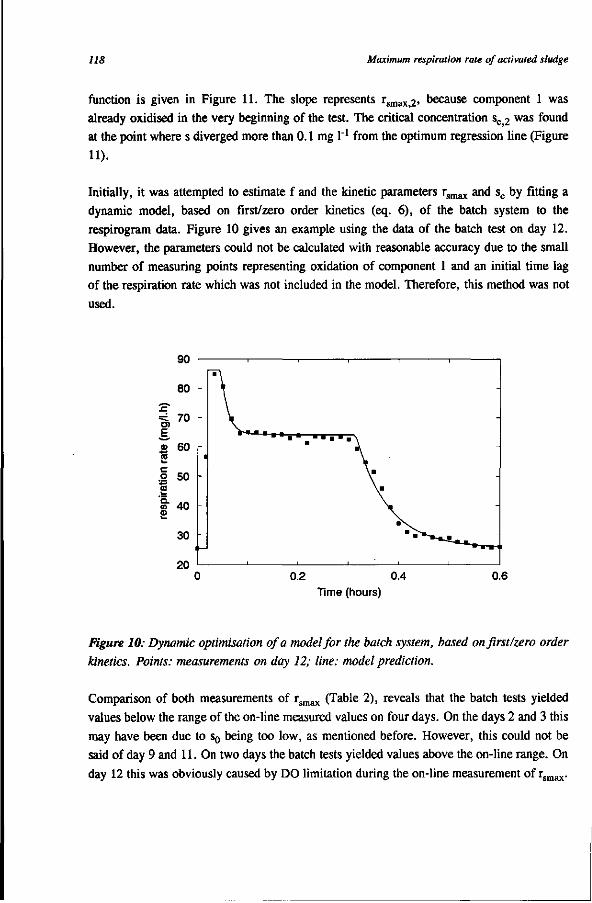
118 Maximum respiration rate of activated sludge
function is given in Figure 11. The slope represents rsmax2> because component 1 was already oxidised in the very beginning of the test. The critical concentration s c 2 was found at the point where s diverged more than 0.1 mg l"1 from the optimum regression line (Figure 11).
Initially, it was attempted to estimate f and the kinetic parameters rsmax and sc by fitting a dynamic model, based on first/zero order kinetics (eq. 6), of the batch system to the respirogram data. Figure 10 gives an example using the data of the batch test on day 12. However, the parameters could not be calculated with reasonable accuracy due to the small number of measuring points representing oxidation of component 1 and an initial time lag of the respiration rate which was not included in the model. Therefore, this method was not used.
0.2 0.4 Time (hours)
Figure 10: Dynamic optimisation of a model for the batch system, based on first/zero order
kinetics. Points: measurements on day 12; line: model prediction.
Comparison of both measurements of rsmax (Table 2), reveals that the batch tests yielded
values below the range of the on-line measured values on four days. On the days 2 and 3 this
may have been due to s0 being too low, as mentioned before. However, this could not be
said of day 9 and 11. On two days the batch tests yielded values above the on-line range. On
day 12 this was obviously caused by DO limitation during the on-line measurement of rsmax.

Results and discussion 119
Table 2: Kinetic parameters and fractions derived from batch experiments. Batch values of rsmax are compared with the ranges of the on-line measured values (constant influent quality).
Only the last column applies to on-line measurements.
day
2
3
82
9
11
12
Sw
(mg r1)
172
89
218
295
309
382
so (mg l1)
6.6
3.4
8.8
11.3
11.9
14.7
(-)
0.06
0.02
0.07
0.06
0.05
0.05
(-)
0.94
0.98
0.93
0.94
0.95
0.95
SC,2
(mg I"1)
1.4
1.1
1.4
2.0
2.1
2.5
smax.l
(mg r'h"1)
10
4
26
22
21
21
smax,2
(mg TV)
28
26
44
34
40
37
r
(mg batch
38
30
70
56
61
58
smax
rV1) on-line1
34-47
31-41
57-60
63-66
63-65
36-393
1 high and low influent flow 2 temperature of batch test 8°C higher than in pilot plant
rsmax u n d e r DO limitation
12 16 Time (min)
Figure 11: BODsl (s) as a function of time in the batch test on day 9. Two additions with
different volumes of wastewater are presented. Addition volume and linear regression lines
are indicated. The slope of the regression line represents rsmax2-

720 Maximum respiration rale of activated sludge
It should be noted that the parameters f and sc are not necessarily constant during on-line measurement. A change in these parameters will influence the critical loading. Table 3 shows values of critical loading, calculated according to equation (16) using the parameters in Table 2, next to the loadings applied. Because fj was probably underestimated in Table 2, the value from Figure 2 (0.09) was used. As expected, component 1 governed the critical loading.
According to Table 3 the calculated critical loading was satisfied on the days 2, 9, 11 and 12. However, rsmax was measured under DO-limitation on day 12. Compared to Figure 5, showing a critical loading of 160 mg h"1, the values in Table 3 are higher. This is due to the higher values of rsmax j during the measuring period.
Table 3: Critical loading (eq. 16) next to loading applied on the basis of the BODst of the
wastewater and qw=l.l IK1.
loading (mg h"1)
day critical applied
2 156 189
3 108 98
8 286 240
9 254 325
11 246 398
12 / 246 420
Figure 9 shows that the oxidation of component 2 and the nitrification result in approximately equal values of rmax and that the composition of the readily biodegradable part of the wastewater was reasonably simulated by the mixture of acetate and ammonium, although there was some evidence showing that this mixture (calculated fractions in BODst equivalents: 0.88 and 0.12) contained a somewhat higher fraction of component 1. To be able to compare rsmax,2 °f wastewater and rsmax of ammonium, we calculated activities by dividing maximum substrate respiration rates by MLSS concentrations (Table 4).
Table 4 shows that, with one exception, component 2 of the wastewater was oxidised with higher activities than ammonium. In a mixture of acetate and ammonium the activity of ammonium oxidation was lower than when pure ammonium was added.
Since rend is essential in the calculation of rsmax and BODst, its meaning was studied in some detail. Most batch respiration measurements were started as quickly as possible after sampling sludge from the aeration tank of the pilot plant. In all cases, also when the influent

Results and discussion 121
BODst was high (e.g. on day 12; see Table 1), the respiration rate was at the endogenous level within 15 minutes after sampling. Since the hydraulic residence time in the bypass tank was 0.9 hours, it was concluded that this time was long enough to obtain sludge with the endogenous respiration rate. Continuing the measurement revealed that rend gradually decreased (e.g. from 25 to 8 mg r'h"1 in 17 hours). However, within the time scale of a BODst measurement, this decrease was negligible (cf. Figure 9).
Table 4: Activities with regard to the oxidation of component 2 and ammonium, measured
in batch tests. Activity (in mg g^h'1) is calculated by dividing maximum substrate respiration
rate by MLSS concentration.
day
2
3
8
9
11
12
1 repetition of measurement with a fresh sludge sample
wastewater component 2
12.2
12.4
19.6
15.8
18.0
17.3
ammonium
11.0(11
12.6
-
13.5
14.7
16.1
•5)1
ammonium/ acetate mixture
-
-
-
-
-
14.6
DO limitation
During a number of measuring periods with high influent flow, rmax was (unintentionally) limited by the DO concentration in the respiration chamber. Therefore, these measurements were not used in examining the effect of influent flow on rmax. Figure 12a gives an example of this DO limitation.
The fact that a peak in DO concentration (Figure 12b), probably due to a change in the effluent quality, corresponds with an increase in respiration rate (Figure 12a) suggests that rmax w a s limited by the DO concentration. Influent supply from the storage tank was started at 12:00 h. At 15:00 h the air flow to the aeration tank was increased in order to raise the DO concentration in the tank and the respiration chamber respectively. This resulted in a higher but still limited rmax. At 18:00 h the influent flow was lowered, resulting in an increase in DO concentration and a rmax non limited by DO.

722 Maximum respiration rate of activated sludge
100
6:00 12:00 18:00 Time (hours)
90
80
E 70
60
50
40
24:00
(c)
-
-
% 0
V ++
<#o®
t -» t
« I A ' "
* 7 Nov o 8 Nov. i 9 Nov x 10 Nov
0 0.2 0.4 0.6 0.8 1 1.2 1.4 1.6 1.8 2
DO (mg/l)
Figure 12: Effect of DO limitation on rmax. (a) rmax during a measuring period with high
influent flow on day 10. (b) DO in respiration chamber during the same period. Arrows:
increase in air flow to aeration tank, (c) rmax as a function of DO concentration during
several periods with high influent flow.

General discussion 123
Figure 12c summarises several measuring periods with DO-limitation. Although the figure represents days with potentially different wastewater and sludge characteristics it shows a strong relationship between rmax and DO for DO concentrations below 1.3 - 1.4 mg l"1. Above this value, rmax seems to be independent of DO concentration.
5.6 General discussion
The purpose of this work was to (1) specify the condition to be met during on-line measurement of the maximum substrate respiration rate (rsmax) of activated sludge from a plant fed with wastewater from a particular source; (2) study the effect of the influent flow on r , and (3) indicate how batch tests can be used to check the on-line measurement of
We assumed that the readily biodegradable part of the wastewater is made up of two components, one of them (component 1) forming a small fraction of the total BODst. This was found to be typical of the wastewater considered. The condition to be met for measuring rsmax is t n a t both components are present in excess in the activated sludge flowing through the respiration chamber. It was demonstrated that this condition for measuring rsmax
particulary depends on the kinetic parameters of component 1, because it was found to form an inferior fraction of the total BODst. Knowing the fractions and kinetic parameters of both components, the required loading of the respiration chamber can be calculated. In reality the fractions and kinetic parameters are not exactly known. It is even possible that one component is completely absent. For example, in another investigation (Chapter 1) carried out with wastewater of the same origin we observed only one component in the respirogram.
In our study of the effect of the influent flow rate on rsmax we determined the critical loading prior to the measurements by increasing the influent sample loading of a wastewater with constant BODst (Figure 5). Next, the influent sample flow was fixed at a value that would ensure the measurement of rsmax under normal operating conditions. The ratio of influent sample flow to sludge flow (qw/qa) was 0.05. In an earlier paper (Spanjers and Klapwijk, 1990) we reported a ratio of 0.03. There are two reasons to believe that this value was too low. First, the possible occurrence of a second component in the form of an inferior fraction was not considered, so that saturation with respect to only one component was achieved. Second, the MLSS concentration was almost twice as high as the one used in the study reported here, resulting in a higher oxidation rate and consequently a lower BODst in the respiration chamber.

124 Maximum respiration rate of activated sludge
During the measurements with influent of constant quality we generally did not observe, on a short term, an effect of the influent flow on rsmax (Figures 6b and 7), as was seen in previous research (Spanjers and Klapwijk, 1990). If any, the effect was opposite: respectively a slight increase and slight decrease during high and low influent flow. Since BODst, MLSS concentration and temperature remained constant during these periods, this effect has to be attributed to changes in active biomass concentration. On a longer term rsmax changed significantly (Figure 6 and Figure 7). During the days 1 to 4, this was probably due to a decreasing concentration of active biomass, caused by the low influent strenght. In some cases rsmax changed instantaneously when the influent source was changed from one source to the other and rsmax varied more when the influent was taken from the sewer. See for instance day 2 (Figure 6). In this particular case it was unlikely that the loading was much lower than in case of wastewater from the storage tank. One explanation of this varying rsmax
is that the fractions of the components vary substantially so that saturation is not always achieved. Because in practise the influent is not of constant quality, the on-line measured rsmax w o u ld De difficult to interpret.
The critical loading determined prior to the measurements (Figure 5) was only valid for the whole measuring period, if the fractions and kinetic parameters remained constant. Because this could not be guaranteed, the correct measurement of rsmax had to be checked in batch tests. The results of the batch test were used in three steps. First, the BODst of the wastewater was determined and it was checked if its value was high enough to achieve the critical loading determined in Figure 5. Second, rsmax was derived from the respirogram. Equation (21) was used to check if the initial BODst in the batch reactor was high enough to measure rsmax. Third, the respirograms were evaluated to determine the fractions and kinetic parameters. These were used the reevaluate the condition for measuring rsmax.
The first verification showed that on day 3 the BODst (Table 2) was not high enough to
achieve the critical loading according to Figure 5, indicating that rsmax was not correctly
measured. This is also suggested by Figures 6b and 7, where rsmax shows varying and
relatively low values.
For the second verification the initial BODst required for deriving rsmax from the respirogram was considered to be high enough on the days 8, 9, 11 and 12 (Table 2). There was, however, a difference between the values of rsmax with regard to on-line and batch measurements. One explanation for this is that the number of points representing the oxidation of component 1 was too small to obtain a reliable value of rsmax from the peak height (cf. Figure 9).

Conclusions 125
In the third verification step the parameters f, sc and rsmax of the individual components had to be derived from the respirograms. However, due to the low accuracy with which the oxidation of component 1 was measured, fand sc j were derived from Figure 5. Using these parameters, the critical loading for each influent sample was calculated according to equation (16). All values, with the exception of that of day 3, were greater than the one obtained from Figure 5 (Table 3). The actual loading applied was greater than the calculated critical loading on the days 9, 11 and 12.
It is concluded that the second and third step of the batch verification tests did not provide consistent results. This can be attributed to the low accuracy in estimating the parameters of component 1. Since deriving BODst and comparing it with the experimentally determined critical loading (step 1) alone will not be sufficient, the parameters have to be determined anyway. The parameters can be determined more accurately in batch tests, if the added volume of wastewater is optimised. This volume may not become too large because of the difficulty in defining the endogenous respiration rate (cf. Figure 2). Additionally, the results of such a batch test can be used to identify a kinetic model for the oxidation of readily biodegradable matter (cf. Figure 10).
Comparative batch studies with addition of wastewater, ammonium and acetate/ammonium mixtures indicated that component 2 of the wastewater is probably nitrogen oxidised by nitrifiers (Figs. 1 and 9, Table 4). This was also found in a previous investigation (Spanjers and Klapwijk, 1990). This implies that rsmax essentially reflects the nitrification rate. There are two ways to evaluate rsmax: 1) the oxidation of both components is considered, 2) only the nitrification is considered. In this work we showed that a relatively high loading of the respiration chamber is required to achieve saturation with regard to component 1. In case the fraction of this component varies considerably and particularly in case it becomes very small, the required influent sample loading will be high. This loading may then be impracticably high because of the dilution of the activated sludge or inhibitory effects. When only the nitrification is of interest, a much smaller influent sample loading will suffice. In that case the rate measured will be the maximum nitrification rate plus a small contribution of component 1.
5.7 Conclusions
It has been shown that rmax can be measured if a sample of wastewater is continuously fed into a flow-through respiration chamber, so that the loading exceeds a certain critical loading. In the situation considered this critical loading particulary depends on the parameters of one

126 Maximum respiration rate of activated sludge
component, which constitutes an inferior fraction of the total BODst.
The effect of the influent flow on rsmax, reported in a previous paper, was not observed in this study. Batch tests proved to be useful to check the on-line measurement but they should be carefully executed.
5.8 Notation
BODst short-term biochemical oxygen demand
DO dissolved oxygen MLSS mixed liquor suspended solids f fraction of the total BODst (-) qa activated sludge flow through respiration chamber (volume time"1) qw influent sample flow through respiration chamber (volume time"1) r respiration rate (mass volume'Uime"1) rend endogenous respiration rate (mass volume^time"1) rmax maximum respiration rate (mass volume'Uime"1) rs substrate respiration rate (mass volume'Hime"1) rsmax maximum substrate respiration rate (mass volume'kime"1) s BODst in respiration chamber (mass volume"1) sc critical BODst (mass volume"1) t time (time) v volume respiration chamber (volume) x biomass concentration (mass volume"1) y yield coefficient (mass mass"1)
H growth rate (time"1)
5.9 References
Andrews J.F. (1977) Specific oxygen utilization rate for control of the activated sludge
process. Prog. Wat. Technol. 8, 451-460. Brouzes P. (1969) Automated activated sludge plants with respiratory metabolism control.
In Advances in Water Pollution Research. 4th Int. Conf. Water Poll. Control Res., Pergamon Press, London, England, 1, 358.
Brouzes P. (1979) Monitoring and controlling activated sludge plants in connection with aeration. Prog. Wat. Technol. 11, (3), 193-200.

References 127
Cech J.S., Chudoba J. and Grau P. (1984) Determination of kinetic constants of activated
sludge microorganisms. Wat. Sei. Technol. 17, 259-272. Duggan J.B. and Cleasby J.L. (1976) Effect of variable loading on oxygen uptake. J. Wat.
Pollut. Control Fed. 48 (3), 540-550. Ekama G. A., Dold P.L. and Marais G.v.R. (1986) Procedures for determining influent COD
fractions and the maximum specific growth rate of heterotrophs in activated sludge systems. Wat. Sei. Technol. 18, (6), 91-114.
Grady C.P.L.Jr., Dang J.S., Harvey D.M., Jobaggy A. and Wang X.-L. (1989) Determination of biodégradation kinetics through use of electrolytic respirometry. Wat.
Sei. Technol. 21, 957-968. Haas C.N. (1979) Oxygen uptake rate as an activated sludge control parameter. J. Wat.
Pollut. Control Fed. 51, 938-943. Henze M., Grady C.P.L.Jr., Gujer W., Marais G.v.R. and Matsuo T. (1986) Activated
sludge model No. 1. IAWPRC Scientific and Technical Reports No. 1.
Holmberg A. (1982) Modelling of the activated sludge process for microprocessor-based state estimation and control. Wat. Res. 16, 1233-1246.
Holmberg A. and Ranta J. (1982) Procedures for parameter and state estimation of microbial growth process models. Automatica 18, 2, 181.
Huang J.Y.C., Cheng M.-D. and Mueller J.T. (1985) Oxygen uptake rates for determining
microbial activity and application. Wat. Res. 19, 373-381. Kappler J. and Gujer W. (1992) Estimation of kinetic parameters of heterotrophic biomass
under aerobic conditions and characterization of wastewater for activated sludge modelling. Wat. Sei. Technol. 25 (6), 125-139.
Lijklema L. (1971) Factors affecting pH change in alkaline wastewater treatment-II. Carbon
dioxide production. Wat. Res. 5, 123-142. Ossenbruggen P., Spanjers H. and Klapwijk A. (1993) Submitted to Water Research. Pirt S.J. (1965) The maintenance energy of bacteria in growing cultures. Proc. R. Soc.
London 163 B, 224-231. S^rensen P.E. (1980) Evaluation of operational benefits to the activated sludge process using
step feed control strategies. Prog. Wat. Tech. 12, 109-125. Spanjers H. and Klapwijk A. (1990a) On-line meter for respiration rate and short-term
biochemical oxygen demand in the control of the activated sludge process. In Advances
in Water Pollution Control, Proc 5th IAWPRC Workshop, 26 July-3 August, Yokohama and Kyoto, Japan.
Spanjers H. and Klapwijk A. (1990b) Dynamiek van het zuurstofverbruik in aktief-
slibsystemen gemeten met de Wazu-respiratiemeter. Report, Department of Environmental Technology, Wageningen Agricultural University, The Netherlands.
Spanjers H., Olsson G. and Klapwijk A. (1993) Determining influent short-term biochemical
128 Maximum respiration rate of activated sludge
oxygen demand by combined respirometry and estimation. Accepted for publication, 6th IAWQ Workshop on Instrumentation, Control and Automation of Water & Wastewater Treatment and Transport Systems. June 17-25, Banff and Hamilton, Canada.
Stover E.L., Weston R.F. and Kincannon D.F. (1976) Effects of COD: NH4-N ratio on a one stage nitrification activated sludge system. Water and Sewage Works 123, 120-123.
Takamatsu T., Shioya S., Yokoyama K., Kurome Y. and Morisaki K. (1981) On-line monitoring and control of biochemical reaction processes. Preprints Vol XXII, 8th IFAC
World Congress, Kyoto, Japan, 146-151. Temmink H., Vanrolleghem P., Klapwijk A. and Verstraete W. (1993) Biological early
warning systems for toxicity based on activated sludge respirometry. Accepted for publication, 6th IAWQ Workshop on Instrumentation, Control and Automation of Water & Wastewater Treatment and Transport Systems. June 17-25, Banff and Hamilton, Canada.
Therien N. and Ilhan F. (1983) Relating BOD5 with on-line oxygen uptake rate measurements using automatic respirometers in view of process monitoring and control. In: Activated Sludge Process Control series. Vol. 3: Procedures and Practices in Activated Sludge Process Control. R.M. Arthur (ed.), Ann Arbor Science, 113-129.
Tur M-Y., Tseng L-L., Chou M-S., Fang H-Y. and Hsia J. (1990) Application of oxygen uptake rate in managing an activated sludge process for treating refinery wastewater. 44th
Purdue Industrial Waste Conference Proceedings, 695-701.
Vanrolleghem P. and Verstraete W. (1993) Simultaneous biokinetic characterization of heterotrophic and nitrifying populations of activated sludge with an on-line respirographic biosensor. Accepted for publication, 6th IAWQ Workshop on Instrumentation, Control and Automation of Water & Wastewater Treatment and Transport Systems. June 17-25, Banff and Hamilton, Canada.
Vargas-Lopez CE. (1988) The relationship between respiration rate and microbial activity and kinetic modelling of the activated sludge extended aeration process. Ph.D. thesis, Department of Civil Engineering, The University of Leeds, England.
Wentzel M.C., Ekama G.A. and Marais G.v.R. (1992) Process and modelling of nitrification and denitrification biological excess phosphorus removal systems - A review. Wat. Sei. Technol. 25, (6), 59-82.
Young J.C. (1981) Specific oxygen demand as an operating parameter for activated sludge processes. Wat. Sei. Technol. 13, 379-403.
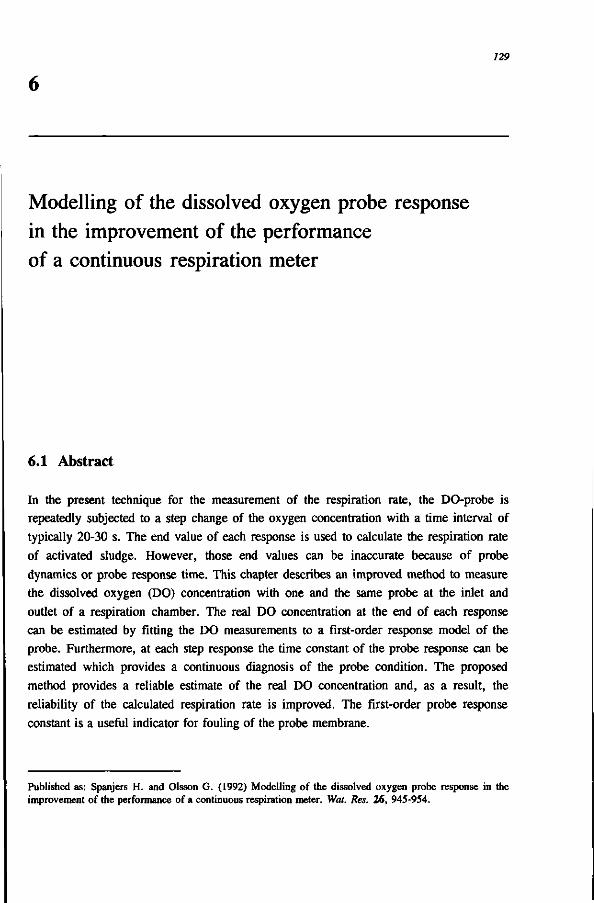
129
Modelling of the dissolved oxygen probe response in the improvement of the performance of a continuous respiration meter
6.1 Abstract
In the present technique for the measurement of the respiration rate, the DO-probe is repeatedly subjected to a step change of the oxygen concentration with a time interval of typically 20-30 s. The end value of each response is used to calculate the respiration rate of activated sludge. However, those end values can be inaccurate because of probe dynamics or probe response time. This chapter describes an improved method to measure the dissolved oxygen (DO) concentration with one and the same probe at the inlet and outlet of a respiration chamber. The real DO concentration at the end of each response can be estimated by fitting the DO measurements to a first-order response model of the probe. Furthermore, at each step response the time constant of the probe response can be estimated which provides a continuous diagnosis of the probe condition. The proposed method provides a reliable estimate of the real DO concentration and, as a result, the reliability of the calculated respiration rate is improved. The first-order probe response constant is a useful indicator for fouling of the probe membrane.
Published as: Spanjers H. and Olsson G. (1992) Modelling of the dissolved oxygen probe response in the improvement of the performance of a continuous respiration meter. Wat. Res. 26, 945-954.

130 Modelling of the dissolved oxygen probe response
6.2 Introduction
The respiration rate of activated sludge is an important variable for the control of the activated sludge process. It provides information as to the loading to the plant (Olsson and Andrews, 1978), the influent and effluent BOD (Spanjers and Klapwijk, 1990), the microbial activity (Vargas Lopez, 1988) and it can indicate toxic effects on the activated sludge (Temmink et al., 1990). In batch experiments respiration rate measurements can be used for studies on biodégradation (Grady et al., 1989), kinetics (Ossenbruggen et al,
1991) and toxicity (Spanjers and Klapwijk, 1986).
Different respiration meters, measuring the uptake of oxygen by the activated sludge, are described in the literature. The manometric respiration meter is based on the measurement of the volume of oxygen gas used by the bacteria (Hisset et al., 1982). Other meters use some oxygen sensing device which measures the oxygen concentration from which the respiration rate can be calculated.
The electrochemical oxygen sensor is based upon the electrochemical reduction of oxygen in an amperometric cell. The electrodes are immersed in an electrolytic solution which is separated from the bulk solution by a semi-permeable membrane. The electrode signal is determined by the diffusion of dissolved oxygen (DO) from the bulk through the membrane. The electrochemical sensor is used in the respiration meter described in this chapter. The probe-meter combination will be referred to as the "DO-probe".
Two types of respiration meters where the DO-probe is used can be distinguished: the batch respiration meter and the continuous flow-through respiration meter. A batch meter is operated by withdrawing a sample of activated sludge from the plant into a small vessel, aerating it and then monitoring the decline in the DO concentration with time. The respiration rate is calculated from the slope of the DO decline (Fujimoto et al., 1981; Kaneko et al., 1985). The continuous flow-through meter measures the DO concentration at the inlet and outlet of a closed respiration chamber through which the sludge is pumped continuously (Sollfrank and Gujer, 1985; Spanjers and Klapwijk, 1990). The respiration rate is calculated from the difference of the two DO measurements.
The respiration meter as described by Spanjers and Klapwijk (1987, 1990) has proven its usefulness and its reliability. The characteristic of this meter is that the DO concentration in the inlet and outlet is measured with one single probe, fixed at one opening of the chamber, by alternating the flow direction through the chamber (Figure 1).

Introduction 131
e measuring DO
aeration tank
chamber
aeration tank
measuring DO
chamber
aeration tank
Figure 1: Scheme of the one-probe continuous respiration meter.
When the DO probe is replaced by another sensor, such as a nitrate or chlorine probe, the measuring technique may also be applied to measure the production or utilization of those compounds. This application will not be considered here.
One problem with this principle is that a steady state DO reading is only available when the DO probe signal, after changing the flow direction, has reached its end value. Hence, the maximum measuring frequency for the DO concentration is limited by the response time of the DO probe. Till now, in practise, the measurement of the DO takes place when the signal has reached about 95% of its ultimate value. The time needed to attain this 95% response (response measuring period) is based on experience. As both the inlet and outlet concentration may be off the real value, a systematic error of about 10% may occur in the calculated respiration rate. Furthermore, a dirty membrane and a consequently slower DO response may result in an even higher error contribution.
A second problem is that at the end of each response measuring period only one concentration is available: either the DO at the inlet or the DO at the outlet. This means that in the calculation of the respiration rate the other DO value has to be estimated. Till now this has been done by means of linear interpolation. This problem will be discussed elsewhere in this thesis. For an accurate measurement of the respiration rate it is important to measure both DO concentrations as frequently as possible and to extract maximum information from the probe response.
A general problem with DO probes is that a probe failure caused by, for example, fouling of the membrane, may be interpreted as a change in the DO concentration. When the probe is applied in a respiration meter, the failure is interpreted as a change in the

132 Modelling of the dissolved oxygen probe response
respiration rate (Temmink, 1992).
In this chapter a first-order probe response model is proposed. Due to a short measurement time the steady state DO concentration has not been reached. Then the final DO concentration can be estimated from the model. Furthermore the first-order probe response time constant will be estimated after each response, which can be used for probe performance diagnosis. The estimation method is based on a least squares fit. Simulations and batch experiments are used to demonstrate the effectiveness of the method.
6.3 Model of the DO-probe response
It is assumed, and experimentally verified, that the DO probe signal can be modelled by a first-order dynamic system and that the real DO concentration during the response measuring period (typically 20-30 s) will change along a linear slope. The response of the DO probe after a change in the flow direction can then be considered as a combined step and ramp response of a first-order system (Figure 2).
c o
c U c o o O O
Time
Figure 2: Combined step and ramp response of the DO probe after changing the direction
of the sludge flow. First-order linear system assumed.

Model of the DO-probe response 133
The DO probe signal y is modelled by a first-order dynamic system:
t& = -y + C (1) c dt
Where the input C is the real DO concentration which is assumed to be a ramp function
with offset a0 and slope a t :
C = a0 + a,r (2)
Combining (1) and (2) gives the response function:
K% = ~y + a° + aS (3)
There is an analytical solution of (3) that can be written in the form:
y(f) = e'"'cy(0) + [e'l'"t)"cu(x)dz (4)
where y(0) = the initial condition of the probe signal at time t=0, u = («o+ajtyt,..
Inserting the value of u gives the DO response as a function of time:
M - [(y(0)-a0 + aifc)e-"'<] + [a0+ <«,*] - [a.fj <*>
It is recognized that the first term of (5) converges to 0 after some time, determined by the probe response time. The last term of (5) is then seen to show the lag between the real DO concentration and the probe response after the transient. Figure 3 shows the result of a simulation using (5) for different realistic values of the parameters. The simulation demonstrates that, when the real DO concentration changes along a linear slope, the

134 Modelling of the dissolved oxygen probe response
ultimate value of the DO signal (y) always deviates ajtc from the real DO concentration (C).
^
E, c o ''S i_
c CO Ü c o o O O
4
3
2
4
3
2
4
3
2
/ ao = 3.7 / a-i = 0.5
/ a 0 = 3.7 ( a , = o
/ a 0 = 3.7 ' a , =-o.5
3
2
3
2
3
2
\ a 0 = 2.0 \ a, = 0.5
\ a 0 = 2.0 \ a , = o
\ a 0 = 2.0 \ (Xi =-0.5
i ~ ~-~—
0.5 1 0
Time (min)
0.5
Figure 3: Simulation, using equation (5), of the measured DO (y) after reversing the
sludge flow direction, i.e. after a step change in the DO (C) followed by a time linear
change of C. Probe response time constant t=0.10 min.
6.4 Estimation of DO concentration and probe response time constant
All three parameters tc, a0 and a1 in equation (3) are unknown and have to be estimated from the DO probe step response. Since the DO measurements are obtained in time discrete form it is straightforward to approximate the time derivative in (3) with finite differences. Here we choose the trapezoidal rule for integration:
^ i - y * ï(_)'w_>i+«o + « i w + B o + «i(*t1)*) (6)

Estimation of DO concentration and probe response time constant 135
where k = 1, 2,...,K; K typically 10 or 15, h = sampling interval DO concentration, typically 1 or 2 s.
The parameter oj can be estimated separately. Here we consider the last DO measurement of two consecutive step responses, called yK(m-l) and y^m). The DO concentration slope is then estimated from:
2Kh (7)
Now there remain two parameters, tc and a0, to be estimated. If equation (6) is applied to all K measurements (but the first) in one step response we obtain:
tc(y2-yi)-hao= ^A(->2->'i+3Aai)
',<y3-yï)-*«o = ^(-y3-y2+5haJ (8)
'cÖ'*-:y*-i)-A«o = {H-y.-y^ßk-Da,)
This can be written in a vector form:
y3-y2 -*
\h(-y2-yl+3hai)
| Ä ( -> '3 -> '2 + 5 A a i )
kH-y.-y^ilk-ma,)
(9)
or written in a more compact form:
4>Ö = y (10)
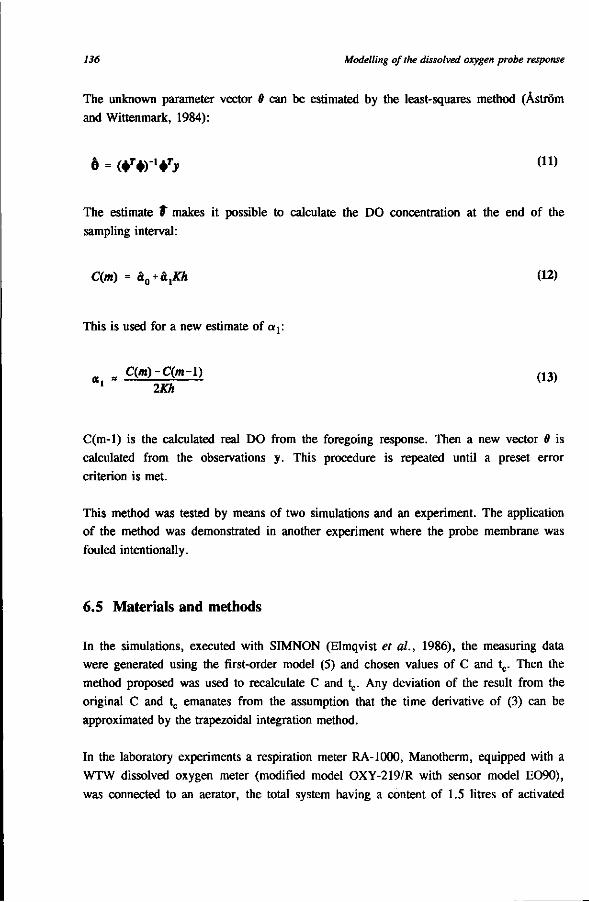
136 Modelling of the dissolved oxygen probe response
The unknown parameter vector 0 can be estimated by the least-squares method (Aström and Wittenmark, 1984):
ô = iV*rlVy (11)
The estimate $ makes it possible to calculate the DO concentration at the end of the
sampling interval:
C(m) = â0 + â,JTA (12)
This is used for a new estimate of a^.
C(/n)-C(/n-l) ( 1 3 )
2Kh
C(m-l) is the calculated real DO from the foregoing response. Then a new vector 0 is calculated from the observations y. This procedure is repeated until a preset error criterion is met.
This method was tested by means of two simulations and an experiment. The application of the method was demonstrated in another experiment where the probe membrane was fouled intentionally.
6.5 Materials and methods
In the simulations, executed with SIMNON (Elmqvist et al., 1986), the measuring data were generated using the first-order model (5) and chosen values of C and tc. Then the method proposed was used to recalculate C and tc. Any deviation of the result from the original C and tc emanates from the assumption that the time derivative of (3) can be approximated by the trapezoidal integration method.
In the laboratory experiments a respiration meter RA-1000, Manotherm, equipped with a
WTW dissolved oxygen meter (modified model OXY-219/R with sensor model EO90),
was connected to an aerator, the total system having a content of 1.5 litres of activated

Materials and methods 137
sludge. The sludge was sampled from a nitrifying activated sludge plant. The respiration meter which works according to the principle described by Spanjers and Klapwijk (1990) was operated in a mode such that the alternating DO signal could be sampled. Temperature and pH were kept constant at 20°C and 7.5, respectively.
In one experiment the assumption of the first-order model was tested. Therefore, a known amount of ammonium was added to the sludge and the DO signal was recorded. The DO concentration at the inlet and at the outlet were either calculated from 2 to 4 values at the end of the response measuring period (averaging method) or calculated according to the method proposed in this chapter (estimation method). From the DO concentrations, the respiration rate and the mass of oxygen used by the nitrifiers for the oxidation of one unit of mass nitrogen (O/N ratio) (Spanjers and Klapwijk, 1990) were calculated, respectively. The O/N ratio was compared for different situations.
In the other experiment the procedure to detect probe failure from an increasing tc was tested. Probe fouling was imitated by covering a part of the probe membrane with ballbearing grease. Ammonium was added to the sludge before and after contamination of the membrane. The effect on t,, and on the O/N ratio was studied.
c o
c CD O c o Ü O O
-
a
a
j
a
a a
i
inlet-DO
D D
a
D
1
a
a D
I
D
u o
u
I
D
D a
t
D a
•
I
D
D
' \
1
a D a
• GL
outlet-DO
i
l flff1"
a D
a a
D S^j
-
1
2 3 4
Time (min)
Figure 4: Simulation, using equation (5), of the measured DO concentration (points)
during the operation of the respiration meter in comparison to inlet and outlet-DO (solid
lines), h = 2 s, tc = 0.08 min, tr = 0.5 min, a0 = 4 and 2 g m'3, a} = 0.4 and 0.5 g ,-3„;„-l m min for, respectively, the inlet and outlet. Standard deviation noise: 0.008 g m ,-3

138 Modelling of the dissolved oxygen probe response
6.6 Verification of the method
Linear change of the real DO concentration (simulation 1)
For given constant values of aly h and tc, and an initial value of aQ, equation (5) was used to simulate the course of the measured DO during a short period of respiration measurement (Figure 4). In this simulation it was assumed that the respiration rate was decreasing linearly. Normally distributed noise was added to the calculated value of the DO.
The simulated DO values were used to estimate tc and C employing equations (7)-(13).
Figure 5 shows the result.
In case of an optimal estimation procedure, the resulting t,, and C would have been the original values. The figure shows that t,. (mean value 0.079 _+ 0.002 min) and C are estimated well.
Non-linear change of the real DO concentration (simulation 2)
A batch experiment with the continuous flow-through respiration meter was simulated to test the assumption that, within the response measuring period, the change of the real DO concentration can be accurately represented by a linear relationship. In this experiment an amount of ammonium was added to the aerator connected to the respiration meter. The simulation model included Michaelis-Menten kinetics and a set of dynamic mass balances on DO and substrate for the aerator and the respiration chamber. The parameters were chosen from a fit of the simulation model on the experimental results of Spanjers and Klapwijk (1990). In this simulation, unlike simulation 1, the change of the simulated DO is not linear any longer. Even so, in the calculation of tc and C, it is assumed to be linear within the response measuring interval.
Figure 6 shows the simulated DO concentration at the inlet and at the outlet of the respir
ation chamber as well as the simulated response of the DO probe.
The simulated DO probe measurement values were used to estimate tc and C with the equations (9)-(13). Figure 7 shows the result.

Verification of the method 139
0.14
0.12
0.10
c I °-
U
~ 0.
0.
0.
(a)
D o D
• upward . o downward
— original i i
i
i
i
o
I
D
I
O
I
-
2 3 4 Time (min)
£. c o Ï3 4 i_ * c CD Ü C
° 3 O Q
outlet-DO • upward o downward
2 3 4 Time (min)
Figure 5: Result of the estimation method applied on the simulated DO probe values
(Figure 4). Calculated values (points) compared with originally simulated values (solid
lines), (a) Probe response time constant (tc) and (b) real DO concentration (C).

140 Modelling of the dissolved oxygen probe response
20 30 Time (min)
Figure 6: Simulation of a batch experiment. Addition of 0.010 g ammonium-nitrogen to
1.5 I sludge. Michaelis-Menten constants: half-saturation constant = 1.5 g ammonium-•3u-l. nitrogen per m , maximum respiration rate = 65 g m h ; probe time constant (tj: 0.1
min; standard deviation noise: 0.01 g 02 m ; response measuring period (tr): 30 s.
As in simulation 1, tc and C are estimated well (Figure 7). tc does not depend on the magnitude of the response. The estimated DO is very close to the originally simulated DO.
From the results of simulations it is concluded that the method proposed here allows the
estimation of the first-order probe response time constant and the real DO concentration.
Experimental verification of the first-order model
To test the assumption of the first-order model, the experiment described and simulated in simulation 2 was carried out in the laboratory. In three experimental runs, the response measuring period (twice 15 s and once 20 s) was too short to attain the steady state response. Therefore this experiment was well suited to demonstrate the capability of the method to estimate the real DO concentration in the inlet and outlet of the respiration chamber. Figure 8 shows the DO-probe signal.
Verification of the method 141
0.14
0.12
0.10
0.08
0.06
0.04
0.02
(a)
"^•^w^WPouiaimJnanupaTTLf^^
o upward o downward
— original
10 20 30
Time (min)
40
20 30
Time (min)
Figure 7: Result of the estimation method for C and tc applied on the simulated DO probe
values (Figure 6). Estimated values (points) compared with the originally simulated values
(solid lines), (a) Probe response time constant (tc) and (b) real DO concentration (C).

142 Modelling of the dissolved oxygen probe response
S 7
^
TO F c o m c 0) o c r> o O O
8
6
4
^
0 (
. (a) illliyUlli
iiil
.
)
Kim. lili., I i , ,iii 1 lm,,,, ..„il
' i l l I l 1 111 Uli 1 Jlfl!llil*Illilll!illllilil'
' 1 11" 'iiinmiHH'
10 20
Time (min)
iillllllll P ' I IIP" | F ' p« r
30
^r-
U)
F c o CO
c CD Ü c o u O Q
.(b)
: d " - -0
o
0
-
= -
**'• a
D
„ a
V,„°
a
a
a •
-
f ° -a
° D
\ , n
o
"
D
• ^
-
0.5 1.0 1.5
Time (min)
Figure 8: DO-probe signal in a batch experiment: addition of 5 mg N as ammonium to activated sludge, (a) Full experiment and (b) first 1.5 min. of the experiment.
0.10
0.08
- - 0.06
I ~° 0.04
0.02
0
(a)
«~o«»^^«^^<»„«~"«w»<>~%*>w>o«°~0»<><<>.",««ow*
„ upward «. downward
10 20
Time (min)
30
(b)
0 upward . downward
10 20
Time (min)
30
Figure 9: tc calculated from the DO-probe measurement, (a) without correction for dead
time and (b) with correction for dead time.
Figure 9a shows the estimated tc for both the upward and the downward response. tc from the upward response is higher than tc from the downward response. Apparently, the model applied is not completely valid for the upward or downward response or both. After careful examination of the shape of the response curves (Figure 8b) in relation to the geometry of the respiration meter (there was a dead space in one flow direction) it was concluded that a dead time (td) had to be incorporated in the model (3):

Verification of the method 143
' e * = -y+ao+a^-o (14)
td depends on the flow direction. In the experiments reported here, the values were found by trial and error to be 2 and 1 s for the measurement of the inlet DO concentration and the outlet DO concentration, respectively. Figure 9b shows that when the dead time is accounted for, both responses produce almost similar tc which also show less variation. As in simulation 2, tc is independent of the response amplitude.
The DO concentrations at the inlet and at the outlet of the respiration chamber were calculated by averaging three measurements at the end of each response (averaging method) and by the method proposed in this chapter (estimation method). Next, the respiration rate was calculated as described by Spanjers and Klapwijk (1990). The result is shown in Figure 10.
E, o> CB
c o
a.
100
80
60
40
20
-
-
-/ \ / '0
j averaging j method
• i i
estimation " " method
\
' \ > ^
-
-
-
-
-
10 20
Time (min)
30 40
Figure 10: Respiration rate calculated from the DO probe signal in Figure 8. Comparison
of the averaging method and the method proposed in this chapter.
The estimation method results in higher values for the respiration rate, especially at a higher rate when the difference between inlet and outlet DO concentration is greater. It is difficult to verify the correctness of the absolute value of the respiration rate. Therefore, from the respiration rate, the total amount of oxygen additionally used to the endogenous oxygen consumption, defined as short-term biochemical oxygen demand (BODst), was

144 Modelling of the dissolved oxygen probe response
evaluated for both results. The BODst was calculated from the area under the respiration curves. This value divided by the amount of nitrogen added represents the mass of oxygen used by the nitrifiers for the oxidation of one unit of mass nitrogen (O/N ratio). Table 1 summarizes the results for the same experiment repeated with different response measuring periods.
Table 1: Comparison of the averaging method (average of three measurements at the end
of the response measuring period) and the estimation method proposed in this chapter for
different response measuring periods (tr). Theoretical value O/N: 4.57; expected value:
4.4 (Spanjers and Klapwijk, 1990).
h
(s)
1
1
2
2
2
-
-
tr
(s)
15
15
20
30
30
30
-
O/N
averaging
method
3.91
3.74
4.29
4.02
4.33
4.36
4.33
estimation
method
4.26
4.01
4.39
4.04
4.38
-
reference
this investigation
this investigation
this investigation
this investigation
this investigation
Spanjers and Klapwijk (1990)
Sharma and Ahlert (1977)
From Table 1 two conclusions can be drawn. Firstly, for a short response measuring period, the averaging method yields lower values for the O/N ratio while the estimation method produces equal values as compared to a large response measuring period. This means that the estimation method produces a better estimate of the real DO concentration. Two experiments yield a low O/N value from the estimation method compared to the value in the literature.
Secondly, the negligible difference between the two methods at a response measuring period of 30 s indicates that the effect of a changing real DO concentration on the probe response is marginal. For, in the determination of the O/N ratio, there is a sharp change of the DO at only two different occasions. Another reason for the small difference is that the shift in the endogenous as well as in the maximum respiration rate reduces the impact on the total amount of oxygen calculated from the area under the curve. Nevertheless, in kinetic experiments, when transients in the respiration rate and thus in DO concentration become important (Ossenbruggen et al., 1991), the effect of the changing real DO will become stronger in the probe response.
Detection of probe fouling using the probe response time constant 145
From the experiments it is concluded that, for incomplete responses, the estimation method produces a better estimate of the real DO concentration and consequently a better result for the calculated respiration rate. Because of the actual geometry of the respiration meter, a correction in the response model for dead time is required.
6.7 Detection of probe fouling using the probe response time constant
In batch experiments is was attempted to detect probe failure from the estimated t,..
Therefore, the probe membrane was contaminated intentionally by covering part of the
membrane with a thin layer of grease (approx. 10 - 25% of the surface).
First it was established that the contact of approximately the same amount of grease with the sludge in the aerator had no impact on either the DO concentration or the respiration rate. This means that the substance is not biodegradable or toxic on a short term and that it should neither provoke a change in the respiration rate when it is applied to the membrane surface.
Two experiments were carried out. In the first experiment an amount of grease was applied twice to the membrane, while the respiration meter was measuring the endogenous respiration rate. In Figure 11a the estimated tc is shown and the applications of grease are indicated. The figure shows that a greater amount of grease results in an increasing tc meaning that the probe becomes slower. Consequently, the DO concentration calculated from the end values of the response measuring period (averaging method) is erroneous and so is the calculated respiration rate (Figure lib). The DO from the estimation method, and therefore the calculated respiration rate are affected to a lesser extent by the deterioration of the probe: after the first treatment the rate decreases from 20 to 15 mg r'h"1; after the second treatment it remains at this level, although the noise has increased. This decrease may partly be caused by another incident, for example the real endogenous respiration rate may have decreased during the time that the membrane was being contaminated. This is supported by the check at the end of the experiment where the membrane was replaced by a new one and the respiration rate was found to be 18 mg Hb;1.
Figure l ie illustrates the effect of the contamination on the individual response curves. In this figure the estimated DO is also indicated.

146 Modelling of the dissolved oxygen probe response
E, c o
c O c o o O Q
'E
0.6
0.5
0.4
0.3
0.2
0.1
0
40
oj 30 E.
? 20 c o
°- 10 -<D
1
(a)
-
i i i —T • i r -•
o upward • downward 0
D J L ° •> D _ n D <»
. • , • o • • » .
t a
. . •
- (b)
(c)
20 40 60 Time (min)
80
estimation method averaging method
/VW~W*
t 20 40
Time (min) 60 80
8.4
8.2
8.0
7.8
7.6
-^^
d
-' b
-
measured fitted estimated
D
Q
».
r?-n 0
? P
à Ubto^ LV«,
6.2
6.0
5.8
- • i - r i
a measured - fitted
— estimated
-
- / D
9 _Ô
Ó
1
b
0
a
b
V
/ D
P 0
P
Û
1
b
9
0
a -
a a
34
Time (min)
35 36
Figure 11: Effect of the contamination of the probe membrane, (a) Probe response time
constant (tc), (b) respiration rate; comparison averaging method and estimation method,
and (c) part of the DO probe signal (points) before and after contamination (respectively
left and right), in comparison with the estimated DO.

Detection of probe fouling using the probe response time constant 147
£" OS
E, <0 CO
c o CO
a. CO
100
80
60
40
20
c 'E
^
estimation method averaging method
0.09
0.08
0.07
0.06
0.05
0.04
20 40 60 80 100 120 Time (min)
(b)
-
Ü upward » downward -
%
t
20 40 60 80 Time (min)
100 120
Figure 12: Addition of 0.005 g N (as ammonium) to 1.5 I of activated sludge, before and
after contamination of the probe membrane, (a) Respiration rate calculated from the DO
concentration. Comparison of the averaging method and the method proposed here, (b)
Probe response time constant (tc). Arrows indicate contaminations.
In the second experiment ammonium was added twice to activated sludge in the endogenous phase of respiration. The first addition is already reported in the previous section (Figure 10 and Table 1). The second addition was done after contamination of the

148 Modelling of the dissolved oxygen probe response
membrane. Figure 12a shows the respiration rate calculated from the DO concentration, whereas tc is plotted in Figure 12b. The O/N ratio was calculated from the respiration rate (Table 2).
Table 2: Effect of the contamination of the probe membrane on the calculated O/N value.
Comparison of the averaging method (averaging three measurements at the end of the
response measuring period) and the estimation method proposed here, h = 1 s, tr = 15 s,
theoretical O/N ratio: 4.57.
O/N
averaging method estimation method
before contamination 3.91 4.26
after contamination 3.04 4.28
From Table 2 it can be concluded that the O/N ratio evaluated from the estimation method is not affected by the probe deterioration while the O/N ratio from the averaging method (already lower because of the short response measuring period, see Table 1) is decreased.
6.8 Discussion
The purpose of this investigation was to improve the measurement of the DO concentration with one and the same probe at the inlet and at the outlet of a respiration chamber. Inherent in the principle of the respiration meter is that the DO probe is repeatedly subjected to step changes in the DO concentration. This fact is employed, for the improvement of the DO measurement, by fitting a first-order response model to each measured response, which provides an estimation of the real DO concentration and of the first-order probe response time constant. The change of the real DO concentration during the response measurement is accounted for in the model.
The simulations show that the method allows the calculation of C and tc. On the condition that the probe signal can be modelled by a first-order dynamic system, a correct estimation of C and tc can be obtained from experimental data. The type of the response is chiefly determined by the manufacturer of the DO meter. However the response is also partly determined by conditions of the respiration meter in which the probe is mounted. The experiments show that, in this case, the assumption of a first-order response is reasonable, provided a dead time is accounted for. This dead time is fixed by the respir-

Notation 149
ation meter and can be determined exactly by measuring the dead space. The experiments
also show that it is reasonable to assume that the change of the real DO concentration
within one response measuring period can be approximated by a linear relationship. This
can be clearly illustrated by looking at an enlarged portion of Figure 8a.
The DO concentration C can be estimated from only a part of the probe response, where the signal has not yet reached its steady state. The advantage of this, in the respiration measurement, is that the measuring frequency of the DOs at the inlet and outlet, and herewith the measuring frequency of the respiration rate, can be increased.
tc indicates malfunction of the probe even in the case of severe deterioration (Figure 11a),
when the probe becomes very slow and the estimation of C probably becomes unreliable.
The method proposed in this chapter, for the estimation of t,. and C, can also be used, in combination with the measuring technique, in the measurement of the DO concentration in an activated sludge reactor. On the condition that the respiration meter is installed close to the reactor, the DO concentration in the inflow of the respiration meter is equal to the concentration in the reactor at the sampling point. Besides the measurement of the DO concentration and the optional measurement of the respiration rate this technique, through the estimated tc, provides a continuous diagnosis of the probe condition.
6.9 Conclusions
The method proposed in this chapter provides a reliable estimate of the real DO concentration from the probe response signal when the probe is subjected, in the respiration measurement, to a repeated, stepwise changing DO concentration. As a result, the reliability of the calculated respiration rate is improved.
The first-order probe response constant, evaluated from the probe signal is a useful indicator for fouling of the probe membrane.
6.10 Notation
C real dissolved oxygen (DO) concentration (mass volume"1) h sampling interval DO concentration (time) K number of measuring points in one response

150 Modelling of the dissolved oxygen probe response
t time (time)
tc first-order probe response time constant (time) td dead time (time) tr response measuring period (time) y DO probe signal (mass volume"1) a0 offset of real DO concentration at start of response (mass volume"1) aj slope of real DO concentration change during one response (mass volume"1 time"1) r integration variable (time)
6.11 References
Elmqvist H., Aström K.J., Schönthal T. and Wittenmark B. (1986) Simnon, User's Guide
for MS-DOS Computers. SSPA Systems, Sweden. Fujimoto E., Iwahori K. and Sato N. (1981) Automatic measurement device of the respir
ation rate and experimental investigation on the constant DO control by using the
device for the activated sludge process. Wat. Sei. Technol. 13, 193-198. Grady C.P.L., Dang J.S., Harvey D.M., Jobbagy A. and Wang X.-L. (1989)
Determination of biodégradation kinetics through use of electrolytic respirometry. Wat.
Sei. Technol. 21, 957-968. Hissett R.E., Deans E.A. and Evans M.R. (1982) Oxygen consumption during batch
aeration of piggery slurry at temperatures between 5 and 50°C. Agricult. Wastes 4, 477-487.
Kaneko M., Kawachi K. and Matsumoto A. (1985) Evaluation of oxygen uptake rate
analyzer in wastewater treatment plants. In Proc. 4th IAWPRC Workshop on
Instrumentation and Control of Water and Wastewater Treatment and Transport
Systems, 27 April - 4 May, Houston and Denver, U.S.A., pp. 521-524. Olsson G. and Andrews J.F. (1978) The dissolved oxygen profile - a valuable tool for
control of the activated sludge process. Wat. Res. 12, 985-1004. Ossenbruggen P., Spanjers H., Aspegren H. and Klapwijk A. (1991) Designing
experiments for model identification of the nitrification process. Wat. Sei. Technol. 24, 9-16.
Sharma B. and Ahlert R.C. (1977) Nitrification and nitrogen removal. Wat. Res. 11, 897-
925. Sollfrank U. and Gujer W. (1985) Kontinuierliche Messung der Respiration im
Belebungsverfahren. GWF-Wass./Abwass. 8, 397-405. Spanjers H. and Klapwijk A. (1990) On-line meter for respiration rate and short-term
biochemical oxygen demand in the control of the activated sludge process. In Advances

References 151
in Water Pollution Control, Proc. 5th IAWPRC Workshop, 26 July - 3 August, Yokohama and Kyoto, Japan.
Spanjers H. and Klapwijk A. (1987) Measurement of the toxicity of KCN and some organic compounds for the activated sludge using the Wazu-respiration meter. In Management of Hazardous and Toxic Wastes in the Process Industries (Edited by
Kolaczkowski S.T. and Crittenden B.O.). Elsevier, Amsterdam. Spanjers H. and Klapwijk A. (1987) The Wazu-respiration meter. A breakthrough in
automation and control for a wastewater treatment plant. In 10th Symposium on
Wastewater Treatment, November 1987, Montreal, Québec, Canada. Temmink H. (1992) Department of Environmental Technology, Wageningen Agricultural
University, The Netherlands. Personal communication. Temmink H., Spanjers H. and Klapwijk A. (1990) Toepassing van een kontinue
respiratiemeter bij toxiciteitstestenvoor actiefslib. H20 23, 538-545. Vargas Lopez C.E. (1988) The relationship between respiration rate and microbial
activity and kinetic modelling of the activated sludge extended aeration process. Ph.D. thesis, Department of Civil Engineering, The University of Leeds, England.
Äström K.J. and Wittenmark B. (1984) Computer Controlled Systems, Theory and
Design. Prentice-Hall, New York.

153
Assessment of a two-step nitrification model for activated sludge
7.1 Abstract
The objective of developing empirical models with well determined parameters is to obtain a better understanding of the nitrification of activated sludge. The D-optimal experimental design criterion and nonlinear regression analysis were used to obtain precise parameter estimates. Our experiment consisted of a series of 14 batch runs where activated sludge was spiked with ammonium chloride and sodium nitrite individually and in combination. Specific respiration rate, the ratio of respiration rate to mixed liquor suspended solids concentration, was used as the model response variable. Empirical models for specific respiration rate were specified as piece-wise, Monod type functions of ammonium and nitrite concentration. Statistical methods were used to evaluate the effects of non-linearity and parameter correlation on the models. The effect of experimental design on model specification and on parameter estimation is discussed.
Submitted for publication by: Ossenbruggen P.J., Spanjers H. and Klapwijk A.

154 Assessment of a two-step nitrification model
7.2 Introduction
Nitrification is a two-step reaction, by which ammonium is oxidized to nitrite and then the nitrite is oxidized to nitrate. The two oxidation reactions occur rapidly, both on a time scale of minutes. However, the two rates can be different. Therefore, concentrations of the two substrates are observed simultaneously. For simplicity, the process is often described with a one-step model with ammonium concentration used as a predictor variable (Lijklema, 1973; Henze et al., 1987). The objective of this study was to develop empirical models assuming the process to be a two-step reaction, thereby obtaining a more fundamental understanding of the process involving both substrates of ammonium and nitrite.
Empirical evidence and theory suggests that a model depicting the process as a two-step reaction is reasonable (Quinlan, 1980; Beck, 1981; Ossenbruggen et al., 1991). The respiration rate resulting from ammonium and nitrite oxidation was hypothesized to be the sum of two Monod or Michaelis-Menten type functions,
+ a3s2 (1)
where y = specific respiration rate (mg 0 2 g_1MLSS h"1), rs divided by the mixed
liquor suspended solids concentration (g l"1); rs = r " rend = respiration rate (mg 02l"
1h"1); r = measured respiration rate (mg 02l"
1h"1); rend = endogenous respiration rate (mg 02l"
1h"1); Sj = ammonium (NH4
+) concentration (mg N l"1); s2 = nitrite (N02") concentration (mg l"1); a1( a3 = maximum specific respiration rates (mg 02g
_1MLSS h"1); a2, a4 = half saturation constants for Sj and s2 (mg N l"1).
The precision with which the parameters of a Monod or Michaelis-Menten function for a one-step model are known to depend upon the experimental design and the method of calibration (Curie, 1982). With simulation studies, it has been reported that, generally, the parameters of maximum specific respiration rate and half saturation constants can not be precisely estimated from experiments with noisy measurements (Holmberg, 1982). Statistics can help us to discover if a hypothesized model is adequate. Berthouex (1993) shows the need for proper experimental design, nonlinear regression and inference methods for nonlinear model building. Failing to use these methods can lead to misleading conclusions.

Introduction 155
For example, he shows that the transformation of nonlinear models so that they can be fitted by linear regression (the Lineweaver-Burke plot and Thomas slope methods for fitting the Michaelis-Menten function) will give biased parameter estimates and that a few carefully selected data points are better than large amounts of data, as collected and recorded at treatment plants.
Our study required that models with two substrates be specified and evaluated. An experiment has been designed to test the hypothesis as given by model (1) and other steady state model forms. In a batch system using a continuous respiration meter (Spanjers and Klapwijk, 1990), the respiration rate of activated sludge and substrate concentrations were measured simultaneously. While a continuous run experiment may be desirable for calibration of a steady state model, it is laborious. The batch test method to obtain measurements has been successfully used for steady state model development (Cech et al., 1984). It will be shown that the use of batch test data, where observations were taken in time intervals of minutes, satisfies the conditions for good experimental design. Nonlinear regression and statistical analyses were used for model calibration and assessment. These procedures give assurances that a model is correctly specified and that its parameters are well determined.
Parameter correlation and model non-linearity, which were suspected of affecting the model specification, calibration and assessment procedures, were given special attention in this study. The following steps were used:
1. conducting a series of 14 experimental runs at five different initial concentrations of Sj
and s2;
2. calibrating a model with a data set formed by combining the data from the 14
experimental runs; 3. assessing a model by: (i) evaluating the adequacy of the model form using residual plots
with the combined data set, (ii) determining the significance of model parameter estimates through statistical inference, and (iii) evaluating the goodness of fit of the model by using time series plots with data from each individual experimental run.
Steps 2 and 3 dealt primarily with issues related to model specification and parameter precision. If a model failed one or more of the tests of step 3, the model was rejected and a new model was specified, calibrated and assessed. This procedure will be described and discussed in this chapter.

156 Assessment of a two-step nitrification model
7.3 Materials and methods
Nitrifying sludge was grown in a sequencing batch reactor fed with domestic sewage. The pH and temperature were fixed at 7.5 and 20°C, respectively. The average loading was 0.17 g COD per g MLSS per day. The dissolved oxygen concentration was maintained above 2.5 mg l"1 to ensure that the nitrifiers were not oxygen limited. The aeration intensity was kept as low as possible to prevent mechanical breakage of the sludge floes, but it was high enough to ensure an aerobic condition and complete mixing of the liquor.
During the experiment and a week prior to the experiment, the sequencing batch reactor was run with an aim toward maintaining constant MLSS, temperature and pH. However, after each influent loading the temperature dropped to 15-16°C. It took 70 to 90 minutes to warm the mixture to 20°C with a heater. While the MLSS and MLVSS concentrations were assumed constant during individual experimental runs, the MLSS and MLVSS concentrations between experimental runs ranged between 2.3 and 3.5 g l"1 and 79.2 and 83.0 percent, respectively (see Table 1).
Two litres of sludge were transferred to the aerator of the measuring system and the respiration rate was recorded (RA-1000 Manotherm). When the respiration rate reached the endogenous level, a predetermined amount of ammonium chloride - sodium nitrite mixture was added. The respiration rate was recorded until the endogenous rate was reached again. During the measurements, filtered samples (Whatman glass microfibre 1 /*m) were withdrawn from the aerator at 1 to 5 minute time intervals for analysis (Skalar autoanalyzer) for concentrations of ammonium (sj) nitrite (S2) and nitrate. The sample volume was small compared to the total volume; therefore, it was assumed that the amount of nitrogen withdrawn was negligible. A maximum of three individual experimental runs were made with the same sludge sample. A fresh sludge sample from the sequencing batch reactor was used for additional experimental runs. Each sludge sample was analyzed for MLSS concentration and mixed liquor volatile suspended solids (MLVSS) concentration.
7.4 Nonlinear regression analysis
The nitrification model is of the form y = f (a, X) + £ where y is a response, X is a matrix of predictor variables, a is a vector of model parameters, and e is the error. The error is assumed to have a normal distribution with zero mean E(£) = 0 and variance V(e) = o2. For model (1) for example, a = [aj a2 a3 a4]
T.

The data set 157
The model parameters were estimated with observations of y, Sj and s2 where the response vector and predictor variable matrix were designated as y = [y:] and X = [Sj s2] = [s^ s2:] for observations numbered j = 1,2, ..., n, respectively. A vector of elapsed times t = [t] was also recorded. The elapsed time t corresponds to the time of observation of y-., Sy and s2: where t > 0 and t = 0, the time when an individual batch run was initiated. The same subscript index j and sample size n notation was used to identify individual observations and sample size for an individual sample run and for the entire and sorted portions of the combined data set (modelling step 2).
Nonlinear regression analysis employing a Gauss-Newton method was used to find the set
of parameter estimates of a, denoted as â, that minimizes the sum of the least square error,
sfA - E[y,-M*;)]2
/-I
Since the error vector E is assumed to have a spherically normal distribution or E=N(0,tr2I), the least square estimate of a is also the maximum likelihood estimate of a. All observations used in the regression analysis are assumed to be equally reliable; therefore, all observations are given equal weight in calculating â.
7.5 The data set
In order to obtain a model with correct specification and well determined parameters, a series
of 14 experimental runs were conducted (modelling step 1) and then combined into a single
data set of y and X for the purpose of model calibration (modelling step 2). The reason for
combining experimental runs at different initial concentrations of sl and s2 was based upon
proven practices for calibrating models. In this section, nitrification is described with the aid
of scatter plots of individual experimental runs and the combined data set. These plots offer
empirical evidence for describing nitrification as a two-step reaction and for specifying model
(1).
Individual experimental runs
Each individual experimental run was distinguished by the initial concentration s0 = (s10, s20) where s10 is the initial concentration of ammonium chloride and s20 is the initial

158 Assessment of a two-step nitrification model
concentration of sodium nitrite. Fourteen experimental runs with five different initial
concentrations were conducted: SQ = (6.5, 6.1), (6.5, 3.1), (6.5, 0.0), (0.0, 6.2), (0.0, 3.1).
With the exception of (0.0, 3.1), each experiment was repeated under the same conditions
at least twice. In order to better understand the nitrite to nitrate oxidation process, the last
four experimental runs shown in Table 1 were conducted in the absence of ammonium,
s0=(0» s20) with s20>0.
Table 1: Experimental variables
Run
1
2
3
4
5
6
7
8
9
10
11
12
13
14
Initial concentration
s0 = (s10' s2o)
mgl"1
(6.5, 6.1)
(6.5,6.1)
(6.5, 6.1)
(6.5, 3.1)
(6.5, 3.1)
(6.5, 3.1)
(6.6, 0.0)
(6.6, 0.0)
(6.6, 0.0)
(6.6, 0.0)
(0.0, 6.2)
(0.0, 6.2)
(0.0, 6.2)
(0.0,3.1)
MLSS
gl"1
2.32
2.32
3.21
2.67
2.55
3.34
3.46
3.46
3.26
3.26
2.55
2.37
3.34
3.49
Biomass concentration
MLVSS
% of MLSS
79.2
83.0
82.0
82.0
82.2
81.1
81.6
81.6
81.1
81.1
81.2
81.9
81.1
-
rend
mg l 'V 1
16.56
16.69
23.46
18.46
20.05
24.80
24.30
22.06
25.37
21.85
16.37
14.53
21.95
25.18
Maximum y
Step 1
Sj > 0 and
s2>0
mg g_1h_1
18.56
13.04
15.34
22.23
18.35
19.92
21.51
18.84
18.44
17.93
-
-
-
-
Step 2
Si=0 and s2>0
mg g^h"1
5.05
3.48
3.94
3.89
4.02
4.31
1.42
3.19
11.87
3.17
4.12
4.07
3.77
3.91
The time series plot of Figure 1 shows the observations of r, sl and s2 and the calculated values of specific respiration rate y for experimental run 4 (Table 1) with initial concentration s0 = (6.5, 3.1). It shows the ammonium concentration Sj to steadily decrease from s10 = 6.5 to zero and nitrite concentration s2 to increase from s20 = 3.1 to a maximum value and

The data set 159
then decrease to zero. This pattern was observed for all experimental runs with initial concentrations of s10 > 0 and s20 > 0. For all experimental runs with initial concentrations of s10 = 0 and s20 > 0, the values of s2 were observed to steadily decrease from S20 to zero. The plots show nitrification as being distinguishable by: (stage 1) both ammonium and nitrite being oxidized; and then (stage 2) nitrite being oxidized only because ammonium has decayed to zero. During stage 1 or when s1 > 0 and s2 > 0, time series plots suggested that ammonium limits the specific respiration rate and nitrite tends to reduce this rate as its concentration increased.
o
80
70 •
60
W> 50
E
40
30
20
10
1
:
; 1
rend
;
/ * V . Stage 1:
\ \ \ V1
Stage 2:
rend
4 en E
20 40 60
time (min)
Figure 1: Observations for experimental run 4. Stage 1: Sj>0 and s2 > 0; stage 2: Sj=0and
s2>0
The combined data set
Scatter plots of y versus Sj and y versus s2 for the combined data set (Figure 2) show some consistency among experimental runs having the same initial concentrations SQ. The plots show also that there is relatively little variability in specific respiration rate within an individual experimental run but significant variation in specific respiration rate among runs.

160 Assessment of a two-step nitrification model
The transition from stage 1 to 2 seems to occur at a specific respiration rate of about y=4, as indicated in Figure 2b. The scatter plot of y and sl indicates that the ammonium concentration limits the specific respiration rate. The scatter plot of y and S2 is not as clear in indicating the role of nitrite during stage 1. The scatter plots of y and S2 for stage 2 and those for experimental runs 11 through 14 (not shown) exhibit a similar consistency. It indicates that nitrite s2 limits the specific respiration rate. This empirical evidence suggests that model specification (1), where both Sj and s2 are rate limiting, is a reasonable choice.
-S? e.
o
1 ü
IC 'I
B , <u 2 c o
o
1
ammonium concentration (mg/1)
nitrite concentration (mg/1)
Figure 2: Scatter plots for specific respiration rate for the combined data set excluding
experimental runs 11-14. (a) s} versus y and (b) s2 versus y.

The experimental design 161
7.6 The experimental design
An important and primary objective for designing an experiment is to choose values of the X matrix that will lead to good parameters with small variances V(aJ (modelling step 2). The main diagonal members of covariance matrix,
V(a) - a2(VTV)x
where
àf(.a,X) bfi.a,X) bfi.a,X) àa. ba~ ôû
l J. m
contain the parameter variance V(a_) terms and the off diagonal members contain the parameter covariance COV(£L, a ) terms. The correlation coefficient p , a measure of the linear dependency between parameters i , and a , is calculated as
Ppq " \V(n \ V(n W* [n^P V{aq)f
If the values of X are selected to maximize the determinant D = maximize | VT V | , then the values of ppq are minimized. Since ppp = V(ap) is the parameter variance, both the parameter variances and correlations are minimized. This is called the D-optimality criterion (Box et al., 1978; Cailas and Gehr, 1989). If the vectors of V are orthogonal, then the parameter estimates will not be correlated and changes in y will be associated with the appropriate changes in the causal factors of X (Bates and Watts, 1988). In other words, the suspected difficulties associated with parameter correlation are eliminated when p =0 and
Applying the D-optimality criterion to a one-step model for Sj, y = a ^ j / ^+S j ) with V = [s1/(a2+s1) - a1s1/(a2+s1
2)] indicates that one-half the values of X = Sj, where Sj = [sy] with j = 1,2, ..., n and n is the total number of observations, should be chosen such that the ammonium concentration is equal to a2 and the other half of these values should be very large ammonium concentrations, theoretically approaching infinity. In practice, it is sufficient for the vector X to be long. The square root of the product XTX is a measure of distance;

162 Assessment of a two-step nitrification model
therefore, a long vector of X is defined to be one that contains observations over a wide range of Sj values. A good design for a one-step model of s2, y = a3s2/(a4 + s2), is similar. The vector of X = s2 should be long and X should include observations of % near a4.
For model (1), which has a predictor matrix X = [sj s2], both Sj and s2 should be long vectors. By combining the 14 experimental runs with five different initial concentrations of s0 into one data set, the D-optimality criterion is satisfied. Figure 3 shows the observations of Sj and s2 are both long, with Si ranging from 0 to 6.5 mg l"1, and s2 ranging from 0 to 7.0 mg l"1.
|5
o o
(6.5, 6.1)
(6.5,3.1)
(6.5, 0.0)
0 2 4 6
ammonium concentration (mg/1)
Figure 3: The combined data set excluding runs 11-14.
Owing to non-linearity of the Monod type models being considered, parameter correlation ß can be minimized but not eliminated by the use of the X = [s1 s2] values described in the preceding paragraphs. That is, the condition ppq=0 is not possible for the one- and two-step models considered in this study. However, the design assures that the values of V(ap) and p will be minimized; therefore, precise parameter estimates are expected.
The experimental design 163
Parameter correlation
While the parameter correlation coefficient ppq can be a useful statistical variable, it can also be misleading when used exclusively for assessing a nonlinear model. The joint confidence region is preferred because both its orientation and shape are important in showing the dependency between parameter estimates as well as the relative precision of the parameters (Draper and Smith, 1981; Berthouex, 1993). A simple example will be used to illustrate the importance of using joint confidence region for model assessment and to demonstrate the importance of using data that satisfies the D-optimality condition.
Suppose nonlinear regression analysis is used to estimate the parameters aj and a2 of a nonlinear model y=f(a, x). The least square estimates of aj and a2 of the model is shown as point A and its (1-a) joint confidence region is shown as an elliptical contour in Figure 4a. There is a chance or probability of (1-a), for example, 95% or 95 successes in 100 trials, that the true model parameters of aj and a2 are enclosed within this region. The parameters are assumed to be correlated, thus p12;*0. The extent of the dependency between parameters is reflected in the orientation angle 4> of the elliptical contour. The dependency between aj and a2 can be determined as a function of the angle 4>- Since the shape of the joint confidence region is long and narrow, there is a relative lack of precision associated with the value of âjcos0+â2siri</), a measurement parallel to major axis of the ellipse. In contrast, the value of -â1sin^>+â2cos0, a measurement perpendicular to the major axis of the ellipse, is well determined. Since the parameters are correlated, it is difficult to determine how well each individual parameter estimate is determined. As a result, the evaluation should consider parameter dependency as done here with the joint confidence region.
If the parameters were not correlated, then 0 = 0 . Using Figure 4a, imagine that the ellipse is rotated clockwise so that the major axis is parallel to the &x axis. Under this condition, the estimates of aj and â2 can be evaluated individually. In this case, estimate aj is found to be poorly determined and â2 is found to be well determined.
When a strong parameter correlation exists, the use of the joint confidence region is preferable to the marginal confidence intervals for aj and a2 because the joint confidence region accounts for parameter correlation. The parameter estimate, shown as point B in Figure 4a, is considered acceptable at the (1-a) confidence level because the point lies within the intersection of the marginal confidence intervals of both aj and a2. Since this evaluation did not consider parameter correlation, the marginal confidence intervals are of questionable value because point B lies outside the boundary of the joint confidence region and model is considered inadequate and rejected.

164 Assessment of a two-step nitrification model
a2 (a)
/ T l
major axis
a2 (b)
Figure 4: (1-a) joint confidence region (shaded region) and the marginal confidence interval
(dashed lines) for parameters a1 and a2for model y=f(x). (a) Experimental design that led
to strong parameter correlation, (b) Experimental design that led to weak parameter
correlation.
Suppose a second data set is obtained which satisfies the D-optimality criterion and which contains the same number of observations as the first data set. The vector X = [xj for the second data set is assumed to be longer than the first data set and it is assumed to contain observations in the vicinity of a2. Since steps have been taken to minimize V(aj) and V(a2), the joint confidence region for data set two of Figure 4b will be smaller and more circular in shape than the one shown in Figure 4a. The angle <j> is assumed to be the same in both figures; thereby, the parameter correlations for the two data sets are assumed to be the same. This assumption is conservative because the D-optimality criterion gives evidence that pl2
will be minimized also. By visual inspection of the two (1-a) joint confidence regions, it shows that the parameter estimates for data set two are better determined than for data set one. In addition, when the second data set is used, the marginal confidence intervals provide useful information.

Model calibration 165
The D-optimality criterion for model (1) requires that both Sj and s2 be long vectors where both vectors contain concentrations of ammonium and nitrite in the vicinity of a2 and a4, respectively. These conditions were achieved by conducting batch runs with initial concentrations of s0 = (6.5, 6.1), (6.5, 3.1), (6.5, 0.0) and then combining the individual runs form a single data set. The choice of s0 lead to equally long vectors of st and s2, which can be seen by inspecting Figure 3. The correlation between sl and s2 is weak, p s l s 2 =-0.04.
There was no absolute assurance that this experimental design would eliminate problems associated with high parameter correlation, a major cause of modelling distortions and misleading conclusions about a model. The fact that models given in this chapter were subject to statistical inference tests as well as two goodness of fit tests give assurances that model specifications were adequate and parameters were well determined. For some nonlinear models it is important to note that their joint confidence region can be non-elliptical or even banana shaped; regardless, the principles presented here are still valid. Methods to evaluate non-linearity effects are discussed in section 7.8.
7.7 Model calibration
The model selection and development process is evolutionary. In fact, our first selection of model (1) was rejected and different models were proposed and analyzed. All proposed models used Monod type specifications in an attempt to describe the process as being ammonium and nitrite rate limiting during steps 1 and 2, respectively.
Model (1) was rejected because the Gauss-Newton algorithm failed to converge (modelling step 2). The numerical analysis showed that a3, the maximum specific respiration rate, approached infinity. The rate therefore had no physical meaning and model (1) was rejected. The model is suspected of being improperly specified because of the a3s2/(a4-l-s2) term. It was introduced to account for the fact that s2 is rate limiting during stage 2 of nitrification. However, since s2 is not rate limiting during stage 1, the model specification is considered improper and the cause of non-convergence.
It was necessary to select model forms that describe two distinctly different roles for s2. It also proved essential to sort the combined data set as being in stage 1: Sj > 0 and s2 > 0 where both ammonium and nitrite are oxidized, or in stage 2: Sj = 0 and s2 > 0 where nitrite is oxidized. Data sorting is consistent with the interpretation of nitrification as being a two-step process. The following piece-wise nonlinear nitrification model was specified:

166 Assessment of a two-step nitrification model
for Sj > 0 and s2 > 0,
y - (2a)
and for s1 = 0 and s2 > 0,
(2b)
Inspection of the scatter plots of Figure 2 gave us confidence prior to performing model calibration calculations that model (2) was a reasonable form. The first term of the right-hand side of the equality sign in (2a) was chosen to describe Sj as limiting y as shown in Figure 2a. The scatter plot of Figure 1 shows y decreasing with increasing S2- Thus, the second term of a3s2 was chosen to act as a corrective term and its sign was specified to be negative to reduce y as s2 increases. These assumptions are challenged in the model assessment step of the analysis.
The specific respiration rates during stage 2 are typical of data representing a single substrate Monod type model, thus model (2b) was chosen. In addition, scatter plots for s10 = 0 and s20 = 6.2 and 3.1 gave further affirmation that the form of model (2b) was suitable.
The combined data set for all 14 experimental runs was sorted into two groups: sl > 0 for stage 1 and Sj = 0 for stage 2. The data in each group was used to independently calibrate models (2a) and (2b). The D-optimality criterion is satisfied for these models and combined data set groupings. The calibrated model for stage 1 is:
for Sj > 0 and s2 > 0,
19.55!
0.208+5, -0.3335, (2c)
with residual mean square s2 = 1.782 and n = 91 observations. The model for stage 2 is:

Model assessment 167
for Sj = 0 and s2 > 0,
4.08s2
0.0875 +s2
(2d)
with s2 = 0.9452 and n = 107 observations.
The model calibration procedure did not place restriction on the signs of the parameters. Since the least square estimate of parameter a3 for model (2c) was positive, the assumption that nitrite tends to reduce specific respiration rate as its concentration increases seemed justifiable.
7.8 Model assessment
Three different assessment procedures (modelling step 3) were performed. First, residual plots were used to determine the overall adequacy of the hypothesized model form f (a, X) for the combined data set of all experimental runs. The residual vector, e = y - f(â, X) = y - y, was also used as error estimates to test assumptions about E. Second, statistical inferences were used to test the significance of parameter estimates and to assess the significance of model non-linearity and parameter correlation (Bates and Watts, 1988). Third, expected value estimates for a model were evaluated for goodness of fit for each experimental run over time.
Residual plots
Residual plots are effective in validating model forms. When a model form is considered inadequate, residual plots often prove useful in suggesting a different model relationship or the absence of an important variable from the model. The residual error for the models of stages 1 and 2 was calculated as
19.5s„. e, - y, !*-+ 0.333*2, ' ' 0.208 +s1(
2j

168 Assessment of a two-step nitrification model
for model (2c), and
4.08s-, ej - yj L
0.0875 +s2J
for model (2d). The residual plots of e as a function of s1; s2 and y (not shown) suggested that the model had a reasonable fit. Most importantly, the residual plots show no discernible trends suggesting an important variable may be absent from the model. For each residual plot, the error values were reasonably, uniformly distributed along the sl5 s2, and y axes. The error values appeared to have a normal probability distribution with respect to Sj, s2 and y axes. Therefore, there was no reason to suspect that the model form was inadequate or the distribution assumptions about the random variable E were violated.
Statistical inferences
Hypothesis tests were conducted by evaluating (1-a) = 95% confidence regions and intervals. These graphical summaries were constructed using nonlinear analysis methods because they are considered effective for assessing the severity of non-linearity in an estimation situation and the effects of parameter correlation. The profile t function is a fundamental relationship used in these assessments (Bates and Watts, 1988). The profile t function for model parameter a_ is defined to be
TP " T(aP " si8n(ap -âp>p(âJ - s(â)
where
âp = minimum least square estimate of parameter p; L = matrix of parameter estimates conditioned on parameter a,;
S(â) = minimum sum of the least squares for estimate a; S(âp) = profile sum of squares for parameter su where S(â ) = | |
with e = y - f(â„, X).
(3)

Model assessment 169
0.24
0.22
0 .2
0.18
=2
ai(a2)
_ _ / _ _ - — ' ^ ^ ii
a3<a2)
a^a,)
%<»l) 0.15
»2(33)
k(as)
Figure 5: The conditional least square parameter estimates and 95% confidence regions ft model (2).
or
For each assigned or conditional value of a., the least square parameter estimates of all other model parameters aq(ap) where q ^p of âp were calculated using the Gauss-Newton algorithm. For the two-parameter model (2d), a known value of a4 was used to calculate a5(a4) was calculated and was denoted as â4 = [a4 a5(a4)]. Similarly, a known value 85 of model (2d) was used to calculate a4(a5) and was denoted as â5 = [a4(a5) a5]. For the three parameters of model (2c), a similar procedure was used to find âj = [aj a2(at) a3(aj)], â2
= [a^a^ a2 a3(a2)] and â3 = [aj(a3) a2(a3) a3]. The plots of ap and aq(ap) show the pair-wise dependency between parameters (Figure 5).
Knowing â , the value of T was calculated with equation (3). A plot of rp versus a is called a profile trace. It provides exact likelihood intervals for individual parameters and the curvature of the trace gives information about the non-linearity of the model. If a model is linear, then T is a straight line. Since all profile traces shown in Figure 6 are either linear or slightly curved, it suggests that non-linearity is slight for model (2).

170 Assessment of a two-step nitrification model
U
AT
4/
/ H
0 . 1 0 . 2 0 . 3 0 . 4 0 . 5 0 . 6 0 . 7
3 . 6 3 . 8 4 4 . 2 4 . 4 4 . 6
Figure 6: Profile traces for model (2).
The 95 % joint confidence regions for model (2) were constructed with the use of equation (3). The 95% joint confidence regions for model (2) are shown in Figure 5. The joint confidence regions are either elliptical or nearly elliptical in shape because non-linearity is slight.
The angle at the intersection of rp and Tq is a measure of correlation. For zero correlation (ppq = 0) the angle between them is 90° and for perfect correlation ( | ppq | = 1) the angle is 0°. The plots of ap and aq(ap) of Figure 5 serve as a good surrogate for the T and T plots for model (2). The parameter correlations were estimated to be p12 = 0.35, p13 = 0.62, p23
= -0.31 and p45 = 0.58. The plots of ap versus aq(ap) and the values of ppq indicate weak to moderate correlation.

Model assessment 171
00 "Sb S
2 c o
o
time (min)
Figure 7: Time series plots of model (2) for s0= (6.5, 0.0) experimental runs, (a) run 7, (b)
run 8, (c) run 9 and (d) run 10. The points are observed values and the lines are expected
values.
The interiors of the joint confidence regions were exclusive of zero; therefore, all parameter estimates of model (2) were considered to be statistically different from zero at the 95% level. Distortions caused by correlation between parameter estimates and model non-linearity were considered to be of little concern, thus all parameters and marginal confidence intervals should be well determined. The 95% marginal confidence intervals, which were determined with the profile traces of Figure 6, are:
18.6 < at < 20.3, 0.17 < a2 < 0.26, 0.16 < a3 < 0.48, 3.8 < a4 < 4.4, and 0.045 < a5 < 0.13.

772 Assessment of a two-step nitrification model
-S?
S
20 40 60
Q .
10 20 30 40 50 60
time (min)
Figure 8: Time series plots for model (2) for experimental runs (a) run 2 and (b) run 4. The
points are observed values and the lines are expected values.
Time series goodness of fit test
The purpose of this test was to assess the goodness of fit of model (2) over time for each
individual experimental run. The values of (tj, Vj) and (tj, yj) were superimposed on the same
time series plot. The overall goodness of fit for model (2) was considered good for all
experimental runs. Figure 7 shows the results for experimental runs with initial con
centrations of s0 = (6.6, 0.0). Overall, the model fit for all experimental runs were better
for stage 2.
The worse fits were observed for experimental runs 2 and 4. The lack of fit shown in Figure 8 was explained by investigating the individual experimental runs. During experimental run 2, the swivel of the DO probe was not firmly closed causing some loss of MLSS and a

Discussion 173
reduction in the observed specific respiration rate. For experimental run 4, the stirrer was not engaged for the first 21 minutes of the run, possibly causing incomplete mixing. Since aeration seemed to be sufficiently intensive to cause complete mixing during the run, the data from experimental run 4 were introduced into the combined data set of fourteen experimental runs. In addition, unstable weather conditions, temperature, loading and MLSS, varied more than intended during the entire seven days period of the experiment. Since there was significant variability among experimental runs and the model fit was good for all 14 experimental runs, model (2) is considered to be robust.
7.9 Discussion
The experimental design and methods of model selection, calibration and assessment give assurance that model (2) is appropriately specified and the values of the parameter are well determined. However, there may be doubts that the statistical methods used in this study are necessary. After all, our experimental design used was expensive to conduct in terms of time and money. In this discussion, the use of the experimental design based on the D-optimality criterion and the two-step nitrification model will be challenged in a series of three related questions. Since the reaction is more complex during stage 1 of nitrification, the focus is on model (2c).
Is the model (2c) significant?
The first question deals with the significance of model (2c) in describing nitrification. Possibly a simpler, single substrate Monod model will be as effective in describing the process, y = a1s1/(a2 + s{). The following model was calibrated with the same stage 1 data set used for model (2c),
(4) 0.242+5,
with s2 = 1.942 and n = 91 observations.
The model assessment tests showed that each model parameter is significantly different from zero; therefore, all terms of models (2c) and (4) were considered significant by this test. In addition, since model (2c) is of the same form as model (4) with the inclusion of an

174 Assessment of a two-step nitrification model
additional term, an extra sum of squares analysis for nested models was used (Bates and Watts, 1988). It showed that the variance of model (4) is significantly larger than for model (2c) at a = 5%; consequently, it shows the importance of the additional term suggesting that the nitrite concentration s2 is a significant factor during stage 1 of nitrification. From a descriptive point of view, model (2c) is a better model because it describes a cause-effect relationship between y and the predictor variables Sj and s2.
Ironically, both models (2c) and (4) give similar responses y. Note that the residual mean square variance s2 = 1.942 for model (4) is slightly greater than the variance s2 = 1.782 for model (2c). In goodness of fit tests, the errors e: for model (4) are slightly greater than for model (2c). The difference is considered minor so it is difficult to claim that one model is better than the other one based on goodness of fit testing. Even though model (4) has a simpler form, it fails to describe the role of nitrite; therefore it is not recommended. This point will be addressed again.
Is model specification (2c) unique?
The specification of model (2c) is based upon observed responses and no attempt has been made to explain the process with mechanistic or biological arguments. It should not be surprising that other model specifications could be used to describe the process. Furthermore, the respiration rates used to calculate the specific respiration rate vector y are based on total oxygen consumption measures by all nitrifying bacteria, not by species of Nitrosomonas or Nitrobacter. It was not possible through direct measurement to determine the portion of the specific respiration rate associated with either ammonium concentration sl or nitrite concentration s2 during stage 1; therefore, model (2c) was specified without a valuable piece of information. In this study, the basis for specifying model (2c) is based heavily upon empirical evidence and statistical methods for model assessment.
In order to gain a different perspective on the role of S2, the following Monod model was proposed, y = c(s2)s1/(k(s2) + s^ where the maximum specific respiration rate is a function of nitrite concentration (K^) = a i " a3s2)> anc^ t n e half saturation constant is a function of nitrite concentration (k(s2) = a2 - a4s2). This model, like model (2c), suggests that an increase in nitrite concentration s2 tends to limit specific respiration rate y, and further suggests that nitrite concentration s2 affects the half saturation rate. Here, the a3s2 and a4s2
terms act as correction factors for the maximum specific respiration rate constant aj and half saturation constant a2. The calibrated model data set is

Discussion 175
A_ ( 2 1 . 0 - 0 . 7 2 3 ^ ( 5 )
y " (0.343-0.028s2)+Sj
with s2 = 1.662 and n = 91 observations. This model was calibrated with the same data, the stage 1 date set, used for models (2c) and (4).
Model assessment and extra sum of squares tests show the significance of all model parameters of model (5). It gives a slightly better fit than for model (2c).
Since model (5) is a four parameter model, there was the possibility of it being over-parameterized. An over-parameterized model generally leads to problems associated with ill-conditioning, that is poor parameter estimation and high parameter correlation where | p q | « 1. Model (5) did not suffer from this problem, thus there was no reason to reject
Is the experimental design important?
The third and final question deals with the effects of experimental design on modelling. In typical plant operation, mixed liquor does not have normally a high nitrite to ammonium ratio as the combined data set used in this experiment. In order to determine the effect of this experimental design, the data from the four experimental runs with initial concentrations SQ = (6.5, 0.0) were used to calibrate one- and two-step models. The data were not sorted into stage 1 and 2 data sets as was done for models (2) and (4). The calibrated models are
15-5*' (6) 0.132+ s,
with s2 = 5.812 and n = 36 observations,
12.2s, • 7.01s, (7) 0.498 +s,
with s2 = 4.912 and n = 36 observations.

176 Assessment of a two-step nitrification model
Residual error plots for models (6) and (7) showed that there are no violations in the assumptions for error distribution. Time series plots for these models were satisfactory. Model (6), however, gave slightly biased results.
When comparing these models with models of the same specification calibrated with the combined data set of 14 experimental runs, the results are substantially different. For the one-step model specification, the mean square variance s2 = 5.812 for model (6) is significantly greater than the mean square variance s2 = 1.942 for models (4). For the two-step model specification, s2 = 4.912 for model (7) is significantly greater than s2 = 1.782
for model (2c). Model (6) and (7) explain little variation in the observed responses of y.
Additionally, the parameter estimates for models (6) and (7) are not well determined. For the one-step model, the best least square estimate of a2 = 0.132 for model (6) has a standard deviation estimate of s2 = 0.96. This estimate is not significantly different from zero at a 95% confidence level. For the two-step model, the parameter estimates of a3 are opposite in sign. Model (7) suggests a different role than previously described for model (2c). Models (6) and (7) have parameter estimates of questionable merit.
Part of the problem associated with the poor parameter estimates for models calibrated with s0 = (6.5, 0.0) data set might be attributed to the size of the data set of n = 36. In our opinion, the major difficulties are associated with improper model specification and poor experimental design. The s0 = (6.5, 0.0) data set does not satisfy the D-optimality criteria for either model (6) or (7).
According to the D-optimality criterion for the model y = a ^ / ^ + s{), observations of Sj are needed in the vicinity of a2. In other words, corresponding observations of Sj and y that lie in the range of 0 < y < 10. The upper range value of y = 10 was chosen to be about one-half the maximum specific respiration rate. Inspection of the SQ = (6.5, 0.0) data set shows no cause-effect relationship between y and st in this range. The respiration was caused by the oxidation of nitrite not ammonium. This is stage 2 of nitrification, where S2 > 0 and Sj = 0. Model (6) is a poor specification in this range. Model (2), on the other hand, uses a piece-wise model where model (2d) is used to describe the process in this range.
Model (7) is a poor specification for the same reason as well as for other reasons. First, the discussion will focus on the inadequacy of the data set used to calibrate model (7) and then, in next paragraph, return to the issue of model specification for the overall process. According to the D-optimality criterion for the model y = a1s1/(a2 + s^ - a3s2, both Si and s2 should be long vectors. The length of s2 for the s0 = (6.5, 0.0) data set is short in

Discussion 177
comparison to Sj. This is reflected in the correlation coefficient of Sj and s2. For the Sg = (6.5, 0.0) data set, p s l s 2 = -0.69. Strong parameter correlation is an expected problem in calibrating model (7). Secondly, inspection of the SQ = (6.5, 0.0) data set shows a no discernible cause-effect relationship between y and s2. These two facts offer explanations why the parameter estimates of model (7) are of questionable merit. One approach to increasing information in the data set is to conduct more experimental runs at s0 = (6.5, 0.0). Repeat runs will increase the number of observations but there is no guarantee that this approach will lead to more confidence in model (7). More repeat runs will not lengthen S2; therefore, it is not expected to decrease parameter variances V(ap) or parameter covariances ppq. The D-optimality calling for long vectors of both Sj and s2 directly addresses the problem of parameter correlation. In hindsight, experimental runs s0 = (6.5, 6.1) and (6.5, 3.1) of the combined data set for stage 1 provided valuable information in calibrating model (2c) with well determined parameters. It is also helpful for model specification.
The information contained in the s0 = (6.5, 0.0) experimental runs do not clearly reveal the role of nitrite in nitrification; therefore, it provides a limited view of the process. In contrast, experimental runs s0 = (6.5, 6.1) and (6.5, 3.1) coupled with experimental runs SQ = (0.0, 6.2) and (0.0, 3.1) of the combined data set of 14 experimental runs provides important information about the role of nitrite as well as for describing nitrification by stages 1 and 2, and in turn, for specifying a piece-wise model or model (2). In summary, satisfying the D-optimality condition by providing long vectors of Sj and s2 provided valuable information for both model specification and parameter estimation.
A final comment about the goodness of fit test and model selection is in order. In this study, nonlinear regression analysis led to the calibration of models with good fits regardless of the data set or model specification. Basing a model on a goodness of fit test alone is considered insufficient evidence to accept a model. Statistical inference testing proved useful in giving added confidence in the model or in drawing attention to possible model inadequacies. A most important factor in specifying and calibrating models with well determined parameters proves to be a carefully designed experiment. Models (2c) and (5) satisfy these conditions.
. They are cause-effect models that help to describe the role of nitrite in nitrification. Further work is needed to determine whether empirical models (2c), (5) or some other model specification is justifiable in a mechanistic sense.
178 Assessment of a two-step nitrification model
7.10 Conclusions
According to the statistical analysis of an experiment designed using the D-optimality
criterion, the two-step nitrification can be modelled with piece-wise, nonlinear models
containing ammonium and nitrite concentration. The study also suggests that questions of
model specification and parameter precision associated with nonlinear models can be
mitigated with careful experimental design and the use of nonlinear regression analysis.
7.11 Notation
aj, a3 maximum specific respiration rates (mg g^h"1)
a2, a4 half saturation constants (mg N l"1)
n number of observations
r measured respiration rate (mg l^h"1)
rend endogenous respiration rate (mg r ' h ' 1 )
rs = r-rend substrate respiration rate (mg l^h"1)
Sj ammonium concentration (mg l"1)
SJO initial ammonium concentration (mg l"1)
s2 nitrite concentration (mg l"1)
s20 initial nitrite concentration (mg l"1)
s2 variance
y specific respiration rate (mg g^h"1)
1-a confidence interval (%)
p correlation coefficient parameters i , and aq
7.12 References
Bates D.M. and Watts D.G. (1988) Nonlinear regression analysis and its applications. Wiley
Interscience, New York.
Beck M.B. (1981) Operational estimation and prediction of nitrification dynamics in the
activated sludge process. Wat. Res. 15, 1313-1330.
Berthouex P.M. (1993) Kinetic modelling and statistics, An Introduction to Water Quality
Modelling. (A. James, editor) John Wiley & Sons, West Sussex, England.
Box G.E.P., Hunter W.G. and Hunter J. S. (1978) Statistics for experimenters. Wiley
Interscience, New York.
Cailas M.D. and Gehr R. (1989) The oxygen uptake rate approach for analyzing

References 179
respirometric biochemical oxygen demand data - 1 . Method development. Wat. Res. 23,
985-992. Cech J.S., Chudoba J. and Grau P. (1984) Determination of kinetic constants of activated
sludge microorganisms. Wat. Sei. Technol. 17, 259-272. Curie D.J. (1982) Estimating Michaelis-Menten parameters. Bias, variance and experimental
design. Biometrics 38, 907-919. Henze M., Grady C.P.L, Gujer W., Marais G.v.R. and Matsuo T. (1987) Activated Sludge
Model No. 1. Report published by IAWPRC, London, England. Holmberg A. (1982) On the practical identifiability of microbial growth models incorporating
Michaelis-Menten type non-linearities. Mathematical Biosciences 62, 23-43. Lijklema L. (1973) Model for nitrification in activated sludge process. Environmental Science
and Technology 7 pp. 428-433. Ossenbruggen P., Spanjers H., Aspegren H. and Klapwijk A. (1991) Designing experiments
for model identification of the nitrification process. Wat. Sei. Technol. 24, 9-16. Ossenbruggen P.J., Spanjers H. and Klapwijk A. (1991) Designing and analysis of
experiments for nitrification processes, presented at the 3rd International Conference on
Environmetrics, Oct. 7 - 10, Madison, WI. Quinlan A. V. (1980) The thermal sensitivity of nitrification as a function of the concentration
of nitrogen substrate. Wat. Res. 14, 1501-1507. Spanjers H. and Klapwijk A. (1990) On-line meter for respiration rate and short-term
biochemical oxygen demand in the control of the activated sludge process. Advances in
Water Pollution Control, Proceedings of the 5th IAWPRC Workshop held in Yokohama and Kyoto, Japan, pp. 67-78.
181
Summary
There is a need for a technique capable of continuously measuring wastewater and activated sludge properties. The information obtained by means of such a technique can be used to expand the existing fundamental knowledge about the activated sludge process and to improve the operation of the process, thereby saving operating costs. The oxygen uptake per unit of volume and unit of time, or respiration rate, is the key variable of the activated sludge process. Therefore, this study was devoted to the measurement and application of this variable.
The purpose of this study was to (1) develop a respiration meter capable of continuously measuring, using different procedures, the oxygen uptake rate of activated sludge and (2) expand the existing knowledge about respiration related characteristics of wastewater and activated sludge.
From reviewing the literature on respiration meters it was concluded that only a continuous flow-through respiration meter is suitable for real-time monitoring the rate of oxygen uptake of activated sludge in an aeration tank. In addition, to be useful for state estimation and control of the activated sludge process, respiration meters should be operated continuously. Therefore, in this study the attention was focused on the development of such a meter.
In Chapter 1 the developed respiration meter is described and three different types of respiration rates that can be measured with this meter are presented. The actual respiration rate (ract) is defined as the oxygen uptake rate in the aeration tank. It is argued that the controversy in literature about the usefulness of the respiration measurement can be attributed to inappropriate procedures for measuring ract. In this study it was demonstrated that ract can be correctly measured if simultaneously with the sludge a sample of the influent is fed continuously into the respiration chamber so that the ratio of sample flow rate and chamber volume equals the ratio of influent flow rate and aeration tank volume. The endogenous respiration rate (rend) is defined as the oxygen uptake rate of activated sludge in the absence of readily biodegradable matter. It is conceived that this rate is limited by the rate of hydrolysis of slowly biodegradable matter. From literature it was concluded that there is no clear understanding of the conditions under which the maximum respiration rate (rmax) is to be measured. In this thesis the measurement of rmax, therefore, is explained separately in Chapter 5.
Biochemical oxygen demand is an important variable for characterising wastewater. In Chapter 1 the significance and nature of short-term biochemical oxygen demand (BODst) is discussed and substantiated. The BODst of wastewater (or another solution) is defined as the
182 Summary
amount of oxygen used in addition to the endogenous oxygen consumption. BODst is due to the oxidation of readily biodegradable matter including readily oxidizable nitrogen.
Finally it is shown in Chapter 1 that the BODst of the wastewater used in this study
originates from soluble matter.
In Chapter 2 the procedures for measuring ract, rend and rmax are presented. It is shown that the BODst of both influent and effluent can be derived from ract, rend and the instantaneous respiration rate; the latter is measured when sludge from the aeration tank flows directly through the respiration chamber. Results from two experimental periods are presented and discussed. It is concluded that the measurements provide relevant information on the activated sludge process and the influent. The BODst of the examined wastewater appears to be predominantly caused by ammonium oxidised by nitrifiers. There is some evidence that rmax
depends on the influent flow rate. This observation is amplified in Chapter 5.
The technique for the measurement of ract, described in Chapter 2, is only applicable to a plant with one single aeration tank or the first compartment of a plug flow reactor. In Chapter 3 a method is presented for the estimation of ract in a completely mixed tank, no matter whether it is a single reactor or any compartment of a plug flow reactor. As an intermediate, the BODst in the aeration tank is estimated simultaneously. In contrast to the other technique, this method does not require the addition of influent to the respiration chamber. Instead, the transient respiration rate is measured during two alternating modes of operation. In one mode sludge from the aeration tank is directed through the respiration chamber, whereas in the other mode sludge having the endogenous rate is used. The method was tested using simulated and experimental data. To verify the estimated ract on the basis of experimental data, this variable was also measured, using the method described in Chapter 2. The pattern of the estimated ract is in agreement with the measured one and with the diurnal variation typical for the wastewater used. There is, however, a significant difference between the average values of the two methods. It is suggested that the measured ract turns out too high because of too high a flow rate of influent into the respiration chamber.
The experimental procedure and estimation technique described in Chapter 3 is applied in Chapter 4 to estimate the influent BODst. For this purpose, in one mode influent is added to the sludge flowing through the respiration chamber in order to measure ract. In the other mode sludge with the endogenous respiration rate is used. The procedure was tested experimentally and the estimated influent BODst was compared with values obtained independently from batch respirometric tests. There is a reasonable agreement between the estimated and measured BODst. It is concluded that the procedure can be used to estimate
Summary 183
the influent BODst with a relative error varying from 2 to 6%.
In Chapter 5 the measurement and application of rmax is reviewed. It is concluded that measuring rmax can be useful for monitoring, controlling, assessing toxicity, estimation of biomass concentration and determination of aeration capacity. However, questions arise from the evaluation of the measurements. In particular when the maximum respiration rate is determined by measuring with an excess of substrate, it is not clear whether there was an excess indeed in all cases. The effect of a varying substrate composition on the maximum respiration rate has not been addressed in the literature. In this chapter, therefore, is discussed under which conditions it is possible to measure on-line the maximum respiration rate of sludge from a completely mixed activated sludge tank fed with domestic wastewater from a particular source. It is presumed that the readily biodegradable part of the wastewater can be represented by two components. It is shown that rmax can be measured if wastewater is continuously fed into the respiration chamber, so that the loading exceeds a certain critical value. This critical loading is a function of the kinetic parameters of the components and of the fractions in which these components occur in the wastewater. It is shown that batch tests can be useful in checking if the condition for on-line measurement of rmax, an excess of substrate, is met. However, the results were not fully satisfactory.
An application of the measurement is also described in Chapter 5. It concerns the effect of the influent flow rate of a nitrifying activated sludge plant on rmax. It is concluded that, under the experimental conditions applied, there is no significant effect. The batch tests are useful for verification of the on-line measurements.
Inherent in the principle of the respiration meter, described in Chapter 1 and 2, is that the DO probe is repeatedly subjected to step changes in the DO concentration. As described in Chapter 6, this fact has been employed for the improvement of the DO measurement and, consequently, the performance of the respiration meter by fitting a first-order response model to each measured response. This procedure provides an estimation of the real DO concentration, even when the full response is not attained, and of the probe response time constant. Simulations and nitrification batch tests were used to test the reliability of the method. It is concluded that the proposed method provides a reliable estimate of the real DO concentration and, as a result, the reliability of the respiration meter is improved. Moreover, the estimated first-order probe response time constant proves to be useful for indicating fouling of the probe membrane.
An application of the respiration meter for identifying a mathematical model for nitrification is presented in Chapter 7. Nitrification was chosen because there is a need for a better model

184 Summary
of this process, including both nitrification steps. Because an optimal experimental design and a good model validation method are needed, the investigation was focused on these two items. The investigation consisted of batch tests in which solutions of ammonium chloride and sodium nitrite were added to activated sludge. The respiration rate was monitored whereas ammonium and nitrite concentrations were measured at regular time intervals. Model identification was started by hypothesising a model consisting of two Monod type functions. Nonlinear regression was used for parameter estimation and for evaluating the effects of non-linearity. Residual plots and other tests were used for model assessment. It is demonstrated that nitrification can be modelled with two-step, nonlinear models using the ammonium and nitrite concentration as variables. A two-step model is considered to be better than a one-step model, as the latter considers the respiration rate to be dependent on the ammonium concentration only. It is also suggested that careful experimental design and the use of nonlinear regression are useful for model identification.

185
Samenvatting
Er bestaat behoefte aan een techniek waarmee kontinu eigenschappen van afvalwater en aktiefslib kunnen worden gemeten. De met een dergelijke techniek verkregen informatie kan worden gebruikt om de bestaande fundamentele kennis van het aktiefslibproces te vergroten en de werking van het proces te verbeteren, zodat bedrijfskosten worden bespaard. De zuurstofopname per volume-eenheid en per tijdeenheid, oftewel de respiratiesnelheid, is de belangrijkste variabele van het aktiefslibproces. Daarom was het onderhavige onderzoek gewijd aan het meten en toepassen van deze variabele.
Het doel van het onderzoek was (1) een respiratiemeter te ontwikkelen die kontinu de zuurstofopnamesnelheid van aktiefslib kan meten en (2) de bestaande kennis over eigenschappen van afvalwater en aktiefslib met betrekking tot respiratie te vergroten.
Het literatuuronderzoek naar respiratiemeters leidde tot de konklusie dat alleen een kontinu doorstroomde meter geschikt is voor het direkt registreren van de zuurstofopnamesnelheid van aktiefslib in een beluchtingtank. Bovendien moet een respiratiemeter kontinu werken om geschikt te zijn voor het schatten van toestand variabelen en het regelen van het aktiefslibproces. Daarom is in het onderzoek gestreefd naar de ontwikkeling van een dergelijke meter.
In Hoofdstuk 1 wordt de ontwikkelde respiratiemeter beschreven en worden drie soorten respiratiesnelheid geïntroduceerd die de meter kan registreren. De aktuele respiratiesnelheid (ract) wordt gedefinieerd als de zuurstofopnamesnelheid in de beluchtingtank. Verder wordt gesteld dat de kontroverse in de literatuur over de bruikbaarheid van de respiratiemeting is toe te schrijven aan inadekwate meetmethodes. Dit onderzoek laat zien dat ract korrekt wordt gemeten als, gelijktijdig met het aktiefslib, een deelstroom van het aangevoerde afvalwater in het respiratievat wordt gebracht, waarbij het deelstroomdebiet en het respiratievatvolume zich tot elkaar verhouden als het influentdebiet en het beluchtingtankvolume. De basisrespiratiesnelheid (rend) wordt gedefinieerd als de zuurstofopnamesnelheid van aktiefslib bij afwezigheid van snel-biodegradeerbare stoffen. Er wordt van uitgegaan dat deze snelheid afhankelijk is van de hydrolysesnelheid van langzaam-biodegradeerbare stoffen. Literatuuronderzoek leidde tot de konklusie dat er geen duidelijk inzicht is in de kondities waaronder de maximale respiratiesnelheid (rmax) moet worden gemeten. Daarom wordt in Hoofdstuk 5 van dit proefschrift de meting van rmax apart uiteengezet.
Het biochemisch zuurstofverbruik is een belangrijke grootheid voor het karakteriseren van afvalwater. In Hoofdstuk 1 wordt het belang en de aard van het korte termijn biochemisch zuurstofverbruik (BZVkt) besproken en worden daarvoor gronden aangevoerd. Het BZVkt van

186 Samenvatting
afvalwater (of een ander medium) wordt gedefinieerd als de hoeveelheid zuurstof die naast het basiszuurstofverbruik wordt verbruikt, als dit water met aktiefslib in kontakt wordt gebracht. Het BZVkt is het gevolg van de oxidatie van snel-biodegradeerbare stoffen, inklusief snel-oxideerbare stikstof.
Tot slot wordt in Hoofdstuk 1 aangetoond dat het BZVkt van het in dit onderzoek gebruikte afvalwater het gevolg is van opgeloste stoffen.
In Hoofdstuk 2 worden de procedures voor het meten van ract, rend en rmax beschreven. Er wordt aangetoond dat het BZVkt van zowel influent als effluent kan worden berekend uit ract, rend en de momentane respiratiesnelheid. De laatste wordt gemeten als aktiefslib van de beluchtingtank door de respiratiemeter stroomt. De resultaten van twee meetperiodes worden gepresenteerd en besproken. Er wordt gekonkludeerd dat de metingen relevante informatie geven over het aktiefslibproces en het influent. Het BZVkt van het onderzochte afvalwater blijkt voornamelijk het gevolg te zijn van de oxidatie van ammonium door nitrificerende bakteriën. Er is een aanwijzing dat rmax afhankelijk is van het influentdebiet. Deze waarneming wordt besproken in Hoofdstuk 5.
De in Hoofdstuk 2 beschreven methode voor het meten van ract geldt alleen voor een inrichting met een enkele beluchtingtank of voor het eerste kompartiment van een propstroomreaktor. In Hoofdstuk 3 wordt een methode beschreven voor het schatten van ract
in een volledig gemengde tank, ongeacht of dit een enkele reaktor is of een kompartiment van een propstroomreaktor. Het BZVkt in de beluchtingtank wordt gelijktijdig als tussenprodukt geschat. In tegenstelling tot de andere methode is het bij deze methode niet nodig afvalwater aan het respiratievat toe te voegen. In plaats daarvan wordt de overgangsrespiratiesnelheid gemeten tijdens twee elkaar afwisselende modi operandi. In de ene modus wordt het slib vanaf de beluchtingtank door het respiratievat geleid, terwijl in de andere modus slib met de basisrespiratiesnelheid wordt gebruikt. De methode is beproefd met behulp van gesimuleerde en experimentele meetgegevens. Om de op basis van experimentele gegevens geschatte ract te verifiëren, is deze variabele ook gemeten met behulp van de in Hoofdstuk 2 beschreven methode. Het verloop van de geschatte ract komt overeen met dat van de gemeten ract en met de dagelijkse variatie die voor het gebruikte afvalwater kenmerkend is. Er bestaat echter een signifikant verschil tussen de gemiddelde waarden van de twee methodes. Een mogelijke verklaring is dat de gemeten ract te hoog is door een te hoog debiet van het afvalwater naar het respiratievat.
De in Hoofdstuk 3 beschreven experimentele procedure en schattingsmethode wordt toegepast in Hoofdstuk 4 voor de schatting van het influent BZVkt. Daartoe wordt in de ene modus een

Samenvatting 187
deelstroom van het influent toegevoegd aan het slib dat door het respiratievat stroomt. Hierbij wordt ract gemeten. In de andere modus wordt aktiefslib met de basisrespiratiesnelheid gebruikt. De procedure is experimenteel getest en het geschatte influent BZVkt is vergeleken met onafhankelijk in batchproeven gemeten waarden. Het geschatte en gemeten BZVkt komen redelijk overeen. De konklusie is dat met deze procedure het influent BZVkt kan worden geschat met een relatieve fout tussen 2 en 6%.
In Hoofdstuk 5 wordt de meting en toepassing van rmax besproken. Er wordt gekonkludeerd dat het meten van rmax nuttig kan zijn voor het registreren, het regelen, het vaststellen van de toxiciteit, het schatten van de biomassakoncentratie en het bepalen van de beluchtingkapaciteit. De evaluatie van de meetresultaten roept echter vragen op. In het biezonder wanneer rmax wordt bepaald door met een overmaat van substraat te meten, is het niet duidelijk of er werkelijk steeds een overmaat was. Het effekt van een variërende substraatsamenstelling op rmax wordt niet in de literatuur behandeld. Daarom wordt in dit hoofdstuk besproken onder welke omstandigheden kontinu rmax gemeten kan worden van aktiefslib uit een volledig gemengde tank die met afvalwater uit een bepaalde bron wordt gevoed. Er wordt ondersteld dat het snel-biodegradeerbare deel van het afvalwater kan worden voorgesteld door twee komponenten. Aangetoond wordt dat rmax kan worden gemeten als afvalwater kontinu in het respiratievat wordt geleid en wel zodanig dat de belasting een bepaalde kritische waarde overschrijdt. Deze kritische belasting is een funktie van de kinetische parameters van de komponenten en van de frakties waarin deze komponenten in het afvalwater voorkomen. Er wordt aangetoond dat batchproeven geschikt zijn om na te gaan of wordt voldaan aan de voorwaarde voor kontinue meting van rmax, namelijk een overmaat van substraat. De behaalde resultaten zijn echter niet volledig bevredigend.
Een toepassing van de meting wordt ook beschreven in Hoofdstuk 5. Bij deze toepassing wordt het effekt onderzocht van het influentdebiet van een nitrifïcerende aktiefslibinrichting op rmax. Er wordt gekonkludeerd dat er onder de toegepaste experimentele omstandigheden geen signifikant effekt optreedt. De batchproeven zijn geschikt voor verifikatie van de kontinumetingen.
Inherent aan het principe van de respiratiemeter zoals beschreven in Hoofdstuk 1 en 2 is dat de zuurstofsensor herhaaldelijk wordt onderworpen aan stapsgewijze veranderingen in de zuurstofkoncentratie. Zoals beschreven in Hoofdstuk 6, is dit gegeven toegepast om de zuurstofkoncentratiemeting te verbeteren jen daarmee de prestatie van de respiratiemeter. Daartoe is een eerste-orde-responsmodel gefit op elke gemeten respons. Deze procedure levert, zelfs als niet de volledige respons wordt gemeten, een schatting op van de werkelijke

188 Samenvatting
zuurstofkoncentratie en van de eerste-orde-tijdkonstante van de sensor. Simulaties en batchnitrifikatieproeven zijn uitgevoerd om de betrouwbaarheid van de procedure na te gaan. Er wordt gekonkludeerd dat de voorgestelde procedure een betrouwbare schatting oplevert van de werkelijke zuurstofkoncentratie en zo de betrouwbaarheid van de berekende respiratiesnelheid en daarmee die van de respiratiemeter vergroot. De geschatte eerste-orde-tijdkonstante van de sensor is bovendien bruikbaar gebleken om vervuiling van de sensormembraan aan te tonen.
In Hoofdstuk 7 wordt een toepassing van de respiratiemeter beschreven voor het identificeren van een mathematisch model voor de nitrifikatie. Nitrifikatie werd gekozen omdat er behoefte is aan een beter model voor de beschrijving van dit proces, inklusief de twee nitrifikatiestappen. Omdat een optimaal experimenteel ontwerp en een goede modelvalideringsmethode nodig zijn, stonden deze twee onderwerpen bij het onderzoek centraal. Bij het onderzoek zijn batchproeven uitgevoerd waarbij oplossingen van ammoniumchloride en natriumnitriet aan aktiefslib zijn toegediend. De respiratiesnelheid is kontinu geregistreerd terwijl de ammonium- en nitrietkoncentraties met regelmatige tussenpozen zijn gemeten. Als eerste stap voor de modelidentifikatie is uitgegaan van een model bestaande uit twee Monod-vergelijkingen. Niet-lineaire regressie is toegepast voor het schatten van parameters en het vaststellen van effekten van niet-lineariteit. Residual curves en andere statistische toetsen zijn toegepast voor het beoordelen van het model. In het hoofdstuk wordt aangetoond dat de nitrifikatie kan worden gemodelleerd met een twee-staps niet-lineair model met de ammonium- en de nitrietkoncentratie als variabelen. Een twee-stapsmodel wordt als beter beschouwd dan een een-stapsmodel, omdat in de laatste de respiratiesnelheid alleen een funktie is van de ammoniumkoncentratie. Er wordt in dit hoofdstuk ook aangevoerd dat een zorgvuldig experimenteel ontwerp en de toepassing van niet-lineaire regressie nuttig zijn voor de modelidentifikatie.

189
Appendix A: Calculation of the respiration rate
The respiration rate is calculated from the mass balance of dissolved oxygen (DO) over the respiration chamber. Figure Al shows a scheme of the respiration chamber. The DO concentration at the inlet (c^ and outlet (c) is measured with one single probe, fixed at one opening of the chamber. This is realised by alternating, typically every 30 seconds, the sludge flow through the chamber by using four valves.
The procedure results in a DO probe output, also shown in Figure Al, oscillating between ca and c. The values of ca and c are determined at the end of each response, resulting in two time series of DO concentrations, one of the inlet and one of the outlet. The respiration rate is calculated from these time discrete values by integrating the mass balance (Al) of DO over the respiration chamber.
measuring DO
^DO^ aeration tank
c a
q
c aeration tank
measuring DO
00 ) chamber
c t t c
> : Y = :
chamber
aeration tank
Time -—
Figure Al: Scheme of the respiration chamber and typical DO probe output.

190 Appendix A
dc(t) dt
- a(ca(t)-c(t)) - KU (AI)
where a=q/v.
Given the discrete time nature of the data, equation (Al) has to be approximated by a difference equation. In this study two methods are used: an analytical method and the trapezoidal rule.
Analytical method
Figure A2 shows the DO measurements used for the calculation of the respiration rate at time instant k.
Ca,k-iy2
ca,k-1 Ca,k-V*
Figure A2: Signal from the respirometer DO probe. Solid circles: measured DO
concentrations to be used for the calculation (analytical method) of the respiration rate at
time instant k.
From (Al):
dcffj dt
- -ac(t) + aca(t) - lit) (A2)
Consider the interval [ t ^ , tk], where ca and r are constant and t^-^.j ==h is the sampling interval for the DO concentration. The general solution of (A2) is

Appendix A 191
i t
c(t) - e -«('-Vi)
{ Vi
(A3)
where
flf) - aca(t)-r(t) (A4)
or
c(t) - c(ft_1)e~a('~''~')+ [As)e-"(,s)ds (A5)
Since f(t)=f is constant in the interval [ t ^ , tk] equation (A5) can be written:
c(t) - c(ri.1)e-a('-'*-') + ^(l-C-< '( '-r '-' ,) (A6)
With t=tk we get
^ t ) - c(tk_1)e-*h + £{l-e*h) (A7)
At t=tk.1; equation (A4) gives
XW - / - <*(cA-i)-*'*)) (A8)

192 Appendix A
Combining (A6) and (A7) and solving for r yields:
r(tk) - ^ ^ ( ^ - ' " " ^ - i ) + c<'*-i>'~"* - C M <A9>
As illustrated in Figure A2, the values of c ^ . j ) and cCy are measured. The value of ca(tk_!) can be found by linear interpolation:
«.<'*-!) - i(CA-0.5> + 'A-CU)) ( A 1 ° )
Trapezoidal rule
The respiration rate can also be calculated from (Al) by approximating the derivative by a piecewise linear function (trapezoidal rule):
c(t )-c(t ) 1 *'05 - j ( « M W + cA-0.5)) - « f « J - <*H5>) ~2h) ( A U )
or
rk - {(«(<fl(W + cßk_0!)) - («+f)«W - (« - f )*W) (A12)
Figure A3 illustrates that ca(tk.i^) and c a ( t k + ^ ) are measured values, while c(tk.i/i) and c(tk+ i^) have to be found by interpolation:
*W - fat-i) + ^ ) ) ( A i 3 )
f ( W - i (c( f t)+ C(W)

Appendix A 193
Ca,k-1/2 Ca.k+'/ü
Ck+% Time-
Figure A3: Signal from the respirometer DO probe. Solid circles: measured DO
concentrations to be used for the calculation (trapezoidal rule) of the respiration rate at time
instant k.
Notation
a, b = help variables c = DO concentration at the outlet of the respiration chamber
ca = DO concentration at the inlet of the respiration chamber q = flow through respiration chamber r = respiration rate t = time
v = volume respiration chamber a = dilution rate

194
Appendix B: Condition for measurement of the actual respiration rate
For the measurement of the actual respiration respiration rate (ract, in this appendix denoted as Ta) with the flow-through respiration meter it is crucial that the activated sludge in the respiration chamber and the aeration tank are loaded with substrate in the same proportion. Therefore, simultaneously with the sludge, wastewater is continuously introduced into the chamber (Figure Bl). In this appendix, the required influent sample flow (q^ is derived.
respiration chamber aeration
tank
Figure Bl: Schematic diagram of the aeration tank and the respiration chamber (not on scale). The substrate concentration (s) is expressed in BODst
The following assumptions are made:
- The volume of the tubes can be neglected. - No oxidation of readily biodegradable compounds takes place in the settling tank. - Steady state exists with respect to the substrate concentration. - The respiration rate is only a function of biomass concentration and substrate
concentration.
The mass balances of s over the aeration tank and the respiration chamber are respectively:
°iSi + (*,+«,>*, - arSa " Üi + Vs)Sa " X
aVa°a " °
Vl + «A - tir + qJS, " XrVrar ~ °
(Bl)
(B2)

Appendix B 195
where the activity is a function of the substrate concentration:
a-±-M (B3) x
Now, we choose the condition
(B4)
Combining equations (Bl), (B2) and (B3) and solving for qs gives:
*, - — « , CB5) XaVa
Because of dilution with wastewater, the biomass concentration in the respiration chamber is lower that that in the aeration tank. Using
i - - * - (B6) X . 4,+«s
we obtain:
«. - 7 J ? IV91 CB7)
or:
«. - 4^4 2 \ - 2 . - V r - - (B8) «r++T*,0,
From (B7) it follows that, if qs < < qr, the influent sample flow can be approximated by:

196 Appendix B
q° ~ vq> (B9)
When qj is calculated according to equation (B8) and set in the measuring system, the activity in respiration chamber will be equal to that in the aeration tank. However, the measured respiration rate (rr) will differ somewhat from that in the aeration tank (ra). Using (B3) and (B6):
<lr (BIO)
The error of rr relative to ra can be calculated as follows:
r-r„ (BID
Equation B2 demonstrates that the error depends on the ratio of qs and q r Figure B2 shows the relative error as a function of qs/qr, on a practical range, according to equation (Bll). In this study q/q,. is not larger that 0.007. Thus the error of rr relative to ra, caused by the dilution with wastewater does not exceed 0.7%.
-0.002
,« -0.004
f -0.006
-0.008
-0.01
\ v
\
; \ . ;
\ ^
0.002 0.004 0.006 0.008 0.01 qs/qr
Figure B2: Error of the measured respiration rate relative to the respiration rate in the aeration tank.

Appendix B 197
Notation
symbols
a = activity q = flow r = respiration rate s = BODst in aeration tank v = volume x = biomass concentration
subscripts a = aeration tank i = influent s = influent sample r = respiration chamber

198
Dankwoord
Ik bedank iedereen die heeft bijgedragen aan het tot stand komen van dit proefschrift. Een aantal mensen wier aandeel is terug te vinden in dit boekje wil ik noemen:
Mijn co-promotor Bram Klapwijk heeft met behulp van zijn nog net ontwarbare schema's een aanzet gegeven tot de meeste eksperimenten. Hij is een goede raadgever met een scherp oog voor dreigend improduktief perfektionisme.
Mijn promotor Bert Lijklema heeft de manuskripten steeds kritisch doorgenomen. Stof voor overweging leverden de besprekingen op. Eenmaal verwerkt hebben zijn kanttekeningen de wetenschappelijke kwaliteit van de tekst verbeterd.
Jag tackar Gustaf Olsson för att jag fick tillfälle att arbeta under ett halvt âr pà hans avdelning Industriell Elektroteknik och Automation vid Lunds Tekniska Högskola. Det war genom hans entusiasm och kreativitet nâgra idéer förvandlades tili utförbara procedurer. Att skriva en publikation med Gustaf som medförfattare ar en glädje.
Paul Ossenbruggen (Department of Civil Engineering, University of New Hampshire, Durham, USA) kwam op het idee respirometrie toe te passen bij het valideren van een nitrifikatiemodel en de eksperimentele resultaten statistisch te verwerken. Het laatste hoofdstuk van dit proefschrift heb ik hem te danken. Het kommentaar van Bert Hameiers en Paul's kollega's Ernst Linder en Marie Gaudard is in dit hoofdstuk verwerkt.
Hardy Temmink heeft een veelzijdige bijdrage geleverd. Onze diskussies over ideeën, theorièn, vakliteratuur en onderzoek brachten de verwarring steeds op een hoger peil. Bruikbaar waren zijn experimentele gegevens en zijn kritiek op de manuskripten.
Rob Roersma heeft de filtraties en analyses voor de afvalwaterkarakterisering verricht. Dit was een hele geruststelling want hij verstaat de kunst lastig hanteerbare monsters te behandelen.
Dieke van Doorn heeft de stikstofanalyses voor de nitrifikatieproeven gedaan. Door haar efficiente werkwijze konden wij de monsterfrekwentie opvoeren en daarmee de statistische relevantie van de meetresultaten vergroten.
Aart van Amersfoort en Hans Donker hebben technische assistentie gegeven bij het beheren van de proefinstallatie. De eerstgenoemde heeft bovendien het eerste respiratievaatje gemaakt, waarvan de uitvoeringsvorm nog altijd funktioneel is.
Mare van der Maarel en Stefanie Oude Elferink hebben eksperimenteel werk gedaan als behorend tot hun doktoraalstudie. Het doet me goed dat beiden nu ook met een promotieonderzoek bezig zijn.

199
Curriculum vitae
Henri Spanjers is in 1957 geboren in Roermond. In 1978 begon hij met de studie Milieuhygiëne aan de Landbouwuniversiteit. Na het behalen van het kandidaatsdiploma in 1981 bracht hij de praktijktijd door aan het "Institut für Wasser-, Boden- und Lufthygiëne" in Berlijn en aan het "Département de Chimie Minérale et Analytique de l'Université de Genève". In 1985 behaalde hij het doktoraaldiploma met als vakken waterzuivering, fysische chemie en bodemverontreiniging. Vanaf 1985 is hij in dienst van de vakgroep Milieutechnologie van de Landbouwuniversiteit en heeft hij gewerkt aan diverse projekten op het gebied van de respirometrie. In 1988 is hij begonnen met het onderzoek dat tot dit proefschrift heeft geleid. Een gedeelte van het onderzoek is gedurende een halfjaar aan de "Lunds Tekniska Högskola" in Zweden uitgevoerd.