using registries in practice, quality improvement, research, and education elizabeth o. kern, md,...
TRANSCRIPT

Using Registries in Practice, Quality Improvement, Research, and EducationElizabeth O. Kern, MD, MS, Susan R. Kirsh, MD, and
David C. Aron, MD, MS, Center for Quality Improvement Research, VA Medical Center,
Cleveland, OH and QUERI-DM
Objectives:Objectives: To understand the link between Registry To understand the link between Registry
data structure and its functionality.data structure and its functionality. To understand how a Registry can be To understand how a Registry can be
created from the VISTA database.created from the VISTA database. To understand how a disease Registry can To understand how a disease Registry can
be used to in quality improvement, be used to in quality improvement, education, and research.education, and research.

OutlineOutline Context for registry use: Chronic Care Models and Context for registry use: Chronic Care Models and
Systems Redesign based on such modelsSystems Redesign based on such models Development of the Cleveland VAMC Diabetes Development of the Cleveland VAMC Diabetes
Registry from the VISTA DatabaseRegistry from the VISTA Database Using the Diabetes Registry in PracticeUsing the Diabetes Registry in Practice
Identification of patients at high cardiovascular risk for Identification of patients at high cardiovascular risk for targeted interventionstargeted interventions
Identification of patients and provision of self-management Identification of patients and provision of self-management assistance.assistance.
Using the Diabetes Registry in Quality Improvement Using the Diabetes Registry in Quality Improvement and Researchand Research Analyses for managersAnalyses for managers Audit and feedback for staff providers Audit and feedback for staff providers Evaluation of quality improvement projectsEvaluation of quality improvement projects Registry as a research data baseRegistry as a research data base
Using the Diabetes Registry in EducationUsing the Diabetes Registry in Education Audit and feedback for traineesAudit and feedback for trainees

The Context for Registries The various models for management of chronic The various models for management of chronic
illness have one feature common: information Rx to illness have one feature common: information Rx to care for both the sick patient and sick systemcare for both the sick patient and sick system
WHO
Improving Care for People with Long-Term Conditions: A Review of UK and International Frameworks. NHS Institute of Innovation, 2006

Shared Medical Appointments (Group Visits) Based on the Wagner Chronic
Care Model
MD trainee
ACGME Competencies•Systems Based Practice•Knowledge•Professionalism•PBLI•Patient Care•Interpersonal/ Communication Skills
Other Outcomes•Individual Self-Efficacy•Team Self-efficacy•Shared Perspectives•Teamwork•Attitudes towards collaboration
Organizational Outcomes•Culture/Climate•Efficiency/Innovation/Responsiveness
Patient Outcomes•Physiologic•Satisfaction•Cost•Functional status
Organizational Context
Healthcare Organization
Registry
System Redesign
Shared Medical
Appointment
Clinical Information Systems
Self-Management Support
Community Resources
Prepared ProacticeTeam with Trainees
Prepared Activated
Patient
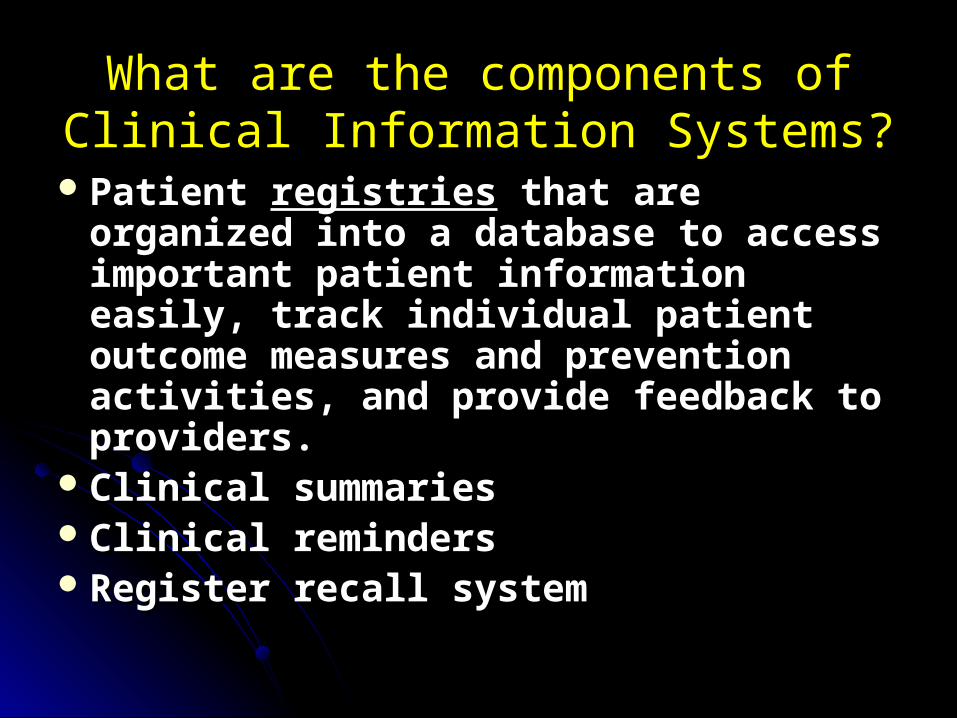
What are the components of Clinical Information Systems?
Patient Patient registriesregistries that are organized that are organized into a database to access important into a database to access important patient information easily, track patient information easily, track individual patient outcome measures individual patient outcome measures and prevention activities, and provide and prevention activities, and provide feedback to providers.feedback to providers.
Clinical summaries Clinical summaries Clinical reminders Clinical reminders Register recall system Register recall system
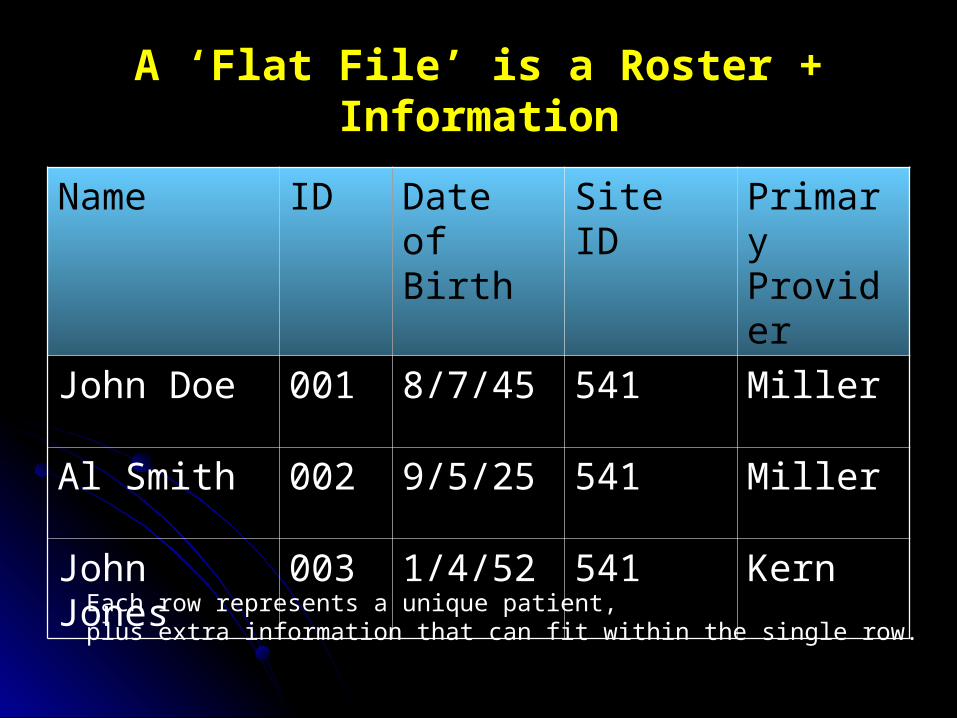
A ‘Flat File’ is a Roster + Information
Name ID Date of Birth
Site ID Primary Provider
John Doe 001 8/7/45 541 Miller
Al Smith 002 9/5/25 541 Miller
John Jones 003 1/4/52 541 Kern
Each row represents a unique patient, plus extra information that can fit within the single row.

A Table is Structured by its ‘Attributes’ and its ‘Primary Key’
Patient NamePatient IDSite IDDate of BirthPrimary Care
Provider
Primary Key ‘Attributes’
are the column headings

Tables are Linked to Other Tables by the Primary Key
ID is the ‘Primary Key’ linking this Pharmacy Table to the DemographicTable.
ID Medication Fill Date
Prescribing Provider
001 Metformin 5/6/06 Miller
001 NPH insulin
5/6/06 Miller
001 Metformin 8/1/06 Miller

Linked Tables in the Cleveland VAMC Diabetes Registry

Data Flow from the Database to Web Page
Diabetes Registry
Database
Step 1:Nightly Data Pull Step 2: SQL Stored Procedures
Data Warehouse
VISN 10 VISTA
Step 3: A
SP.NET platfo
rm
Step 4: S
tandard
Querie
s in C#
VA Intranet Web Page
‘Live’ Data Reports by User Request

Data Flow Software VISTA data VISN 10 SQL Data
Warehouse KB-SQL in a SSIS-SQL Package
SQL Data Warehouse Diabetes Registry SQL Relational Database SQL Stored Procedures (helps to run standard queries faster)
Diabetes Registry Web Page ASP.NET 2.0 platform C# programming language to create standard queries Design tool is Visual Studio 2005
Web Page reports Clinical User Excel Spreadsheets Microsoft ‘Mail Merge’ generates templated letters to patients

Analytic Software
To pull data from the Diabetes Registry for ad hoc analyses SQL ‘Query Analyzer’
To place data in analytic format Notepad .txt tab delimited file Excel spreadsheet
For data management and analysis SAS statistical analytic program SAS datasets
For security and confidentiality All files (including SAS working files) remain behind the VA
firewall, on a server drive, in folders limited to specific users
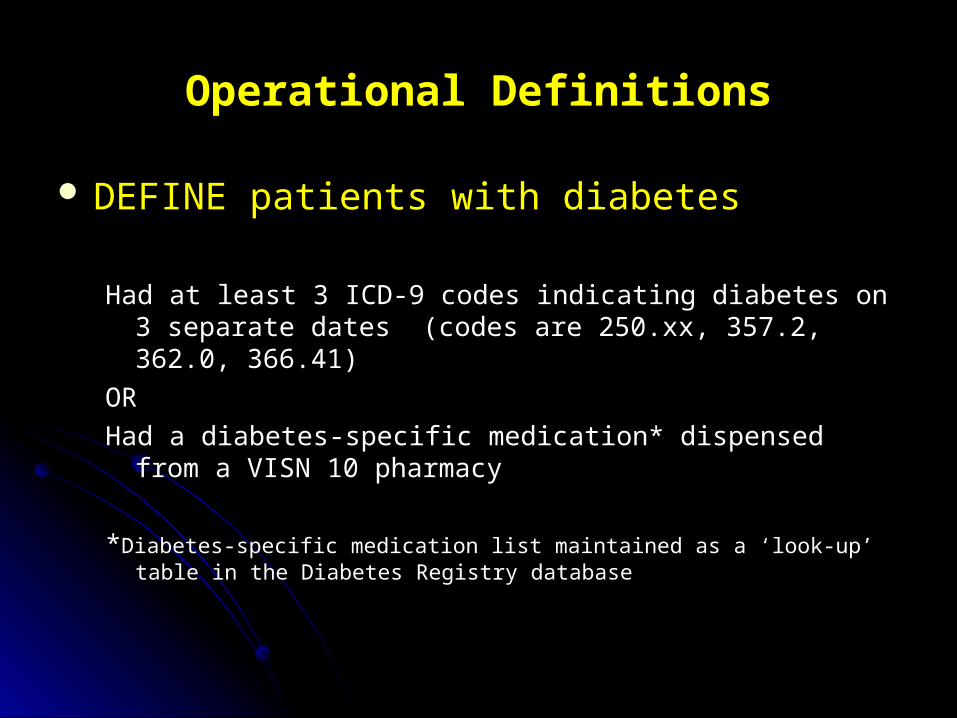
Operational Definitions
DEFINE patients with diabetesDEFINE patients with diabetes
Had at least 3 ICD-9 codes indicating diabetes on 3 Had at least 3 ICD-9 codes indicating diabetes on 3 separate dates (codes are 250.xx, 357.2, 362.0, 366.41)separate dates (codes are 250.xx, 357.2, 362.0, 366.41)
OROR
Had a diabetes-specific medication* dispensed from a VISN Had a diabetes-specific medication* dispensed from a VISN 10 pharmacy10 pharmacy
**Diabetes-specific medication list maintained as a ‘look-up’ table in the Diabetes-specific medication list maintained as a ‘look-up’ table in the Diabetes Registry databaseDiabetes Registry database
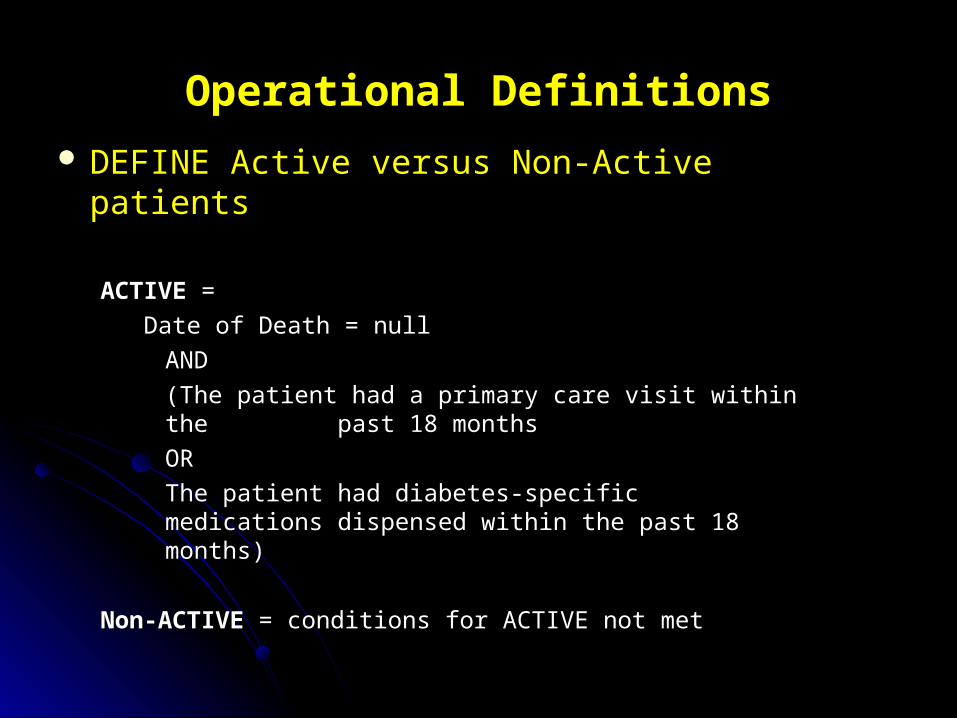
Operational Definitions DEFINE Active versus Non-Active DEFINE Active versus Non-Active
patientspatients
ACTIVEACTIVE = =
Date of Death = nullDate of Death = null
ANDAND
(The patient had a primary care visit (The patient had a primary care visit within the within the past 18 monthspast 18 months
OROR
The patient had diabetes-specific The patient had diabetes-specific medications medications dispensed within the past 18 dispensed within the past 18 months)months)
Non-ACTIVENon-ACTIVE = conditions for ACTIVE not met = conditions for ACTIVE not met
Operational Definitions
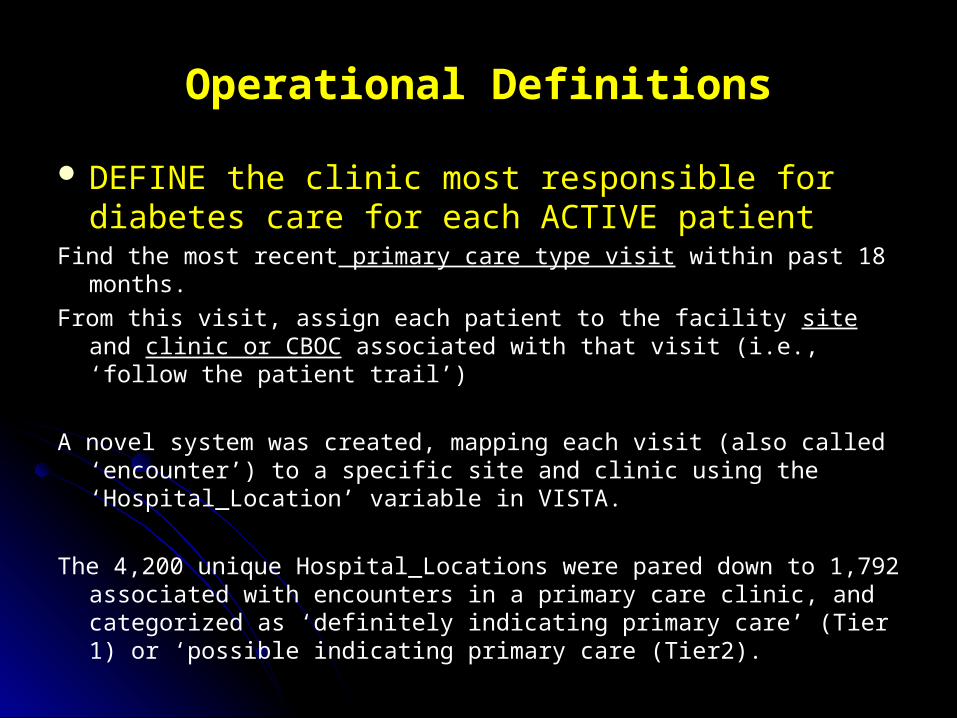
DEFINE the clinic most responsible for diabetes care for each ACTIVE patient
Find the most recent primary care type visit within past 18 months.
From this visit, assign each patient to the facility site and clinic or CBOC associated with that visit (i.e., ‘follow the patient trail’)
A novel system was created, mapping each visit (also called ‘encounter’) to a specific site and clinic using the ‘Hospital_Location’ variable in VISTA.
The 4,200 unique Hospital_Locations were pared down to 1,792 associated with encounters in a primary care clinic, and categorized as ‘definitely indicating primary care’ (Tier 1) or ‘possible indicating primary care (Tier2).

Mapping 1,792 ‘Hospital Locations’ to 51 Different Clinics in VISN 10
(Hospital Location’ is a variable included in each visit or encounter)
EXAMPLE:
Hospital Location Variable Site ID Tier Map To:
A PCM/FERRIS/WHITE 541 1 Cleveland Akron
A PCM/HONG/WHITE 541 1 Cleveland Akron
A PCM/WOMENS HEALTH/HONG 541 1 Cleveland Akron
A ABI/NURSING 541 2 Cleveland Akron
A ADMN PROCESSING 541 2 Cleveland Akron
A ANTICOAG 541 2 Cleveland Akron
A ANTICOAG/LAB 541 2 Cleveland Akron
Assigning the Primary Care Provider
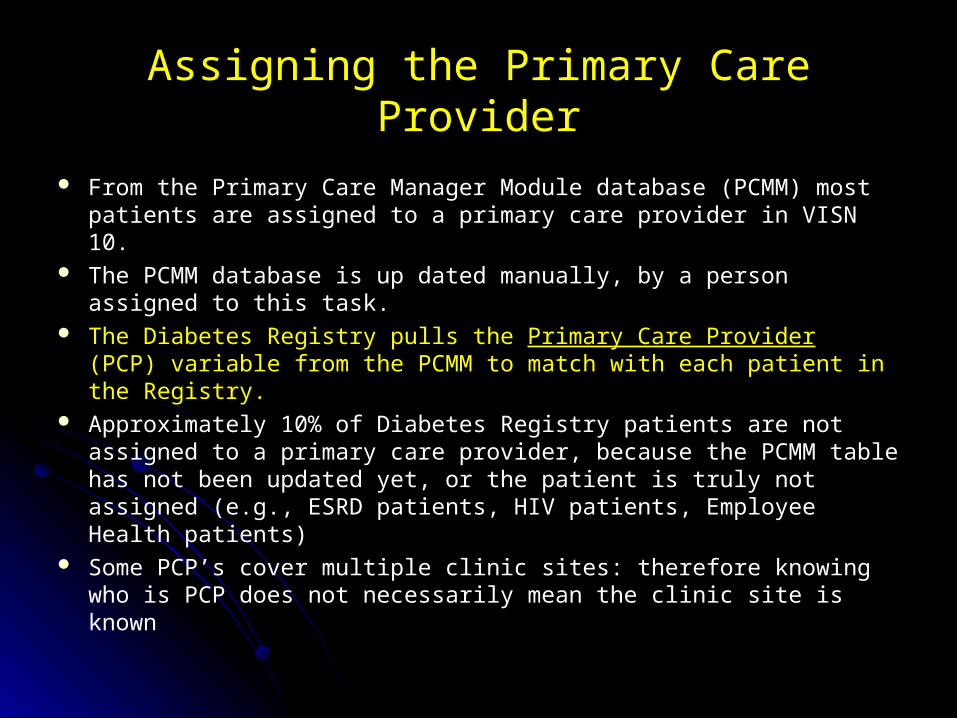
From the Primary Care Manager Module database (PCMM) most patients are assigned to a primary care provider in VISN 10.
The PCMM database is up dated manually, by a person assigned to this task.
The Diabetes Registry pulls the Primary Care Provider (PCP) variable from the PCMM to match with each patient in the Registry.
Approximately 10% of Diabetes Registry patients are not assigned to a primary care provider, because the PCMM table has not been updated yet, or the patient is truly not assigned (e.g., ESRD patients, HIV patients, Employee Health patients)
Some PCP’s cover multiple clinic sites: therefore knowing who is PCP does not necessarily mean the clinic site is known

Data Cleaning
Problem: Text values appear in what is supposed Problem: Text values appear in what is supposed to be a numeric result fieldto be a numeric result field Example: LDL-c = ‘comment’Example: LDL-c = ‘comment’ Example: HbA1c = ‘not done’Example: HbA1c = ‘not done’
Problem: Multiple ‘names’ and ‘codes’ for the Problem: Multiple ‘names’ and ‘codes’ for the same lab testsame lab test Example: 14 different ‘names’ for the A1c test in VISN 10Example: 14 different ‘names’ for the A1c test in VISN 10 Example: 13 different ‘Test-ID’s’ for the A1c test in VISN Example: 13 different ‘Test-ID’s’ for the A1c test in VISN
1010 Example: 3 different ‘National VA Lab Codes’ for the A1c Example: 3 different ‘National VA Lab Codes’ for the A1c
test in test in VISN 10, or a National VA Lab code VISN 10, or a National VA Lab code is not assignedis not assigned

How Many Ways to Name an A1c Test?
Site ID Test ID NameNational VA
Lab Code
538 1751 ZZHGB A1C 85052
538 1869 ~AT-HBA1C NULL
538 5172 HEMOGLOBIN A1C, MEASURED 85052
538 5414 ZZZHEMOGLOBIN A1C,MEASURED NULL
539 5141 HEMOGLOBIN A1C,CALC(d/c,4/17/00) NULL
539 5164 ~HEMOGLOBIN A1C,MEASURED 85053
539 5490 ZZHEMOGLOBIN A1C(NEW,8/06)DO NOT USE!!!! 85053
539 5523 HBA1c-POCT 82117
541 97 HEMOGLOBIN A1C 85053
552 1859 HBA1C 85052
757 97 ZZHgb A1c (no longer orderable) 85052
757 5122 HEMOGLOBIN A1C, MEASURED 85053
757 5210 HEMOGLOBIN A1C, IN-HOUSE 85053
757 5588 HEMOGLOBIN A1c 85053

Using the Diabetes Registry for Population-Based Disease
Management Find the patients who are outliers in
A1c LDL-c Blood pressure Foot exam Eye exam
Group by clinic/provider with primary responsibility to these patients for diabetes management

Using the Diabetes Registry for Population-Based Disease
Management Create spreadsheets for patient calls for special
interventions at clinic level or provider level
Merge the spreadsheets into templated letters for special interventions at clinic level or provider level
Create individualized ‘Diabetes Report Cards’ containing the five parameters used for EPRP to send to patients by mail, or to use in group classes
Include the Diabetes Medication Profile in order to group patients needing insulin starts or titration Example: patients with A1c > 9%, on 2 oral meds, need to start
HS NPH
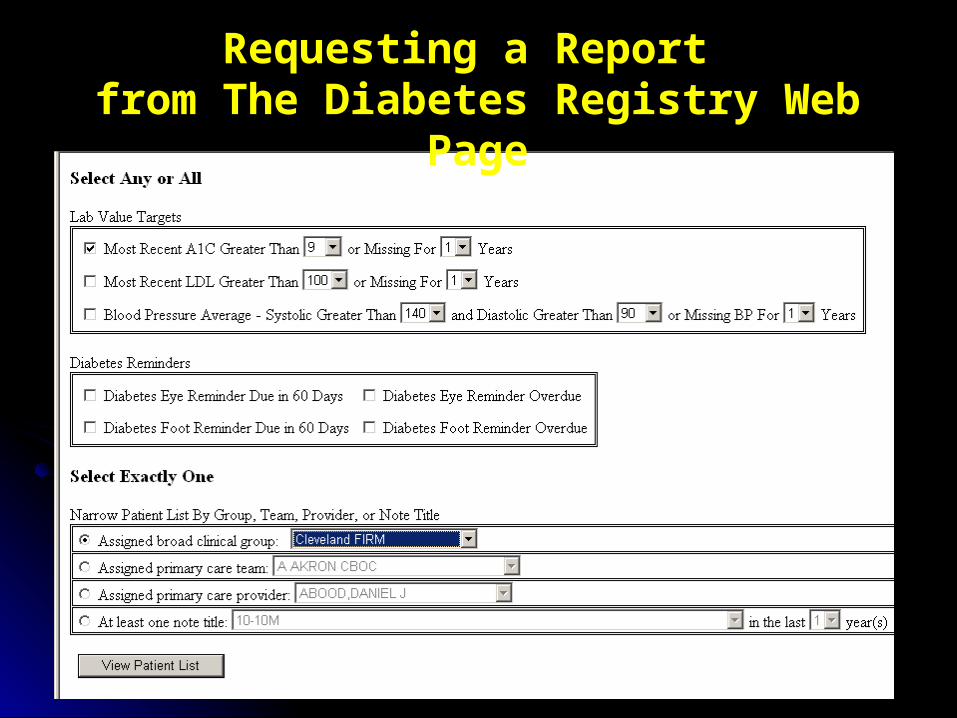
Requesting a Report from The Diabetes Registry Web
Page
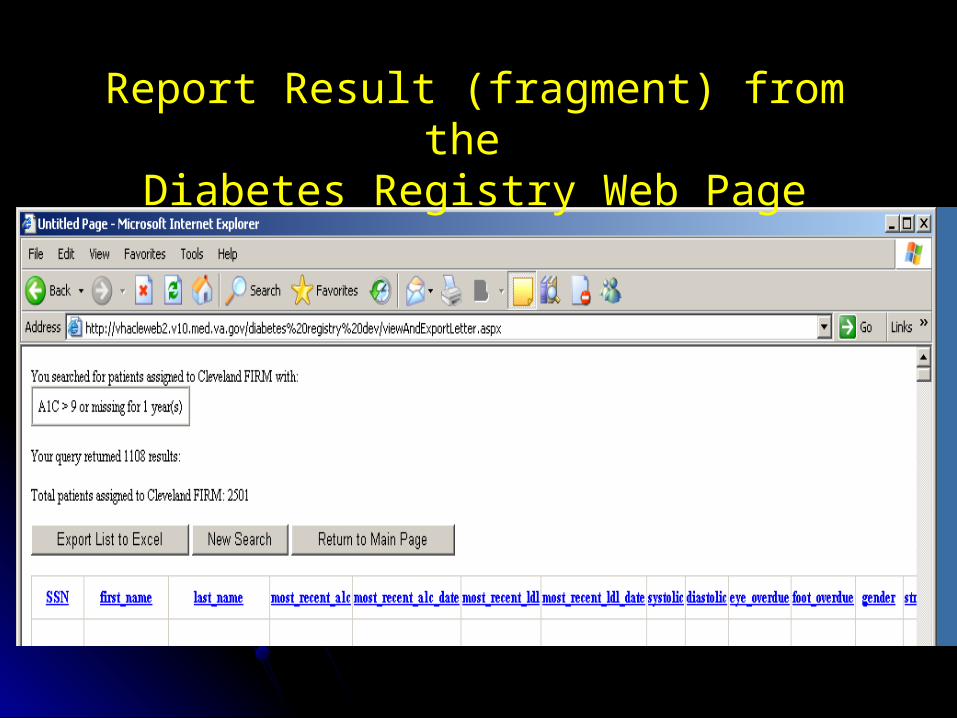
Report Result (fragment) from the Diabetes Registry Web Page

Cleveland VA July 27, 2007
Dear JOHN DOE,Happy Birthday! Your VA health care providers want you to have many more!We are sending you your latest diabetes test results because our VA records show that your blood test for cholesterol is either too high, or needs to be rechecked.
Your LDL-cholesterol (the ‘bad’ kind of cholesterol) should be less than 100 to protect you from stroke or heart attack. Even if your last test was good, you are due to have it checked again.
Your primary provider at the VA Lorain clinic would like you to call L W to go over your results, set up a fasting blood test, or set up a visit.
Please call (440) 244-3833 EXT 2247 to schedule. If you come for a clinic visit, please bring in all of your medication bottles, your blood glucose meter, and any glucose records if you have them. Thanks!
Templated Header to the ‘Birthday Letter’
(From the Diabetes Registry web page: patients in Lorain CBOC
with high or missing LDL-C, with a birthday in July )Underlined text is dropped in according to links and expert logic.
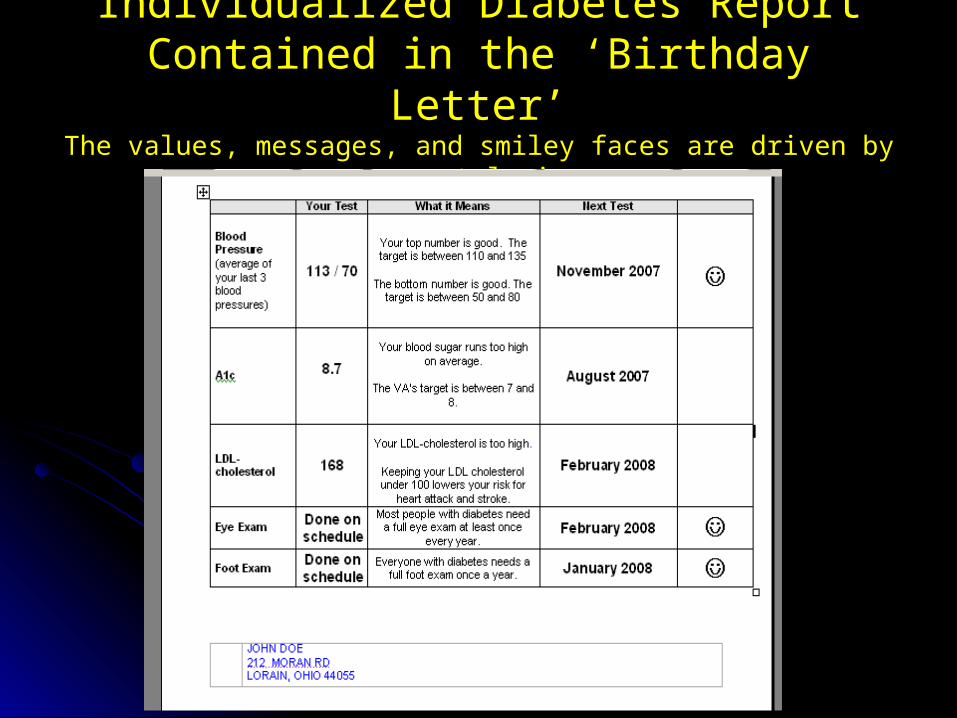
Individualized Diabetes Report Contained in the ‘Birthday Letter’
The values, messages, and smiley faces are driven by expert logic.

Quality Improvement
•How do we know a change is needed?•How do we know a change is an improvement?•How do we know where to put scarce resources?
A Diabetes Registry can provide data to:
•Describe the patient population•Identify patient sub-groups having the most need •Identify who is in the sub-groups•Show the ‘reach’ of intervention programs•Show the outcomes of intervention programs

Growth in the Patient Population with Diabetes in VISN 10
The net growth in live patients with diabetes was 73% over the 5 year period from 2002 to 2006.
By the end of 2006, there were 42,499 patients with diabetes, representing approximately 21-25% of the VISN 10 patient population.
Source:Source: VISN 10 Diabetes Registry VISN 10 Diabetes Registry
24,587
27,517
35,071
38,032
42,499
Patients
2002 2003 2004 2005 2006

DiabetesOR
Nutrition Education
17%
BOTH Diabetes Education AND Nutrition Education
36%
NEITHER Diabetes Education NOR Nutrition Education
47%
Almost Half of Patients Do Not Receive Self-Management Educationfrom the VA
From 2002-2006 looking back for outpatient notes
Diabetes Education =
•diabetes education class
•glucometer class
•diabetes specialty clinic
•diabetes team program
Nutrition Education =
•any nutrition visit.
Source: VISN 10 Diabetes Registry

Target Patients with Poor Glycemic Control
Prioritize by the Prioritize by the
most recent HbA1cmost recent HbA1c
27,031 (64%) are < 7.5%
10,131 (24%) are between 7.5-8.9%
5,278 (12%) are 9% or greater
Source:Source: VISN 10 Diabetes Registry VISN 10 Diabetes Registry
HbA1c Groups
< 7.5% 7.5-8.9% >=9%

Glycemic Control Plus Medication Profiles Can Guide Interventions
High A1c, on no diabetes meds from the VA, may need VA prescription.
High HbA1c, on orals only, may need start of basal insulin and/or carb counting
High HbA1c, on insulin, needs insulin titration and carb counting
Source:Source:
VISN 10 Diabetes RegistryVISN 10 Diabetes Registry
0%
10%
20%
30%
40%
50%
60%
7.5-8.9% >=9%
HbA1c Group
No Agents Orals Only Insulin w/wo Orals

Drop in HbA1c After DSME classes in the Cleveland VAMC
N= 436 N= 436 patientspatients
*Results were same for a subgroup already taking insulin.
Source:Source:
VISN 10 Diabetes VISN 10 Diabetes RegistryRegistry
-2.5
-2
-1.5
-1
-0.5
0
<7% 7-7.9% 8-8.9% >=9%
Change in HbA1c from Pre to Post
-0.1-0.3
-0.8
-2.4
Change in HbA1c%
P < .001 for all strata

Growth of the Nurse Diabetes Case Manager Program in
Cleveland VAMC
0
1000
2000
3000
Patie
nts
S
een
2003 2004 2005 2006
45
810
0
5
10
Case
Managers
2003 2004 2005 2006
From 2003 through 2006, the Diabetes Case Manager program saw 3,886 unique patients.
(~ 20% of Cleveland VA patient population with diabetes).
The program grew from
3 to 10 by 2006.
7 achieved CDE after training for case management.
Source:Source: VISN 10 Diabetes RegistryVISN 10 Diabetes Registry
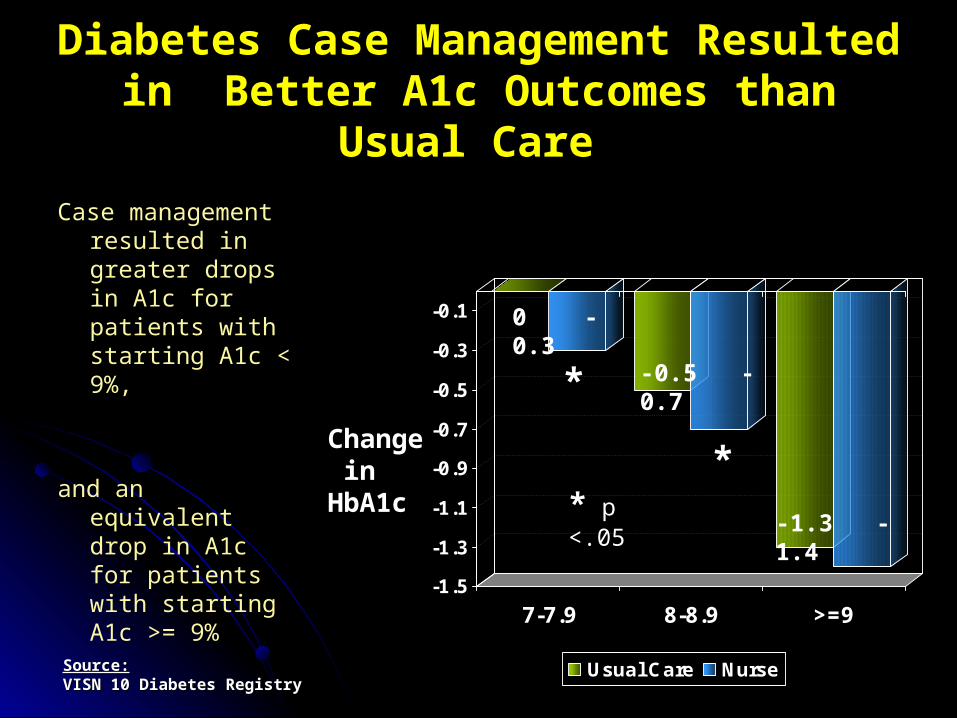
Diabetes Case Management Resulted in Better A1c Outcomes
than Usual Care
Case management resulted in greater drops in A1c for patients with starting A1c < 9%,
and an equivalent drop in A1c for patients with starting A1c >= 9%
-1.5
-1.3
-1.1
-0.9
-0.7
-0.5
-0.3
-0.1
7-7.9 8-8.9 >=9
Usual Care Nurse
0 -0.3
-0.5 -0.7
-1.3 -1.4
*
** p <.05
Change inHbA1c
Source:Source: VISN 10 Diabetes RegistryVISN 10 Diabetes Registry

Dataset (from the VISN 10 Diabetes Registry)
40,632 patients receiving diabetes-specific 40,632 patients receiving diabetes-specific medications in VISN 10 since Jan 2005, and who medications in VISN 10 since Jan 2005, and who are alive.are alive.
~ 9,000 patients in VISN 10 do not receive either ~ 9,000 patients in VISN 10 do not receive either glucose test strips or hypoglycemic agents from glucose test strips or hypoglycemic agents from the VA, but have an ICD-9 code of diabetes. the VA, but have an ICD-9 code of diabetes. These patients were excluded from this analysisThese patients were excluded from this analysis

Thiazolidenedione (TZD) and A1c Outcomes
Within VISN 10, by SiteTotal
Patients on
Diabetes Medicatio
ns
A1c
>=9% A1c
Missing in past
24 months
Patients on TZD,
No
Insulin
Patients on TZD,
With
Insulin
1 3,992 10.8 2.5 14 7
2 6,609 11.3 5.4 21 9
3 5,901 11.7 2.9 12 8
4 18,171 11.7 3.5 5 3
5 5,959 13.2 6.2 9 4

Using Registries in Practice, Quality Improvement, Research, and EducationElizabeth O. Kern, MD, MS, Susan R. Kirsh, MD, and
David C. Aron, MD, MS, Center for Quality Improvement Research, VA Medical Center,
Cleveland, OH and QUERI-DM
Objectives:Objectives: To understand the link between Registry To understand the link between Registry
data structure and its functionality.data structure and its functionality. To understand how a Registry can be To understand how a Registry can be
created from the VISTA database.created from the VISTA database. To understand how a disease Registry can To understand how a disease Registry can
be used to in quality improvement, be used to in quality improvement, education, and research.education, and research.

Shared Medical Appointments (Group Visits) Based on the Wagner Chronic
Care Model
MD trainee
ACGME Competencies•Systems Based Practice•Knowledge•Professionalism•PBLI•Patient Care•Interpersonal/ Communication Skills
Other Outcomes•Individual Self-Efficacy•Team Self-efficacy•Shared Perspectives•Teamwork•Attitudes towards collaboration
Organizational Outcomes•Culture/Climate•Efficiency/Innovation/Responsiveness
Patient Outcomes•Physiologic•Satisfaction•Cost•Functional status
Organizational Context
Healthcare Organization
Registry
System Redesign
Shared Medical
Appointment
Clinical Information Systems
Self-Management Support
Community Resources
Prepared ProacticeTeam with Trainees
Prepared Activated
Patient

The Patient Encounter Personnel
MD, NP/CDE, RN, Pharmacist, Psychologist
8-20 patients/session 90 minutes sessions Return visit interval: 4-8
weeks or until goals achieved
Group activities Education Patient Centered
Discussion Review of labs/medications
Individual activities Medication management Referrals Individualized plan of care
outlined and give to patient

Evaluation of the impact of SMAsKirsh et al. QSHC 2007; in press.
Subjects: Diabetic patients with >1 of: A1c >9% SBP blood pressure >160 mmHg LDL-c >130 mg/dl Patients largely derived from registry data, few referred from
pcp participated in >1 SMA from 4/05 to 9/05.
Study Design: Quasi-experimental with concurrent, but non-randomized
controls patients who participated in SMAs from 5/06 through 8/06.
A retrospective period of observation prior to their SMA participation was used.

Kirsh et al. 2007; in press. Findings
Levels of A1c, LDL-c, and SBP all fell Levels of A1c, LDL-c, and SBP all fell significantly post-interventionsignificantly post-intervention A1c decreased 1.4 (0.8, 2.1) (p<0.001)A1c decreased 1.4 (0.8, 2.1) (p<0.001) LDL-c decreased 14.8 (2.3, 27.4) (p=0.022)LDL-c decreased 14.8 (2.3, 27.4) (p=0.022) SBP decreased 16.0 (9.7, 22.3) (p<0.001). SBP decreased 16.0 (9.7, 22.3) (p<0.001).
The reductions greater in the intervention The reductions greater in the intervention group relative to the control group: group relative to the control group: A1c 1.44 vs -0.30 (p=0.002) for A1cA1c 1.44 vs -0.30 (p=0.002) for A1c SBP 14.83 vs 2.54 mmHg (p=0.04) for SBP. SBP 14.83 vs 2.54 mmHg (p=0.04) for SBP. No diff. for LDL-c 16.0 vs 5.37 mg/dl (p=0.29). No diff. for LDL-c 16.0 vs 5.37 mg/dl (p=0.29).


Registry use in continuing care
Track additional patient data hard coded Track additional patient data hard coded in note for future referencein note for future reference
Monitor progress on patients and give Monitor progress on patients and give report card to providers-pilotreport card to providers-pilot
Birthday letters generated by registry data Birthday letters generated by registry data to engage patients in initiating SMAto engage patients in initiating SMA

Trainee Participation in SMA
Internal Medicine residents and Internal Medicine residents and third year medical students on third year medical students on chronic disease blockchronic disease block
Uses of registry in general to Uses of registry in general to manage populationmanage population
Clinical Information System Clinical Information System modulemodule
Audit and feedback of resident’s Audit and feedback of resident’s primary care panels and teamsprimary care panels and teams

Questions?

References
1. Gliklich RE, Dreyer NA, eds. Registries for Evaluating Patient Outcomes: A User’s Guide. (Prepared by Outcome DEcIDE Center [Outcome Sciences, Inc. dba Outcome] under Contract No. HHSA29020050035I TO1.) AHRQ Publication No. 07- EHC001-1. Rockville, MD: Agency for Healthcare Research and Quality. April 2007.
2. Bodenheimer T, Grumbach K. Electronic Technology A Spark to Revitalize Primary Care? JAMA. 2003;290:259-264