using open source to spatially enable business intelligence (bi) applications geocamp 2008 - ottawa...
TRANSCRIPT

Using open source to spatially enable Business Intelligence (BI) applications
GeoCamp 2008 - Ottawa
Dr. Thierry Badard
Etienne Dubé
GeoSOA research group
Centre for Research in Geomatics
Laval University, Quebec City, Canada

Outline
1. BI for dummies (or BI 101 ;-) )
2. Merging BI and GIS ?
3. Open source software for Geospatial BI GeoKettle: a Spatial ETL tool for data warehousing
Doing Spatial OLAP with Mondrian … towards GeoMondrian
GeoMondrian in action through geo-analytical dashboards
4. Conclusion, thanks and questions

What is BI (Business Intelligence)?
“Business intelligence (BI) is a business management term, which refers to applications and technologies that are used to gather, provide access to, and analyze data and information about company operations.”
– Wikipedia
Examples of components and applications: Data warehousing
Reporting tools
Dashboards
Data mining
On-line Analytical Processing (OLAP)
Something your boss or client is possiblyinterested into, and asked you to investigate.
??
© 2005, United Feature Syndicate

The Data Warehouse
Repository of an organization’s historical data, for analysis purposes.
Primarily destined to analysts and decision makers. Separate from operational (OLTP) systems (source data). Contents are often presented in a summarized form (e.g.
key performance indicators, dashboards). Optimized for:
Large volumes of data (up to terabytes); Fast response to analytical queries (vs. update speed):
de-normalized data schemas (e.g. star or snowflake schemas), summary (aggregate) data, (Multi)dimensional modeling (a dimension per analysis axis).
All data are interrelated according to the analysis axes (datacube paradigm)

Why merge BI and GIS software?
Because …
“About eighty percent of all data stored in corporate databases
has a spatial component” [Franklin 1992]
Franklin, C. 1992. An Introduction to Geographic Information Systems: Linking Maps to Databases. Database, April, pp. 13-21

Why merge BI and GIS software?
Imagine you are a decision maker in public health policy…
You will certainly have difficulties to answer to questions like: Where are the urban spots that are more sensitive to
heat waves, intense rain, flooding or droughts in a specific geographic area?
How many people with cardiovascular, respiratory, neurological and psychological diseases will there be in 2025 and 2050 in a specific geographic area?
How many people with low income live alone in a building requiring major repairs in a specific geographic area?

To answer these questions …
You can use: GIS
Implies the writing of very complex SQL queries
Sometimes, a long and hard job which requires dedicated human resources
Need to be done anew everytime data change or new analyses have to be achieved
Classical BI tools (OLAP clients, reporting tools) Unable to handle the spatial dimension of data (or only a
very basic support)
Merging GIS and BI tools (e.g. Spatial OLAP) To fully exploit the spatial component No need to write any SQL statements, just click away!.

Allow mixing maps, diagrams and cross-tabs to analyse ...

# of people with respiratory diseases, by sex, at a specific spatial level

to visually cross data: average temp. and % hospitalisation due to respiratory diseases

To assess the temporal evolution of heat waves (for 2001, 2025 and 2050)

To know # of person living alone by age and by sex

To know the # of public buildings (school, hospital, …) in a flooding area in case of emergency situations

Spatial drill down (by level) operation

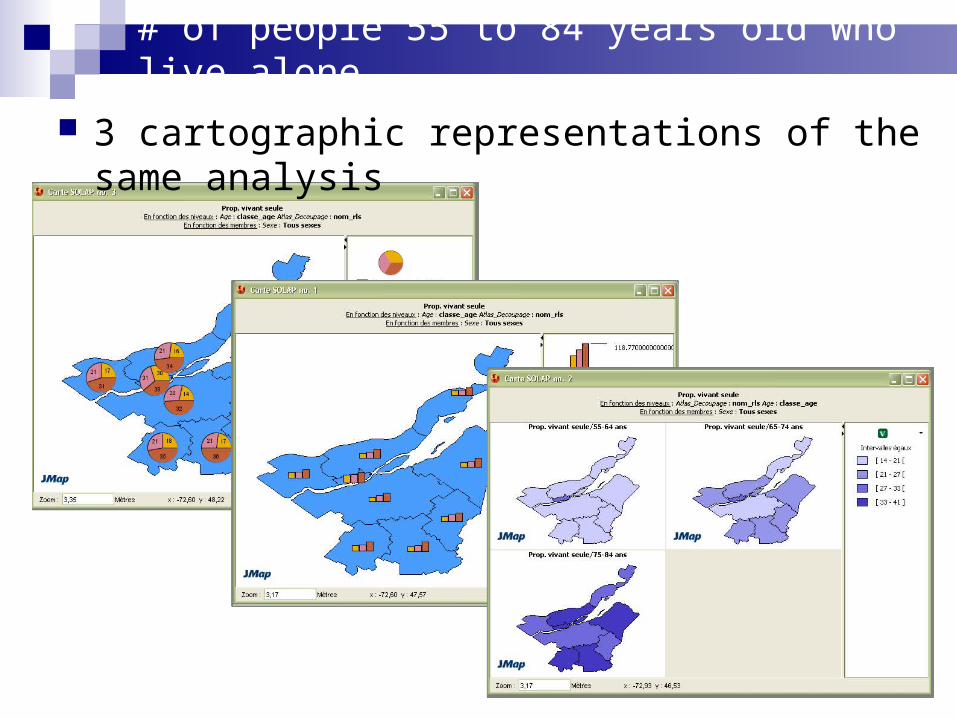
# of people 55 to 84 years old who live alone
3 cartographic representations of the same analysis

# of people 55 to 84 years old who live alone
3 cartographic representations of the same analysis
# of people 55 to 84 years old who live alone
3 cartographic representations of the same analysis

# of people 55 to 84 years old who live alone
3 cartographic representations of the same analysis
The previous screenshots come from a prototype developed on JMap Spatial OLAP software from Kheops Technology in the SII-41 project “An innovative interactive web tool to better understand climate-related health vulnerabilities” (co-leaders : Profs. Pierre Gosselin and Thierry Badard) funded by the GEOIDE NCE in Geomatics

Components of a Spatial BI infrastructure ?
ETL systems
Data loading
Data sources(OLTP systems)
Dataextraction
Data Warehouse OLAP
Reporting tools
Data mining
Spatial business intelligence
GIS file formats,Web Feature Services,
Spatial DBMS
Spatial ETL Spatial DBMS
SOLAP,Spatial data
mining,Map-driven
dashboards, …

Introduction to ETL
A type of software used to populate the data warehouse, from one or many OLTP (OnLine Transaction Processing) data sources.
ETL: Extract data from operational sources;
Transform it, to correct errors, conform it to defined standards and restructure contents to fit target schema;
Load data into the warehouse.
ETL handles both the insertion of new data and the update of existing data.

Pentaho Data Integration (Kettle project)
Free software (LGPL) ETL tool, built with Java.
Originally developed by Matt Casters (www.ibridge.be).
LGPL since december 2005. Acquired by Pentaho Corp.
(an open source BI company) in April 2006.
Runs on Windows, Linux, MacOS X and any other platform supporting Java & SWT.
http://kettle.pentaho.org

GeoKettle: a geo-enabled version of Kettle
Kettle handles typical SQL data types:Number, String, Date, Boolean, Integer, BigNumber, Binary
What do we need to do to add support for geospatial vector data? A native Geometry data type.
Some I/O support for vector GIS files and DBMS.
Transformation steps for: topological predicates (intersects, contains, …)
spatial analysis (overlays, buffers, …)
Scripting support for Geometry objects (JavaScript).

(Geo)Kettle’s GUI
Using Spoon to create a GeoKettle ETL transformation:

Geometry data type
Kettle data types apply to Value objects, each value corresponding to a field in a row.
We added a new Geometry data type, based on the GeOxygene framework.(http://oygene-project.sourceforge.net)

I/O of geospatial data
We have implemented native supportfor PostGIS 1, using its PostgreSQLJDBC Wrapper. Values read from/written to GEOMETRY columns are
transparently converted back and forth between PGGeometry and GeoKettle’s native Geometry objects.
No need to use AsText() and GeomFromText() !
Also read-only support for Shapefiles(using GeoTools 2). Geometries converted to Geometry type, and other
alphanumeric fields (in DBF file) converted to appropriate basic types.
1. PostGIS is Refractions Research’s spatial extension for PostgreSQL: postgis.refractions.net2. GeoTools is an open source Java GIS toolkit: geotools.codehaus.org
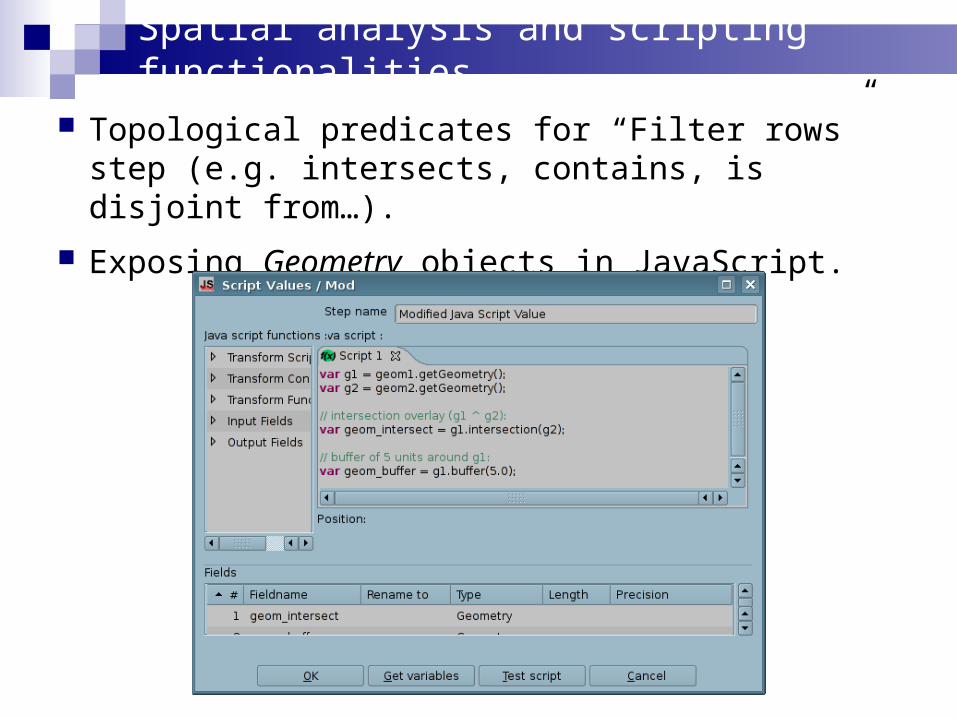
Spatial analysis and scripting functionalities
Topological predicates for “Filter rows” step (e.g. intersects, contains, is disjoint from…).
Exposing Geometry objects in JavaScript.

GeoKettle is available!
Released on May 31, 2008 for GeoCamp2008! ;-)
OS contribution of the GeoSOA research group
Under LGPL License (like Kettle)
Project page : http://geosoa.scg.ulaval.ca

Upcoming features for GeoKettle
Read/write support for more GIS file formats (supported by GeoTools) and DBMS (e.g. Oracle Spatial).
A GUI transformation step for spatial analysis.
Enforcement of SRIDs and native support for coordinate system transformations.
Embedded map viewer (for spatial transformation preview).
Add of data matching and conflation steps in order to allow geometric data cleansing and comparison of geospatial datasets.
Migration of the GeoKettle extensions to the new Pentaho Data Integration version 3.x codebase
… should be available in the next release.
So help and proposals for other spatial extensions from community are welcome!

Components of a Spatial BI infrastructure ?
ETL systems
Data loading
Data sources(OLTP systems)
Dataextraction
Data Warehouse OLAP
Reporting tools
Data mining
Spatial business intelligence
GIS file formats,Web Feature Services,
Spatial DBMS
Spatial ETL Spatial DBMS
SOLAP,Spatial data
mining,Map-driven
dashboards, …

Introduction to OLAP and Spatial OLAP
OLAP – On-Line Analytical Processing
“… is an approach to quickly providing answers to analytical queries that are multidimensional in nature.”
– Wikipedia
Insistence on quick: response time < 5-10 seconds
OLAP server and query languages (MDX) to perform requests on large data warehouses.
OLAP clients: Cross-tabs
Charts (histograms, pie charts, graphs)
Spatial OLAP (SOLAP) adds support for geospatial data (map displays and interaction).

Mondrian (Pentaho Analysis Services)
Mondrian is an open source(Common Public License)OLAP server, written in Java.
Originally developed by Julian Hyde, since 2001. Acquired by Pentaho Corp. in November 2005.
Uses MDX as its query language.
JDBC connections to data sources (ROLAP).
FOSS projects using Mondrian: JPivot (JSP-based web OLAP client)
Other Pentaho BI components
JRubik (desktop OLAP client, with Swing GUI)
http://mondrian.pentaho.org

Using geospatial data with Mondrian
We have a data warehouse based on PostgreSQL + PostGIS. Let’s serve Spatial OLAP cubes from that!
Solution: use PostGIS JDBC wrapper with Mondrian: We can define spatial member properties for
GEOMETRY columns in the cube schema.
The client application retrieves the spatial property value and casts it to org.postgis.PGgeometry.
Display it on a map, do spatial analysis and other funky stuff.

Upcoming work: towards GeoMondrian
Unlike other projects combining GIS and OLAP and as far as we know, this approach is the first to integrate geo objects as part of the cube (instead of fetching them from an external spatial DBMS or GIS file).
Implement a native geospatial MDX data type in Mondrian… … to uniformise handling of geodata, regardless of
source DBMS (PostGIS, Oracle Spatial).
… to enable the development of Geospatial MDX extensions (spatial analysis and aggregate functions).
Work is ongoing …

GeoMondrian in action!
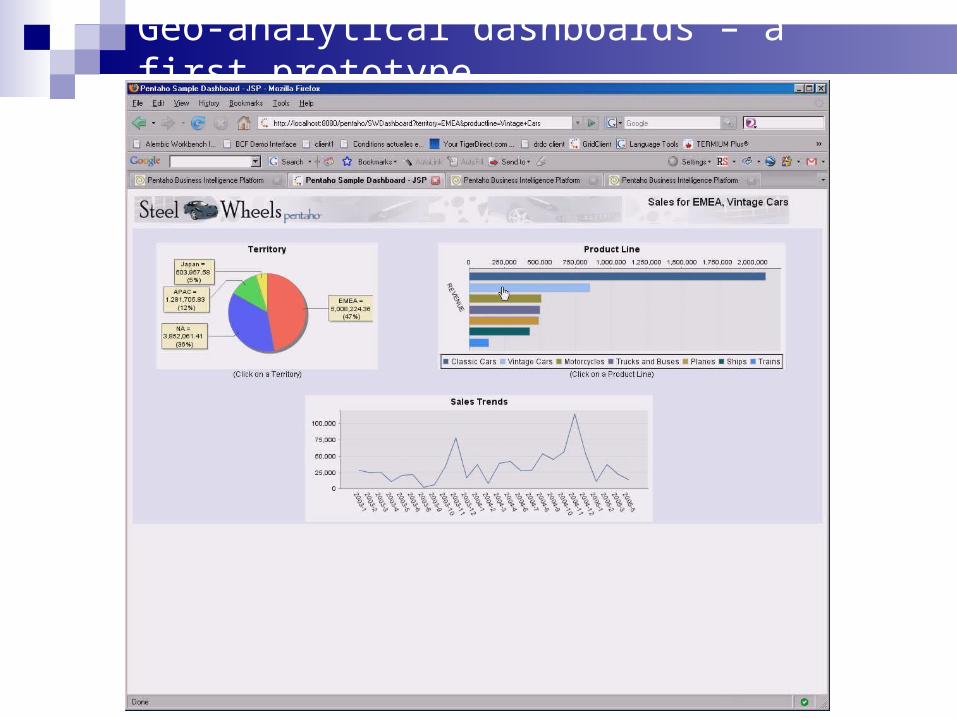
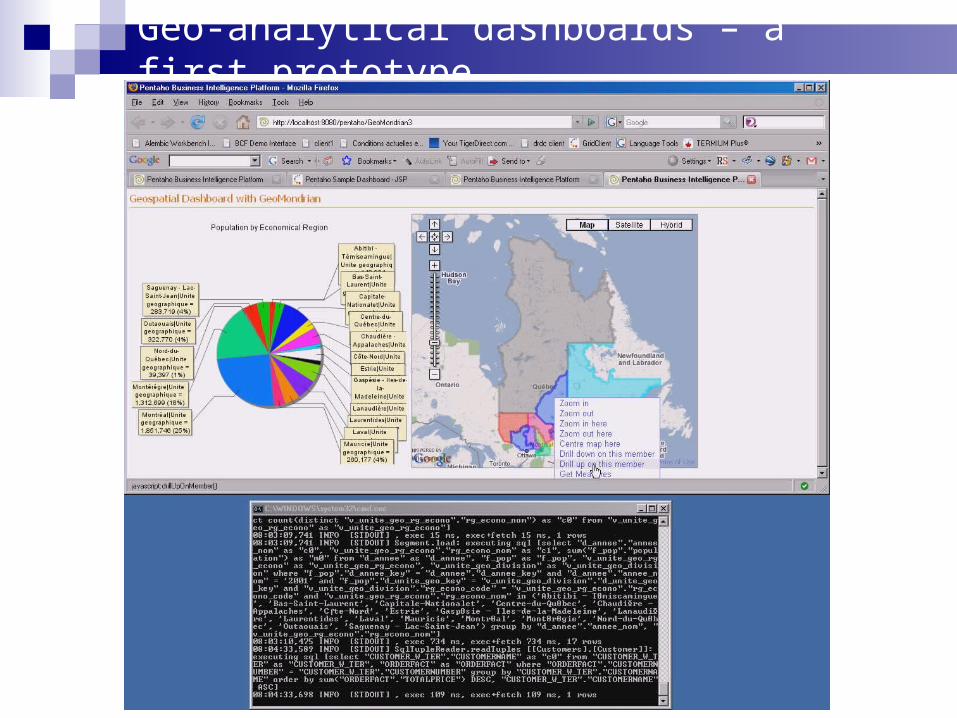
To achieve a complete Geospatial BI solution, develop graphical and web front-ends such as dashboards combining cross-tabs, charts and map displays. A first prototype (see next slides) based on Pentaho
dashboards (which includes a Google Maps component)
A video demo is available on http://geosoa.scg.ulaval.ca

Geo-analytical dashboards – a first prototype

Geo-analytical dashboards – a first prototype

Geo-analytical dashboards – a first prototype

Geo-analytical dashboards – a first prototype
Geo-analytical dashboards – a first prototype

Geo-analytical dashboards – a first prototype

Geo-analytical dashboards – a first prototype

Geo-analytical dashboards – a first prototype

Geo-analytical dashboards – a first prototype

Geo-analytical dashboards – a first prototype

Geo-analytical dashboards – a first prototype

Geo-analytical dashboards – a first prototype
Geo-analytical dashboards – a first prototype

Geo-analytical dashboards – a first prototype

Geo-analytical dashboards – a first prototype

Geo-analytical dashboards – a first prototype

GeoMondrian in action!
To achieve a complete Geospatial BI solution, develop graphical and web front-ends such as dashboards combining cross-tabs, charts and map displays. A first prototype (see next slides) based on Pentaho
dashboards (which includes a Google Maps component)
A video demo is available on http://geosoa.scg.ulaval.ca
Towards a tool to produce geo-analytical dashboards One of the OSGeo projects funded by the Google Summer of
Code 2008 program ! (student: Étienne Dubé) Based on OpenLayers!
Thanks go to OSGeo and Google!
So work is ongoing … Results in September! ;-)

Conclusion
Open source BI is still in its infancy… Open source Geospatial BI is even younger… But now is your chance to participate in the
growth of this new and exciting segment of FOSS4G! ;-)
For further information, demos and future releases of GeoKettle, GeoMondrian and the tool for geo-analytical dashboards, please visit http://geosoa.scg.ulaval.ca.
It opens the door to new exciting R&D issues, such as mobile Spatial BI …

Towards mobile spatial BI …
1. Enhancing data warehouses with terrain data: utilization of location information from users
2. On the field decision-making: delivering geo-analytical data to mobile users

Thanks for your attention …
Questions ?

Appendixes
OLAP and SOLAP vocabulary
Cube Dimension:
Temporal Thematic Geospatial
Hierarchy Level Member Measure
Descriptive Geospatial
Fact

OLAP and SOLAP vocabulary
Cube Dimension:
Temporal Thematic Geospatial
Hierarchy Level Member Measure
Descriptive Geospatial
Fact
Store sales Warehouseinventory
Suppliersorders
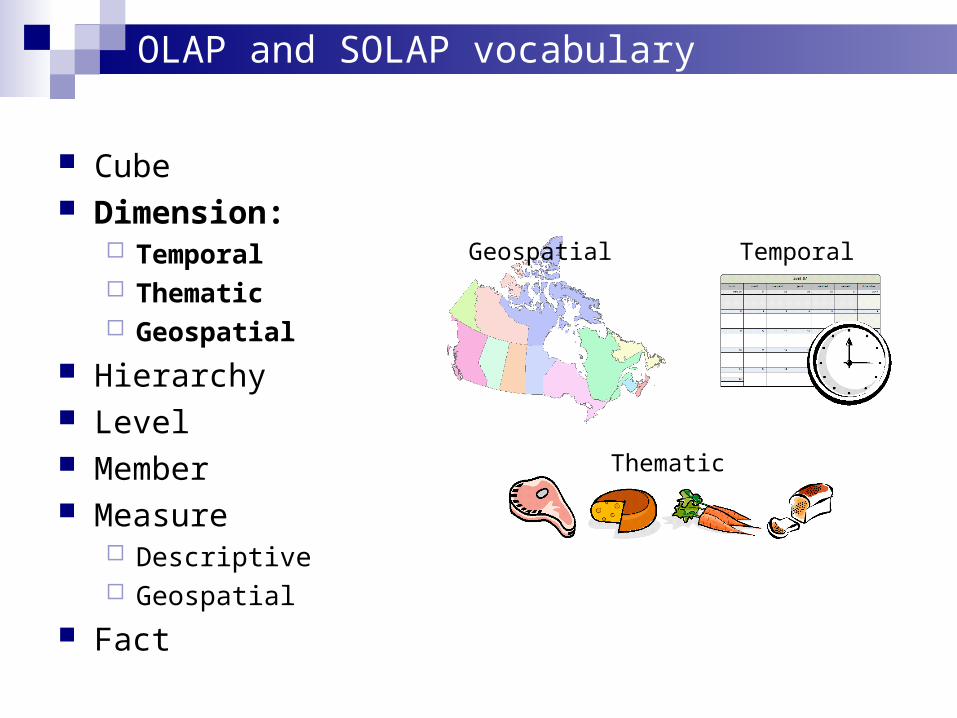
OLAP and SOLAP vocabulary
Cube Dimension:
Temporal Thematic Geospatial
Hierarchy Level Member Measure
Descriptive Geospatial
Fact
Geospatial Temporal
Thematic

OLAP and SOLAP vocabulary
Cube Dimension:
Temporal Thematic Geospatial
Hierarchy Level Member Measure
Descriptive Geospatial
Fact

OLAP and SOLAP vocabulary
Cube Dimension:
Temporal Thematic Geospatial
Hierarchy Level Member Measure
Descriptive Geospatial
Fact
Product
Place
Time
2005-11
Cross
-cou
ntry
skis
Quebe
c City
FactDimensions Measures
Place Time Product Sold units Sales price
Quebec City 2005-11 XC skis 582 $145,500