using ncode designlife for fatigue of composite structures · using ncode designlife for fatigue of...
TRANSCRIPT

HBM Prenscia: Public
© 2016 HBM
Using nCode DesignLife for Fatigue of Composite Structures
Jeff MentleyHBM Prenscia
2016 nCode User Group Meeting
© 2016 HBM October 5-6, 2016 www.ncode.com

HBM Prenscia: Public
© 2016 HBM
3
1. Introduction2. Short Fiber Injection Molded Composites
Material CharacterizationStrain Energy Damage Parameter
3. Continuous Fiber Composite Failure Criteria
Agenda
3
2016 nCode User Group Meeting
© 2016 HBM October 5-6, 2016 www.ncode.com

HBM Prenscia: Public
© 2016 HBM
4
• What is a fibre‐reinforced plastic composite material?
Ideal material when high stiffness‐to‐weight and strength‐to‐weight ratios are required –For example:
Introduction
“A structural composite is a material system consisting of two or more phases on a macroscopic scale, whose mechanical performance and properties are designed to be
superior to those of the constituent materials acting independently.”(Daniel and Ishai, 2006)
BMW i3(fireballbase.com)
Boeing 787 Dreamliner(1001crash.com)
(Bloomberg, 2013)
2016 nCode User Group Meeting
© 2016 HBM October 5-6, 2016 www.ncode.com

HBM Prenscia: Public
© 2016 HBM
5
• Categories of composite materials
Composite Materials
Injection MoldedMolding
Compound
Continuousfibers
Discontinuous fibers
Particulate filler Other(e.g. sandwiches)
2016 nCode User Group Meeting
© 2016 HBM October 5-6, 2016 www.ncode.com

HBM Prenscia: Public
© 2016 HBM
6
• Categories of composite materials
Composite Materials
Unidirectional Woven fabrics Laminates
ContinuousFibers
Discontinuous Fibers
Particulate filler Other(e.g. sandwiches)
Unidirectional composite lamina(Jones, 1999)
Longitudinal direction
Transverse direction Fill
direction
Warp direction
Woven composite lamina(Jones, 1999)
Unbounded view of a laminate(Jones, 1999)
2016 nCode User Group Meeting
© 2016 HBM October 5-6, 2016 www.ncode.com

HBM Prenscia: Public
© 2016 HBM
Short Fiber Injection Molded Composites
7
2016 nCode User Group Meeting
© 2016 HBM October 5-6, 2016 www.ncode.com

HBM Prenscia: Public
© 2016 HBM
8Flow of material into mold controls microstructure
Courtesy of
Resulting material is:• Inhomogeneous• Anisotropic• Temperature sensitive• Environment sensitive (polyamides)• Viscous component to behaviour
2-D random
fibers alignedwith flow
fibers aligned transverse to flow
FLOW
Skin-core effect
2016 nCode User Group Meeting
© 2016 HBM October 5-6, 2016 www.ncode.com

HBM Prenscia: Public
© 2016 HBM
9Process Modelling for Fatigue
Damage,LIFE
Manufacturing simulation
Microstructureorientation, aij
Fatigue material model
Basic material information and fatigue test
data
Structural FE calculation
Structural material model
Basic material information and physical test
data
Fatigue simulation Loading
2016 nCode User Group Meeting
© 2016 HBM October 5-6, 2016 www.ncode.com

HBM Prenscia: Public
© 2016 HBM
10
• Test coupons are:• Inhomogeneous
• Anisotropic
• Leading to non‐uniform stress distribution spatially and through thickness
• We are not testing a material, but rather a complex structure• Calibration of material models requires a measure of “reverse engineering” based
on detailed FE analysis of coupons• If we are creating SN curves
• What is stress?
Fatigue characterisation challenges
2016 nCode User Group Meeting
© 2016 HBM October 5-6, 2016 www.ncode.com

HBM Prenscia: Public
© 2016 HBM
11
• Nylon (PA66) with 30% glass fibers• Injection molded plaques• Determine microstructure • Specimens cut from plaques
• 0, 45 & 90 degree orientations
• Environmental chamber• Reduce environmental variations
• Room temperature (23 C)
• 50% humidity
• R = ‐1 loading• Reduce viscoelastic behaviour
• Anti‐buckling guides
• Calibrate 3 fatigue damage models• Simple interpolation method
• Digimat high cycle fatigue model
• Elastic strain energy approach
Material characterisation and validation program
2016 nCode User Group Meeting
© 2016 HBM October 5-6, 2016 www.ncode.com

HBM Prenscia: Public
© 2016 HBM
12Experimental Measurement of Microstructure
0%W_40%L_Avg z/h A11 A12 A22 A33 A13 A23
‐0.9231 0.7858 0.0069 0.0618 0.1523 0.005 0.0594 ‐0.7692 0.8993 ‐0.0136 0.0096 0.0911 ‐0.0219 0.0181 ‐0.6154 0.8365 ‐0.0072 0.0289 0.1345 ‐0.015 0.0285 ‐0.4615 0.8083 7.75E‐04 0.0464 0.1453 0.0082 0.0479 ‐0.3077 0.8063 0.0127 0.0216 0.1722 0.0139 0.0362 ‐0.1538 0.7036 0.05 0.0243 0.2721 0.0638 0.045
0 0.2445 ‐0.0054 0.0319 0.7235 ‐0.05 0.0826 0.1538 0.7124 ‐0.0442 0.0216 0.2659 ‐0.114 0.0486 0.3077 0.7953 ‐0.0048 0.0195 0.1853 ‐0.0105 0.0375 0.4615 0.8341 0.0043 0.0184 0.1475 ‐0.0122 0.0327 0.6154 0.8502 0.0063 0.0116 0.1382 ‐0.0123 0.0272 0.7692 0.8542 ‐0.0016 0.025 0.1208 0.0062 0.0285 0.9231 0.7907 0.0292 0.0236 0.1857 0.0157 0.0405
6005004003002001000
50
40
30
20
10
0
Shape 2.108Scale 272.8N 669
length (um)
Freq
uenc
y
Histogram of length (um)Weibull
• Orientation tensors evaluated at 9 points on plaque
• At 13 points through thickness• Averaged over 6 plaques• Fiber length distribution determined
at plaque centroid
2016 nCode User Group Meeting
© 2016 HBM October 5-6, 2016 www.ncode.com

HBM Prenscia: Public
© 2016 HBM
13Simulation Based Prediction of Microstructure
y
z
Courtesy of
2016 nCode User Group Meeting
© 2016 HBM October 5-6, 2016 www.ncode.com

HBM Prenscia: Public
© 2016 HBM
14Specimen preparation
Specimens are:
• Machined from plaques in 3 orientations
• Single specimen per plaque• Gage region at plaque center
2016 nCode User Group Meeting
© 2016 HBM October 5-6, 2016 www.ncode.com

HBM Prenscia: Public
© 2016 HBM
15
• ANSYS Workbench• 40,000 linear hex elements• 13 layers through thickness• Each layer assigned anisotropic properties based on measured microstructure• Enforced displacements at gripped end tabs
Stress analysis results of specimens
2016 nCode User Group Meeting
© 2016 HBM October 5-6, 2016 www.ncode.com

HBM Prenscia: Public
© 2016 HBM
16
0°
Stress analysis results of specimens
45°
90°
2016 nCode User Group Meeting
© 2016 HBM October 5-6, 2016 www.ncode.com

HBM Prenscia: Public
© 2016 HBM
17
• Mean effective modulus from tensile tests compared with FE solution
• Based on:• Load cell and clip gauge
Tensile tests and correlation
Effective Modulus (MPa)
0 Degree 45 degree 90 degree
FE 6448 3188 2702Tensile test (mean) 6391 3230 2559
2016 nCode User Group Meeting
© 2016 HBM October 5-6, 2016 www.ncode.com
HBM Prenscia: Public
© 2016 HBM
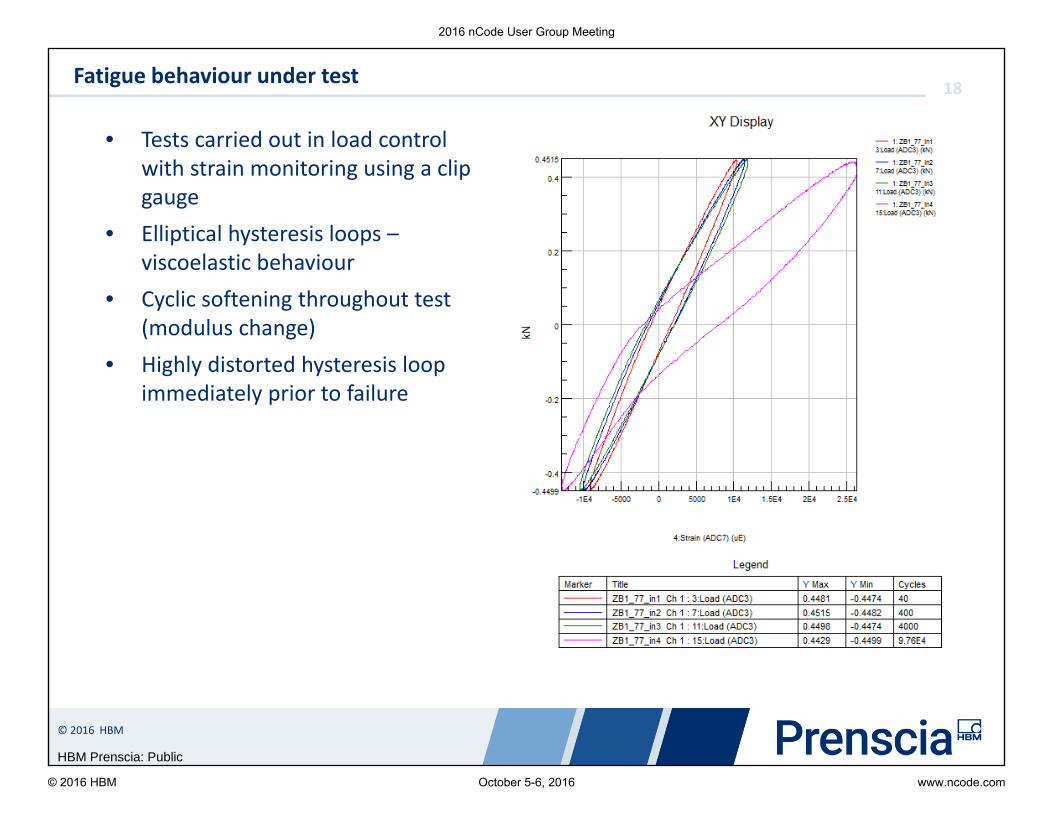
18
• Tests carried out in load control with strain monitoring using a clip gauge
• Elliptical hysteresis loops –viscoelastic behaviour
• Cyclic softening throughout test (modulus change)
• Highly distorted hysteresis loop immediately prior to failure
Fatigue behaviour under test
2016 nCode User Group Meeting
© 2016 HBM October 5-6, 2016 www.ncode.com

HBM Prenscia: Public
© 2016 HBM
19Net section stress SN curves
Net se
ction stress ra
nge
2016 nCode User Group Meeting
© 2016 HBM October 5-6, 2016 www.ncode.com
HBM Prenscia: Public
© 2016 HBM
20
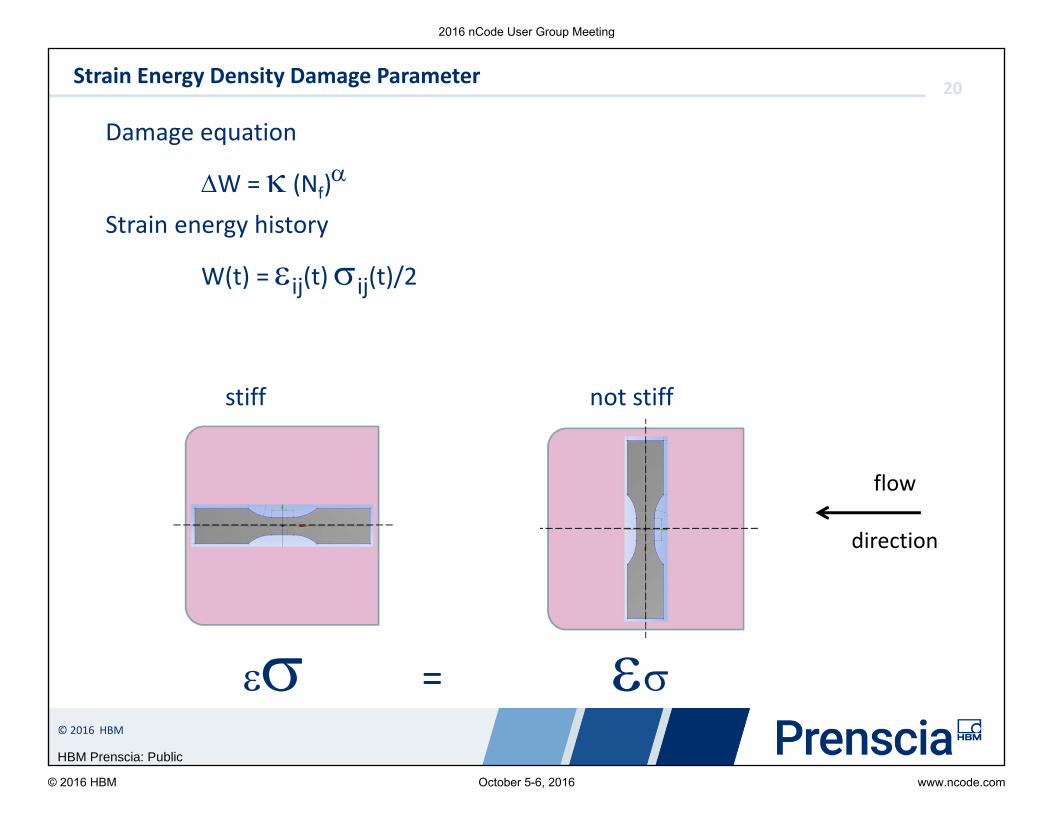
Damage equation
W = (Nf)
Strain energy history
W(t) = ij(t) ij(t)/2
stiff not stiff
=
Strain Energy Density Damage Parameter
flow
direction
2016 nCode User Group Meeting
© 2016 HBM October 5-6, 2016 www.ncode.com

HBM Prenscia: Public
© 2016 HBM
21WN curve based on local stresses and strains
Strain Ene
rgy Den
sity Parameter W
90 degree results conservative wrt W – but based on very thin hot‐spot!
Net section stress‐life curve converted to local strain energy‐life curve based on the FE simulation results for each orientation
2016 nCode User Group Meeting
© 2016 HBM October 5-6, 2016 www.ncode.com

HBM Prenscia: Public
© 2016 HBM
22With simple averaging domain approach
Mod
ified
Strain En
ergy D
ensity Parameter W
Compensation for stress gradient effect by averaging strain energy density over a small volume (several elements)
2016 nCode User Group Meeting
© 2016 HBM October 5-6, 2016 www.ncode.com

HBM Prenscia: Public
© 2016 HBM
23
• “Simple” test coupons are actually complex structures.• A proper understanding of material behaviour involves reverse engineering from
physical tests, based on manufacturing simulations and detailed stress analysis of the coupons
• Strain energy density parameter shows some promise in correlating fatigue behaviour with material in different orientations
• Reduces fatigue testing by a factor of 3
• Currently doing physical testing to develop and validate enhanced SFC methods
Summary
2016 nCode User Group Meeting
© 2016 HBM October 5-6, 2016 www.ncode.com

HBM Prenscia: Public
© 2016 HBM
Continuous Fiber Composite Failure Criteria
24
2016 nCode User Group Meeting
© 2016 HBM October 5-6, 2016 www.ncode.com

HBM Prenscia: Public
© 2016 HBM
25
• Use of composite materials is still expanding• Aerospace and Wind turbines largest users carbon fiber
• 43,500 tons used in 2012
• Aerospace 18%
• Wind turbines 23%
• Automotive use of carbon fiber to be >$6 billion by 2020 overtaking aerospace
• Known technology already used within most FE solvers• Utilises DesignLife's standard features to give the user an distinct advantage over
what they currently have• Combined with measured loads allows all load combinations to be analysed• Current FE implementations require each load combination to be determined and
solved separately
Composite Static Failure Criteria
2016 nCode User Group Meeting
© 2016 HBM October 5-6, 2016 www.ncode.com

HBM Prenscia: Public
© 2016 HBM
26
• Composite laminates fail in a variety of mechanisms (Herakovich, 1998)
• They all generally occur in combination:
• At the micro level, e.g.:• Fiber fracture
• Fiber buckling
• Fiber splitting
• Fiber/matrix debonding
• Fiber pullout
• Matrix cracking
• At the laminate (macro) level:• Fiber‐dominated failure
• Matrix‐dominated failure
• Delamination
• Failure at the micro scale does not necessarily lead to immediate failure of a laminate
• Here we focus on failure at the macro scale
Failure mechanisms
Failure modes in UD composites (Reinforced Plastics, 2003)
2016 nCode User Group Meeting
© 2016 HBM October 5-6, 2016 www.ncode.com
HBM Prenscia: Public
© 2016 HBM
27
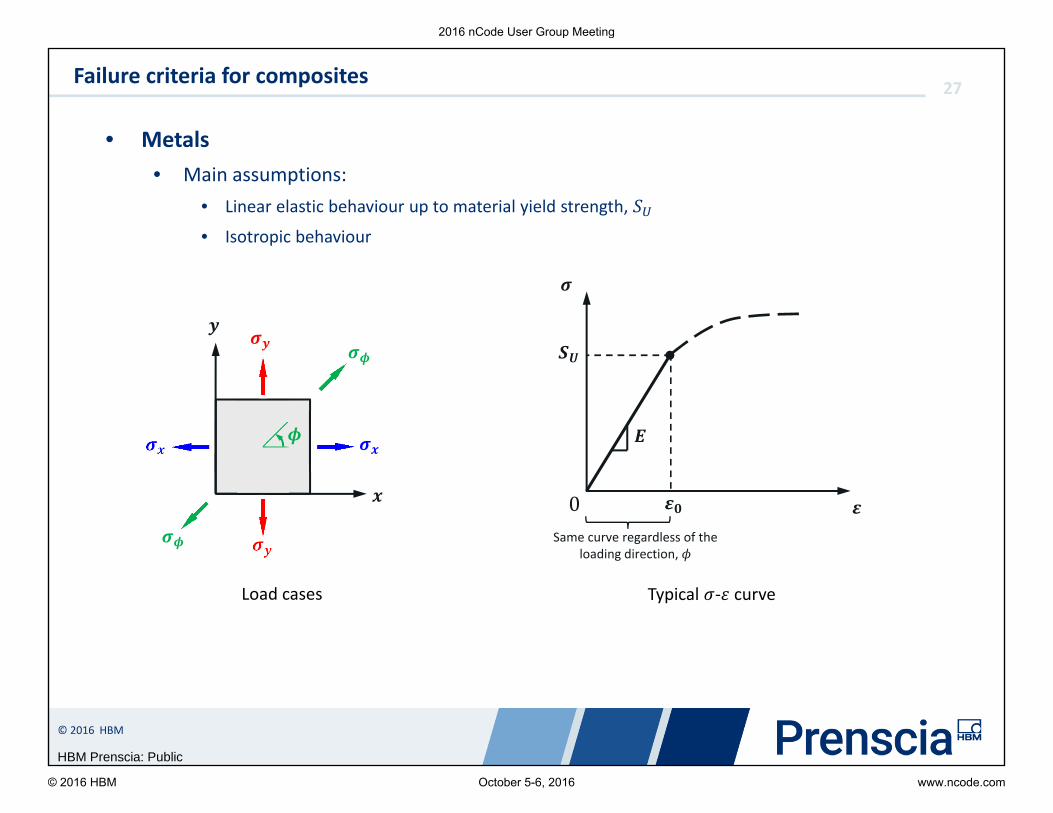
• Metals• Main assumptions:
• Linear elastic behaviour up to material yield strength,
• Isotropic behaviour
Failure criteria for composites
0
Typical ‐ curve
Same curve regardless of the loading direction,
Load cases
2016 nCode User Group Meeting
© 2016 HBM October 5-6, 2016 www.ncode.com

HBM Prenscia: Public
© 2016 HBM
28
• Metals• For multiaxial load cases, a yield criteria is used to characterise the end of linear elastic
behaviour
• Examples of yield criteria (Jones, 1999):• Maximum stress
• Tresca
• Von‐Mises
Failure criteria for composites
2016 nCode User Group Meeting
© 2016 HBM October 5-6, 2016 www.ncode.com

HBM Prenscia: Public
© 2016 HBM
29
• Composites• Main assumptions:
• Brittle material
• Linear elastic behaviour
• Anisotropic behaviour (x‐y coordinate system)
Failure criteria for composites
0
• The x‐y coordinate system is not convenient for defining a composite failure criterion because the x‐ and y‐axes are not aligned with the principal material axes
Typical ‐ curvesLoad cases
2016 nCode User Group Meeting
© 2016 HBM October 5-6, 2016 www.ncode.com

HBM Prenscia: Public
© 2016 HBM
30
• Composites• Main assumptions:
• Brittle material
• Linear elastic behaviour
• Orthotropic behaviour (1‐2 material coordinate system)
Failure criteria for composites
0
Typical ‐ curvesLoad cases
• The 1‐2 coordinate system is convenient for defining a composite failure criterion because the 1‐ and 2‐axes are aligned with the principal material axes
2016 nCode User Group Meeting
© 2016 HBM October 5-6, 2016 www.ncode.com
HBM Prenscia: Public
© 2016 HBM
31
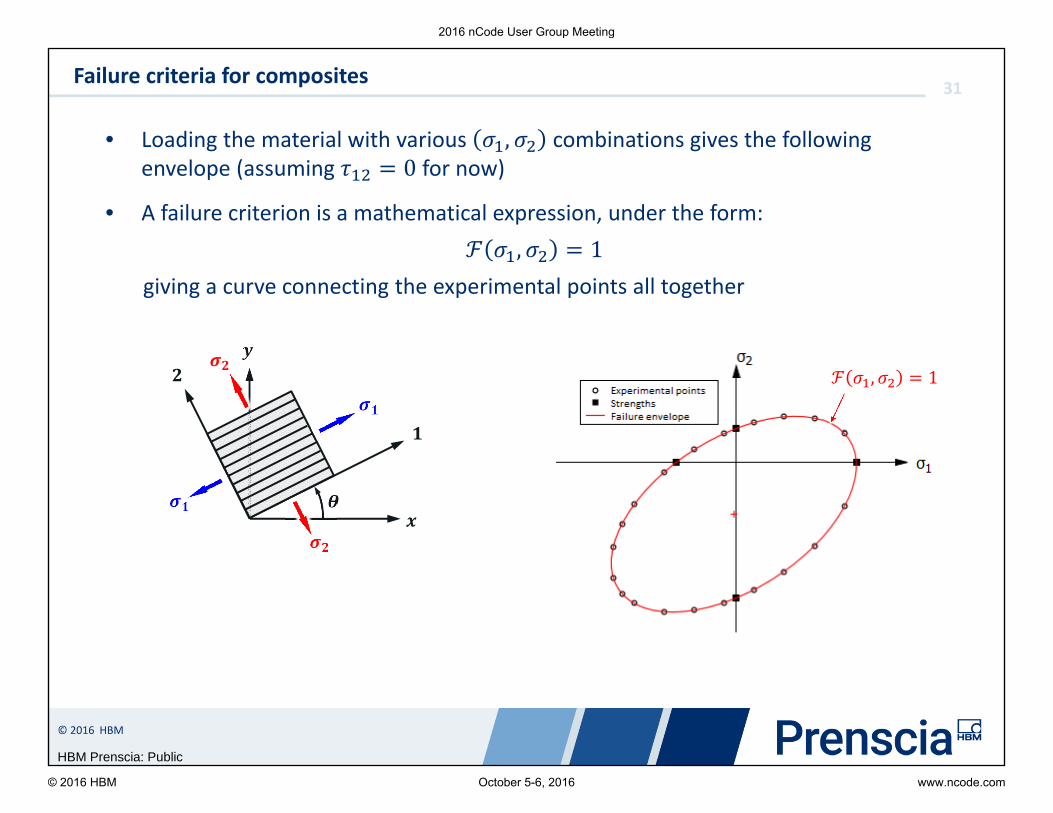
• Loading the material with various , combinations gives the following envelope (assuming 0 for now)
• A failure criterion is a mathematical expression, under the form:, 1
giving a curve connecting the experimental points all together
Failure criteria for composites
, 1
2016 nCode User Group Meeting
© 2016 HBM October 5-6, 2016 www.ncode.com

HBM Prenscia: Public
© 2016 HBM
32
• The previous experimental envelope was utopian
• In reality, there is always a certain amount of scatter in the test results
• Examples of real experimental failure envelopes:
Failure criteria for composites
ATJ‐S graphite(Tang, 1979)
Satin‐weave glass/epoxy(Tang, 1989)
2016 nCode User Group Meeting
© 2016 HBM October 5-6, 2016 www.ncode.com

HBM Prenscia: Public
© 2016 HBM
33
• Influence of on the shape of the failure envelope, , , 1
• The envelopes are plotted when 0‐100% of the material shear strength,
Failure criteria for composites
3D representation( ‐ ‐ space)
2D representation( ‐ space)
2016 nCode User Group Meeting
© 2016 HBM October 5-6, 2016 www.ncode.com

HBM Prenscia: Public
© 2016 HBM
34
• Limit or non‐interactive failure criteria• Maximum stress (12.0)
• Maximum strain (12.0)
• Partially interactive failure criteria• Christensen (12.0)
• Hashin‐Rotem (12.0)
• Hashin (12.0)
• Hashin‐Sun (12.1)
• NU (12.1)
• Fully interactive failure criteria• Franklin‐Marin (12.0)
• Hoffman (12.0)
• Norris (12.0)
• Norris‐McKinnon (12.1)
• Tsai‐Hill (12.0)
• Tsai‐Wu (12.0)
• Custom (Python‐based)
Composite Failure Criteria in nCode DesignLife
111
, 1, 1, , 1
2016 nCode User Group Meeting
© 2016 HBM October 5-6, 2016 www.ncode.com

HBM Prenscia: Public
© 2016 HBM
35
• Failure criteria currently extended to fatigue
• Approaches developed for counting cycles
• Fatigue property characterization studies currently inderway
• Beta versions currently installed at key OEM accounts
Futures
Fatigue failure envelopeStatic failure envelope
2016 nCode User Group Meeting
© 2016 HBM October 5-6, 2016 www.ncode.com

HBM Prenscia: Public
© 2016 HBM
Questions?
36
2016 nCode User Group Meeting
© 2016 HBM October 5-6, 2016 www.ncode.com

HBM Prenscia: Public
© 2016 HBM
www.hbmprenscia.com
Jeff Mentley
Email: [email protected]
Connect with us on:
linkedin.com/company/hbm‐ncode | youtube.com/hbmncode | @hbmncode | +nCode
2016 nCode User Group Meeting
© 2016 HBM October 5-6, 2016 www.ncode.com