using ensemble sensitivity to understand the role of sea ... · 2) modify pbl, if possible (song...
TRANSCRIPT

Using Ensemble Sensitivity to Understand
the Role of Sea Surface Temperatures in
Midlatitude Storm Development in the Gulf
Stream Region
Jimmy Booth, Susan Bates, Jimmy Booth, Susan Bates,
LuAnne Thompson, Kathie Kelly
University of Washington
NASA OVWST Meeting
May 18-20 2009, Boulder, CO

• Comparison of model (WRF) surface winds with
QuikSCAT.
• Show sensitivity of midlatitude storms’ central
pressure and path to variations in sea surface
temperature.
Outline
temperature.
• Explore what physical forcings are responsible for the storm’s sensitivity.�

A brief review of winter conditions in the
Gulf Stream region
Wintertime Mean Sea Surface Temperature (SST) and 10m winds
Standard deviation of the SST in the Gulf Stream Region
•During winter, midlatitude storms frequently develop in, or near, the GS region (~3 per week).

The State of Things RE: Midlatitude Storms and SST
Known:
-Preconditioning due to latent and sensible heat
fluxes are important to storm strength.
-Sensible heat fluxes affect surface baroclinic
zone. (Kuo, Reed, Low-Nam, MWR, 1993)
Unknowns:
-Does the SST pattern impact the individual -Does the SST pattern impact the individual
storms’ paths?
-Is it the presence of warm water or the strong
SST front that matters most?
-Is the water vapor that strengthens the storms
from local (moisture fluxes induced by the storm)
or remote sources?

The Sensitivity Analysis Approach
1. Change the sea surface temperature (SST) field
2. Run the model with the new SST
3. Compare the storm path, intensity and intensification
for the various SST configurations.
NOTES:
• SST is fixed thru-out the forecast.
• Model used:
o NCAR’s Weather Research Forecasting (WRF) Model.
o Horizontal Resolution: 36Km. Vertical: Staggered, 38 levels.
o Lateral and Initial Conditions, including SST: ERA-40 Interim
Reanalysis (6 hourly, 1.25 degree horiz. resolution).

The storms used in the modeling study
Storm Paths shown over SST
F23
CLIMODE
CLIMODESTORM48 hour forecastFeb 22, 2007 0Z-F24 0Z
F23STORM48 hour forecastFeb 23, 2001 0Z -Feb25 0Z
CLIMODE
JB1
Slide 6
JB1 Reasons for choosing these storms:F23: The storm has a meridional path across the Gulf Stream region, with intensification maximum over the SST gradient maximum.
CLIMODE observing ship was at sea during the CLIMODESTORM; it probably contained hurricane force winds.James Booth, 5/13/2009

Damage to the CLIMODE buoy caused by
the storm.
ASIS buoy before storm storm
F23
ASIS after the storm
F23
Photos courtesy Terry Joyce.
In situ air-sea fluxes available from CLIMODE buoy.
Ship anemometer sometimes overtopped by waves.

10M winds: WRF vs. QuikSCAT
F23F23

Wind speed: WRF vs. QuikSCAT
F23F23

The Ensembles and Analysis Technique
Four separate ensembles for each storm:
•Raise/Lower all SSTs
•Strengthen the gradient by:
-change SST on warm side only
-change SST on cold side only
-change SST on warm and cold side, maintaining mean SST.-change SST on warm and cold side, maintaining mean SST.
Analysis
•Track SLPmin position for each member
•Plot tracks for all ensemble members.
•Plot intensity vs. time for all members.
•Calculate regression statistics from ensembles.
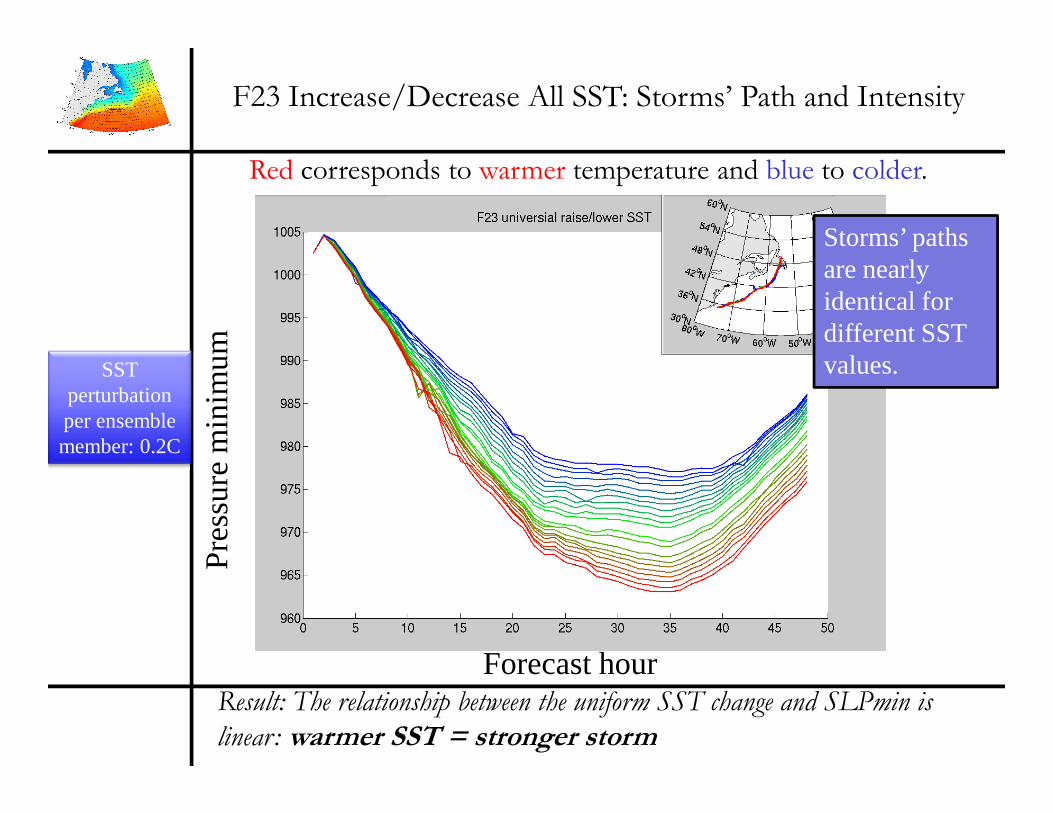
F23 Increase/Decrease All SST: Storms’ Path and Intensity
Red corresponds to warmer temperature and blue to colder.
Pre
ssur
e m
inim
um
SST perturbation
Storms’ paths are nearly identical for different SST values.
Result: The relationship between the uniform SST change and SLPmin is
linear: warmer SST = stronger storm
Forecast hour
Pre
ssur
e m
inim
um
perturbation per ensemble member: 0.2C

F23 SST GRADIENT AMPLIFICATION, but maintain the
meridional mean (for storm local region) temperature
(i.e. warm the warmside and cool the coldside)
Pre
ssur
e m
inim
um
SST perturbation
Blue = weakest gradient amplification.
Storm crosses SST
front at frct hr 16.
Forecast hour
Pre
ssur
e m
inim
um
perturbation per ensemble
member: Warmside:
+.4Coldside: -.4
amplification. Red = strongest gradient amplification
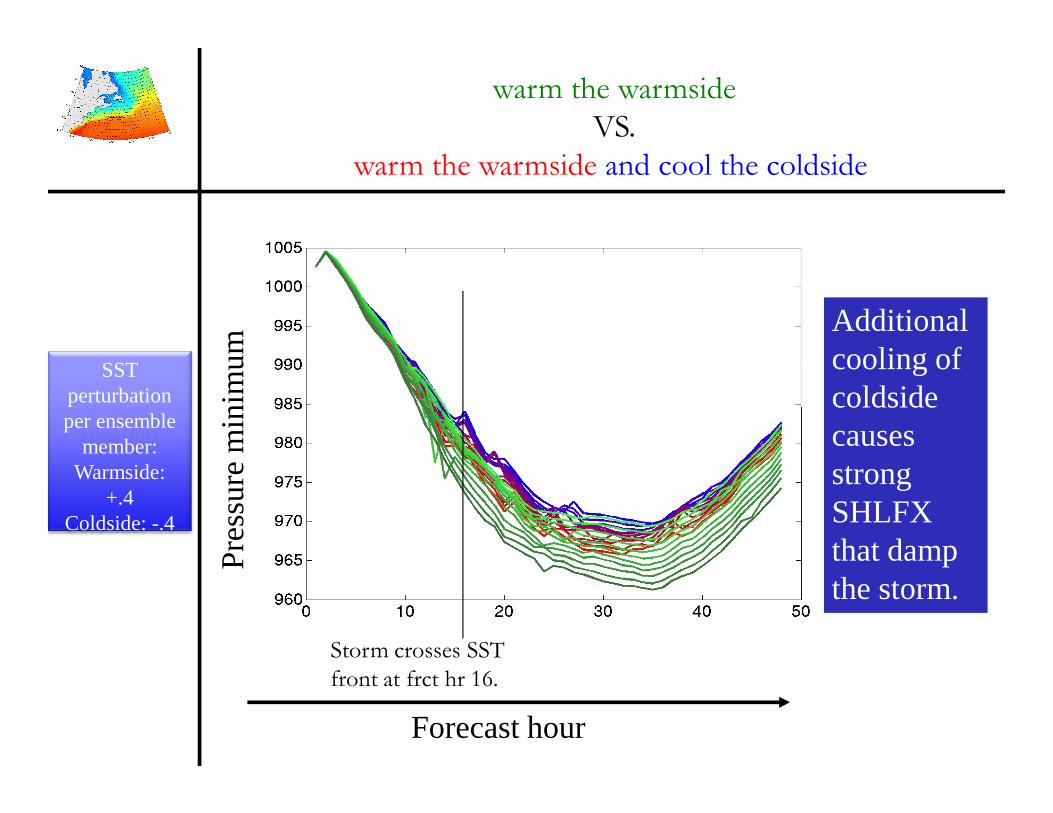
warm the warmside
VS.
warm the warmside and cool the coldside
Pre
ssur
e m
inim
um
SST perturbation
Additional cooling of coldside
Storm crosses SST
front at frct hr 16.
Forecast hour
Pre
ssur
e m
inim
um
perturbation per ensemble
member: Warmside:
+.4Coldside: -.4
coldside causes strong SHLFX that damp the storm.
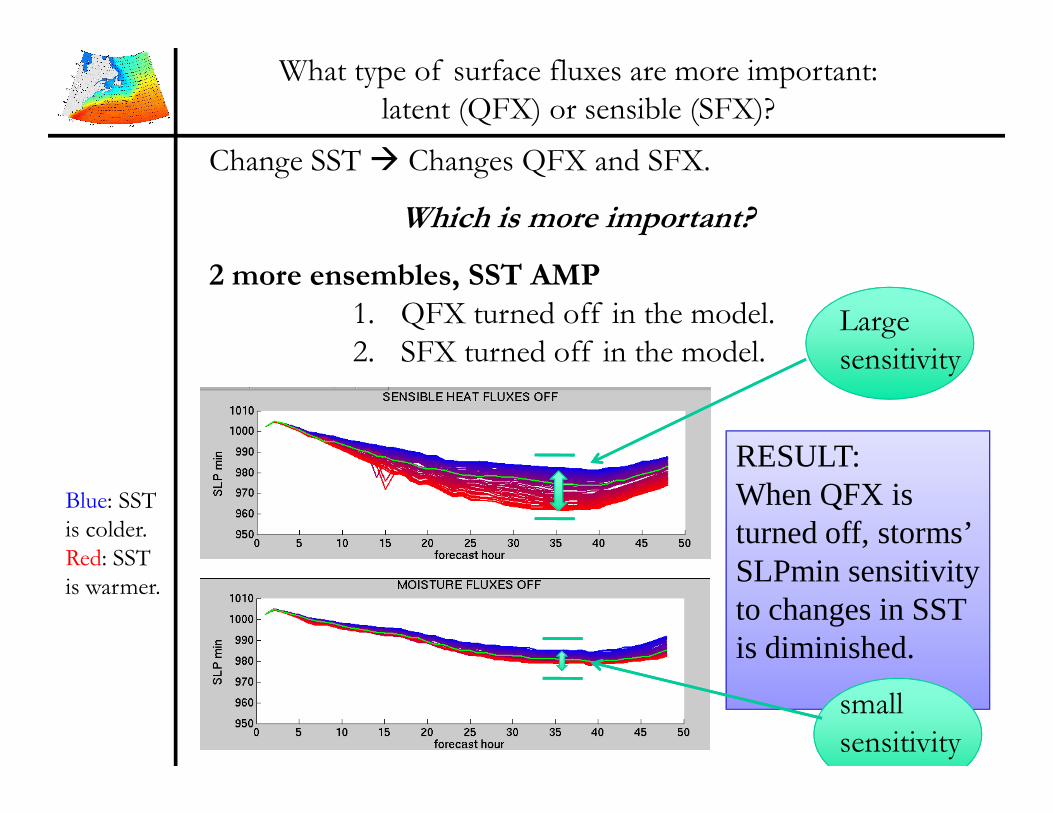
What type of surface fluxes are more important:
latent (QFX) or sensible (SFX)?
Change SST � Changes QFX and SFX.
Which is more important?
2 more ensembles, SST AMP
1. QFX turned off in the model.
2. SFX turned off in the model.Large
sensitivity
Blue: SST
is colder.
Red: SST
is warmer.
RESULT: When QFX is turned off, storms’ SLPmin sensitivity to changes in SST is diminished.
small
sensitivity

Quantifying the Sensitivity
˜ s = sensitivity=SLP'SST '∑
SST '2∑( )= cov(SLP',SST')
σ(SST)
SLP’ : anomaly relative to Ensemble mean.
SST’ : anomaly relative to Ensemble mean.
SST '2∑( ) σ(SST)
˜ s DEFAULT = −7.8
˜ s NO−SHFX = −6.1
˜ s NO−QFX = −2.1
Turning off the moisture flux ���� smaller sensitivity.
Conclusions from
SST vs. SLP and Path.
• The storms are stronger when there is more warm water present.
• The storms are more sensitive to the SST warming in the regions
of their early development.
• For equal warming of the warm side, the storms do not intensify • For equal warming of the warm side, the storms do not intensify
more due to a stronger SST gradient.
• Storm path does not respond to SST amplification, nor SST
gradient amplification.
• The storms intensification is mostly driven by increased diabatic
heating caused by condensation.
• Water vapor added to the atmosphere from storm-local moisture
fluxes does make its way into the storm and aid intensification.

Next:
1) Increase SST gradient to compensate for weak
response to SST
2) Modify PBL, if possible (Song & Chelton)
3) Compare fluxes with CLIMODE mooring
Final comment:These results do not prove that storms will become stronger in These results do not prove that storms will become stronger in
a warmer climate. GCM studies show that there may be
compensating changes to the troposphere that will limit the importance
of any storm intensification related to stronger moisture fluxes
(related to warmer SSTs) from strengthening storms, e.g.
O’Gorman and Schneider, J. Clim, 2008.